Attached files
| file | filename |
|---|---|
| 8-K - FORM 8-K - Apollo Residential Mortgage, Inc. | d624219d8k.htm |
| EX-99.1 - EX-99.1 - Apollo Residential Mortgage, Inc. | d624219dex991.htm |
 November 7, 2013
Supplemental Financial Information Presentation
Q3 2013
Information is as of September 30, 2013 except as otherwise noted.
It should not be assumed that investments made in the future will
be profitable or will equal the performance of investments in this document.
*
*
*
*
*
*
*
*
*
*
*
Exhibit 99.2 |
 2
APOLLO RESIDENTIAL MORTGAGE, INC. (“AMTG”)
Apollo Residential Mortgage, Inc.
2013 Third Quarter Earnings Call
November 7, 2013
Michael A. Commaroto
Chief Executive Officer
Stuart Rothstein
Chief Financial Officer
Keith Rosenbloom
Agency Portfolio Manager
Paul Mangione
Non-Agency Portfolio Manager
Teresa Covello
Controller of the Manager
Hilary Ginsberg
Investor Relations Manager |
 3
APOLLO RESIDENTIAL MORTGAGE, INC. (“AMTG”)
We
make
forward-looking
statements
in
this
presentation
and
other
filings
we
make
with
the
Securities
and
Exchange
Commission
(“SEC”)
within
the
meaning
of
Section
27A
of
the
Securities
Act
of
1933,
as
amended,
and
Section
21E
of
the
Securities
Exchange
Act
of
1934,
as
amended,
and
such
statements
are
intended
to
be
covered
by
the
safe
harbor
provided
by
the
same.
Forward-looking
statements
are
subject
to
substantial
risks
and
uncertainties,
many
of
which
are
difficult
to
predict
and
are
generally
beyond
our
control.
These
forward-looking
statements
include
information
about
possible
or
assumed
future
results
of
our
business,
financial
condition,
liquidity,
results
of
operations,
plans
and
objectives,
including
information
about
our
ability
to
generate
attractive
returns
while
attempting
to
mitigate
risk.
When
used
in
this
release,
the
words
“believe,”
“expect,”
“anticipate,”
“estimate,”
“plan,”
“continue,”
“intend,”
“should,”
“may”
or
similar
expressions,
are intended
to
identify
forward-looking
statements.
Statements
regarding
the
following
subjects,
among
others,
may
be
forward-looking:
the
return
on
equity;
the
yield
on
investments;
the
ability
to
borrow
to
finance
assets;
and
risks
associated
with
investing
in
real
estate
assets,
including
changes
in
business
conditions
and
the
general
economy.
The
forward-looking
statements
are
based
on
our
beliefs,
assumptions
and
expectations
of
our
future
performance,
taking
into
account
all
information
currently
available
to
us.
Forward-looking
statements
are
not
predictions
of
future
events.
These
beliefs,
assumptions
and
expectations
can
change
as
a
result
of
many
possible
events
or
factors,
not
all
of
which
are
known
to
us.
Some
of
these
factors
are
described
in
the
Company’s
Annual
Report
on
Form
10-K
for
the
year
ended
December
31,
2012
and
other
filings
with
the
SEC.
If
a
change
occurs,
our
business,
financial
condition,
liquidity
and
results
of
operations
may
vary
materially
from
those
expressed
in
our
forward-looking
statements.
Any
forward-looking
statement
speaks
only
as
of
the
date
on
which
it
is
made.
New
risks
and
uncertainties
arise
over
time,
and
it
is
not
possible
for
us
to
predict
those
events
or
how
they
may
affect
us.
Except
as
required
by
law,
we
are
not
obligated
to,
and
do
not
intend
to,
update
or
revise
any
forward-looking
statements,
whether
as
a
result
of
new
information,
future
events
or
otherwise.
This presentation may contain statistics and other data that in some
cases has been obtained from or compiled from information made
available by third-party service providers.
Forward Looking Statements |
 4
APOLLO RESIDENTIAL MORTGAGE, INC. (“AMTG”)
Discussion Topics
1. AMTG Q3 Results
2. Supplemental Financials |
 5
APOLLO RESIDENTIAL MORTGAGE, INC. (“AMTG”)
Third Quarter 2013 Summary
Reported
operating
earnings
of
$11.4
million,
or
$0.36
per
common
share
for
the
third
quarter
of
2013
(1)
RMBS portfolio at September 30, 2013 consisted of Agency RMBS with an
estimated fair value of
$2.3 billion and non-Agency RMBS with an estimated fair value of
$1.1 billion RMBS
and
securitized
mortgage
loan
portfolio
had
a
2.6%
effective
net
interest
spread
and
an
14.0%
effective
levered
asset
yield
at
September
30,
2013
(2)
Quarter-end
leverage
multiple
of
3.8x
at
September
30,
2013
Declared
a
$0.40
per
common
share
quarterly
dividend
for
stockholders
of
record
as
of
September
30,
2013
Book
value
per
common
share
of
$18.50
at
September
30,
2013
(1) Operating Earnings and Operating Earnings per common share are
non-GAAP financial measures. Operating Earnings and Operating Earnings per common share presented exclude, as applicable: (i) realized and unrealized gains and
losses recognized through earnings; (ii) non-cash equity
compensation; (iii) one time events pursuant to changes in GAAP; and (iv) certain other non-cash charges. Please see page 18 for a reconciliation of Operating Earnings and
Operating Earnings per common share to GAAP net income/loss allocable to
common stockholders and GAAP net income/loss allocable to common stockholders per common share. Operating Earnings represents the earnings, as
adjusted, allocable to common stock.
(2)
Effective
net
interest
spread
and
effective
levered
asset
yield
are
non-GAAP
financial
measures,
which
include
the
cost
of
the
Company’s
Swaps
as
a
component
of
its
interest
expense.
Please
see
page
19
for
a
reconciliation. |
 6
APOLLO RESIDENTIAL MORTGAGE, INC. (“AMTG”)
Financial Summary
Operating
Earnings
and
Operating
Earnings
per
common
share
are
non-GAAP
financial
measures.
Operating
Earnings
and
Operating
Earnings
per
common
share
presented
exclude,
as
applicable:(i)
realized
and
unrealized
gains
and
losses
recognized
through
earnings;
(ii)
non-cash
equity
compensation;
(iii)
one
time
events
pursuant
to
changes
in
GAAP;
and
(iv)
certain
other
non-cash
charges.
Please
see
pages
18
and
19
for
a
reconciliation
of
Operating
Earnings
and
Operating
Earnings
per
common
share
to
GAAP
net
income/(loss)
allocable
to
common
stockholders
and
GAAP
net
income/(loss)
allocable
to
common
stockholders
per
share
.
Operating
Earnings
represents
the
earnings,
as
adjusted,
allocable
to
common
stock.
Annualized
Return
on
Average
Assets
is
calculated
as
annualized
Operating
Earning
plus
preferred
dividend
requirement
for
the
period,
as
a
percentage
of
average
assets.
Annualized
Return
on
Average
Equity
is
calculated
as
annualized
Operating
Earnings
plus
preferred
dividend
requirement
for
the
period,
as
a
percentage
of
average
equity.
(1)
(2)
(3)
($ amounts in thousands except share and per share data)
September 30,
2013
June 30, 2013
September 30,
2012
September 30,
2013
September 30,
2012
Interest Income
$34,416
$41,329
$26,438
$113,992
$60,791
Interest Expense
(6,789)
(7,237)
(4,289)
(20,243)
(8,521)
Net Interest Income
$27,627
$34,092
$22,149
$93,749
$52,270
Operating Earnings
(1)
$11,386
$18,900
$16,158
$49,377
$38,098
Weighted Average Common Shares Outstanding
31,999,792
31,995,321
24,214,410
29,916,932
18,628,087
Operating Earnings per Common Share
(1)
$0.36
$0.59
$0.67
$1.65
$2.05
Leverage Multiple (Debt / Equity)
3.8x
3.9x
5.4x
3.8x
5.4x
Annualized Return on Average Assets
(2)
1.7%
1.8%
2.1%
1.9%
2.3%
Annualized Return on Average Equity
(3)
7.7%
10.4%
13.0%
10.0%
13.1%
Three Months Ended
Nine Months Ended |
 7
APOLLO RESIDENTIAL MORTGAGE, INC. (“AMTG”)
Financial Summary
(1)
Operating Earnings and Operating Earnings per common share are
non-GAAP financial measures. Operating Earnings and Operating Earnings per common share presented exclude, as applicable: (i) realized and unrealized gains and losses recognized
through earnings; (ii) non-cash equity compensation; (iii) one time
events pursuant to changes in GAAP; and (iv) certain other non-cash charges. Please see page 18 for a reconciliation of Operating Earnings and Operating Earnings per common share to
GAAP net income/(loss) allocable to common stockholders and GAAP
net income/(loss) allocable to common stockholders per common share.
Operating Earnings represents the earnings, as adjusted, allocable to common stock.
(2)
The common stock dividend in the fourth quarter of 2012 consisted of a
$0.70 per common share quarterly dividend and a $0.35 per common
share special dividend. |
 8
APOLLO RESIDENTIAL MORTGAGE, INC. (“AMTG”)
Book Value Roll-Forward
Book Value - June 30, 2013 (Unaudited)
18.63
$
Common stock dividend declared
(0.40)
Operating Earnings net of preferred dividend
0.36
Non-Operating Items Impacting Net Income:
Unrealized gain on Agency RMBS, net
0.84
Unrealized gain on non-Agency RMBS, net
0.04
Unrealized loss on derivatives, net
(0.86)
Realized loss on sales of Agency RMBS
(0.57)
Realized gain on sales of non-Agency RMBS
0.05
Realized gain on Swap/Swaption terminations, net
0.38
Other, net
0.03
Book Value - September 30, 2013 (Unaudited)
18.50
$ |
 9
APOLLO RESIDENTIAL MORTGAGE, INC. (“AMTG”)
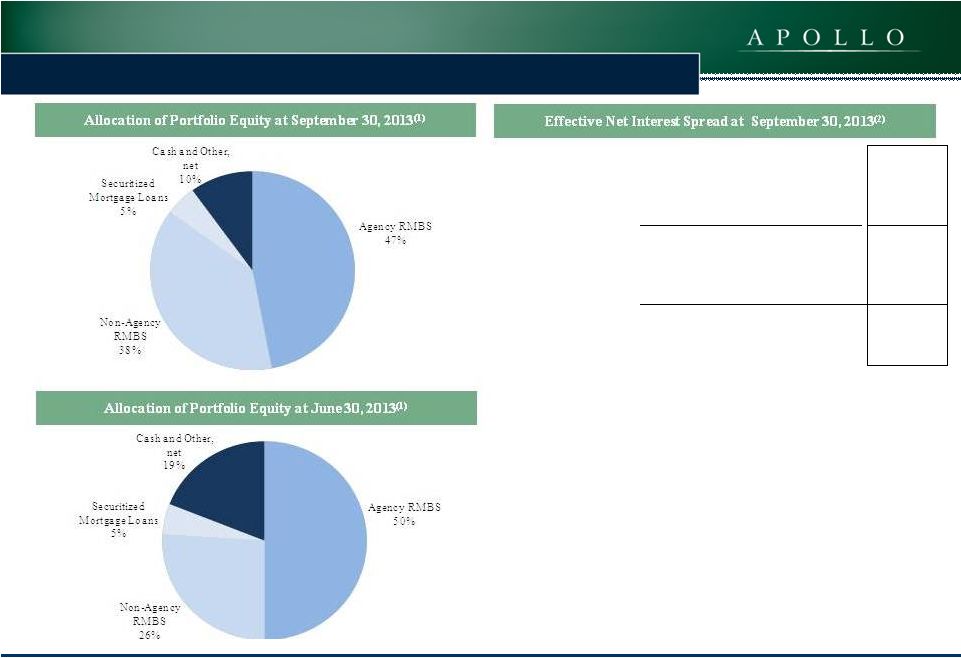
Portfolio Summary and Net Interest Spread
(1)
Percentages reflect amount of equity allocated to Agency and
non-Agency RMBS and securitized mortgage loans, net of associated assets and liabilities, including the fair value of interest rate derivatives. Cash and other net, represents cash and other assets and liabilities not
specifically allocable to Agency RMBS, non-Agency RMBS or
securitized mortgage loans. (2)
Effective net interest spread and effective levered asset yield are
non-GAAP financial measures, which include the cost of the Company’s Swaps as a component of its interest expense. Please see page
19 for a reconciliation.
(3)
Debt/Equity multiples for each asset class are adjusted to reflect cash
held to meet margin calls and certain other assets and liabilities specifically allocable to Agency RMBS, non-Agency RMBS or securitized mortgage loans.
Agency
Non-Agency
Securitized
Mortgage
Loans
Weighted
Average
Including
Cash
Asset Yield
2.9%
6.9%
8.2%
4.3%
Interest Expense
0.4%
2.0%
3.3%
1.0%
Cost of Swaps
1.1%
0.1%
0.0%
0.8%
Net Interest Spread
1.4%
4.8%
4.9%
2.6%
Debt / Equity
(3)
5.5x
3.0x
2.0x
3.8x
Effective Levered Asset Yield
(2)
10.6%
21.3%
17.8%
14.0% |
 10
APOLLO RESIDENTIAL MORTGAGE, INC. (“AMTG”)
Agency Portfolio
Loan Balance 15
Year Pass-Throughs
3%
Loan Balance 30
Year Pass-Throughs
51%
Low Credit 30 Year
Pass-Throughs
9%
Other(1)
3%
New Production 30
Year Pass-Throughs
3%
HARP / MHA /
High LTV 30 Year
Pass-Throughs
31%
(1)
Other includes Short Reset ARMs, Interest Only and Inverse Interest Only
Securities. 6.0%
3.7%
5.2%
5.8%
7.0%
7.1%
6.7%
0.0%
1.0%
2.0%
3.0%
4.0%
5.0%
6.0%
7.0%
8.0%
Q1 2012
Q2 2012
Q3 2012
Q4 2012
Q1 2013
Q2 2013
Q3 2013
Total Agency Portfolio average one month CPR
($ in thousands)
Estimated Fair Value
Q3 2013 CPR
Agency Pass-Throughs
2,191,883
$
6.3
%
Agency IOs and Agency IIOs
68,639
18.2
Total
2,260,522
$
6.7
% |
 11
APOLLO RESIDENTIAL MORTGAGE, INC. (“AMTG”)
Agency Securities as of September 30, 2013
(1)
Amortized cost is reduced by unrealized losses that are classified as
other-than-temporary impairments. The Company recognized other-than-temporary impairments of $2,051 on Agency RMBS for the three months
ended September 30, 2013.
(2)
Weighted average yield at the date presented incorporates estimates for
future prepayment assumptions on Agency RMBS. (3)
Agency IOs and Agency IIOs have no principal balance and bear interest
on a notional balance. The notional balance is used solely to determine interest distributions on interest-only class of securities. At
September
30, 2013 Agency IOs had a notional balance of $429,204 and Agency
Inverse IOs had a notional balance of $155,676. ($ in
thousands) Principal Balance
Unamortized
Premium
(Discount)
Amortized Cost
(1)
Estimated Fair
Value
Net Weighted
Average
Coupon
Weighted
Average
Yield
(2)
Agency RMBS:
30-Year Mortgages
ARM
12,337
$
827
$
13,164
$
13,089
$
4.09
%
1.77
%
Fixed rate coupons:
3.5%
468,755
30,771
499,526
477,308
3.50
2.49
4.0%
1,514,596
131,741
1,646,337
1,587,384
4.00
2.51
4.5% & 5.0%
54,328
4,401
58,729
58,624
4.59
3.12
2,050,016
167,740
2,217,756
2,136,405
3.90
%
2.52
%
15-Year Mortgages
3.0% Coupons
53,640
1,428
55,068
55,478
3.00
%
2.45
%
Agency IOs
(3)
-
-
42,962
43,272
3.93
%
13.66
%
Agency IIOs
(3)
-
-
28,403
25,367
6.37
%
16.06
%
Total Agency RMBS
2,103,656
$
169,168
$
2,344,189
$
2,260,522
$
4.05
%
2.88
% |
 12
APOLLO RESIDENTIAL MORTGAGE, INC. (“AMTG”)
Non-Agency RMBS portfolio continues to focus on
seasoned, sub-prime assets with significant credit
enhancement as well as Alt-A and pay-option
adjustable rate mortgages.
Non-Agency RMBS Portfolio
The non-Agency RMBS portfolio continues to focus
on pre-2007 vintage.
Subprime
83%
Alt-A
7%
Pay-option
ARM
10%
1999-2002
4%
2003
7%
2004
32%
2005
28%
2006
19%
2007
10% |
 13
APOLLO RESIDENTIAL MORTGAGE, INC. (“AMTG”)
Non-Agency RMBS as of September 30, 2013
(1) Credit enhancement is expressed as a percentage of all
outstanding mortgage loan collateral. The Company's non-Agency RMBS may incur losses if credit enhancement is reduced to
zero.
(2) CRR stands for conditional repayment rate. Information
is based on loans for individual groups owned by the Company. Amounts presented reflect the weighted average monthly performance for the three months ended September 30, 2013.
September 30, 2013
Portfolio Characteristics
Estimated Fair Value ($ in thousands)
$1,117,820
Amortized Cost to Par Value
77.8%
Net Weighted Average Coupon
1.2%
Collateral Attributes
Weighted Average Loan Age (months)
103
Weighted Average Original Loan-to-Value
79.9%
Weighted Average Original FICO Credit Score
633
Current Performance
60+ Day Delinquencies
31.0%
Average Credit Enhancement
(1)
33.7%
3 Month CRR
(2)
5.0% |
 14
APOLLO RESIDENTIAL MORTGAGE, INC. (“AMTG”)
Financing and Derivative Instruments Overview
($ in thousands)
Notional Amount
Estimated
Fair
Value
Swaps - assets
1,187,000
$
38,907
$
Swaptions - assets
1,175,000
13,757
Swaps -
(liabilities) 680,000
(6,172)
Total Derivative
Instruments 3,042,000
$
46,492
$
(1)
Includes $27,014 of repurchase borrowings collateralized by
non-Agency RMBS acquired in connection with the Company’s securitization transaction from a consolidated variable interest entity at September 30, 2013 that is
eliminated from the Company’s consolidated balance sheet.
(2)
Securitized debt, which represents non-recourse senior securities
sold to third parties in connection with a securitization transaction, has a final contractual maturity of May 2047. Weighted average remaining maturity
represents
the
estimated
final
maturity
of
the
security
based
on
the
final
projected
repayment
of
principal.
The
actual
maturity
of
the
securitized
debt
may
differ
significantly
from
this
estimate
given
that
actual
interest
collections, mortgage prepayments and/or losses on liquidation of
mortgages may differ significantly from those expected. ($ in
thousands) Balance
Weighted
Average
Borrowing Rate
Weighted
Average
Remaining
Maturity
Repurchase agreement borrowings:
Agency RMBS
1,989,518
$
0.41%
40 days
Non-Agency RMBS
(1)
884,362
2.00%
124 days
Other investment securities
7,800
1.76%
25 days
Total repurchase agreements
2,881,680
$
0.90%
66 days
Securitized debt
45,590
$
4.00%
58 months
(2)
Total Borrowings
2,927,270
$
0.95%
-
Term to Maturity ($ in thousands)
Notional
Amount
Average Fixed
Pay Rate
Average
Maturity
(Years)
Greater than 1 year to 3 years
45,000
$
1.30%
2.9
Greater than 3 years to 5 years
1,114,000
1.05%
3.8
Greater than 5 years
708,000
2.01%
9.0
Total
1,867,000
$
1.42%
5.8
($ in thousands)
Weighted Average
Months Until
Fixed Pay Rate for
Option
Notional
Swap Terms
Underlying Swap
Fair Value
Expiration
Amount
(Years)
3.00 - 3.25%
2,236
$
9
100,000
$
10
3.26 - 3.50%
6,065
7
475,000
10
3.51 - 3.75%
3,277
7
375,000
10
3.76 - 4.00%
1,495
11
125,000
10
4.01 - 4.41%
684
11
100,000
10
13,757
$
8
1,175,000
$
10
Option
Underlying Swap |
 15
APOLLO RESIDENTIAL MORTGAGE, INC. (“AMTG”)
Discussion Topics
1. AMTG Q3 Results
2. Supplemental Financials |
 16
APOLLO RESIDENTIAL MORTGAGE, INC. (“AMTG”)
Income Statement
(in thousands—except per share data)
2013
2012
2013
2012
Interest Income:
RMBS
32,013
$
26,438
$
107,959
$
60,791
$
Securitized mortgage loans
2,324
-
5,954
-
$
Other
investment securities 79
-
79
-
Total Interest Income
34,416
26,438
113,992
60,791
Interest Expense:
Repurchase agreements
(6,299)
(4,289)
(18,935)
(8,521)
Securitized debt
(490)
-
(1,308)
-
Total Interest Expense
(6,789)
(4,289)
(20,243)
(8,521)
Net Interest Income
27,627
$
22,149
$
93,749
$
52,270
$
Other Income/(Loss):
Realized gain/(loss) on sale of RMBS, net
(16,596)
$
13,861
$
(48,309)
$
32,244
$
Unrealized gain/(loss) on RMBS,
net 28,143
54,913
(139,727)
75,461
Unrealized gain/(loss) on
securitized mortgage loans 537
-
(88)
-
Unrealized (loss) on securitized debt
(428)
-
(413)
-
Unrealized gain on other investment securities
116
-
116
-
Gain/(loss) on derivative instruments, net (includes ($27,572),
($9,831), $50,547 and ($24,192) of unrealized gains/(losses),
respectively)
(21,687)
(16,653)
55,884
(33,486)
Other, net
4
16
72
25
Other Income/(Loss), net
(9,911)
$
52,137
$
(132,465)
74,244
$
Operating Expenses:
General and administrative (includes $207, $105, $752 and $274 of
non-cash stock based compensation, respectively)
(3,089)
$
(1,858)
$
(8,374)
(5,211)
$
Management fees - related
party (2,941)
(2,031)
(8,651)
(4,386)
Total Operating
Expenses (6,030)
$
(3,889)
$
(17,025)
(9,597)
$
Net Income/(Loss)
11,686
$
70,397
$
(55,741)
116,917
$
Preferred Stock Dividends Declared
(3,450)
-
(10,350)
-
Net
Income/(Loss) Allocable to Common Stock and Participating
Securities 8,236
$
70,397
$
(66,091)
$
116,917
$
Earnings/(Loss) per Common Share - Basic and Diluted
0.25
$
2.91
$
(2.22)
$
6.28
$
Dividends Declared per Share of
Common Stock 0.40
$
0.85
$
1.80
$
2.35
$
(Unaudited)
(Unaudited)
Three months ended
September 30,
Nine months ended
September 30, |
  17
APOLLO RESIDENTIAL MORTGAGE, INC. (“AMTG”)
Balance Sheet
(in thousands—except share and per share data)
September 30, 2013
December 31, 2012
Assets:
(Unaudited)
Cash
142,242
$
149,576
$
Restricted cash
60,996
93,641
RMBS, at
fair value (of which $3,185,374 and $3,940,913 were pledged as collateral, respectively)
3,378,342
4,231,291
Securitized mortgage loans
(transferred to a consolidated VIE ), at fair value
109,586
-
Other investment securities, at fair value (of which $11,712 and $0
were pledged as collateral, respectively) 11,712
Investment
related receivables 3,684
-
Interest receivable
10,048
11,341
Deferred
financing costs, net 914
346
Derivative instruments, at fair value
52,664
750
Other assets
956
976
Total Assets
3,771,144
$
4,487,921
$
Liabilities and Stockholders' Equity
Liabilities:
Borrowings under repurchase agreements
2,881,680
$
3,654,436
$
Non-recourse securitized debt, at fair
value 46,003
-
Investment related payables
91
50,032
Obligation to return cash held as collateral
42,381
-
Accrued interest payable
7,155
6,774
Derivative instruments, at fair value
6,172
23,184
Payable
to related party 3,770
4,295
Dividends payable
16,714
30,675
Accounts
payable and accrued expenses 2,135
1,742
Total Liabilities
3,006,101
$
3,771,138
$
Stockholders' Equity:
Preferred stock, $0.01 par value, 50,000,000 shares authorized,
6,900,000 shares issued and outstanding ($172,500 aggregate
liquidation preference) 69
$
69
$
Common stock, $0.01 par value, 450,000,000 shares authorized,
32,037,408 and 24,205,972 shares issued and outstanding
respectively 320
242
Additional paid-in-capital
791,619
619,399
Retained
earnings/(accumulated deficit) (26,965)
97,073
Total
Stockholders' Equity 765,043
$
716,783
$
Total Liabilities and
Stockholders' Equity 3,771,144
$
4,487,921
$
|
 18
APOLLO RESIDENTIAL MORTGAGE, INC. (“AMTG”)
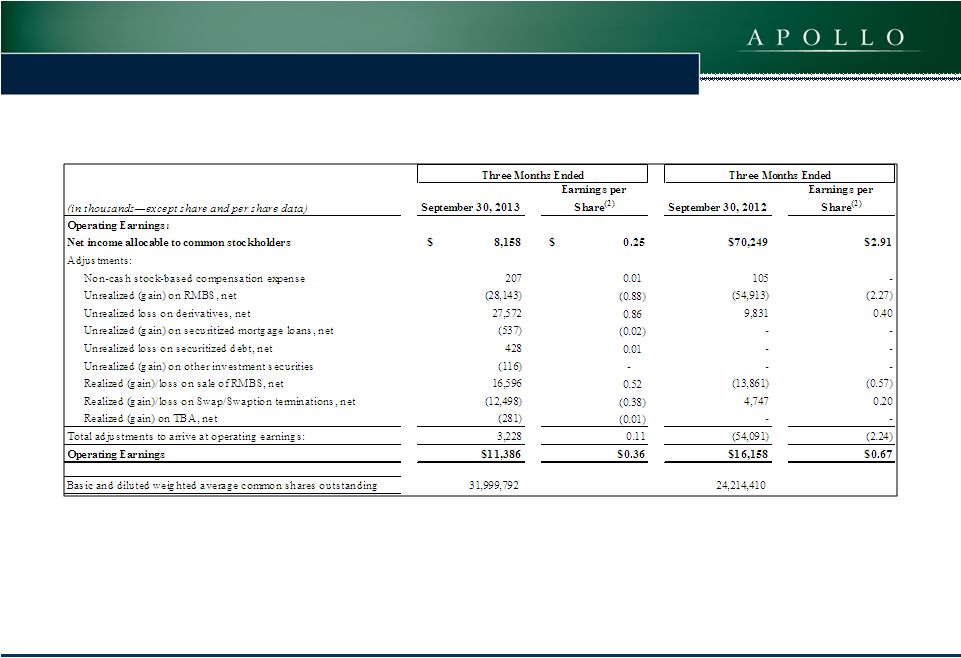
Operating Earnings
(1)
Reconciliation
(1)
Operating Earnings and Operating Earnings per common share are
non-GAAP financial measures. Operating Earnings and Operating Earnings per common share presented exclude, as applicable: (i) realized and
unrealized gains and losses recognized through earnings; (ii)
non-cash equity compensation; (iii) one time events pursuant to changes in GAAP; and (iv) certain other non-cash charges. Operating Earnings represents
the earnings, as adjusted, allocable to common stock.
(2)
Reflects
basic
and
diluted
earnings
per
share
for
each
component
presented. |
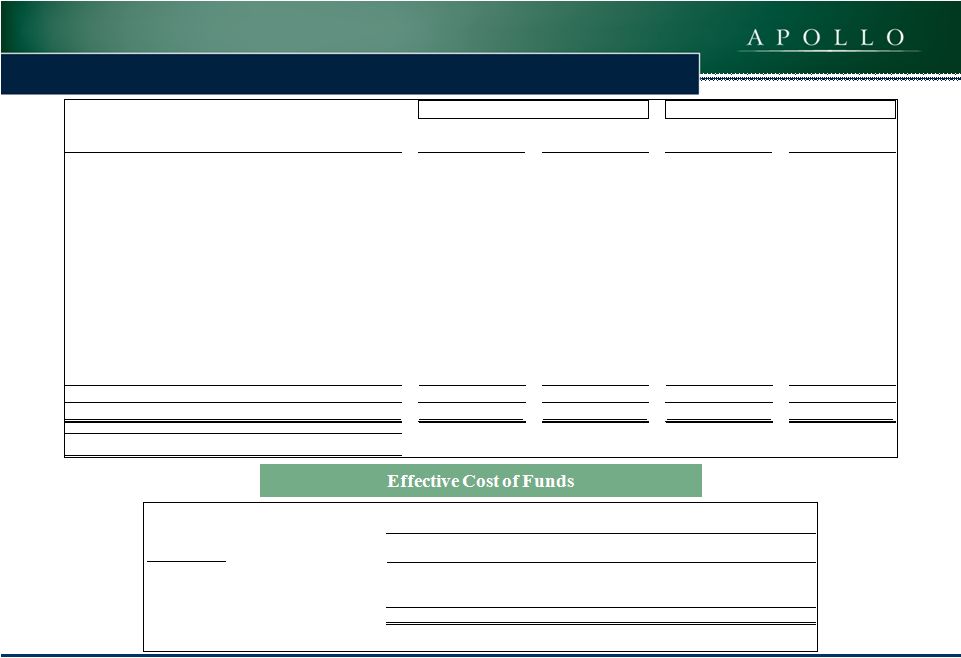 19
APOLLO RESIDENTIAL MORTGAGE, INC. (“AMTG”)
Operating Earnings
(1)
Reconciliation (cont.) and Effective Cost of Funds
(1)
Operating Earnings and Operating Earnings per common share are
non-GAAP financial measures. Operating Earnings and Operating Earnings per common share presented exclude, as applicable: (i) realized and
unrealized gains and losses recognized through earnings; (ii)
non-cash equity compensation; (iii) one time events pursuant to changes in GAAP; and (iv) certain other non-cash charges. Operating Earnings represents the
earnings, as adjusted, allocable to common stock.
(2)
Reflects
basic
and
diluted
earnings
per
share
for
each
component
presented.
($ in thousands)
Reconciliation
Cost of Funds/Effective
Borrowing Costs
Reconciliation
Cost of Funds/Effective
Borrowing Costs
Interest expense
6,789
$
0.89%
20,243
$
0.74%
Adjustment:
Net-interest paid for Swaps
6,894
0.91%
17,470
0.63%
Effective interest expense/effective cost of funds
13,683
$
1.80%
37,713
$
1.37%
Weighted average balance of borrowings
3,013,372
$
3,671,026
$
September 30, 2013
Three Months Ended
Nine Months Ended
September 30, 2013
(in thousands—except share and per share data)
September 30, 2013
Earnings per
Share
(2)
September 30, 2012
Earnings per
Share
(2)
Operating Earnings:
Net income/(loss) allocable to common stockholders
$ (66,442)
$ (2.22)
$116,628
$6.28
Adjustments:
Non-cash stock-based compensation expense
752
0.03
274
0.01
Unrealized (gain)/loss on RMBS, net
139,727
4.67
(75,461)
(4.06)
Unrealized (gain)/loss on derivatives, net
(50,547)
(1.69)
24,192
1.30
Unrealized loss on securitized mortgage loans, net
88
-
-
-
Unrealized loss on securitized debt, net
413
0.01
-
-
Unrealized (gain) on other investment securities
(116)
-
-
-
Realized (gain)/loss on sale of RMBS, net
48,309
1.61
(32,244)
(1.73)
Realized (gain)/loss on Swap/Swaption terminations, net
(22,526)
(0.75)
4,709
0.25
Realized gain on TBA, net
(281)
(0.01)
-
-
Total adjustments to arrive at operating earnings:
115,819
3.87
(78,530)
(4.23)
Operating Earnings
$49,377
$1.65
$38,098
$2.05
Basic and diluted weighted average common shares outstanding
29,916,932
18,628,087 Nine Months
Ended Nine Months Ended |
 20
APOLLO RESIDENTIAL MORTGAGE, INC. (“AMTG”)
Contact Information
Hilary Ginsberg
Investor Relations Manager
212-822-0767 |