Attached files
| file | filename |
|---|---|
| 8-K - FORM 8-K - SPARTON CORP | d623578d8k.htm |
| EX-99.1 - EX-99.1 - SPARTON CORP | d623578dex991.htm |
 First Quarter Financial
Results Conference Call
November 6, 2013
Exhibit 99.2 |
 Safe
Harbor Statement Safe Harbor Statement
2
Certain statements herein constitute forward-looking statements within the meaning of the
Securities Act of 1933, as amended and the Securities Exchange Act of 1934, as amended.
When used herein, words such as “believe,” “expect,”
“anticipate,” “project,” “plan,” “estimate,” “will” or “intend” and similar words or expressions as they relate
to the Company or its management constitute forward-looking statements. These forward-looking
statements reflect our current views with respect to future events and are based on currently
available financial, economic and competitive data and our current business plans. The Company
is under no obligation to, and expressly disclaims any obligation to, update or alter its
forward-looking statements whether as a result of such changes, new information, subsequent
events or otherwise. Actual results could vary materially depending on risks and uncertainties
that may affect our operations, markets, prices and other factors. Important factors that could cause
actual results to differ materially from those forward-looking statements include those contained
under the heading of risk factors and in the management’s discussion and analysis
contained from time-to-time in the Company’s filings with the Securities and
Exchange Commission. Adjusted EBITDA and related reconciliation presented here represents
earnings before interest, taxes, depreciation and amortization as adjusted for
restructuring/impairment charges, gross profit effects of capitalized profit in inventory from
acquisition and acquisition contingency settlement, and gain on sale of investment. The Company
believes Adjusted EBITDA is commonly used by financial analysts and others in the industries in which
the Company operates and, thus, provides useful information to investors. The Company does not intend,
nor should the reader consider, Adjusted EBITDA an alternative to net income, net cash provided
by operating activities or any other items calculated in accordance with GAAP. The Company's
definition of Adjusted EBITDA may not be comparable with Adjusted EBITDA as defined by other
companies. Accordingly, the measurement has limitations depending on its use.
|
 3
•
1 Quarter Highlights
•
1 Quarter Segmented Operating Results
•
Liquidity & Capital Resources
•
Revenue Recognition
•
Fiscal 2014 Outlook
•
Q & A
Today’s Agenda
st
st |
 4
•
Sales in each of our business segments increased not only from
acquisitions, but also on an organic basis
•
Awarded 28 new business programs during the first quarter of fiscal
2014 with potential annualized sales of $8.2 million as well as a foreign
sonobuoy award of $5.0 million
•
Completed the acquisition of certain assets of Aydin Displays, LLC.
•
Quarter end sales backlog of approximately $205.7 million, up 32% from
a year ago
–
Excluding the newly acquired businesses, backlog was approximately $166.4 million
representing a 7% increase over the prior year quarter.
1
Quarter
Highlights
st |
 5
Consolidated
Financial
Results
Fiscal 2014
1 Quarter
(Adjusted)
2013
2012
2013
2012
Net Sales
$ 74,198
$ 50,801
$ 74,198
$ 50,801
$ 23,397
Gross Profit
12,194
8,000
12,194
8,000
4,194
16.4%
15.7%
16.4%
15.7%
Selling and Administrative Expense
7,645
5,472
7,645
5,472
(2,173)
10.3%
10.8%
10.3%
10.8%
Internal R&D Expense
389
305
389
305
(84)
Amortization of intangible assets
598
102
598
102
(496)
Restructuring/impairment charges
188
-
-
-
-
Other operating expense, net
(3)
(10)
(3)
(10)
(7)
Operating Income
3,377
2,131
3,565
2,131
1,434
4.6%
4.2%
4.8%
4.2%
Income Before Provision For Income Tax
3,393
2,188
3,581
2,188
1,393
Provision For Income Taxes
1,107
731
1,169
731
(438)
Net Income
$ 2,286
$ 1,457
$ 2,412
$ 1,457
$ 955
3.1%
2.9%
3.3%
2.9%
Income per Share (Basic)
$ 0.23
$ 0.14
$ 0.24
$ 0.14
$ 0.10
Income per Share (Diluted)
$ 0.23
$ 0.14
$ 0.24
$ 0.14
$ 0.10
($ in 000’s, except per share)
(adjusted removes certain gains and charges)
(Reported)
(Adjusted)
Quarter ended Sept 30,
Quarter ended Sept 30,
Total YoY
Variance
st |
 6
Consolidated Financial Results
Adjusted EBITDA
2013
2012
Net Income
$ 2,286
$ 1,457
$ 829
Interest expense
158
81
77
Interest income
(2)
(28)
26
Provision for income taxes
1,107
731
376
Depreciation and amortization
1,721
479
1,242
Restructuring/impairment charges
188
-
188
Adjusted EBITDA
$ 5,458
$ 2,720
$ 2,738
7.4%
5.4%
Quarter ended Sept 30,
YoY
Variance |
 Operating Results
Revenue & Gross Profit
Revenue & Gross Profit
7
SEGMENT
2013
% of Total
2012
% Change
Medical
$ 42,008
57%
$ 28,059
50%
Complex Systems
18,265
25%
12,347
48%
DSS
17,893
24%
14,987
19%
Inter-company
(3,968)
-5%
(4,592)
-14%
Totals
$ 74,198
100%
$ 50,801
46%
SEGMENT
2013
GP %
2012
GP %
Medical
$ 6,978
16.6%
$ 4,194
14.9%
Complex Systems
1,868
10.2%
1,096
8.9%
DSS
3,348
18.7%
2,710
18.1%
Totals
$ 12,194
16.4%
$ 8,000
15.7%
($ in 000’s)
3 months ended Sept 30,
3 months ended Sept 30,
REVENUE
GROSS PROFIT |
 8
Liquidity & Capital Resources
50,000
25,000
0
Jun-10
Jun-11
Jun-12
Jun-13
Sep-13
1,917
1,796
1,669
11,539
30,006
0.31
0.35
0.30
0.25
0.20
0.15
0.10
0.05
-
($ in '000)
Sep-12
Dec-12
Mar-13
Jun-13
Sep-13
Cash and equivalents
43,096
6,066
4,358
6,085
2,719
LOC Availability
16,012
51,000
52,000
55,000
36,000
Total
59,108
57,066
56,358
61,085
38,719
($ in '000)
Sep-12
Dec-12
Mar-13
Jun-13
Sep-13
Credit Revolver
-
14,000
13,000
10,000
28,500
IRB (Ohio)
1,637
1,604
1,572
1,539
1,506
Total
1,637
15,604
14,572
11,539
30,006
($ in '000)
Sep-12
Dec-12
Mar-13
Jun-13
Sep-13
Net Inventory
38,467
45,367
46,928
46,334
55,658
Cash Availability
Debt
Inventory |
 9
•
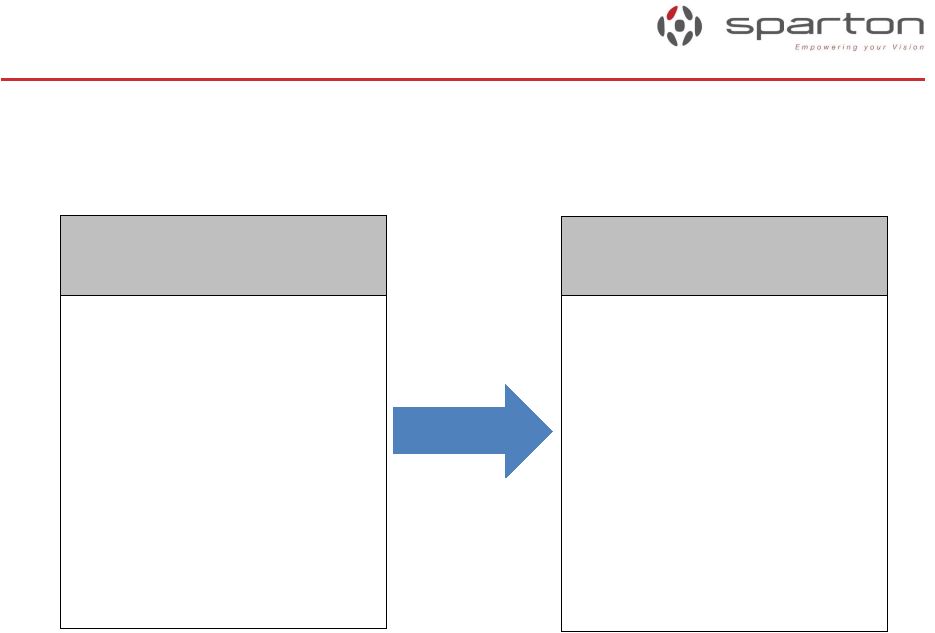
The new policy continues to recognize revenue under the percentage of
completion method
Revenue Recognition
Revenue was recognized for
each lot of sonobuoys
produced when that lot was
formally accepted by the
customer
Revenue is recognized
when production and
internal testing of each lot of
sonobuoys is completed
From Completed Units
Accepted Basis
To Units-of-Production
Basis |
 10
Revenue Recognition
FY13 Q1 Reconciliation Table
Consolidated Statement of Income Data:
Net Sales
$
49,020
$
1,781
$
50,801
Cost of goods sold
Gross profit
Income before provision for income taxes
Provision for income taxes
Net income
Income per share of common stock - Basic
Income per share of common stock - Diluted
Weighted average shares outstanding - Basic
Weighted average shares outstanding - Diluted
10,163,151
10,163,151
0.09
0.05
0.14
10,141,612
10,141,612
953
504
1,457
0.09
0.05
0.14
1,401
787
2,188
448
283
731
41,807
994
42,801
7,213
787
8,000
For the Three Months Ended September 30, 2012
As Originally Reported
Adjustment
As Restated
(Dollars in thousands, except share amounts) |
 Fiscal
2014 Outlook Fiscal 2014 Outlook
11
Implementation of the strategic growth plan
Focus on sustained profitability
Complete the integration of Aydin Displays
–
Continue to grow organically
–
Maintain our level of investment in internal research & development to
commercially extend our product lines
–
Continue to enable our engineering workforce to develop new and innovative
proprietary solutions for our end markets
–
Continue to seek out complementary and compatible acquisitions
–
Further leverage Viet Nam as a low cost country alternative and in-region
provider –
Continue margin improvements across the entire company
–
Increase capacity utilization
–
Continue additional improvements in operating performance through lean and quality
efforts
•
•
• |
 12
Q & A |