Attached files
| file | filename |
|---|---|
| 8-K - 8-K - HERC HOLDINGS INC | a13-23665_18k.htm |
Exhibit 99.1
|
|
3Q 2013 Earnings Call November 5th, 2013 10:00 am ET Dial in: (800) 288-8975 U.S. (612) 332-0335 International Passcode: 305114 Replay available until November 18: (800) 475-6701 U.S. (320) 365-3844 International passcode: 305114 |

|
|
Safe Harbor Statement Certain statements made within this presentation contain forward-looking statements, within the meaning of the Private Securities Litigation Reform Act of 1995. Forward-looking statements are not guarantees of performance and by their nature are subject to inherent uncertainties. Actual results may differ materially. Any forward-looking information relayed in this presentation speaks only as of November 5, 2013, and the Company undertakes no obligation to update that information to reflect changed circumstances. Additional information concerning these statements is contained in the Company’s press release regarding its Third Quarter results issued on November 4, 2013, and The Risk Factors and Forward-Looking Statements sections of the Company’s 2012 Form 10-K and Quarterly Reports on Form 10-Q. Copies of these filings Are available from the SEC, the Hertz web site or the Company’s Investor Relations Department. |

|
|
Non-GAAP Measures Definitions and reconciliations of these non-GAAP measures are provided at the end of the presentation. The following non-GAAP measures will be used in the presentation: EBITDA Corporate EBITDA Adjusted Pre-Tax Income Adjusted Net Income Adjusted Diluted Earnings Per Share (Adjusted EPS) Net Corporate Debt Net Fleet Debt Total Net Debt Adjusted Interest Expense Adjusted Direct Operating Expense Adjusted Selling, General and Administrative Adjusted Depreciation of Revenue Earning Equipment Free Cash Flow |
|
|
Overview Mark Frissora, Chairman and CEO Financial Performance David Rosenberg, Interim CFO Outlook Mark Frissora, Chairman and CEO Questions & Answers Session Today’s Agenda |

|
|
* Definitions and reconciliations of these non-GAAP measures are provided at the end of the presentation. Q3:13 RESULTS Total Company Highlights: Revenue Adj. pre-tax income & margin Corporate EBITDA & margin Worldwide RAC Highlights: Revenue Adj. pre-tax income & margin Corporate EBITDA & margin Q3:13 Results Q3:12 Results YoY Change GAAP Revenue $3,069.4 $2,516.2 22.0% Income before income taxes $328.3 $368.9 -11.0% Earnings per share $0.47 $0.55 -14.5% Diluted shares outstanding 465.0 445.5 4.4% Non-GAAP* Corporate EBITDA $740.8 $607.0 22.0% Adjusted pre-tax income $519.5 $424.8 22.3% Adjusted pre-tax margin 16.93% 16.88% 5 bps Adjusted EPS $0.73 $0.63 15.9% |
|
|
Q3:13 Consolidated WW Revenue +22% YoY HERC Off Air port Donlen Dollar Thrifty Leisure U.S. RAC off-airport revenue 11.1% higher Opened 92 net new locations in Q3:13 Insurance replacement +14% YoY Donlen leasing and fleet management revenue increased ~10% to $133M North American equipment rental revenue up 12.3%, excluding FX Incremental Dollar Thrifty revenue Total revenue growth negatively impacted by Q4:12 franchised locations in U.S. and Europe |

|
|
Sept. YTD cost savings $237M vs. FY:13 target of $300M $89M of cost savings achieved in Q3:13 28th consecutive quarter of YoY labor efficiency DTG Synergies are incremental to Lean/Six Sigma cost savings Q3:13 Cost Savings Update Q3:13 +34.5% vs 2006 Q3:13 includes DTG results Incremental Cumulative target $0 $187 $500 $1,260 $1,698 $2,156 $2,639 $2,939 $313 $760 $438 $458 $483 $237 2006 2007 2008 2009 2010 2011 2012 2013 Employee Productivity Based on Revenue per Employee $174 $234 Q4 Q1 Q2 Q3 Q4 Q1 Q2 Q3 Q4 Q1 Q2 Q3 Q4 Q1 Q2 Q3 Q4 Q1 Q2 Q3 Q4 Q1 Q2 Q3 Q4 Q1 Q2 Q3 2006 2007 2008 2009 2010 2011 2012 2013 |
|
|
Rent-A-Car Metrics: Q3:13 vs. Q3:12 U.S. adj. pre-tax income: Q3:13 up 23.6% YoY International adj. pre-tax income: Q3:13 up 30.2% YoY Note: Revenue excludes FX * Includes Advantage sublease revenue of $22 million Market % of WW RAC Total Rev. Total Rev. Total RPD excl sublease Trans. Days Total Rev. per Trans. Trans. Trans. Length (days) U.S. 70% 32.6%* 2.0% 28.4% 5.1% 24.6% 3.1% Int'l (Excl. Switzerland) 30% 11.2% 3.7% 7.3% 4.3% 6.6% 0.6% New segment reporting |
|
|
Hertz Airport DTG / Advantage *** Off-Airport RPD ** +2.5% +32.3% +0.5% Trans Days -2.9% +389.6% +10.6% * Includes Advantage sublease revenue ** Excludes Advantage sublease revenue *** DTG acquired Nov. 2012; Advantage RAC divested Dec. 2012 Q3:13 U.S. RAC Total Revenue* +32.6% YoY Planned for ~4% days growth YoY; 7% negative swing vs. plan $ in millions Off-Airport 24% of U.S. RAC Revenue On-Airport 76% of U.S. RAC Revenue Commercial RPD flat YoY Leisure RPD +4% YoY Excl. sublease Total Revenue** u.s. rac growth drivers q3:13 vs. Q3:12 |
|
|
Hertz RAC Depreciation Methodology Consistent accounting policy to depreciate vehicles evenly across holding period to breakeven at disposal Quarterly review conducted based on views of present & estimated future market conditions and their effect on residual values at disposal Black Book used as a benchmark As needed, depreciation rates adjusted prospectively on straight-line basis across remaining holding period to reflect changes in residual value If fleet disposed early due to slowdown in demand or to opportunistically capitalize on short supply in used-car market, losses/gains on vehicle sales will be incurred Goal – Set/adjust depreciation for $0 gain/loss on vehicle sales *Automakers set depreciation on program cars, so no forecasting required |
|
|
Key Drivers of RAC Depreciation Shifts Q3:12 $225 Higher Lower Shorter More program Auction More premium Purchase price Residual Value Holding Period Risk/Program Mix Resale Channels Fleet Mix Other Factors* Q3:13$221 Lower Higher Longer More risk Wholesale More economy * Other factors can include, but are not limited to: negotiated discounts at time of purchase, changes in manufacture quality/perception, timing of vehicles sales, vehicle mileage and condition, and vehicle recalls |
|
|
Q3:13 US RAC Car Sales Other Factors Impacting Fleet Costs 78% more units sold through retail locations YoY; holding period ~30 days Increased mix of risk vs. program vehicles Fleet purchased YTD 9/30/13 = 93% risk vs. 86% risk YTD 9/30/12 Mix shift to lower-cost vehicles Risk holding period ~20 months Alternative Resale Channels Q3: 13 Channel Mix Full Year % of Total Hertz Vehicle Sales Q3:13 Incremental Return vs. Auction Online Auction 6% Dealer Direct 38% Retail/Rent2Buy 19% Wholesale Auction 37% 44% 38% 38% 12% 9% 6% 12% 15% 18% 32% 38% 38% 2011 2012 2013E $25 $450 $1,100 Online Auction Dealer Direct Retail&R2B |
|
|
Q3:13 Int’l Rental Car Improving Revenue +9.3% YoY, excluding FX Trans. days +6.4%; RPD +2.7% Inbound revenue +7.7% YoY Opened 143 corporate co-branded & 15 Thrifty licensee locations Target 4 more corporate locations by YE:13 Firefly revenue +49% Open 3 more locations by YE:13 Operational improvements Fleet efficiency +200 bps Employee productivity +7.3% Net Promoter Score +5.5% For YoY comparison, Q3:12 results exclude Switzerland locations, which were franchised in Q4:12 International RAC revenue +11%, excl. FX; adj pre-tax margin +265 bps EUROPE |
|
|
Majority of fleet synergies to be realized in 2014 & 2015 from purchasing power & consolidated counter systems DTG Integration Update $300 million of REVENUE synergies worldwide realized 2013-2015 2013E target = $120M YTD:13 realized ~$100M incremental revenue worldwide ~50%: added Dollar Thrifty to partner agreements beginning in May Balance from opening 143 corporate Thrifty locations throughout Europe & a variety of new product and service offerings Expect remaining $180M split 65%- 35% between 2014 and 2015, respectively $300 million of COST synergies worldwide realized 2013-2015 2013E target = $140 million YTD:13 realized ~$95 million Fleet sharing between brands, facility consolidations, corporate overhead and marketing programs Expect remaining $160M split 65%-35% over the next two years, respectively |
|
|
Revenue growth driven by expansion in industrial, oil & gas, specialty markets and the beginnings of the construction recovery N.A. nat’l accounts represents 51% of rental revenue N.A. Corporate EBITDA margin 46.5% Q3:13 Equipment Rental (HERC) * Excludes FX impact ** Pricing and volume data exclude Cinelease due to the nature of that business YoY % Change U.S. N.A. World- wide Revenue* 11.6% 12.2% 11.3% Rental Revenue* 12.6% 12.3% 11.2% Volume** 14.5% 15.3% 14.9% Pricing** 3.4% 3.1% 2.9% North America Revenue Mix Fragmented 37% Industrial 24% Construction 39% Fragmented 30% Induatrial 20% Construction 50% Q3:13 FY:07 |
|
|
David Rosenberg Interim CFO FINANCIAL RESULTS CASH FLOW REVIEW BALANCE SHEET REVIEW |

|
|
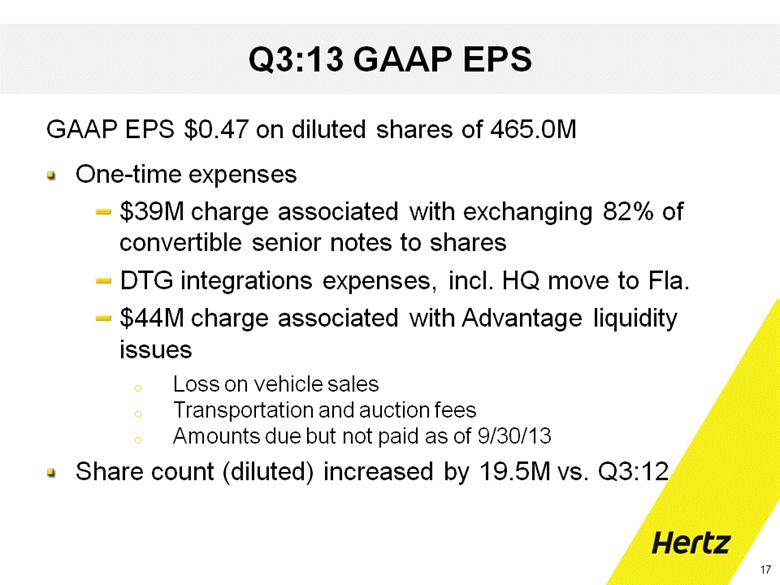
Q3:13 GAAP EPS GAAP EPS $0.47 on diluted shares of 465.0M One-time expenses $39M charge associated with exchanging 82% of convertible senior notes to shares DTG integrations expenses, incl. HQ move to Fla. $44M charge associated with Advantage liquidity issues Loss on vehicle sales Transportation and auction fees Amounts due but not paid as of 9/30/13 Share count (diluted) increased by 19.5M vs. Q3:12 |
|
|
HERC Key Metrics N.A. time utilization +210 bps with 10.3% more fleet WW HERC Corporate EBITDA up 10.5% Q3:13 Corporate EBITDA flow-through 45%, reflecting activity to make fleet available for rent and improved utilization Full year Corporate EBITDA flow-though expected 60% - 65% WW Pricing YoY 0.2% 3.0% 4.1% 3.9% 3.7% 3.6% 3.3% 3.8% 3.6% 4.0% 2.9% 50.6 50.6 48.4 47.8 46.6 43.9 42.8 42.4 41.5 40.5 40.5 NA Fleet Age Q1:11 Q2:11 Q3:11 Q4:11 Q1:12 Q2:12 Q3:12 Q4:12 Q1:13 Q2:13 Q3:13 NA Time Utilization NA Dollar Utilization 57% 60% 62% 59% 62% 65% 64% 66% 68% 64% 66% Q1 Q2 Q3 Q4 2011 2012 2013 31% 34% 36% 34% 36% 37% 37% 38% 39% 36% 39% Q1 Q2 Q3 Q4 2011 2012 2013 |
|
|
Interest Expense Summary GAAP interest expense decreased by 30 bps as a % of revenue Cash interest expense increased $27.4M due to acquisition financing and fleet growth 2013E: cash interest expense now expected to increase ~$90M, down from ~$100M * Net of interest income 2013 2012 2013 2012 Q3 178.8 154.2 161.1 133.7 YTD 535.6 467.1 481.1 400.8 GAAP Interest Expense* Cash Interest Expense* |
|
|
Tax Rate Q3:13 GAAP effective income tax rate 34.6% equal to Q3:12 Q3:13 cash taxes paid: $13.4M vs. $5.3M in Q3:12 FY:13 cash taxes estimated to be ~ $80M to $85M 2013 adjusted tax rate normalized = 35% NOL balance as of Dec. 31, 2012 = $3.9 billion; estimated Dec. 31, 2013 balance ~$3.8 billion |
|
|
Strong Operating Performance Drives Positive Cash Flow Operating Cash Flow Improved pre-tax earnings and working capital Net investments U.S. RAC fleet growth primarily for incr. DTG fleet purchases Higher non-fleet capex: technology initiatives & RAC facility updates FY:13 FCF guidance $500 - 600M * Excludes fleet depreciation add-back ($ in Millions) YTD:13 YTD:12 Change Operating Cash Flow * 1,004.2 597.8 406.4 Net Investment (990.5) (885.9) (104.6) Free Cash Flow 13.7 (288.1) 301.8 |
|
|
Q3:13 average WW fleet age 41 months vs. 44 months in Q3:12 * Includes non-cash purchases and sales. ** Above amounts are on a cash flow basis, consistent with our GAAP statement of cash flows. YTD Q3:13 WWHERC Fleet Statistics WW HERC Fleet CapEx – Cash Basis** YTD Gross Purchases* YTD Disposals First Cost* YTD Net Fleet Purchases* 2010 2011 2012 2013 (188.1) (428.4) (521.4) (553.3) 272.2 344.3 368.8 307.7 2010 2011 2012 2013 2010 2011 2012 2013 (61.2) (273.5) (388.0) (443.3) ($ in millions), ex. FX YTD Q3:13 YTD Q3:12 Fleet Expenditures Disposal Proceeds Net CapEx (581.5) (606.5) 100.7 127.3 (480.8) (479.2) |
|
|
Liquidity & Debt Corporate Liquidity as of 9/30/13 ($ in millions) ABL Availability: $750 Unrestricted Cash: 549 Corporate Liquidity: $1,299 Total net corporate debt $6.3 billion Total net fleet debt $9.8 billion Net corporate debt / corporate EBITDA ratio 3.0x With full run-rate synergies and DTG full year EBITDA, pro forma ratio would be 2.7x* *Assumes $300M of cost synergies |
|
|
OUTLOOK |

|
|
Q4:13 Outlook HERC price & volume strong Q4 volume comp tougher due to additional fleet buys last year driving share and slower non-res construction recovery EU RAC volume and pricing trends positive US RAC volume improving; Oct. pricing positive, tough Dec. comps. US RAC fleet remains high 26,000 vehicles recalled by automakers – est. repairs completed by mid-Nov. Excess Q3:13 fleet, expect to have rightsized by 3/31/14 |
|
|
U.S. RAC Monthly Depreciation Per Vehicle US RAC Depreciation Rising on Early Disposal of Vehicles FY:13E U.S. monthly depreciation per unit now up 1-2% Previously expected metric down 2-3% NOTE: All figures except 2013 exclude Dollar Thrifty fleet Annual rates Quarterly rates $328 $347 $332 $304 $255 $228 $281 $220 $253 $267 $249 $213 $225 $226 $210 $219 $221 FY:07 FY:08 FY:09 FY:10 FY:11 FY:12 Q1:11 Q2:11 Q3:11 Q4:11 Q1:12 Q2:12 Q3:12 Q4:12 Q1:13 Q2:13 Q3:13 |

|
|
Transition Period for Hertz 2013 Integrating DTG acquisition Managing largest risk fleet ever Introducing new brands globally Continuing to develop retail sales network Launching game-changing in-car technology Expanding off-airport footprint 2014 U.S. RAC monthly depreciation estimated between $250-$260 per unit Improving fleet efficiency to help offset |

|
|
Confident in long term fundamentals and future prospects Share Repurchase Plan Approved Board has approved share repurchase program of up to $300M of total shares outstanding Long-term fundamentals remain unchanged Off airport, Donlen, HERC all generating double-digit revenue growth Dollar Thrifty integration synergies on plan Convertible notes exchanged, locking in dilution Structural savings programs generating efficiencies Retail car-sales channels expanding, delivering higher returns |

|
|
RISKS: U.S. sequester, OEM vehicle recalls, residual values FY:13 Financial Guidance Published 9/26/13 Cost savings target of $300M to offset inflation (incl. depreciation savings) Tax rate of 35% Cash interest expense ~$90M higher YoY % ? YoY High end of forecast Revenue $10.80 to $10.90 bil 21% Corporate EBITDA $2.12 to $2.19 bil 34% Adj. Pre-Tax Income $1.20 to $1.27 bil 41% Adj. Net Income $780 to $830 mil 40% Adjusted Diluted EPS $1.68 to $1.78 34% Free Cash Flow $500 to $600 mil FY-13 Guidance Share count FY:13 = 465 mil |
|
|
Q & A |

Table 1
HERTZ GLOBAL HOLDINGS, INC.
CONDENSED CONSOLIDATED STATEMENTS OF OPERATIONS
(In millions, except per share amounts)
Unaudited
|
|
|
Three Months Ended |
|
As a Percentage |
| ||||||
|
|
|
September 30, |
|
of Total Revenues |
| ||||||
|
|
|
2013 |
|
2012 |
|
2013 |
|
2012 |
| ||
|
Total revenues |
|
$ |
3,069.4 |
|
$ |
2,516.2 |
|
100.0 |
% |
100.0 |
% |
|
|
|
|
|
|
|
|
|
|
| ||
|
Expenses: |
|
|
|
|
|
|
|
|
| ||
|
Direct operating |
|
1,525.4 |
|
1,241.1 |
|
49.7 |
% |
49.3 |
% | ||
|
Depreciation of revenue earning equipment and lease charges |
|
676.7 |
|
560.5 |
|
22.1 |
% |
22.3 |
% | ||
|
Selling, general and administrative |
|
276.8 |
|
201.0 |
|
9.0 |
% |
8.0 |
% | ||
|
Interest expense |
|
182.3 |
|
154.9 |
|
5.9 |
% |
6.1 |
% | ||
|
Interest income |
|
(3.5 |
) |
(0.7 |
) |
(0.1 |
)% |
— |
% | ||
|
Other (income) expense, net |
|
83.4 |
|
(9.5 |
) |
2.7 |
% |
(0.4 |
)% | ||
|
Total expenses |
|
2,741.1 |
|
2,147.3 |
|
89.3 |
% |
85.3 |
% | ||
|
Income before income taxes |
|
328.3 |
|
368.9 |
|
10.7 |
% |
14.7 |
% | ||
|
Provision for taxes on income |
|
(113.6 |
) |
(126.0 |
) |
(3.7 |
)% |
(5.0 |
)% | ||
|
Net income attributable to Hertz Global Holdings, Inc. and Subsidiaries’ common stockholders |
|
$ |
214.7 |
|
$ |
242.9 |
|
7.0 |
% |
9.7 |
% |
|
|
|
|
|
|
|
|
|
|
| ||
|
Weighted average number of shares outstanding: |
|
|
|
|
|
|
|
|
| ||
|
Basic |
|
424.9 |
|
420.6 |
|
|
|
|
| ||
|
Diluted |
|
465.0 |
|
445.5 |
|
|
|
|
| ||
|
|
|
|
|
|
|
|
|
|
| ||
|
Earnings per share attributable to Hertz Global Holdings, Inc. and Subsidiaries’ common stockholders: |
|
|
|
|
|
|
|
|
| ||
|
Basic |
|
$ |
0.51 |
|
$ |
0.58 |
|
|
|
|
|
|
Diluted (a) |
|
$ |
0.47 |
|
$ |
0.55 |
|
|
|
|
|
|
|
|
Nine Months Ended |
|
As a Percentage |
| ||||||
|
|
|
September 30, |
|
of Total Revenues |
| ||||||
|
|
|
2013 |
|
2012 |
|
2013 |
|
2012 |
| ||
|
Total revenues |
|
$ |
8,220.6 |
|
$ |
6,702.3 |
|
100.0 |
% |
100.0 |
% |
|
|
|
|
|
|
|
|
|
|
| ||
|
Expenses: |
|
|
|
|
|
|
|
|
| ||
|
Direct operating |
|
4,282.6 |
|
3,544.2 |
|
52.1 |
% |
52.9 |
% | ||
|
Depreciation of revenue earning equipment and lease charges |
|
1,904.8 |
|
1,595.4 |
|
23.2 |
% |
23.8 |
% | ||
|
Selling, general and administrative |
|
803.5 |
|
615.3 |
|
9.7 |
% |
9.2 |
% | ||
|
Interest expense |
|
542.9 |
|
469.4 |
|
6.6 |
% |
7.0 |
% | ||
|
Interest income |
|
(7.3 |
) |
(2.3 |
) |
(0.1 |
)% |
0.0 |
% | ||
|
Other (income) expense, net |
|
81.7 |
|
(10.5 |
) |
1.0 |
% |
(0.2 |
)% | ||
|
Total expenses |
|
7,608.2 |
|
6,211.5 |
|
92.6 |
% |
92.7 |
% | ||
|
Income before income taxes |
|
612.4 |
|
490.8 |
|
7.4 |
% |
7.3 |
% | ||
|
Provision for taxes on income |
|
(258.3 |
) |
(211.3 |
) |
(3.1 |
)% |
(3.1 |
)% | ||
|
Net income attributable to Hertz Global Holdings, Inc. and Subsidiaries’ common stockholders |
|
$ |
354.1 |
|
$ |
279.5 |
|
4.3 |
% |
4.2 |
% |
|
|
|
|
|
|
|
|
|
|
| ||
|
Weighted average number of shares outstanding: |
|
|
|
|
|
|
|
|
| ||
|
Basic |
|
413.9 |
|
419.6 |
|
|
|
|
| ||
|
Diluted |
|
463.7 |
|
447.1 |
|
|
|
|
| ||
|
|
|
|
|
|
|
|
|
|
| ||
|
Earnings per share attributable to Hertz Global Holdings, Inc. and Subsidiaries’ common stockholders: |
|
|
|
|
|
|
|
|
| ||
|
Basic |
|
$ |
0.86 |
|
$ |
0.67 |
|
|
|
|
|
|
Diluted (a) |
|
$ |
0.78 |
|
$ |
0.63 |
|
|
|
|
|
(a) We had a change in policy in Q1 2013 with respect to settling the conversion of our 5.25% Convertible Senior Notes due June 2014. For 2013, this policy change results in an adjustment to the numerator (net income) of our earnings per share computation. The numerator is adjusted to add back the after-tax amount of interest recognized in the period associated with the Convertible Senior Notes on the same pro rata basis.
Table 2
HERTZ GLOBAL HOLDINGS, INC.
CONDENSED CONSOLIDATED STATEMENTS OF OPERATIONS
(In millions)
Unaudited
|
|
|
Three Months Ended September 30, 2013 |
|
Three Months Ended September 30, 2012 |
| ||||||||||||||
|
|
|
As |
|
|
|
As |
|
As |
|
|
|
As |
| ||||||
|
|
|
Reported |
|
Adjustments |
|
Adjusted |
|
Reported |
|
Adjustments |
|
Adjusted |
| ||||||
|
Total revenues |
|
$ |
3,069.4 |
|
$ |
— |
|
$ |
3,069.4 |
|
$ |
2,516.2 |
|
$ |
— |
|
$ |
2,516.2 |
|
|
|
|
|
|
|
|
|
|
|
|
|
|
|
| ||||||
|
Expenses: |
|
|
|
|
|
|
|
|
|
|
|
|
| ||||||
|
Direct operating |
|
1,525.4 |
|
(52.3 |
)(a) |
1,473.1 |
|
1,241.1 |
|
(25.1 |
)(a) |
1,216.0 |
| ||||||
|
Depreciation of revenue earning equipment and lease charges |
|
676.7 |
|
(2.2 |
)(b) |
674.5 |
|
560.5 |
|
(2.5 |
)(b) |
558.0 |
| ||||||
|
Selling, general and administrative |
|
276.8 |
|
(35.6 |
)(c) |
241.2 |
|
201.0 |
|
(7.8 |
)(c) |
193.2 |
| ||||||
|
Interest expense |
|
182.3 |
|
(17.7 |
)(d) |
164.6 |
|
154.9 |
|
(20.5 |
)(d) |
134.4 |
| ||||||
|
Interest income |
|
(3.5 |
) |
— |
|
(3.5 |
) |
(0.7 |
) |
— |
|
(0.7 |
) | ||||||
|
Other (income) expense, net |
|
83.4 |
|
(83.4 |
)(e) |
— |
|
(9.5 |
) |
— |
|
(9.5 |
) | ||||||
|
Total expenses |
|
2,741.1 |
|
(191.2 |
) |
2,549.9 |
|
2,147.3 |
|
(55.9 |
) |
2,091.4 |
| ||||||
|
Income before income taxes |
|
328.3 |
|
191.2 |
|
519.5 |
|
368.9 |
|
55.9 |
|
424.8 |
| ||||||
|
Provision for taxes on income |
|
(113.6 |
) |
(68.2 |
)(f) |
(181.8 |
) |
(126.0 |
) |
(18.5 |
)(f) |
(144.5 |
) | ||||||
|
Net income attributable to Hertz Global Holdings, Inc. and Subsidiaries’ common stockholders |
|
$ |
214.7 |
|
$ |
123.0 |
|
$ |
337.7 |
|
$ |
242.9 |
|
$ |
37.4 |
|
$ |
280.3 |
|
|
|
|
|
|
|
|
|
|
|
|
|
|
|
| ||||||
|
Weighted average number of diluted shares outstanding |
|
465.0 |
|
465.0 |
|
465.0 |
|
445.5 |
|
445.5 |
|
445.5 |
| ||||||
|
Diluted earnings per share (g)(h) |
|
$ |
0.47 |
|
$ |
0.26 |
|
$ |
0.73 |
|
$ |
0.55 |
|
$ |
0.08 |
|
$ |
0.63 |
|
|
|
|
Nine Months Ended September 30, 2013 |
|
Nine Months Ended September 30, 2012 |
| ||||||||||||||
|
|
|
As |
|
|
|
As |
|
As |
|
|
|
As |
| ||||||
|
|
|
Reported |
|
Adjustments |
|
Adjusted |
|
Reported |
|
Adjustments |
|
Adjusted |
| ||||||
|
Total revenues |
|
$ |
8,220.6 |
|
$ |
— |
|
$ |
8,220.6 |
|
$ |
6,702.3 |
|
$ |
— |
|
$ |
6,702.3 |
|
|
|
|
|
|
|
|
|
|
|
|
|
|
|
| ||||||
|
Expenses: |
|
|
|
|
|
|
|
|
|
|
|
|
| ||||||
|
Direct operating |
|
4,282.6 |
|
(142.0 |
)(a) |
4,140.6 |
|
3,544.2 |
|
(88.6 |
)(a) |
3,455.6 |
| ||||||
|
Depreciation of revenue earning equipment and lease charges |
|
1,904.8 |
|
(7.7 |
)(b) |
1,897.1 |
|
1,595.4 |
|
(8.0 |
)(b) |
1,587.4 |
| ||||||
|
Selling, general and administrative |
|
803.5 |
|
(78.0 |
)(c) |
725.5 |
|
615.3 |
|
(34.4 |
)(c) |
580.9 |
| ||||||
|
Interest expense |
|
542.9 |
|
(54.5 |
)(d) |
488.4 |
|
469.4 |
|
(66.3 |
)(d) |
403.1 |
| ||||||
|
Interest income |
|
(7.3 |
) |
— |
|
(7.3 |
) |
(2.3 |
) |
— |
|
(2.3 |
) | ||||||
|
Other (income) expense, net |
|
81.7 |
|
(83.9 |
)(e) |
(2.2 |
) |
(10.5 |
) |
— |
|
(10.5 |
) | ||||||
|
Total expenses |
|
7,608.2 |
|
(366.1 |
) |
7,242.1 |
|
6,211.5 |
|
(197.3 |
) |
6,014.2 |
| ||||||
|
Income before income taxes |
|
612.4 |
|
366.1 |
|
978.5 |
|
490.8 |
|
197.3 |
|
688.1 |
| ||||||
|
Provision for taxes on income |
|
(258.3 |
) |
(84.2 |
)(f) |
(342.5 |
) |
(211.3 |
) |
(22.7 |
)(f) |
(234.0 |
) | ||||||
|
Net income attributable to Hertz Global Holdings, Inc. and Subsidiaries’ common stockholders |
|
$ |
354.1 |
|
$ |
281.9 |
|
$ |
636.0 |
|
$ |
279.5 |
|
$ |
174.6 |
|
$ |
454.1 |
|
|
|
|
|
|
|
|
|
|
|
|
|
|
|
| ||||||
|
Weighted average number of diluted shares outstanding |
|
463.7 |
|
463.7 |
|
463.7 |
|
447.1 |
|
447.1 |
|
447.1 |
| ||||||
|
Diluted earnings per share (g)(h) |
|
$ |
0.78 |
|
$ |
0.61 |
|
$ |
1.39 |
|
$ |
0.63 |
|
$ |
0.39 |
|
$ |
1.02 |
|
|
(a) |
Represents the increase in amortization of other intangible assets, depreciation of property and equipment and accretion of certain revalued liabilities relating to purchase accounting. For the three months ended September 30, 2013 and 2012, also includes restructuring and restructuring related charges of $10.0 million and $4.3 million, respectively. For the nine months ended September 30, 2013 and 2012, also includes restructuring and restructuring related charges of $21.0 million and $21.3 million, respectively. |
|
(b) |
Represents the increase in depreciation of equipment rental revenue earning equipment based upon its revaluation relating to purchase accounting. |
|
(c) |
Represents an increase in depreciation of property and equipment relating to purchase accounting. For the three months ended September 30, 2013 and 2012, also includes restructuring and restructuring related charge (benefit) of $26.3 million and $(0.9) million, respectively. For the nine months ended September 30, 2013 and 2012, also includes restructuring and restructuring related charges of $41.0 million and $13.2 million, respectively. For all periods presented, also includes other adjustments which are detailed in Table 5. |
|
(d) |
Represents non-cash debt charges relating to the amortization of deferred debt financing costs and debt discounts. |
|
(e) |
Primarily represents impairment charges related to Franchise Services of North America and its subsidiary, Simply Wheelz, LLC., debt extinguishment loss and inducement costs on conversion of the convertible senior notes. |
|
(f) |
Represents a provision for income taxes derived utilizing a normalized income tax rate (35% for 2013 and 34% for 2012). |
|
(g) |
Adjusted diluted earnings per share represents a non-GAAP measure, see the accompanying reconciliations and definitions. |
|
(h) |
See footnote explanation in Table 1. |
Note: Certain adjustments have been reclassified to conform with current period presentation.
Table 3
HERTZ GLOBAL HOLDINGS, INC.
SEGMENT AND OTHER INFORMATION
(In millions, except per share amounts)
Unaudited
|
|
|
Three Months Ended |
|
Nine Months Ended |
| ||||||||
|
|
|
September 30, |
|
September 30, |
| ||||||||
|
|
|
2013 |
|
2012 |
|
2013 |
|
2012 |
| ||||
|
Revenues: |
|
|
|
|
|
|
|
|
| ||||
|
U.S. Car Rental |
|
$ |
1,765.5 |
|
$ |
1,331.0 |
|
$ |
4,848.0 |
|
$ |
3,599.6 |
|
|
International Car Rental |
|
768.6 |
|
700.6 |
|
1,838.3 |
|
1,754.0 |
| ||||
|
Worldwide Equipment Rental |
|
401.8 |
|
363.0 |
|
1,137.1 |
|
1,000.1 |
| ||||
|
All Other Operations |
|
133.5 |
|
121.6 |
|
397.2 |
|
348.6 |
| ||||
|
Other reconciling items |
|
— |
|
— |
|
— |
|
— |
| ||||
|
|
|
$ |
3,069.4 |
|
$ |
2,516.2 |
|
$ |
8,220.6 |
|
$ |
6,702.3 |
|
|
|
|
|
|
|
|
|
|
|
| ||||
|
Depreciation of property and equipment: |
|
|
|
|
|
|
|
|
| ||||
|
U.S. Car Rental |
|
$ |
30.4 |
|
$ |
23.8 |
|
$ |
95.4 |
|
$ |
72.1 |
|
|
International Car Rental |
|
5.7 |
|
5.6 |
|
18.8 |
|
18.5 |
| ||||
|
Worldwide Equipment Rental |
|
8.3 |
|
8.1 |
|
25.2 |
|
24.7 |
| ||||
|
All Other Operations |
|
0.9 |
|
0.8 |
|
2.7 |
|
2.4 |
| ||||
|
Other reconciling items |
|
2.5 |
|
3.1 |
|
7.6 |
|
9.2 |
| ||||
|
|
|
$ |
47.8 |
|
$ |
41.4 |
|
$ |
149.7 |
|
$ |
126.9 |
|
|
|
|
|
|
|
|
|
|
|
| ||||
|
Amortization of other intangible assets: |
|
|
|
|
|
|
|
|
| ||||
|
U.S. Car Rental |
|
$ |
16.2 |
|
$ |
5.6 |
|
$ |
48.4 |
|
$ |
16.9 |
|
|
International Car Rental |
|
2.3 |
|
1.9 |
|
5.4 |
|
5.4 |
| ||||
|
Worldwide Equipment Rental |
|
9.5 |
|
10.1 |
|
30.3 |
|
30.0 |
| ||||
|
All Other Operations |
|
1.8 |
|
1.8 |
|
5.4 |
|
5.4 |
| ||||
|
Other reconciling items |
|
0.5 |
|
0.4 |
|
1.4 |
|
1.2 |
| ||||
|
|
|
$ |
30.3 |
|
$ |
19.8 |
|
$ |
90.9 |
|
$ |
58.9 |
|
|
|
|
|
|
|
|
|
|
|
| ||||
|
Income (loss) before income taxes: |
|
|
|
|
|
|
|
|
| ||||
|
U.S. Car Rental |
|
$ |
314.1 |
|
$ |
304.3 |
|
$ |
801.5 |
|
$ |
611.3 |
|
|
International Car Rental |
|
105.7 |
|
93.1 |
|
76.1 |
|
74.4 |
| ||||
|
Worldwide Equipment Rental |
|
75.2 |
|
63.0 |
|
170.0 |
|
101.1 |
| ||||
|
All Other Operations |
|
5.8 |
|
7.6 |
|
25.8 |
|
16.6 |
| ||||
|
Other reconciling items |
|
(172.5 |
) |
(99.1 |
) |
(461.0 |
) |
(312.6 |
) | ||||
|
|
|
$ |
328.3 |
|
$ |
368.9 |
|
$ |
612.4 |
|
$ |
490.8 |
|
|
|
|
|
|
|
|
|
|
|
| ||||
|
Corporate EBITDA (a): |
|
|
|
|
|
|
|
|
| ||||
|
U.S. Car Rental |
|
$ |
420.4 |
|
$ |
342.0 |
|
$ |
1,026.0 |
|
$ |
728.2 |
|
|
International Car Rental |
|
138.5 |
|
109.0 |
|
151.6 |
|
131.9 |
| ||||
|
Worldwide Equipment Rental |
|
182.8 |
|
165.4 |
|
487.4 |
|
399.1 |
| ||||
|
All Other Operations |
|
12.8 |
|
11.4 |
|
37.3 |
|
28.5 |
| ||||
|
Other reconciling items |
|
(13.7 |
) |
(20.8 |
) |
(56.8 |
) |
(65.0 |
) | ||||
|
|
|
$ |
740.8 |
|
$ |
607.0 |
|
$ |
1,645.5 |
|
$ |
1,222.7 |
|
|
|
|
|
|
|
|
|
|
|
| ||||
|
Adjusted pre-tax income (loss) (a): |
|
|
|
|
|
|
|
|
| ||||
|
U.S. Car Rental |
|
$ |
391.8 |
|
$ |
317.0 |
|
$ |
934.6 |
|
$ |
658.4 |
|
|
International Car Rental |
|
129.4 |
|
99.4 |
|
125.8 |
|
106.4 |
| ||||
|
Worldwide Equipment Rental |
|
87.5 |
|
76.2 |
|
207.1 |
|
144.6 |
| ||||
|
All Other Operations |
|
14.0 |
|
12.9 |
|
41.2 |
|
34.5 |
| ||||
|
Other reconciling items |
|
(103.2 |
) |
(80.7 |
) |
(330.2 |
) |
(255.8 |
) | ||||
|
|
|
$ |
519.5 |
|
$ |
424.8 |
|
$ |
978.5 |
|
$ |
688.1 |
|
|
|
|
|
|
|
|
|
|
|
| ||||
|
Adjusted net income (loss) (a): |
|
|
|
|
|
|
|
|
| ||||
|
U.S. Car Rental |
|
$ |
254.7 |
|
$ |
209.2 |
|
$ |
607.5 |
|
$ |
434.5 |
|
|
International Car Rental |
|
84.1 |
|
65.6 |
|
81.8 |
|
70.2 |
| ||||
|
Worldwide Equipment Rental |
|
56.9 |
|
50.3 |
|
134.6 |
|
95.4 |
| ||||
|
All Other Operations |
|
9.1 |
|
8.5 |
|
26.7 |
|
22.8 |
| ||||
|
Other reconciling items |
|
(67.1 |
) |
(53.3 |
) |
(214.6 |
) |
(168.8 |
) | ||||
|
|
|
$ |
337.7 |
|
$ |
280.3 |
|
$ |
636.0 |
|
$ |
454.1 |
|
|
|
|
|
|
|
|
|
|
|
| ||||
|
Weighted average number of diluted shares outstanding (a) |
|
465.0 |
|
445.5 |
|
463.7 |
|
447.1 |
| ||||
|
|
|
|
|
|
|
|
|
|
| ||||
|
Adjusted diluted earnings per share (a)(b) |
|
$ |
0.73 |
|
$ |
0.63 |
|
$ |
1.39 |
|
$ |
1.02 |
|
(a) Represents a non-GAAP measure, see the accompanying reconciliations and definitions.
(b) See footnote explanation in Table 1.
Note: “Other Reconciling Items” includes general corporate expenses and certain interest expense (including net interest on corporate debt). See Tables 5 and 6.
Table 4
HERTZ GLOBAL HOLDINGS, INC.
SELECTED OPERATING AND FINANCIAL DATA
Unaudited
|
|
|
Three |
|
Percent |
|
Nine |
|
Percent |
| ||
|
|
|
Months |
|
change |
|
Months |
|
change |
| ||
|
|
|
Ended, or as |
|
from |
|
Ended, or as |
|
from |
| ||
|
|
|
of September 30, |
|
prior year |
|
of September 30, |
|
prior year |
| ||
|
|
|
2013 |
|
period |
|
2013 |
|
period |
| ||
|
|
|
|
|
|
|
|
|
|
| ||
|
Selected U.S. Car Rental Operating Data |
|
|
|
|
|
|
|
|
| ||
|
|
|
|
|
|
|
|
|
|
| ||
|
Number of transactions (in thousands) |
|
7,072 |
|
24.6 |
% |
20,380 |
|
26.3 |
% | ||
|
Transaction days (in thousands) (a) |
|
36,064 |
|
28.4 |
% |
100,306 |
|
29.9 |
% | ||
|
Total RPD (b) |
|
$ |
48.33 |
|
2.0 |
% |
$ |
47.68 |
|
2.3 |
% |
|
Average number of cars (Company-operated) |
|
493,400 |
|
33.9 |
% |
467,100 |
|
34.5 |
% | ||
|
Average number of cars (Leased) |
|
23,400 |
|
N/M |
|
22,700 |
|
N/M |
| ||
|
Revenue earning equipment, net (in millions) |
|
$ |
8,987.1 |
|
43.7 |
% |
$ |
8,987.1 |
|
43.7 |
% |
|
|
|
|
|
|
|
|
|
|
| ||
|
Selected International Car Rental Operating Data |
|
|
|
|
|
|
|
|
| ||
|
|
|
|
|
|
|
|
|
|
| ||
|
Number of transactions (in thousands) |
|
2,126 |
|
4.8 |
% |
5,721 |
|
4.5 |
% | ||
|
Transaction days (in thousands) (a) |
|
14,278 |
|
5.5 |
% |
34,553 |
|
3.7 |
% | ||
|
Total RPD (b) |
|
$ |
55.27 |
|
2.9 |
% |
$ |
54.21 |
|
0.7 |
% |
|
Average number of cars (Company-operated) |
|
187,900 |
|
3.5 |
% |
162,600 |
|
3.4 |
% | ||
|
Average number of cars (Leased) |
|
800 |
|
N/M |
|
600 |
|
N/M |
| ||
|
Revenue earning equipment, net (in millions) |
|
$ |
2,708.0 |
|
2.0 |
% |
$ |
2,708.0 |
|
2.0 |
% |
|
|
|
|
|
|
|
|
|
|
| ||
|
Selected Worldwide Equipment Rental Operating Data |
|
|
|
|
|
|
|
|
| ||
|
|
|
|
|
|
|
|
|
|
| ||
|
Rental and rental related revenue (in millions) (b) (c) |
|
$ |
371.8 |
|
11.2 |
% |
$ |
1,044.3 |
|
14.2 |
% |
|
Same store revenue growth , including growth initiatives (b) (c) |
|
7.4 |
% |
(8.6 |
)% |
10.6 |
% |
30.9 |
% | ||
|
Average acquisition cost of rental equipment operated during the period (in millions) |
|
$ |
3,462.0 |
|
10.2 |
% |
$ |
3,369.6 |
|
11.7 |
% |
|
Revenue earning equipment, net (in millions) |
|
$ |
2,410.0 |
|
10.3 |
% |
$ |
2,410.0 |
|
10.3 |
% |
|
|
|
|
|
|
|
|
|
|
| ||
|
Selected All Other Operations Operating Data |
|
|
|
|
|
|
|
|
| ||
|
Average number of cars during period (Donlen - under lease and maintenance) |
|
170,800 |
|
11.5 |
% |
168,100 |
|
14.4 |
% | ||
|
Revenue earning equipment, net (in millions) |
|
$ |
1,110.2 |
|
(1.5 |
)% |
$ |
1,110.2 |
|
(1.5 |
)% |
|
|
|
|
|
|
|
|
|
|
| ||
|
Other Financial Data (in millions) |
|
|
|
|
|
|
|
|
| ||
|
|
|
|
|
|
|
|
|
|
| ||
|
Cash flows provided by operating activities |
|
$ |
1,393.0 |
|
45.0 |
% |
$ |
2,851.6 |
|
33.8 |
% |
|
Free cash flow (b) |
|
418.5 |
|
515.2 |
% |
13.7 |
|
104.8 |
% | ||
|
EBITDA (b) |
|
1,262.1 |
|
10.2 |
% |
3,294.2 |
|
20.4 |
% | ||
|
Corporate EBITDA (b) |
|
740.8 |
|
22.0 |
% |
1,645.5 |
|
34.6 |
% | ||
|
|
|
September 30, |
|
December 31, |
| ||
|
|
|
2013 |
|
2012 |
| ||
|
Selected Balance Sheet Data (in millions) |
|
|
|
|
| ||
|
Cash and cash equivalents |
|
$ |
548.7 |
|
$ |
533.3 |
|
|
Total revenue earning equipment, net |
|
15,215.3 |
|
12,908.3 |
| ||
|
Total assets |
|
25,571.8 |
|
23,286.0 |
| ||
|
Total debt |
|
17,136.2 |
|
15,448.6 |
| ||
|
Net corporate debt (b) |
|
6,274.4 |
|
5,934.4 |
| ||
|
Net fleet debt (b) |
|
9,791.9 |
|
8,409.3 |
| ||
|
Total net debt (b) |
|
16,066.3 |
|
14,343.7 |
| ||
|
Total equity |
|
2,820.9 |
|
2,507.3 |
| ||
(a) Transaction days represent the total number of days that vehicles were on rent in a given period.
(b) Represents a non-GAAP measure, see the accompanying reconciliations and definitions.
(c) Based on 12/31/12 foreign exchange rates.
N/M Percentage change not meaningful.
Table 5
HERTZ GLOBAL HOLDINGS, INC.
CONDENSED CONSOLIDATED STATEMENT OF OPERATIONS BY REPORTABLE SEGMENTS
(In millions, except per share amounts)
Unaudited
|
|
|
Three Months Ended September 30, 2013 |
|
Three Months Ended September 30, 2012 |
| ||||||||||||||||||||||||||||||||
|
|
|
|
|
|
|
|
|
|
|
Other |
|
|
|
|
|
|
|
|
|
|
|
Other |
|
|
| ||||||||||||
|
|
|
U.S. Car |
|
Int’l Car |
|
Equipment |
|
All Other |
|
Reconciling |
|
|
|
U.S. Car |
|
Int’l Car |
|
Equipment |
|
All Other |
|
Reconciling |
|
|
| ||||||||||||
|
|
|
Rental |
|
Rental |
|
Rental |
|
Operations |
|
Items |
|
Total |
|
Rental |
|
Rental |
|
Rental |
|
Operations |
|
Items |
|
Total |
| ||||||||||||
|
Total revenues: |
|
$ |
1,765.5 |
|
$ |
768.6 |
|
$ |
401.8 |
|
$ |
133.5 |
|
$ |
— |
|
$ |
3,069.4 |
|
$ |
1,331.0 |
|
$ |
700.6 |
|
$ |
363.0 |
|
$ |
121.6 |
|
$ |
— |
|
$ |
2,516.2 |
|
|
Expenses: |
|
|
|
|
|
|
|
|
|
|
|
|
|
|
|
|
|
|
|
|
|
|
|
|
| ||||||||||||
|
Direct operating and selling, general and administrative |
|
1,019.0 |
|
481.5 |
|
238.5 |
|
13.7 |
|
49.5 |
|
1,802.2 |
|
733.2 |
|
439.7 |
|
217.8 |
|
11.8 |
|
39.6 |
|
1,442.1 |
| ||||||||||||
|
Depreciation of revenue earning equipment and lease charges |
|
342.5 |
|
150.2 |
|
76.3 |
|
107.7 |
|
— |
|
676.7 |
|
248.1 |
|
144.0 |
|
70.0 |
|
98.4 |
|
— |
|
560.5 |
| ||||||||||||
|
Interest expense |
|
47.9 |
|
31.4 |
|
12.6 |
|
6.5 |
|
83.9 |
|
182.3 |
|
45.4 |
|
33.2 |
|
12.8 |
|
4.0 |
|
59.5 |
|
154.9 |
| ||||||||||||
|
Interest income |
|
(1.8 |
) |
(0.2 |
) |
(0.1 |
) |
(0.2 |
) |
(1.2 |
) |
(3.5 |
) |
— |
|
(0.3 |
) |
(0.2 |
) |
(0.2 |
) |
— |
|
(0.7 |
) | ||||||||||||
|
Other (income) expense, net |
|
43.8 |
|
— |
|
(0.7 |
) |
— |
|
40.3 |
|
83.4 |
|
— |
|
(9.1 |
) |
(0.4 |
) |
— |
|
— |
|
(9.5 |
) | ||||||||||||
|
Total expenses |
|
1,451.4 |
|
662.9 |
|
326.6 |
|
127.7 |
|
172.5 |
|
2,741.1 |
|
1,026.7 |
|
607.5 |
|
300.0 |
|
114.0 |
|
99.1 |
|
2,147.3 |
| ||||||||||||
|
|
|
|
|
|
|
|
|
|
|
|
|
|
|
|
|
|
|
|
|
|
|
|
|
|
| ||||||||||||
|
Income (loss) before income taxes |
|
314.1 |
|
105.7 |
|
75.2 |
|
5.8 |
|
(172.5 |
) |
328.3 |
|
304.3 |
|
93.1 |
|
63.0 |
|
7.6 |
|
(99.1 |
) |
368.9 |
| ||||||||||||
|
|
|
Nine Months Ended September 30, 2013 |
|
Nine Months Ended September 30, 2012 |
| ||||||||||||||||||||||||||||||||
|
|
|
|
|
|
|
|
|
|
|
Other |
|
|
|
|
|
|
|
|
|
|
|
Other |
|
|
| ||||||||||||
|
|
|
U.S. Car |
|
Int’l Car |
|
Equipment |
|
All Other |
|
Reconciling |
|
|
|
U.S Car |
|
Int’l Car |
|
Equipment |
|
All Other |
|
Reconciling |
|
|
| ||||||||||||
|
|
|
Rental |
|
Rental |
|
Rental |
|
Operations |
|
Items |
|
Total |
|
Rental |
|
Rental |
|
Rental |
|
Operations |
|
Items |
|
Total |
| ||||||||||||
|
Total revenues: |
|
$ |
4,848.0 |
|
$ |
1,838.3 |
|
$ |
1,137.1 |
|
$ |
397.2 |
|
$ |
— |
|
$ |
8,220.6 |
|
$ |
3,599.6 |
|
$ |
1,754.0 |
|
$ |
1,000.1 |
|
$ |
348.6 |
|
$ |
— |
|
$ |
6,702.3 |
|
|
Expenses: |
|
|
|
|
|
|
|
|
|
|
|
|
|
|
|
|
|
|
|
|
|
|
|
|
| ||||||||||||
|
Direct operating and selling, general and administrative |
|
2,912.7 |
|
1,270.1 |
|
709.6 |
|
40.5 |
|
153.2 |
|
5,086.1 |
|
2,141.9 |
|
1,195.1 |
|
664.4 |
|
37.2 |
|
120.9 |
|
4,159.5 |
| ||||||||||||
|
Depreciation of revenue earning equipment and lease charges |
|
953.1 |
|
407.3 |
|
223.0 |
|
321.4 |
|
— |
|
1,904.8 |
|
713.1 |
|
400.2 |
|
199.2 |
|
282.9 |
|
— |
|
1,595.4 |
| ||||||||||||
|
Interest expense |
|
141.2 |
|
85.9 |
|
37.8 |
|
11.1 |
|
266.9 |
|
542.9 |
|
133.3 |
|
94.5 |
|
37.2 |
|
12.5 |
|
191.9 |
|
469.4 |
| ||||||||||||
|
Interest income |
|
(4.5 |
) |
(0.8 |
) |
(0.2 |
) |
(0.6 |
) |
(1.2 |
) |
(7.3 |
) |
— |
|
(1.1 |
) |
(0.4 |
) |
(0.6 |
) |
(0.2 |
) |
(2.3 |
) | ||||||||||||
|
Other (income) expense, net |
|
44.0 |
|
(0.3 |
) |
(3.1 |
) |
(1.0 |
) |
42.1 |
|
81.7 |
|
— |
|
(9.1 |
) |
(1.4 |
) |
— |
|
— |
|
(10.5 |
) | ||||||||||||
|
Total expenses |
|
4,046.5 |
|
1,762.2 |
|
967.1 |
|
371.4 |
|
461.0 |
|
7,608.2 |
|
2,988.3 |
|
1,679.6 |
|
899.0 |
|
332.0 |
|
312.6 |
|
6,211.5 |
| ||||||||||||
|
|
|
|
|
|
|
|
|
|
|
|
|
|
|
|
|
|
|
|
|
|
|
|
|
|
| ||||||||||||
|
Income (loss) before income taxes |
|
801.5 |
|
76.1 |
|
170.0 |
|
25.8 |
|
(461.0 |
) |
612.4 |
|
611.3 |
|
74.4 |
|
101.1 |
|
16.6 |
|
(312.6 |
) |
490.8 |
| ||||||||||||
Table 6
HERTZ GLOBAL HOLDINGS, INC.
RECONCILIATION OF GAAP TO NON-GAAP EARNINGS MEASURES
(In millions, except per share amounts)
Unaudited
ADJUSTED PRE-TAX INCOME (LOSS) AND ADJUSTED NET INCOME (LOSS)
|
|
|
Three Months Ended September 30, 2013 |
|
Three Months Ended September 30, 2012 |
| ||||||||||||||||||||||||||||||||
|
|
|
|
|
|
|
|
|
|
|
Other |
|
|
|
|
|
|
|
|
|
|
|
Other |
|
|
| ||||||||||||
|
|
|
U.S. Car |
|
Int’l Car |
|
Equipment |
|
All Other |
|
Reconciling |
|
|
|
U.S. Car |
|
Int’l Car |
|
Equipment |
|
All Other |
|
Reconciling |
|
|
| ||||||||||||
|
|
|
Rental |
|
Rental |
|
Rental |
|
Operations |
|
Items |
|
Total |
|
Rental |
|
Rental |
|
Rental |
|
Operations |
|
Items |
|
Total |
| ||||||||||||
|
Income (loss) before income taxes |
|
314.1 |
|
105.7 |
|
75.2 |
|
5.8 |
|
(172.5 |
) |
328.3 |
|
304.3 |
|
93.1 |
|
63.0 |
|
7.6 |
|
(99.1 |
) |
368.9 |
| ||||||||||||
|
Adjustments: |
|
|
|
|
|
|
|
|
|
|
|
|
|
|
|
|
|
|
|
|
|
|
|
|
| ||||||||||||
|
Purchase accounting (a): |
|
|
|
|
|
|
|
|
|
|
|
|
|
|
|
|
|
|
|
|
|
|
|
|
| ||||||||||||
|
Direct operating and selling, general and administrative |
|
17.7 |
|
3.0 |
|
9.5 |
|
2.0 |
|
0.5 |
|
32.7 |
|
5.8 |
|
1.9 |
|
10.6 |
|
2.0 |
|
1.1 |
|
21.4 |
| ||||||||||||
|
Depreciation of revenue earning equipment |
|
— |
|
— |
|
— |
|
1.6 |
|
— |
|
1.6 |
|
— |
|
— |
|
— |
|
2.5 |
|
— |
|
2.5 |
| ||||||||||||
|
Non-cash debt charges (b) |
|
2.0 |
|
3.1 |
|
1.1 |
|
4.4 |
|
7.0 |
|
17.6 |
|
5.1 |
|
4.2 |
|
1.1 |
|
0.9 |
|
9.2 |
|
20.5 |
| ||||||||||||
|
Restructuring charges (c) |
|
7.4 |
|
8.6 |
|
1.1 |
|
— |
|
19.2 |
|
36.3 |
|
1.3 |
|
(1.1 |
) |
1.3 |
|
— |
|
— |
|
1.5 |
| ||||||||||||
|
Restructuring related charges (c) |
|
0.1 |
|
2.8 |
|
— |
|
— |
|
— |
|
2.9 |
|
0.5 |
|
1.3 |
|
0.2 |
|
— |
|
— |
|
2.0 |
| ||||||||||||
|
Derivative (gains) losses (c) |
|
0.2 |
|
0.1 |
|
— |
|
— |
|
0.2 |
|
0.5 |
|
— |
|
— |
|
— |
|
(0.1 |
) |
— |
|
(0.1 |
) | ||||||||||||
|
Acquisition related costs (d) |
|
— |
|
— |
|
— |
|
— |
|
3.4 |
|
3.4 |
|
— |
|
— |
|
— |
|
— |
|
8.1 |
|
8.1 |
| ||||||||||||
|
Integration expenses (d) |
|
6.6 |
|
— |
|
— |
|
— |
|
1.7 |
|
8.3 |
|
— |
|
— |
|
— |
|
— |
|
— |
|
— |
| ||||||||||||
|
Relocation costs (d) |
|
— |
|
— |
|
— |
|
— |
|
3.9 |
|
3.9 |
|
— |
|
— |
|
— |
|
— |
|
— |
|
— |
| ||||||||||||
|
Impairment charges and other (c) |
|
44.0 |
|
— |
|
— |
|
— |
|
— |
|
44.0 |
|
— |
|
— |
|
— |
|
— |
|
— |
|
— |
| ||||||||||||
|
Other unusual/non-recurring (c) |
|
(0.3 |
) |
6.1 |
|
0.6 |
|
0.2 |
|
33.4 |
|
40.0 |
|
— |
|
— |
|
— |
|
— |
|
— |
|
— |
| ||||||||||||
|
Adjusted pre-tax income (loss) |
|
391.8 |
|
129.4 |
|
87.5 |
|
14.0 |
|
(103.2 |
) |
519.5 |
|
317.0 |
|
99.4 |
|
76.2 |
|
12.9 |
|
(80.7 |
) |
424.8 |
| ||||||||||||
|
Assumed (provision) benefit for income taxes (e) |
|
(137.1 |
) |
(45.3 |
) |
(30.6 |
) |
(4.9 |
) |
36.1 |
|
(181.8 |
) |
(107.8 |
) |
(33.8 |
) |
(25.9 |
) |
(4.4 |
) |
27.4 |
|
(144.5 |
) | ||||||||||||
|
Adjusted net income (loss) |
|
$ |
254.7 |
|
$ |
84.1 |
|
$ |
56.9 |
|
$ |
9.1 |
|
$ |
(67.1 |
) |
$ |
337.7 |
|
$ |
209.2 |
|
$ |
65.6 |
|
$ |
50.3 |
|
$ |
8.5 |
|
$ |
(53.3 |
) |
$ |
280.3 |
|
|
|
|
Nine Months Ended September 30, 2013 |
|
Nine Months Ended September 30, 2012 |
| ||||||||||||||||||||||||||||||||
|
|
|
|
|
|
|
|
|
|
|
Other |
|
|
|
|
|
|
|
|
|
|
|
Other |
|
|
| ||||||||||||
|
|
|
U.S. Car |
|
Int’l Car |
|
Equipment |
|
All Other |
|
Reconciling |
|
|
|
U.S Car |
|
Int’l Car |
|
Equipment |
|
All Other |
|
Reconciling |
|
|
| ||||||||||||
|
|
|
Rental |
|
Rental |
|
Rental |
|
Operations |
|
Items |
|
Total |
|
Rental |
|
Rental |
|
Rental |
|
Operations |
|
Items |
|
Total |
| ||||||||||||
|
Income (loss) before income taxes |
|
801.5 |
|
76.1 |
|
170.0 |
|
25.8 |
|
(461.0 |
) |
612.4 |
|
611.3 |
|
74.4 |
|
101.1 |
|
16.6 |
|
(312.6 |
) |
490.8 |
| ||||||||||||
|
Adjustments: |
|
|
|
|
|
|
|
|
|
|
|
|
|
|
|
|
|
|
|
|
|
|
|
|
| ||||||||||||
|
Purchase accounting (a): |
|
|
|
|
|
|
|
|
|
|
|
|
|
|
|
|
|
|
|
|
|
|
|
|
| ||||||||||||
|
Direct operating and selling, general and administrative |
|
48.9 |
|
7.2 |
|
30.3 |
|
6.2 |
|
1.6 |
|
94.2 |
|
22.2 |
|
6.1 |
|
31.4 |
|
6.2 |
|
3.0 |
|
68.9 |
| ||||||||||||
|
Depreciation of revenue earning equipment |
|
— |
|
— |
|
— |
|
5.6 |
|
— |
|
5.6 |
|
— |
|
— |
|
— |
|
8.0 |
|
— |
|
8.0 |
| ||||||||||||
|
Non-cash debt charges (b) |
|
5.9 |
|
10.1 |
|
3.4 |
|
4.6 |
|
30.4 |
|
54.4 |
|
16.5 |
|
11.9 |
|
3.7 |
|
3.6 |
|
30.6 |
|
66.3 |
| ||||||||||||
|
Restructuring charges (c) |
|
18.3 |
|
16.6 |
|
2.4 |
|
— |
|
20.3 |
|
57.6 |
|
5.7 |
|
9.8 |
|
7.1 |
|
— |
|
1.7 |
|
24.3 |
| ||||||||||||
|
Restructuring related charges (c) |
|
2.7 |
|
9.5 |
|
— |
|
— |
|
2.0 |
|
14.2 |
|
2.7 |
|
4.1 |
|
1.3 |
|
0.3 |
|
1.9 |
|
10.3 |
| ||||||||||||
|
Derivative (gains) losses (c) |
|
0.2 |
|
0.2 |
|
— |
|
— |
|
0.1 |
|
0.5 |
|
— |
|
0.1 |
|
— |
|
(0.2 |
) |
— |
|
(0.1 |
) | ||||||||||||
|
Acquisition related costs (d) |
|
— |
|
— |
|
— |
|
— |
|
13.7 |
|
13.7 |
|
— |
|
— |
|
— |
|
— |
|
19.6 |
|
19.6 |
| ||||||||||||
|
Integration expenses (d) |
|
12.0 |
|
— |
|
— |
|
— |
|
17.1 |
|
29.1 |
|
— |
|
— |
|
— |
|
— |
|
— |
|
— |
| ||||||||||||
|
Relocation costs (d) |
|
— |
|
— |
|
— |
|
— |
|
4.4 |
|
4.4 |
|
— |
|
— |
|
— |
|
— |
|
— |
|
— |
| ||||||||||||
|
Impairment charges and other (c) |
|
44.0 |
|
— |
|
— |
|
— |
|
— |
|
44.0 |
|
— |
|
— |
|
— |
|
— |
|
— |
|
— |
| ||||||||||||
|
Other unusual/non-recurring (c) |
|
1.1 |
|
6.1 |
|
1.0 |
|
(1.0 |
) |
41.2 |
|
48.4 |
|
— |
|
— |
|
— |
|
— |
|
— |
|
— |
| ||||||||||||
|
Adjusted pre-tax income (loss) |
|
934.6 |
|
125.8 |
|
207.1 |
|
41.2 |
|
(330.2 |
) |
978.5 |
|
658.4 |
|
106.4 |
|
144.6 |
|
34.5 |
|
(255.8 |
) |
688.1 |
| ||||||||||||
|
Assumed (provision) benefit for income taxes (e) |
|
(327.1 |
) |
(44.0 |
) |
(72.5 |
) |
(14.5 |
) |
115.6 |
|
(342.5 |
) |
(223.9 |
) |
(36.2 |
) |
(49.2 |
) |
(11.7 |
) |
87.0 |
|
(234.0 |
) | ||||||||||||
|
Adjusted net income (loss) |
|
$ |
607.5 |
|
$ |
81.8 |
|
$ |
134.6 |
|
$ |
26.7 |
|
$ |
(214.6 |
) |
$ |
636.0 |
|
$ |
434.5 |
|
$ |
70.2 |
|
$ |
95.4 |
|
$ |
22.8 |
|
$ |
(168.8 |
) |
$ |
454.1 |
|
(a) Represents the purchase accounting effects of the acquisition of all of Hertz’s common stock on December 21, 2005 on our results of operations relating to increased depreciation and amortization of tangible and intangible assets and accretion of workers’ compensation and public liability and property damage liabilities. Also represents the purchase accounting effects of certain subsequent acquisitions on our results of operations relating to increased depreciation and amortization of intangible assets.
(b) Represents non-cash debt charges relating to the amortization of deferred debt financing costs and debt discounts.
(c) Amounts are included within direct operating and selling, general and administrative and other (income) expense in our statement of operations.
(d) Amounts are included within selling, general and administrative expense in our statement of operations.
(e) Represents a provision for income taxes derived utilizing a normalized income tax rate (35% for 2013 and 34% for 2012).
Note: Certain adjustments have been reclassified to conform with current period presentation.
Table 7
HERTZ GLOBAL HOLDINGS, INC.
RECONCILIATION OF GAAP TO NON-GAAP EARNINGS MEASURES
(In millions)
Unaudited
FREE CASH FLOW, EBITDA, AND CORPORATE EBITDA
FREE CASH FLOW
|
|
|
Three Months Ended |
|
Nine Months Ended |
| ||||||||
|
|
|
September 30, |
|
September 30, |
| ||||||||
|
|
|
2013 |
|
2012 |
|
2013 |
|
2012 |
| ||||
|
|
|
|
|
|
|
|
|
|
| ||||
|
Income before income taxes |
|
$ |
328.3 |
|
$ |
368.9 |
|
$ |
612.4 |
|
$ |
490.8 |
|
|
Depreciation of property and equipment |
|
47.8 |
|
41.4 |
|
149.5 |
|
125.1 |
| ||||
|
Amortization of intangibles and debt costs |
|
47.9 |
|
40.4 |
|
145.3 |
|
125.0 |
| ||||
|
Cash paid for income taxes |
|
(13.4 |
) |
(5.3 |
) |
(56.4 |
) |
(43.0 |
) | ||||
|
Changes in assets and liabilities, net of effects of acquisitions, and other |
|
330.1 |
|
(26.0 |
) |
153.4 |
|
(100.1 |
) | ||||
|
Net cash provided by (used in) operating activities excluding depreciation of revenue earning equipment |
|
740.7 |
|
419.4 |
|
1,004.2 |
|
597.8 |
| ||||
|
U.S. car rental fleet growth (a) |
|
85.1 |
|
(85.0 |
) |
(489.3 |
) |
(271.8 |
) | ||||
|
International car rental fleet growth (a) |
|
(191.4 |
) |
(192.5 |
) |
(40.2 |
) |
(173.5 |
) | ||||
|
Equipment rental fleet growth (a) |
|
(122.0 |
) |
(186.4 |
) |
(257.8 |
) |
(280.1 |
) | ||||
|
All other operations rental fleet growth (a) |
|
(35.3 |
) |
(2.2 |
) |
(19.1 |
) |
(25.7 |
) | ||||
|
Property and equipment expenditures, net of disposals |
|
(58.6 |
) |
(54.1 |
) |
(184.1 |
) |
(134.8 |
) | ||||
|
Net investment activity |
|
(322.2 |
) |
(520.2 |
) |
(990.5 |
) |
(885.9 |
) | ||||
|
Free cash flow |
|
$ |
418.5 |
|
$ |
(100.8 |
) |
$ |
13.7 |
|
$ |
(288.1 |
) |
(a) Car rental fleet growth is defined as car rental fleet capital expenditures, net of proceeds from disposals, plus car rental fleet depreciation and net car rental fleet financing. Worldwide equipment rental fleet growth is defined as worldwide equipment rental fleet expenditures, net of proceeds from disposals, plus depreciation. All other operations rental fleet growth is defined as all other operations rental fleet capital expenditures, net of proceeds from disposals, plus all other operations rental fleet depreciation and net all other operations rental fleet financing. The calculation reflects the following:
FLEET GROWTH
|
|
|
Three Months Ended September 30, 2013 |
|
Three Months Ended September 30, 2012 |
| ||||||||||||||||||||||||||
|
|
|
U.S Car |
|
Int’l Car |
|
Equipment |
|
All Other |
|
|
|
U.S Car |
|
Int’l Car |
|
Equipment |
|
All Other |
|
|
| ||||||||||
|
|
|
Rental |
|
Rental |
|
Rental |
|
Operations |
|
Total |
|
Rental |
|
Rental |
|
Rental |
|
Operations |
|
Total |
| ||||||||||
|
Revenue earning equipment expenditures |
|
$ |
(1,091.5 |
) |
$ |
(1,102.4 |
) |
$ |
(216.3 |
) |
$ |
(237.8 |
) |
$ |
(2,648.0 |
) |
$ |
(669.6 |
) |
$ |
(939.5 |
) |
$ |
(277.2 |
) |
$ |
(296.3 |
) |
$ |
(2,182.6 |
) |
|
Proceeds from disposal of revenue earning equipment |
|
1,112.7 |
|
660.9 |
|
18.2 |
|
134.5 |
|
1,926.3 |
|
650.4 |
|
387.5 |
|
20.8 |
|
171.8 |
|
1,230.5 |
| ||||||||||
|
Net revenue earning equipment capital expenditures |
|
21.2 |
|
(441.5 |
) |
(198.1 |
) |
(103.3 |
) |
(721.7 |
) |
(19.2 |
) |
(552.0 |
) |
(256.4 |
) |
(124.5 |
) |
(952.1 |
) | ||||||||||
|
Depreciation of revenue earning equipment |
|
342.5 |
|
125.9 |
|
76.1 |
|
107.7 |
|
652.2 |
|
248.1 |
|
125.1 |
|
70.0 |
|
98.4 |
|
541.6 |
| ||||||||||
|
Net financing activity related to car rental fleet |
|
(278.6 |
) |
124.2 |
|
— |
|
(39.7 |
) |
(194.1 |
) |
(313.9 |
) |
234.4 |
|
— |
|
23.9 |
|
(55.6 |
) | ||||||||||
|
Fleet growth |
|
$ |
85.1 |
|
$ |
(191.4 |
) |
$ |
(122.0 |
) |
$ |
(35.3 |
) |
$ |
(263.6 |
) |
$ |
(85.0 |
) |
$ |
(192.5 |
) |
$ |
(186.4 |
) |
$ |
(2.2 |
) |
$ |
(466.1 |
) |
|
|
|
Nine Months Ended September 30, 2013 |
|
Nine Months Ended September 30, 2012 |
| ||||||||||||||||||||||||||
|
|
|
U.S Car |
|
Int’l Car |
|
Equipment |
|
All Other |
|
|
|
U.S Car |
|
Int’l Car |
|
Equipment |
|
All Other |
|
|
| ||||||||||
|
|
|
Rental |
|
Rental |
|
Rental |
|
Operations |
|
Total |
|
Rental |
|
Rental |
|
Rental |
|
Operations |
|
Total |
| ||||||||||
|
Revenue earning equipment expenditures |
|
$ |
(5,771.1 |
) |
$ |
(2,574.1 |
) |
$ |
(581.5 |
) |
$ |
(750.4 |
) |
$ |
(9,677.1 |
) |
$ |
(4,466.7 |
) |
$ |
(2,242.0 |
) |
$ |
(606.5 |
) |
$ |
(952.4 |
) |
$ |
(8,267.6 |
) |
|
Proceeds from disposal of revenue earning equipment |
|
3,513.4 |
|
1,654.2 |
|
100.7 |
|
400.9 |
|
5,669.2 |
|
2,865.2 |
|
1,305.8 |
|
127.3 |
|
540.6 |
|
4,838.9 |
| ||||||||||
|
Net revenue earning equipment capital expenditures |
|
(2,257.7 |
) |
(919.9 |
) |
(480.8 |
) |
(349.5 |
) |
(4,007.9 |
) |
(1,601.5 |
) |
(936.2 |
) |
(479.2 |
) |
(411.8 |
) |
(3,428.7 |
) | ||||||||||
|
Depreciation of revenue earning equipment |
|
953.6 |
|
349.1 |
|
223.0 |
|
321.4 |
|
1,847.1 |
|
712.5 |
|
337.3 |
|
199.1 |
|
282.9 |
|
1,531.8 |
| ||||||||||
|
Net financing activity related to car rental fleet |
|
814.8 |
|
530.6 |
|
— |
|
9.0 |
|
1,354.4 |
|
617.2 |
|
425.4 |
|
— |
|
103.2 |
|
1,145.8 |
| ||||||||||
|
Fleet growth |
|
$ |
(489.3 |
) |
$ |
(40.2 |
) |
$ |
(257.8 |
) |
$ |
(19.1 |
) |
$ |
(806.4 |
) |
$ |
(271.8 |
) |
$ |
(173.5 |
) |
$ |
(280.1 |
) |
$ |
(25.7 |
) |
$ |
(751.1 |
) |
Table 7 (pg. 2)
EBITDA AND CORPORATE EBITDA
|
|
|
Three Months Ended September 30, 2013 |
|
Three Months Ended September 30, 2012 |
| ||||||||||||||||||||||||||||||||
|
|
|
|
|
|
|
|
|
|
|
Other |
|
|
|
|
|
|
|
|
|
|
|
Other |
|
|
| ||||||||||||
|
|
|
U.S Car |
|
Int’l Car |
|
Equipment |
|
All Other |
|
Reconciling |
|
|
|
U.S Car |
|
Int’l Car |
|
Equipment |
|
All Other |
|
Reconciling |
|
|
| ||||||||||||
|
|
|
Rental |
|
Rental |
|
Rental |
|
Operations |
|
Items |
|
Total |
|
Rental |
|
Rental |
|
Rental |
|
Operations |
|
Items |
|
Total |
| ||||||||||||
|
|
|
|
|
|
|
|
|
|
|
|
|
|
|
|
|
|
|
|
|
|
|
|
|
|
| ||||||||||||
|
Income (loss) before income taxes |
|
$ |
314.1 |
|
$ |
105.7 |
|
$ |
75.2 |
|
$ |
5.8 |
|
$ |
(172.5 |
) |
$ |
328.3 |
|
$ |
304.3 |
|
$ |
93.1 |
|
$ |
63.0 |
|
$ |
7.6 |
|
$ |
(99.1 |
) |
$ |
368.9 |
|
|
Depreciation and amortization |
|
389.0 |
|
158.6 |
|
94.0 |
|
110.4 |
|
3.0 |
|
755.0 |
|
277.5 |
|
151.6 |
|
88.3 |
|
101.2 |
|
3.4 |
|
622.0 |
| ||||||||||||
|
Interest, net of interest income |
|
46.1 |
|
31.2 |
|
12.5 |
|
6.3 |
|
82.7 |
|
178.8 |
|
45.4 |
|
33.0 |
|
12.6 |
|
3.7 |
|
59.5 |
|
154.2 |
| ||||||||||||
|
EBITDA |
|
749.2 |
|
295.5 |
|
181.7 |
|
122.5 |
|
(86.8 |
) |
1,262.1 |
|
627.2 |
|
277.7 |
|
163.9 |
|
112.5 |
|
(36.2 |
) |
1,145.1 |
| ||||||||||||
|
Adjustments: |
|
|
|
|
|
|
|
|
|
|
|
|
|
|
|
|
|
|
|
|
|
|
|
|
| ||||||||||||
|
Car rental fleet interest |
|
(46.0 |
) |
(27.4 |
) |
— |
|
(6.5 |
) |
— |
|
(79.9 |
) |
(43.8 |
) |
(29.1 |
) |
— |
|
(3.6 |
) |
— |
|
(76.5 |
) | ||||||||||||
|
Car rental fleet depreciation |
|
(342.5 |
) |
(150.2 |
) |
— |
|
(107.7 |
) |
— |
|
(600.4 |
) |
(248.1 |
) |
(144.0 |
) |
— |
|
(98.4 |
) |
— |
|
(490.5 |
) | ||||||||||||
|
Non-cash expenses and charges (b) |
|
1.9 |
|
3.1 |
|
— |
|
4.5 |
|
11.4 |
|
20.9 |
|
4.9 |
|
4.2 |
|
— |
|
0.9 |
|
7.3 |
|
17.3 |
| ||||||||||||
|
Extraordinary, unusual or non-recurring gains and losses (c) |
|
57.8 |
|
17.5 |
|
1.1 |
|
— |
|
61.7 |
|
138.1 |
|
1.8 |
|
0.2 |
|
1.5 |
|
— |
|
8.1 |
|
11.6 |
| ||||||||||||
|
Corporate EBITDA |
|
$ |
420.4 |
|
$ |
138.5 |
|
$ |
182.8 |
|
$ |
12.8 |
|
$ |
(13.7 |
) |
$ |
740.8 |
|
$ |
342.0 |
|
$ |
109.0 |
|
$ |
165.4 |
|
$ |
11.4 |
|
$ |
(20.8 |
) |
$ |
607.0 |
|
|
|
|
Nine Months Ended September 30, 2013 |
|
Nine Months Ended September 30, 2012 |
| ||||||||||||||||||||||||||||||||
|
|
|
|
|
|
|
|
|
|
|
Other |
|
|
|
|
|
|
|
|
|
|
|
Other |
|
|
| ||||||||||||
|
|
|
U.S Car |
|
Int’l Car |
|
Equipment |
|
All Other |
|
Reconciling |
|
|
|
U.S Car |
|
Int’l Car |
|
Equipment |
|
All Other |
|
Reconciling |
|
|
| ||||||||||||
|
|
|
Rental |
|
Rental |
|
Rental |
|
Operations |
|
Items |
|
Total |
|
Rental |
|
Rental |
|
Rental |
|
Operations |
|
Items |
|
Total |
| ||||||||||||
|
|
|
|
|
|
|
|
|
|
|
|
|
|
|
|
|
|
|
|
|
|
|
|
|
|
| ||||||||||||
|
Income (loss) before income taxes |
|
$ |
801.5 |
|
$ |
76.1 |
|
$ |
170.0 |
|
$ |
25.8 |
|
$ |
(461.0 |
) |
$ |
612.4 |
|
$ |
611.3 |
|
$ |
74.4 |
|
$ |
101.1 |
|
$ |
16.6 |
|
$ |
(312.6 |
) |
$ |
490.8 |
|
|
Depreciation and amortization |
|
1,096.9 |
|
432.4 |
|
278.6 |
|
329.5 |
|
8.8 |
|
2,146.2 |
|
802.1 |
|
423.0 |
|
252.8 |
|
290.7 |
|
10.5 |
|
1,779.1 |
| ||||||||||||
|
Interest, net of interest income |
|
136.7 |
|
85.1 |
|
37.6 |
|
10.5 |
|
265.7 |
|
535.6 |
|
133.3 |
|
93.4 |
|
36.8 |
|
11.9 |
|
191.7 |
|
467.1 |
| ||||||||||||
|
EBITDA |
|
2,035.1 |
|
593.6 |
|
486.2 |
|
365.8 |
|
(186.5 |
) |
3,294.2 |
|
1,546.7 |
|
590.8 |
|
390.7 |
|
319.2 |
|
(110.4 |
) |
2,737.0 |
| ||||||||||||
|
Adjustments: |
|
|
|
|
|
|
|
|
|
|
|
|
|
|
|
|
|
|
|
|
|
|
|
|
| ||||||||||||
|
Car rental fleet interest |
|
(135.1 |
) |
(77.2 |
) |
— |
|
(10.8 |
) |
— |
|
(223.1 |
) |
(129.7 |
) |
(84.6 |
) |
— |
|
(11.6 |
) |
— |
|
(225.9 |
) | ||||||||||||
|
Car rental fleet depreciation |
|
(953.1 |
) |
(407.3 |
) |
— |
|
(321.4 |
) |
— |
|
(1,681.8 |
) |
(713.1 |
) |
(400.2 |
) |
— |
|
(282.9 |
) |
— |
|
(1,396.2 |
) | ||||||||||||
|
Non-cash expenses and charges (b) |
|
5.2 |
|
10.3 |
|
— |
|
4.7 |
|
31.0 |
|
51.2 |
|
15.9 |
|
12.0 |
|
— |
|
3.5 |
|
22.2 |
|
53.6 |
| ||||||||||||
|
Extraordinary, unusual or non-recurring gains and losses (c) |
|
73.9 |
|
32.2 |
|
1.2 |
|
(1.0 |
) |
98.7 |
|
205.0 |
|
8.4 |
|
13.9 |
|
8.4 |
|
0.3 |
|
23.2 |
|
54.2 |
| ||||||||||||
|
Corporate EBITDA |
|
$ |
1,026.0 |
|
$ |
151.6 |
|
$ |
487.4 |
|
$ |
37.3 |
|
$ |
(56.8 |
) |
$ |
1,645.5 |
|
$ |
728.2 |
|
$ |
131.9 |
|
$ |
399.1 |
|
$ |
28.5 |
|
$ |
(65.0 |
) |
$ |
1,222.7 |
|
(b) As defined in the credit agreements for the senior credit facilities, Corporate EBITDA excludes the impact of certain non-cash expenses and charges. The adjustments reflect the following:
NON-CASH EXPENSES AND CHARGES
|
|
|
Three Months Ended September 30, 2013 |
|
Three Months Ended September 30, 2012 |
| ||||||||||||||||||||||||||||||||
|
|
|
|
|
|
|
|
|
|
|
Other |
|
|
|
|
|
|
|
|
|
|
|
Other |
|
|
| ||||||||||||
|
|
|
U.S Car |
|
Int’l Car |
|
Equipment |
|
All Other |
|
Reconciling |
|
|
|
U.S. Car |
|
Int’l Car |
|
Equipment |
|
All Other |
|
Reconciling |
|
|
| ||||||||||||
|
|
|
Rental |
|
Rental |
|
Rental |
|
Operations |
|
Items |
|
Total |
|
Rental |
|
Rental |
|
Rental |
|
Operations |
|
Items |
|
Total |
| ||||||||||||
|
|
|
|
|
|
|
|
|
|
|
|
|
|
|
|
|
|
|
|
|
|
|
|
|
|
| ||||||||||||
|
Non-cash amortization of debt costs included in car rental fleet interest |
|
$ |
1.7 |
|
$ |
3.0 |
|
$ |
— |
|
$ |
4.5 |
|
$ |
— |
|
$ |
9.2 |
|
$ |
4.9 |
|
$ |
4.2 |
|
$ |
— |
|
$ |
1.0 |
|
$ |
— |
|
$ |
10.1 |
|
|
Non-cash stock-based employee compensation charges (†) |
|
— |
|
— |
|
— |
|
— |
|
11.2 |
|
11.2 |
|
— |
|
— |
|
— |
|
— |
|
7.3 |
|
7.3 |
| ||||||||||||
|
Derivative gains |
|
0.2 |
|
0.1 |
|
— |
|
— |
|
0.2 |
|
0.5 |
|
— |
|
— |
|
— |
|
(0.1 |
) |
— |
|
(0.1 |
) | ||||||||||||
|
Total non-cash expenses and charges |
|
$ |
1.9 |
|
$ |
3.1 |
|
$ |
— |
|
$ |
4.5 |
|
$ |
11.4 |
|
$ |
20.9 |
|
$ |
4.9 |
|
$ |
4.2 |
|
$ |
— |
|
$ |
0.9 |
|
$ |
7.3 |
|
$ |
17.3 |
|
(†) Compensation charges include $1.6 million of accelerated stock-based compensation charges recorded as part of restructuring charges.
Table 7 (pg. 3)
|
|
|
Nine Months Ended September 30, 2013 |
|
Nine Months Ended September 30, 2012 |
| ||||||||||||||||||||||||||||||||
|
|
|
|
|
|
|
|
|
|
|
Other |
|
|
|
|
|
|
|
|
|
|
|
Other |
|
|
| ||||||||||||
|
|
|
U.S Car |
|
Int’l Car |
|
Equipment |
|
All Other |
|
Reconciling |
|
|
|
U.S Car |
|
Int’l Car |
|
Equipment |
|
All Other |
|
Reconciling |
|
|
| ||||||||||||
|
|
|
Rental |
|
Rental |
|
Rental |
|
Operations |
|
Items |
|
Total |
|
Rental |
|
Rental |
|
Rental |
|
Operations |
|
Items |
|
Total |
| ||||||||||||
|
|
|
|
|
|
|
|
|
|
|
|
|
|
|
|
|
|
|
|
|
|
|
|
|
|
| ||||||||||||
|
Non-cash amortization of debt costs included in car rental fleet interest |
|
$ |
5.0 |
|
$ |
10.1 |
|
$ |
— |
|
$ |
4.7 |
|
$ |
— |
|
$ |
19.8 |
|
$ |
15.9 |
|
$ |
11.9 |
|
$ |
— |
|
$ |
3.7 |
|
$ |
— |
|
$ |
31.5 |
|
|
Non-cash stock-based employee compensation charges (†) |
|
— |
|
— |
|
— |
|
— |
|
30.9 |
|
30.9 |
|
— |
|
— |
|
— |
|
— |
|
22.2 |
|
22.2 |
| ||||||||||||
|
Derivative gains |
|
0.2 |
|
0.2 |
|
— |
|
— |
|
0.1 |
|
0.5 |
|
— |
|
0.1 |
|
— |
|
(0.2 |
) |
— |
|
(0.1 |
) | ||||||||||||
|
Total non-cash expenses and charges |
|
$ |
5.2 |
|
$ |
10.3 |
|
$ |
— |
|
$ |
4.7 |
|
$ |
31.0 |
|
$ |
51.2 |
|
$ |
15.9 |
|
$ |
12.0 |
|
$ |
— |
|
$ |
3.5 |
|
$ |
22.2 |
|
$ |
53.6 |
|
(†) Compensation charges include $1.6 million of accelerated stock-based compensation charges recorded as part of restructuring charges.
(c) As defined in the credit agreements for the senior credit facilities, Corporate EBITDA excludes the impact of extraordinary, unusual or non-recurring gains or losses or charges or credits. The adjustments reflect the following:
EXTRAORDINARY, UNUSUAL OR NON-RECURRING ITEMS
|
|
|
|
|
|
|
|
|
|
|
|
|
|
|
|
|
|
|
|
|
|
|
|
|
|
|
|
|
|
|
|
|
|
|
|
|
|
|
|
|
|
|
|
|
|
|
|
|
|
|
|
|
|
Three Months Ended September 30, 2013 |
|
Three Months Ended September 30, 2012 |
| ||||||||||||||||||||||||||||||||||||||||||||
|
|
|
|
|
|
|
|
|
|
|
Other |
|
|
|
|
|
|
|
|
|
|
|
Other |
|
|
| ||||||||||||||||||||||||
|
|
|
U.S Car |
|
Int’l Car |
|
Equipment |
|
All Other |
|
Reconciling |
|
|
|
U.S. Car |
|
Int’l Car |
|
Equipment |
|
All Other |
|
Reconciling |
|
|
| ||||||||||||||||||||||||
|
|
|
Rental |
|
Rental |
|
Rental |
|
Operations |
|
Items |
|
Total |
|
Rental |
|
Rental |
|
Rental |
|
Operations |
|
Items |
|
Total |
| ||||||||||||||||||||||||
|
|
|
|
|
|
|
|
|
|
|
|
|
|
|
|
|
|
|
|
|
|
|
|
|
|
| ||||||||||||||||||||||||
|
Restructuring charges |
|
$ |
|
7.4 |
|
$ |
|
8.6 |
|
$ |
|
1.1 |
|
$ |
|
— |
|
$ |
|
19.2 |
|
$ |
|
36.3 |
|
$ |
|
1.3 |
|
$ |
|
(1.1 |
) |
$ |
|
1.3 |
|
$ |
|
— |
|
$ |
|
— |
|
$ |
|
1.5 |
|
|
Restructuring related charges |
|
0.1 |
|
2.8 |
|
— |
|
— |
|
— |
|
2.9 |
|
0.5 |
|
1.3 |
|
0.2 |
|
— |
|
— |
|
2.0 |
| ||||||||||||||||||||||||
|
Acquisition related costs |
|
— |
|
— |
|
— |
|
— |
|
3.4 |
|
3.4 |
|
— |
|
— |
|
— |
|
— |
|
8.1 |
|
8.1 |
| ||||||||||||||||||||||||
|
Relocation costs |
|
— |
|
— |
|
— |
|
— |
|
3.9 |
|
3.9 |
|
— |
|
— |
|
— |
|
— |
|
— |
|
— |
| ||||||||||||||||||||||||
|
Integration expenses |
|
6.6 |
|
— |
|
— |
|
— |
|
1.7 |
|
8.3 |
|
— |
|
— |
|
— |
|
— |
|
— |
|
— |
| ||||||||||||||||||||||||
|
Impairment charges and other |
|
44.0 |
|
— |
|
— |
|
— |
|
— |
|
44.0 |
|
— |
|
— |
|
— |
|
— |
|
— |
|
— |
| ||||||||||||||||||||||||
|
Other |
|
(0.3 |
) |
6.1 |
|
— |
|
— |
|
33.5 |
|
39.3 |
|
— |
|
— |
|
— |
|
— |
|
— |
|
— |
| ||||||||||||||||||||||||
|
Total extraordinary, unusual or non-recurring items |
|
$ |
|
57.8 |
|
$ |
|
17.5 |
|
$ |
|
1.1 |
|
$ |
|
— |
|
$ |
|
61.7 |
|
$ |
|
138.1 |
|
$ |
|
1.8 |
|
$ |
|
0.2 |
|
$ |
|
1.5 |
|
$ |
|
— |
|
$ |
|
8.1 |
|
$ |
|
11.6 |
|
|
|
|
|
|
|
|
|
|
|
|
|
|
|
|
|
|
|
|
|
|
|
|
|
|
|
|
|
|
|
|
|
|
|
|
|
|
|
|
|
|
|
|
|
|
|
|
|
|
|
|
|
|
|
Nine Months Ended September 30, 2013 |
|
Nine Months Ended September 30, 2012 |
| ||||||||||||||||||||||||||||||||||||||||||||
|
|
|
|
|
|
|
|
|
|
|
Other |
|
|
|
|
|
|
|
|
|
|
|
Other |
|
|
| ||||||||||||||||||||||||
|
|
|
U.S Car |
|
Int’l Car |
|
Equipment |
|
All Other |
|
Reconciling |
|
|
|
U.S Car |
|
Int’l Car |
|
Equipment |
|
All Other |
|
Reconciling |
|
|
| ||||||||||||||||||||||||
|
|
|
Rental |
|
Rental |
|
Rental |
|
Operations |
|
Items |
|
Total |
|
Rental |
|
Rental |
|
Rental |
|
Operations |
|
Items |
|
Total |
| ||||||||||||||||||||||||
|
|
|
|
|
|
|
|
|
|
|
|
|
|
|
|
|
|
|
|
|
|
|
|
|
|
| ||||||||||||||||||||||||
|
Restructuring charges |
|
$ |
|
18.3 |
|
$ |
|
16.6 |
|
$ |
|
2.4 |
|
$ |
|
— |
|
$ |
|
20.3 |
|
$ |
|
57.6 |
|
$ |
|
5.7 |
|
$ |
|
9.8 |
|
$ |
|
7.1 |
|
$ |
|
— |
|
$ |
|
1.7 |
|
$ |
|
24.3 |
|
|
Restructuring related charges |
|
2.7 |
|
9.5 |
|
— |
|
— |
|
2.0 |
|
14.2 |
|
2.7 |
|
4.1 |
|
1.3 |
|
0.3 |
|
1.9 |
|
10.3 |
| ||||||||||||||||||||||||
|
Acquisition related costs |
|
— |
|
— |
|
— |
|
— |
|
13.7 |
|
13.7 |
|
— |
|
— |
|
— |
|
— |
|
19.6 |
|
19.6 |
| ||||||||||||||||||||||||
|
Relocation costs |
|
— |
|
— |
|
— |
|
— |
|
4.4 |
|
4.4 |
|
— |
|
— |
|
— |
|
— |
|
— |
|
— |
| ||||||||||||||||||||||||
|
Integration expenses |
|
12.0 |
|
— |
|
— |
|
— |
|
17.1 |
|
29.1 |
|
— |
|
— |
|
— |
|
— |
|
— |
|
— |
| ||||||||||||||||||||||||
|
Impairment charges and other |
|
44.0 |
|
— |
|
— |
|
— |
|
— |
|
44.0 |
|
— |
|
— |
|
— |
|
— |
|
— |
|
— |
| ||||||||||||||||||||||||
|
Other |
|
(3.1 |
) |
6.1 |
|
(1.2 |
) |
(1.0 |
) |
41.2 |
|
42.0 |
|
— |
|
— |
|
— |
|
— |
|
— |
|
— |
| ||||||||||||||||||||||||
|
Total extraordinary, unusual or non-recurring items |
|
$ |
|
73.9 |
|
$ |
|
32.2 |
|
$ |
|
1.2 |
|
$ |
|
(1.0 |
) |
$ |
|
98.7 |
|
$ |
|
205.0 |
|
$ |
|
8.4 |
|
$ |
|
13.9 |
|
$ |
|
8.4 |
|
$ |
|
0.3 |
|
$ |
|
23.2 |
|
$ |
|
54.2 |
|
Table 8
HERTZ GLOBAL HOLDINGS, INC.
RECONCILIATION OF GAAP TO NON-GAAP EARNINGS MEASURES
(In millions, except as noted)
Unaudited
RECONCILIATION FROM OPERATING CASH FLOWS TO EBITDA:
|
|
|
Three Months Ended |
|
Nine Months Ended |
| ||||||||
|
|
|
September 30, |
|
September 30, |
| ||||||||
|
|
|
2013 |
|
2012 |
|
2013 |
|
2012 |
| ||||
|
|
|
|
|
|
|
|
|
|
| ||||
|
Net cash provided by operating activities |
|
$ |
1,393.0 |
|
$ |
960.8 |
|
$ |
2,851.6 |
|
$ |
2,131.2 |
|
|
Amortization of debt costs |
|
(17.7 |
) |
(20.6 |
) |
(54.4 |
) |
(66.0 |
) | ||||
|
Provision for losses on doubtful accounts |
|
(16.9 |
) |
(9.9 |
) |
(38.4 |
) |
(23.5 |
) | ||||
|
Derivative gains (losses) |
|
0.1 |
|
(1.6 |
) |
3.7 |
|
(0.7 |
) | ||||
|
Gain on sale of property and equipment |
|
1.1 |
|
1.2 |
|
2.6 |
|
1.9 |
| ||||
|
Gain (loss) on disposal of business |
|
(0.4 |
) |
9.1 |
|
(1.8 |
) |
8.7 |
| ||||
|
Impairment charges |
|
(40.0 |
) |
— |
|
(40.0 |
) |
— |
| ||||
|
Loss on revaluation of foreign denominated debt |
|
— |
|
— |
|
— |
|
(2.5 |
) | ||||
|
Loss on extinguishment of debt |
|
(27.5 |
) |
— |
|
(27.5 |
) |
— |
| ||||
|
Stock-based compensation charges |
|
(12.8 |
) |
(7.3 |
) |
(32.5 |
) |
(22.3 |
) | ||||
|
Lease charges |
|
24.4 |
|
19.1 |
|
57.7 |
|
63.6 |
| ||||
|
Deferred income taxes |
|
(69.3 |
) |
(73.1 |
) |
(162.8 |
) |
(104.4 |
) | ||||
|
Provision for taxes on income |
|
113.6 |
|
126.0 |
|
258.3 |
|
211.3 |
| ||||
|
Interest expense, net of interest income |
|
178.8 |
|
154.2 |
|
535.6 |
|
467.1 |
| ||||
|
Changes in assets and liabilities |
|
(264.3 |
) |
(12.8 |
) |
(57.9 |
) |
72.6 |
| ||||
|
EBITDA |
|
$ |
1,262.1 |
|
$ |
1,145.1 |
|
$ |
3,294.2 |
|
$ |
2,737.0 |
|
NET CORPORATE DEBT, NET FLEET DEBT AND TOTAL NET DEBT
|
|
|
September 30, |
|
June 30, |
|
December 31, |
|
September 30, |
|
June 30, |
|
December 31, |
|
September 30, |
| |||||||
|
|
|
2013 |
|
2013 |
|
2012 |
|
2012 |
|
2012 |
|
2011 |
|
2011 |
| |||||||
|
|
|
|
|
|
|
|
|
|
|
|
|
|
|
|
| |||||||
|
Total Corporate Debt |
|
$ |
6,887.8 |
|
$ |
7,578.8 |
|
$ |
6,545.3 |
|
$ |
4,784.4 |
|
$ |
4,767.9 |
|
$ |
4,704.8 |
|
$ |
4,942.4 |
|
|
Total Fleet Debt |
|
10,248.5 |
|
10,263.2 |
|
8,903.3 |
|
7,936.5 |
|
7,700.0 |
|
6,612.3 |
|
7,563.9 |
| |||||||
|
Total Debt |
|
$ |
17,136.3 |
|
$ |
17,842.0 |
|
$ |
15,448.6 |
|
$ |
12,720.9 |
|
$ |
12,467.9 |
|
$ |
11,317.1 |
|
$ |
12,506.3 |
|
|
|
|
|
|
|
|
|
|
|
|
|
|
|
|
|
| |||||||
|
Corporate Restricted Cash |
|
|
|
|
|
|
|
|
|
|
|
|
|
|
| |||||||
|
Restricted Cash, less: |
|
$ |
521.3 |
|
$ |
393.2 |
|
$ |
571.6 |
|
$ |
376.8 |
|
$ |
175.4 |
|
$ |
308.0 |
|
$ |
332.8 |
|
|
Restricted Cash Associated with Fleet Debt |
|
(456.6 |
) |
(351.6 |
) |
(494.0 |
) |
(302.2 |
) |
(104.0 |
) |
(213.6 |
) |
(215.6 |
) | |||||||
|
Corporate Restricted Cash |
|
$ |
64.7 |
|
$ |
41.6 |
|
$ |
77.6 |
|
$ |
74.6 |
|
$ |
71.4 |
|
$ |
94.4 |
|
$ |
117.2 |
|
|
|
|
|
|
|
|
|
|
|
|
|
|
|
|
|
| |||||||
|
Net Corporate Debt |
|
|
|
|
|
|
|
|
|
|
|
|
|
|
| |||||||
|
Corporate Debt, less: |
|
$ |
6,887.8 |
|
$ |
7,578.8 |
|
$ |
6,545.3 |
|
$ |
4,784.4 |
|
$ |
4,767.9 |
|
$ |
4,704.8 |
|
$ |
4,942.4 |
|
|
Cash and Cash Equivalents |
|
(548.7 |
) |
(483.1 |
) |
(533.3 |
) |
(453.4 |
) |
(586.2 |
) |
(931.8 |
) |
(385.8 |
) | |||||||
|
Corporate Restricted Cash |
|
(64.7 |
) |
(41.6 |
) |
(77.6 |
) |
(74.6 |
) |
(71.4 |
) |
(94.4 |
) |
(117.2 |
) | |||||||
|
Net Corporate Debt |
|
$ |
6,274.4 |
|
$ |
7,054.1 |
|
$ |
5,934.4 |
|
$ |
4,256.4 |
|
$ |
4,110.3 |
|
$ |
3,678.6 |
|
$ |
4,439.4 |
|
|
|
|
|
|
|
|
|
|
|
|
|
|
|
|
|
| |||||||
|
Net Fleet Debt |
|
|
|
|
|
|
|
|
|
|
|
|
|
|
| |||||||
|
Fleet Debt, less: |
|
$ |
10,248.5 |
|
$ |
10,263.2 |
|
$ |
8,903.3 |
|
$ |
7,936.5 |
|
$ |
7,700.0 |
|
$ |
6,612.3 |
|
$ |
7,563.9 |
|
|
Restricted Cash Associated with Fleet Debt |
|
(456.6 |
) |
(351.6 |
) |
(494.0 |
) |
(302.2 |
) |
(104.0 |
) |
(213.6 |
) |
(215.6 |
) | |||||||
|
Net Fleet Debt |
|
$ |
9,791.9 |
|
$ |
9,911.6 |
|
$ |
8,409.3 |
|
$ |
7,634.3 |
|
$ |
7,596.0 |
|
$ |
6,398.7 |
|
$ |
7,348.3 |
|
|
|
|
|
|
|
|
|
|
|
|
|
|
|
|
|
| |||||||
|
Total Net Debt |
|
$ |
16,066.3 |
|
$ |
16,965.7 |
|
$ |
14,343.7 |
|
$ |
11,890.7 |
|
$ |
11,706.3 |
|
$ |
10,077.3 |
|
$ |
11,787.7 |
|
Table 8 (pg. 2)
|
|
|
Three Months Ended September 30, |
| ||||||||||
|
|
|
U.S. Car Rental |
|
International Car Rental |
| ||||||||
|
TOTAL RPD (a) |
|
2013 |
|
2012 |
|
2013 |
|
2012 |
| ||||
|
|
|
|
|
|
|
|
|
|
| ||||
|
Car rental segment revenues (b) |
|
$ |
1,765.5 |
|
$ |
1,331.0 |
|
$ |
768.6 |
|
$ |
700.6 |
|
|
Advantage sublease revenue |
|
(22.5 |
) |
— |
|
— |
|
— |
| ||||
|
Foreign currency adjustment |
|
— |
|
— |
|
20.5 |
|
26.8 |
| ||||
|
Total rental revenue |
|
$ |
1,743.0 |
|
$ |
1,331.0 |
|
$ |
789.1 |
|
$ |
727.4 |
|
|
Transactions days (in thousands) |
|
36,064 |
|
28,077 |
|
14,278 |
|
13,536 |
| ||||
|
Total RPD (in whole dollars) |
|
$ |
48.33 |
|
$ |
47.40 |
|
$ |
55.27 |
|
$ |
53.74 |
|
|
|
|
Nine Months Ended September 30, |
| ||||||||||
|
|
|
U.S. Car Rental |
|
International Car Rental |
| ||||||||
|
TOTAL RPD (a) |
|
2013 |
|
2012 |
|
2013 |
|
2012 |
| ||||
|
|
|
|
|
|
|
|
|
|
| ||||
|
Car rental segment revenues (b) |
|
$ |
4,848.0 |
|
$ |
3,599.6 |
|
$ |
1,838.3 |
|
$ |
1,754.0 |
|
|
Advantage sublease revenue |
|
(65.0 |
) |
— |
|
— |
|
— |
| ||||
|
Foreign currency adjustment |
|
— |
|
— |
|
34.7 |
|
40.1 |
| ||||
|
Total rental revenue |
|
$ |
4,783.0 |
|
$ |
3,599.6 |
|
$ |
1,873.0 |
|
$ |
1,794.1 |
|
|
Transactions days (in thousands) |
|
100,306 |
|
77,214 |
|
34,553 |
|
33,324 |
| ||||
|
Total RPD (in whole dollars) |
|
$ |
47.68 |
|
$ |
46.62 |
|
$ |
54.21 |
|
$ |
53.84 |
|
|
|
|
Three Months Ended |
|
Nine Months Ended |
| ||||||||
|
EQUIPMENT RENTAL AND RENTAL |
|
September 30, |
|
September 30, |
| ||||||||
|
RELATED REVENUE (a) |
|
2013 |
|
2012 |
|
2013 |
|
2012 |
| ||||
|
|
|
|
|
|
|
|
|
|
| ||||
|
Equipment rental segment revenues |
|
$ |
401.8 |
|
$ |
363.0 |
|
$ |
1,137.1 |
|
$ |
1,000.1 |
|
|
Equipment sales and other revenue |
|
(33.1 |
) |
(30.1 |
) |
(98.6 |
) |
(89.0 |
) | ||||
|
Foreign currency adjustment |
|
3.1 |
|
1.4 |
|
5.8 |
|
3.7 |
| ||||
|
Rental and rental related revenue |
|
$ |
371.8 |
|
$ |
334.3 |
|
$ |
1,044.3 |
|
$ |
914.8 |
|
(a) Based on 12/31/12 foreign exchange rates.
(b) Includes U.S. off-airport revenues of $413.5 million and $372.4 million for the three months ended September 30, 2013 and 2012, respectively, and $1,096.1 and $981.4 million for the nine months ended September 30, 2013 and 2012, respectively. Also includes revenue from licensee transactions, among other items.
Exhibit 1
Non-GAAP Measures: Definitions and Use/Importance
Hertz Global Holdings, Inc. (“Hertz Holdings”) is our top-level holding company. The Hertz Corporation (“Hertz”) is our primary operating company. The term “GAAP” refers to accounting principles generally accepted in the United States of America.
Definitions of non-GAAP measures utilized in Hertz Holdings’ November 4, 2013 Press Release are set forth below. Also set forth below is a summary of the reasons why management of Hertz Holdings and Hertz believes that the presentation of the non-GAAP financial measures included in the Press Release provide useful information regarding Hertz Holdings’ and Hertz’s financial condition and results of operations and additional purposes, if any, for which management of Hertz Holdings and Hertz utilize the non-GAAP measures.
1. Earnings Before Interest, Taxes, Depreciation and Amortization (“EBITDA”) and Corporate EBITDA
EBITDA is defined as net income before net interest expense, income taxes and depreciation (which includes revenue earning equipment lease charges) and amortization. Corporate EBITDA, as presented herein, represents EBITDA as adjusted for car rental fleet interest, car rental fleet depreciation and certain other items, as described in more detail in the accompanying tables.
Management uses EBITDA and Corporate EBITDA as operating performance and liquidity metrics for internal monitoring and planning purposes, including the preparation of our annual operating budget and monthly operating reviews, as well as to facilitate analysis of investment decisions, profitability and performance trends. Further, EBITDA enables management and investors to isolate the effects on profitability of operating metrics such as revenue, operating expenses and selling, general and administrative expenses, which enables management and investors to evaluate our two business segments that are financed differently and have different depreciation characteristics and compare our performance against companies with different capital structures and depreciation policies. We also present Corporate EBITDA as a supplemental measure because such information is utilized in the calculation of financial covenants under Hertz’s senior credit facilities.
EBITDA and Corporate EBITDA are not recognized measurements under GAAP. When evaluating our operating performance or liquidity, investors should not consider EBITDA and Corporate EBITDA in isolation of, or as a substitute for, measures of our financial performance and liquidity as determined in accordance with GAAP, such as net income, operating income or net cash provided by operating activities.
2. Adjusted Pre-Tax Income
Adjusted pre-tax income is calculated as income before income taxes plus non-cash purchase accounting charges, non-cash debt charges relating to the amortization of debt financing costs and debt discounts and certain one-time charges and non-operational items. Adjusted pre-tax income is important to management because it allows management to assess operational performance of our business, exclusive of the items mentioned above. It also allows management to assess the performance of the entire business on the same basis as the segment measure of profitability. Management believes that it is important to investors for the same
reasons it is important to management and because it allows them to assess the operational performance of the Company on the same basis that management uses internally.
3. Adjusted Net Income
Adjusted net income is calculated as adjusted pre-tax income less a provision for income taxes derived utilizing a normalized income tax rate (35% in 2013 and 34% in 2012) and noncontrolling interest. The normalized income tax rate is management’s estimate of our long-term tax rate. Adjusted net income is important to management and investors because it represents our operational performance exclusive of the effects of purchase accounting, non-cash debt charges, one-time charges and items that are not operational in nature or comparable to those of our competitors.
4. Adjusted Diluted Earnings Per Share
Adjusted diluted earnings per share is calculated as adjusted net income divided by, for the three months ended September 30, 2013, 465.0 million which represents the weighted average diluted shares outstanding for the period, for the nine months ended September 30, 2013, 463.7 million which represents the weighted average diluted shares outstanding for the period and for the three months ended September 30, 2012, 445.5 million which represents the approximate number of shares outstanding at September 30, 2012, for the nine months ended September 30, 2012, 447.1 million which represents the average for the period. Adjusted diluted earnings per share is important to management and investors because it represents a measure of our operational performance exclusive of the effects of purchase accounting adjustments, non-cash debt charges, one-time charges and items that are not operational in nature or comparable to those of our competitors.
5. Transaction Days
Transaction days represent the total number of days that vehicles were on rent in a given period.
6. Car Rental Revenue, Total RPD and Total Rental Revenue Per Transaction
Car rental revenue consists of all revenue (including U.S. and International), net of discounts, associated with the rental of cars including charges for optional insurance products, revenue from fleet subleases, and licensee transactions. But for purposes of calculating total revenue per transaction day, or “Total RPD,” we exclude revenue from fleet subleases. Total RPD is calculated as total revenue less revenue from fleet subleases, divided by the total number of transaction days, with all periods adjusted to eliminate the effect of fluctuations in foreign currency. Our management believes eliminating the effect of fluctuations in foreign currency is appropriate so as not to affect the comparability of underlying trends. This statistic is important to our management and investors as it represents the best measurement of the changes in underlying pricing in the car rental business and encompasses the elements in car rental pricing that management has the ability to control.
7. Equipment Rental and Rental Related Revenue
Equipment rental and rental related revenue consists of all revenue, net of discounts, associated with the rental of equipment including charges for delivery, loss damage waivers and fueling, but excluding revenue arising from the sale of equipment, parts and supplies and certain other ancillary revenue. Rental and rental related revenue is adjusted in all periods to eliminate the effect of fluctuations in foreign currency. Our management believes eliminating the effect of
fluctuations in foreign currency is appropriate so as not to affect the comparability of underlying trends. This statistic is important to our management and to investors as it is utilized in the measurement of rental revenue generated per dollar invested in fleet on an annualized basis and is comparable with the reporting of other industry participants.
8. Same Store Revenue Growth/Decline
Same store revenue growth or decline is calculated as the year over year change in revenue for locations that are open at the end of the period reported and have been operating under our direction for more than twelve months. The same store revenue amounts are adjusted in all periods to eliminate the effect of fluctuations in foreign currency. Our management believes eliminating the effect of fluctuations in foreign currency is appropriate so as not to affect the comparability of underlying trends.
9. Free Cash Flow
Free cash flow is calculated as Net cash provided by operating activities less revenue earning equipment expenditures, net of disposal proceeds and car rental fleet financing, less non-fleet capital expenditures, net of non-fleet disposals. Free cash flow is important to management and investors as it represents the cash available for acquisitions and the reduction of corporate debt.
10. Net Corporate Debt
Net corporate debt is calculated as total debt excluding fleet debt less cash and equivalents and corporate restricted cash. Corporate debt consists of our Senior Term Facility; Senior ABL Facility; Senior Notes; Senior Subordinated Notes, Convertible Senior Notes; and certain other indebtedness of our domestic and foreign subsidiaries. Net Corporate Debt is important to management, investors and ratings agencies as it helps measure our leverage. Net Corporate Debt also assists in the evaluation of our ability to service our non-fleet-related debt without reference to the expense associated with the fleet debt, which is fully collateralized by assets not available to lenders under the non-fleet debt facilities.
11. Corporate Restricted Cash (used in the calculation of Net Corporate Debt)
Total restricted cash includes cash and cash equivalents that are not readily available for our normal disbursements. Total restricted cash and equivalents are restricted for the purchase of revenue earning vehicles and other specified uses under our Fleet Debt facilities, our like-kind exchange programs and to satisfy certain of our self-insurance regulatory reserve requirements. Corporate restricted cash is calculated as total restricted cash less restricted cash associated with fleet debt.
12. Net Fleet Debt
Net fleet debt is calculated as total fleet debt less restricted cash associated with fleet debt. As of September 30, 2013, fleet debt consists of HVF U.S. Fleet Variable Funding Notes, HVF U.S. Fleet Medium Term Notes, RCFC U.S. Fleet Variable Funding Notes, RCFC U.S. Fleet Medium Term Notes, HFLF Variable Funding Notes, U.S. Fleet Financing Facility, European Revolving Credit Facility, European Fleet Notes, European Securitization, Hertz-Sponsored Canadian Securitization, Dollar Thrifty-Sponsored Canadian Securitization, Australian Securitization, Brazilian Fleet Financing and Capitalized Leases relating to revenue earning equipment. This measure is important to management, investors and ratings agencies as it helps measure our leverage.
13. Restricted Cash Associated with Fleet Debt (used in the calculation of Net Fleet Debt and Corporate Restricted Cash)
Restricted cash associated with fleet debt is restricted for the purchase of revenue earning vehicles and other specified uses under our Fleet Debt facilities and our car rental like-kind exchange program.
14. Total Net Debt
Total net debt is calculated as net corporate debt plus net fleet debt. This measure is important to management, investors and ratings agencies as it helps measure our leverage.