Attached files
| file | filename |
|---|---|
| EX-23.2 - CONSENT OF DEGOLYER AND MACNAUGHTON - ROAN RESOURCES, INC. | exhibit232a.htm |
| EX-23.1 - CONSENT OF KPMG LLP - ROAN RESOURCES, INC. | exhibit231a.htm |
| EX-32.2 - CERTIFICATION OF CFO SECTION 906 - ROAN RESOURCES, INC. | yeexhibit322a.htm |
| EX-31.1 - CERTIFICATION OF CEO SECTION 302 - ROAN RESOURCES, INC. | yeexhibit311a.htm |
| EX-31.2 - CERTIFICATION OF CFO SECTION 302 - ROAN RESOURCES, INC. | yeexhibit312a.htm |
| EX-32.1 - CERTIFICATION OF CEO SECTION 906 - ROAN RESOURCES, INC. | yeexhibit321a.htm |
| EX-99.1 - 2012 REPORT OF DEGOLYER AND MACNAUGHTON - ROAN RESOURCES, INC. | yeexhibit991a.htm |
UNITED STATES SECURITIES AND EXCHANGE COMMISSION
WASHINGTON, D.C. 20549
Form 10-K/A
Amendment No. 1
x | ANNUAL REPORT PURSUANT TO SECTION 13 OR 15 (d) OF THE SECURITIES EXCHANGE ACT OF 1934 |
For the fiscal year ended December 31, 2012
¨ | TRANSITION REPORT PURSUANT TO SECTION 13 OR 15 (d) OF THE SECURITIES EXCHANGE ACT OF 1934 |
Commission file number: 000-51719

LINN ENERGY, LLC
(Exact name of registrant as specified in its charter)
Delaware | 65-1177591 | |
(State or other jurisdiction of incorporation or organization) | (I.R.S. Employer Identification No.) | |
600 Travis, Suite 5100 Houston, Texas | 77002 | |
(Address of principal executive offices) | (Zip Code) | |
Registrant’s telephone number, including area code
(281) 840-4000
Securities registered pursuant to Section 12(b) of the Act:
Title of each class | Name of each exchange on which registered | |
Units Representing Limited Liability Company Interests | The NASDAQ Global Select Market | |
Securities registered pursuant to Section 12(g) of the Act:
None
Indicate by check mark if the registrant is a well-known seasoned issuer, as defined in Rule 405 of the Securities
Act. Yes x No ¨
Indicate by check mark if the registrant is not required to file reports pursuant to Section 13 or Section 15(d) of the Exchange Act. Yes ¨ No x
Indicate by check mark whether the registrant (1) has filed all reports required to be filed by Section 13 or 15(d) of the Securities Exchange Act of 1934 during the preceding 12 months (or for such shorter period that the registrant was required to file such reports), and (2) has been subject to such filing requirements for the past 90 days.
Yes x No ¨
Indicate by check mark whether the registrant has submitted electronically and posted on its corporate Website, if any, every Interactive Data File required to be submitted and posted pursuant to Rule 405 of Regulation S-T (§232.405) during the preceding 12 months (or for such shorter period that the registrant was required to submit and post such files).
Yes x No ¨
Indicate by check mark if disclosure of delinquent filers pursuant to Item 405 of Regulation S-K is not contained herein, and will not be contained, to the best of registrant’s knowledge, in definitive proxy or information statements incorporated by reference in Part III of this Form 10-K or any amendment to this Form 10-K. x
Indicate by check mark whether the registrant is a large accelerated filer, an accelerated filer, a non-accelerated filer, or a smaller reporting company. See the definitions of “large accelerated filer,” “accelerated filer” and “smaller reporting company” in Rule 12b-2 of the Exchange Act.
Large accelerated filer x Accelerated filer ¨ Non-accelerated filer ¨ Smaller reporting company ¨
Indicate by check-mark whether the registrant is a shell company (as defined in Rule 12b-2 of the Act).
Yes ¨ No x
The aggregate market value of voting and non-voting common equity held by non-affiliates of the registrant was approximately $7.5 billion on June 30, 2012, based on $38.10 per unit, the last reported sales price of the units on the NASDAQ Global Select Market on such date.
As of January 31, 2013, there were 235,129,742 units outstanding.
Documents Incorporated By Reference:
None
EXPLANATORY NOTE
Linn Energy, LLC (“LINN Energy” or the “Company”) is filing this Amendment No. 1 on Form 10-K/A (the “Amended Filing”) to the Company’s Annual Report on Form 10-K for the year ended December 31, 2012 (the “Original Filing”) filed with the Securities and Exchange Commission (“SEC”) on February 21, 2013. In connection with LinnCo, LLC’s (“LinnCo”) acquisition of Berry Petroleum Company, the Company and LinnCo filed a Registration Statement on Form S-4 and subsequent amendments to the S-4 (as amended, the “S-4”) to address the SEC’s comments to the S-4 and the Original Filing. This Amended Filing is being filed to conform the disclosures in the Annual Report on Form 10-K with the disclosures made in the S-4.
For the convenience of the reader, this Amended Filing sets forth the Original Filing in its entirety, as modified and superseded where necessary to reflect the revisions. In the Amended Filing, the Company has updated:
(a) Item 1. Business to include additional disclosure regarding the Company’s commodity hedging, among other revisions;
(b) Item 1A. Risk Factors;
(c) Item 5. Market for Registrant’s Common Equity, Related Stockholder Matters and Issuer Purchases of Equity Securities;
(d) Item 6. Selected Financial Data;
(e) Item 7. Management’s Discussion and Analysis of Financial Condition and Results of Operations to add additional disclosures regarding the Company’s commodity hedging, its board of directors determination of the amount of cash distributions to pay unitholders (including discretionary reductions for a portion of oil and natural gas development costs) and gains (losses) on oil and natural gas derivatives and voluntarily remove non-GAAP financial measures, among other revisions;
(f) Item 7A. Quantitative and Qualitative Disclosures About Market Risk to revise disclosures with respect to commodity hedging transactions;
(g) Items 10. through 14. of Part III to include information that was previously omitted;
(h) Item 15. Exhibits and Financial Statement Schedules, and
(i) Exhibit 99.1. Report of DeGolyer and MacNaughton to include a discussion regarding the inherent uncertainties of reserves estimates.
In accordance with Rule 12b-15 under the Securities Exchange Act of 1934, as amended, this Amended Filing includes certifications from our Chief Executive Officer and Chief Financial Officer dated as of the date of this filing.
The Amended Filing continues to speak as of the date of the Original Filing and, except as set forth in the sections indicated above, the Company has not updated the Original Filing to reflect events occurring subsequently to the date of the Original Filing. Accordingly, this Amended Filing should be read in conjunction with the Company’s filings made with the SEC subsequent to the filing of the Original Filing.
TABLE OF CONTENTS
Page | ||
i
GLOSSARY OF TERMS
As commonly used in the oil and natural gas industry and as used in this Annual Report on Form 10-K, the following terms have the following meanings:
Basin. A large area with a relatively thick accumulation of sedimentary rocks.
Bbl. One stock tank barrel or 42 United States (“U.S.”) gallons liquid volume.
Bcf. One billion cubic feet.
Bcfe. One billion cubic feet equivalent, determined using a ratio of six Mcf of natural gas to one Bbl of oil, condensate or natural gas liquids.
Btu. One British thermal unit, which is the heat required to raise the temperature of a one-pound mass of water from 58.5 degrees to 59.5 degrees Fahrenheit.
Development well. A well drilled within the proved area of a reservoir to the depth of a stratigraphic horizon known to be productive.
Dry hole or well. A well found to be incapable of producing hydrocarbons in sufficient quantities such that proceeds from the sale of such production would exceed production expenses and taxes.
Field. An area consisting of a single reservoir or multiple reservoirs all grouped on or related to the same individual geological structural feature and/or stratigraphic condition.
Formation. A stratum of rock that is recognizable from adjacent strata consisting mainly of a certain type of rock or combination of rock types with thickness that may range from less than two feet to hundreds of feet.
Gross acres or gross wells. The total acres or wells, as the case may be, in which a working interest is owned.
MBbls. One thousand barrels of oil or other liquid hydrocarbons.
MBbls/d. MBbls per day.
Mcf. One thousand cubic feet.
Mcfe. One thousand cubic feet equivalent, determined using the ratio of six Mcf of natural gas to one Bbl of oil, condensate or natural gas liquids.
MMBbls. One million barrels of oil or other liquid hydrocarbons.
MMBoe. One million barrels of oil equivalent, determined using a ratio of one Bbl of oil, condensate or natural gas liquids to six Mcf.
MMBtu. One million British thermal units.
MMcf. One million cubic feet.
MMcf/d. MMcf per day.
MMcfe. One million cubic feet equivalent, determined using a ratio of six Mcf of natural gas to one Bbl of oil, condensate or natural gas liquids.
MMcfe/d. MMcfe per day.
MMMBtu. One billion British thermal units.
ii
GLOSSARY OF TERMS - Continued
Net acres or net wells. The sum of the fractional working interests owned in gross acres or gross wells, as the case may be.
NGL. Natural gas liquids, which are the hydrocarbon liquids contained within natural gas.
Productive well. A well that is found to be capable of producing hydrocarbons in sufficient quantities such that proceeds from the sale of such production exceeds production expenses and taxes.
Proved developed reserves. Reserves that can be expected to be recovered through existing wells with existing equipment and operating methods or in which the cost of the required equipment is relatively minor compared to the cost of a new well. Additional reserves expected to be obtained through the application of fluid injection or other improved recovery techniques for supplementing the natural forces and mechanisms of primary recovery are included in “proved developed reserves” only after testing by a pilot project or after the operation of an installed program has confirmed through production response that increased recovery will be achieved.
Proved reserves. Reserves that by analysis of geoscience and engineering data can be estimated with reasonable certainty to be economically producible from a given date forward, from known reservoirs, and under existing economic conditions, operating methods, and government regulations prior to the time at which contracts providing the right to operate expire, unless evidence indicates that renewal is reasonably certain. The project to extract the hydrocarbons must have commenced or the operator must be reasonably certain that it will commence the project within a reasonable time.
Proved undeveloped drilling location. A site on which a development well can be drilled consistent with spacing rules for purposes of recovering proved undeveloped reserves.
Proved undeveloped reserves or PUDs. Reserves that are expected to be recovered from new wells on undrilled acreage, or from existing wells where a relatively major expenditure is required for recompletion. Reserves on undrilled acreage are limited to those directly offsetting development spacing areas that are reasonably certain of production when drilled, unless evidence using reliable technology exists that establishes reasonable certainty of economic producibility at greater distances. Undrilled locations can be classified as having undeveloped reserves only if a development plan has been adopted indicating that they are scheduled to be drilled within five years, unless the specific circumstances justify a longer time. Estimates for proved undeveloped reserves are not attributed to any acreage for which an application of fluid injection or other improved recovery technique is contemplated, unless such techniques have been proved effective by actual projects in the same reservoir or an analogous reservoir, or by other evidence using reliable technology establishing reasonable certainty.
Recompletion. The completion for production of an existing wellbore in another formation from that which the well has been previously completed.
Reservoir. A porous and permeable underground formation containing a natural accumulation of economically productive natural gas and/or oil that is confined by impermeable rock or water barriers and is individual and separate from other reserves.
Royalty interest. An interest that entitles the owner of such interest to a share of the mineral production from a property or to a share of the proceeds there from. It does not contain the rights and obligations of operating the property and normally does not bear any of the costs of exploration, development and operation of the property.
Spacing. The number of wells which conservation laws allow to be drilled on a given area of land.
Standardized measure of discounted future net cash flows. The present value of estimated future net revenues to be generated from the production of proved reserves, determined in accordance with the regulations of the Securities and Exchange Commission (“SEC”), without giving effect to non-property related expenses such as general and administrative expenses, debt service, future income tax expenses or depreciation, depletion and amortization; discounted using an annual discount rate of 10%.
Tcfe. One trillion cubic feet equivalent, determined using the ratio of six Mcf of natural gas to one Bbl of oil, condensate or natural gas liquids.
iii
GLOSSARY OF TERMS - Continued
Undeveloped acreage. Lease acreage on which wells have not been drilled or completed to a point that would permit the production of commercial quantities of oil, natural gas and NGL regardless of whether such acreage contains proved reserves.
Unproved reserves. Reserves that are considered less certain to be recovered than proved reserves. Unproved reserves may be further sub-classified to denote progressively increasing uncertainty of recoverability and include probable reserves and possible reserves.
Working interest. The operating interest that gives the owner the right to drill, produce and conduct operating activities on the property and a share of production.
Workover. Maintenance on a producing well to restore or increase production.
Zone. A stratigraphic interval containing one or more reservoirs.
iv
Part I
Item 1. Business
This Annual Report on Form 10-K contains forward-looking statements based on expectations, estimates and projections as of the date of this filing. These statements by their nature are subject to risks, uncertainties and assumptions and are influenced by various factors. As a consequence, actual results may differ materially from those expressed in the forward-looking statements. For more information, see “Forward-Looking Statements” included at the end of this Item 1. “Business” and see also Item 1A. “Risk Factors.”
References
When referring to Linn Energy, LLC (“LINN Energy” or the “Company”), the intent is to refer to LINN Energy and its consolidated subsidiaries as a whole or on an individual basis, depending on the context in which the statements are made.
A reference to a “Note” herein refers to the accompanying Notes to Consolidated Financial Statements contained in Item 8. “Financial Statements and Supplementary Data.”
Overview
LINN Energy’s mission is to acquire, develop and maximize cash flow from a growing portfolio of long-life oil and natural gas assets. LINN Energy is an independent oil and natural gas company that began operations in March 2003 and completed its initial public offering (“IPO”) in January 2006. The Company’s properties are located in the United States (“U.S.”), in the Mid-Continent, the Hugoton Basin, the Green River Basin, the Permian Basin, Michigan, Illinois, the Williston/Powder River Basin, California and east Texas.
Proved reserves at December 31, 2012, were 4,796 Bcfe, of which approximately 24% were oil, 54% were natural gas and 22% were natural gas liquids (“NGL”). Approximately 65% were classified as proved developed, with a total standardized measure of discounted future net cash flows of $6.1 billion. At December 31, 2012, the Company operated 11,048 or 70% of its 15,804 gross productive wells and had an average proved reserve-life index of approximately 16 years, based on the December 31, 2012, reserve report and fourth quarter 2012 annualized production.
Strategy
The Company’s primary goal is to provide stability and growth of distributions for the long-term benefit of its unitholders. The following is a summary of the key elements of the Company’s business strategy:
• | grow through acquisition of long-life, high quality properties; |
• | efficiently operate and develop acquired properties; and |
• | reduce cash flow volatility through hedging. |
The Company’s business strategy is discussed in more detail below.
Grow Through Acquisition of Long-Life, High Quality Properties
The Company’s acquisition program targets oil and natural gas properties that it believes will be financially accretive and offer stable, long-life, high quality production with relatively predictable decline curves, as well as lower-risk development opportunities. The Company evaluates acquisitions based on rate of return, field cash flow, operational efficiency, reserve life, development costs and decline profile. As part of this strategy, the Company continually seeks to optimize its asset portfolio, which may include the divestiture of noncore assets. This allows the Company to redeploy capital into projects to develop lower-risk, long-life and low-decline properties that are better suited to its business strategy.
Since January 1, 2007, excluding three acquisitions of Appalachian Basin properties sold in July 2008, the Company has completed 40 acquisitions of working and royalty interests in oil and natural gas properties and related gathering and pipeline assets. Total acquired proved reserves at the date of acquisition were approximately 4.5 Tcfe with acquisition costs of approximately $2.01 per Mcfe. Estimates of proved reserves at the date of acquisition were primarily prepared by the independent engineering firm, DeGolyer and MacNaughton. The Company finances acquisitions with a combination of
1
Item 1. Business - Continued
funds from equity and debt offerings, bank borrowings and net cash provided by operating activities. See Note 2 for additional details about the Company’s acquisitions.
Efficiently Operate and Develop Acquired Properties
The Company has centralized the operation of its acquired properties into defined operating regions to minimize operating costs and maximize production and capital efficiency. The Company maintains a large inventory of drilling and optimization projects within each region to achieve organic growth from its capital development program. The Company generally seeks to be the operator of its properties so that it can develop drilling programs and optimization projects that not only replace production, but add value through reserve and production growth and future operational synergies. The development program is focused on lower-risk, repeatable drilling opportunities to maintain and/or grow net cash provided by operating activities. Many of the wells are completed in multiple producing zones with commingled production and long economic lives. In addition, the Company seeks to deliver attractive financial returns by leveraging its experienced workforce and scalable infrastructure. For 2013, the Company estimates its total capital expenditures, excluding acquisitions, will be approximately $1.2 billion, including $1.1 billion related to its oil and natural gas capital program and $67 million related to its plant and pipeline capital. This estimate is under continuous review and is subject to ongoing adjustments. The Company expects to fund these capital expenditures primarily with net cash provided by operating activities and bank borrowings.
Reduce Cash Flow Volatility Through Hedging
An important part of the Company’s business strategy includes hedging a significant portion of its forecasted production to reduce exposure to fluctuations in the prices of oil and natural gas and provide long-term cash flow predictability to manage its business, service debt and pay distributions. The current direct NGL hedging market is constrained in terms of price, volume, duration and number of counterparties, which limits the Company’s ability to effectively hedge its NGL production. As a result, currently, the Company directly hedges only its oil and natural gas production. By removing a significant portion of the price volatility associated with future production, the Company expects to mitigate, but not eliminate, the potential effects of variability in net cash provided by operating activities due to fluctuations in commodity prices.
The Company enters into commodity hedging transactions primarily in the form of swap contracts that are designed to provide a fixed price and, from time to time, put options that are designed to provide a fixed price floor with the opportunity for upside. The Company enters into these transactions with respect to a portion of its projected production to provide an economic hedge of the risk related to the future commodity prices received. The Company does not enter into derivative contracts for trading purposes.
The Company maintains a substantial portion of its hedges in the form of swap contracts. From time to time, the Company has chosen to purchase put option contracts primarily in connection with acquisition activity to hedge volumes in excess of those already hedged with swap contracts. Put options require the payment of a premium, which the Company pays in cash at the time of execution and no additional amounts are payable in the future under the contracts. The appropriate level of production to be hedged is an ongoing consideration and is based on a variety of factors, including current and future expected commodity market prices, cost and availability of put option contracts, the level of acquisition activity and the Company’s overall risk profile, including leverage and size and scale considerations. As a result, the appropriate percentage of production volumes to be hedged may change over time.
In certain historical periods, the Company paid an incremental premium to increase the fixed price floors on existing put options because the Company typically hedges multiple years in advance and in some cases commodity prices had increased significantly beyond the initial hedge prices. As a result, the Company determined that the existing put option strike prices did not provide reasonable downside protection in the context of the current market.
For additional details about the Company’s commodity derivatives, see Item 7. “Management’s Discussion and Analysis of Financial Condition and Results of Operations” and Item 7A. “Quantitative and Qualitative Disclosures About Market Risk.” See also Note 7 and Note 8.
In addition, the Company may from time to time enter into derivative contracts in the form of interest rate swaps to minimize the effects of fluctuations in interest rates. Currently, the Company has no outstanding interest rate swaps.
2
Item 1. Business - Continued
Recent Developments
LinnCo Initial Public Offering
On October 17, 2012, LinnCo, LLC (“LinnCo”), an affiliate of LINN Energy, completed its initial public offering (the “LinnCo IPO”) of 34,787,500 common shares representing limited liability company interests (“Common Shares”) for net proceeds of approximately $1.2 billion. The net proceeds LinnCo received from the offering were used to acquire 34,787,500 LINN Energy units which are equal to the number of LinnCo shares sold in the offering. The Company used the proceeds from the sale of the units to LinnCo to pay the expenses of the offering and repay a portion of the outstanding indebtedness under its Credit Facility.
LinnCo is a Delaware limited liability company formed on April 30, 2012, under the Delaware Limited Liability Company Act and its Common Shares are listed on the NASDAQ Global Select Market under the symbol “LNCO.” LinnCo’s sole purpose is to own units in LINN Energy and it expects to have no significant assets or operations other than those related to its interest in LINN Energy. At December 31, 2012, LINN Energy owned 100% of LinnCo’s sole voting share and all of LinnCo’s Common Shares were held by the public. At December 31, 2012, LinnCo owned approximately 15% of LINN Energy’s outstanding units.
Acquisitions
On July 31, 2012, the Company completed the acquisition of certain oil and natural gas properties in the Jonah Field located in the Green River Basin of southwest Wyoming from BP America Production Company (“BP”) for total consideration of approximately $990 million. The acquisition included approximately 806 Bcfe of proved reserves as of the acquisition date.
On May 1, 2012, the Company completed the acquisition of certain oil and natural gas properties located in east Texas for total consideration of approximately $168 million. The acquisition included approximately 110 Bcfe of proved reserves as of the acquisition date.
On April 3, 2012, the Company entered into a joint-venture agreement (“JV Agreement”) with an affiliate of Anadarko Petroleum Corporation (“Anadarko”) whereby the Company participates as a partner in the CO2 enhanced oil recovery development of the Salt Creek Field, located in the Powder River Basin of Wyoming. Anadarko assigned the Company 23% of its interest in the field in exchange for future funding of $400 million of Anadarko’s development costs. As of December 31, 2012, the Company has paid approximately $201 million towards the future funding commitment. The acquisition included approximately 16 MMBoe (96 Bcfe) of proved reserves as of the JV Agreement date.
On March 30, 2012, the Company completed the acquisition of certain oil and natural gas properties and the Jayhawk natural gas processing plant located in the Hugoton Basin in Kansas from BP for total consideration of approximately $1.16 billion. The acquisition included approximately 689 Bcfe of proved reserves as of the acquisition date.
During 2012, the Company completed other smaller acquisitions of oil and natural gas properties located in its various operating regions. The Company, in the aggregate, paid approximately $122 million in total consideration for these properties.
Proved reserves as of the acquisition date for all of the above referenced acquisitions were estimated using the average oil and natural gas prices during the preceding 12-month period, determined as an unweighted average of the first-day-of-the-month prices for each month. Estimates of proved reserves as of the acquisition date for all of the above referenced acquisitions as well as estimates of proved reserves at December 31, 2012, were prepared by the independent engineering firm, DeGolyer and MacNaughton.
The Company regularly engages in discussions with potential sellers regarding acquisition opportunities. Such acquisition efforts may involve its participation in auction processes, as well as situations in which the Company believes it is the only party or one of a very limited number of potential buyers in negotiations with the potential seller. These acquisition efforts can involve assets that, if acquired, would have a material effect on its financial condition and results of operations.
3
Item 1. Business - Continued
Distributions
On January 24, 2013, the Company’s Board of Directors declared a cash distribution of $0.725 per unit, or $2.90 per unit on an annualized basis, with respect to the fourth quarter of 2012. The distribution, totaling approximately $170 million, was paid on February 14, 2013, to unitholders of record as of the close of business on February 7, 2013.
Operating Regions
The Company’s properties are located in eight operating regions in the U.S.:
• | Mid-Continent, which includes properties in Oklahoma, Louisiana and the eastern portion of the Texas Panhandle (including the Granite Wash and Cleveland horizontal plays); |
• | Hugoton Basin, which includes properties located primarily in Kansas and the Shallow Texas Panhandle; |
• | Green River Basin, which includes properties located in southwest Wyoming; |
• | Permian Basin, which includes areas in west Texas and southeast New Mexico; |
• | Michigan/Illinois, which includes the Antrim Shale formation in the northern part of Michigan and oil properties in southern Illinois; |
• | Williston/Powder River Basin, which includes the Bakken formation in North Dakota and the Powder River Basin in Wyoming; |
• | California, which includes the Brea Olinda Field of the Los Angeles Basin; and |
• | East Texas, which includes properties located in east Texas. |
Mid-Continent
The Mid-Continent region includes properties located in Oklahoma, Louisiana and the eastern portion of the Texas Panhandle (including the Granite Wash and Cleveland horizontal plays). Wells in this diverse region produce from both oil and natural gas reservoirs at depths ranging from 1,500 feet to over 18,000 feet. The Granite Wash formation and other shallower producing horizons are currently being developed using horizontal drilling and multi-stage stimulations. In the northern Texas Panhandle and extending into western Oklahoma, the Cleveland formation is being developed as a horizontal oil play. Elsewhere in Oklahoma, several producing formations are being targeted using similar horizontal drilling and completion technologies. The majority of wells in this region are mature, low-decline oil and natural gas wells.
Mid-Continent proved reserves represented approximately 34% of total proved reserves at December 31, 2012, of which 59% were classified as proved developed. This region produced 313 MMcfe/d or 48% of the Company’s 2012 average daily production. During 2012, the Company invested approximately $578 million to drill in this region. During 2013, the Company anticipates spending approximately 49% of its total oil and natural gas capital budget for development activities in the Mid-Continent region, primarily in the Granite Wash formation.
To more efficiently transport its natural gas in the Mid-Continent region to market, the Company owns and operates a network of natural gas gathering systems comprised of approximately 300 miles of pipeline and associated compression and metering facilities. In connection with the horizontal development activities in the Granite Wash formation, the Company continues to expand this gathering system which connects to numerous natural gas processing facilities in the region.
Hugoton Basin
The Hugoton Basin is a large oil and natural gas producing area located in the central portion of the Texas Panhandle extending into southwestern Kansas. The Company’s Texas properties in the basin primarily produce from the Brown Dolomite formation at depths of approximately 3,200 feet. The Company’s Kansas properties in the basin, acquired in March 2012, primarily produce from the Council Grove and Chase formations at depths ranging from 2,500 feet to 3,000 feet. Hugoton Basin proved reserves represented approximately 21% of total proved reserves at December 31, 2012, of which 85% were classified as proved developed. This region produced 120 MMcfe/d or 18% of the Company’s 2012 average daily production. During 2012, the Company invested approximately $11 million to drill in this region. During 2013, the Company anticipates spending approximately 3% of its total oil and natural gas capital budget for development activities in the Hugoton Basin region.
4
Item 1. Business - Continued
To more efficiently transport its natural gas in the Texas Panhandle to market, the Company owns and operates a network of natural gas gathering systems comprised of approximately 665 miles of pipeline and associated compression and metering facilities that connect to numerous sales outlets in the area. The Company also owns and operates the Jayhawk natural gas processing plant in southwestern Kansas with a capacity of approximately 450 MMcfe/d, allowing it to extract maximum value from the liquids-rich natural gas produced in the area. The Company’s production in the area is delivered to the plant via a system of approximately 2,100 miles of pipeline and related facilities operated by the Company, of which approximately 250 miles of pipeline are owned by the Company.
Green River Basin
The Green River Basin region consists of properties acquired in July 2012. These properties are located in southwest Wyoming and primarily produce natural gas at depths ranging from 8,000 feet to 12,000 feet. Green River Basin proved reserves represented approximately 21% of total proved reserves at December 31, 2012, of which 43% were classified as proved developed. This region produced 62 MMcfe/d or 9% of the Company’s 2012 average daily production. During 2012, the Company invested approximately $22 million to drill in this region. During 2013, the Company anticipates spending approximately 12% of its total oil and natural gas capital budget for development activities in the Green River Basin region.
Permian Basin
The Permian Basin is one of the largest and most prolific oil and natural gas basins in the U.S. The Company’s properties are located in west Texas and southeast New Mexico and produce at depths ranging from 2,000 feet to 12,000 feet. The Wolfberry trend is located in the north central portion of the basin where the Company has been actively drilling vertical oil wells since 2010. The Company also produces oil and natural gas from mature, low-decline wells including several waterflood properties located across the basin. Permian Basin proved reserves represented approximately 8% of total proved reserves at December 31, 2012, of which 56% were classified as proved developed. This region produced 83 MMcfe/d or 12% of the Company’s 2012 average daily production. During 2012, the Company invested approximately $240 million to drill in this region. During 2013, the Company anticipates spending approximately 20% of its total oil and natural gas capital budget for development activities in the Permian Basin region, primarily in the Wolfberry trend.
Michigan/Illinois
The Michigan/Illinois region includes properties producing from the Antrim Shale formation in the northern part of Michigan and oil properties in southern Illinois. These wells produce at depths ranging from 600 feet to 4,000 feet. Michigan/Illinois proved reserves represented approximately 6% of total proved reserves at December 31, 2012, of which 94% were classified as proved developed. This region produced 35 MMcfe/d or 5% of the Company’s 2012 average daily production. During 2013, the Company anticipates spending approximately 1% of its total oil and natural gas capital budget for development activities in the Michigan/Illinois region.
Williston/Powder River Basin
The Williston/Powder River Basin region includes the Bakken formation in North Dakota and the Powder River Basin in Wyoming. The Company’s nonoperated properties in the Williston Basin, one of the premier oil basins in the U.S., produce at depths ranging from 9,000 feet to 12,000 feet. The Company’s properties in the Powder River Basin, acquired in April 2012, consist of a CO2 flood operated by Anadarko in the Salt Creek Field. Williston/Powder River Basin proved reserves represented approximately 4% of total proved reserves at December 31, 2012, of which 66% were classified as proved developed. This region produced 29 MMcfe/d or 4% of the Company’s 2012 average daily production. During 2012, the Company invested approximately $124 million to drill in this region. During 2013, the Company anticipates spending approximately 12% of its total oil and natural gas capital budget for development activities in the Williston/Powder River Basin region.
California
The California region consists of the Brea Olinda Field of the Los Angeles Basin. The Brea Olinda Field was discovered in 1880 and produces from the shallow Pliocene formation to the deeper Miocene formation at depths ranging from 1,000 feet to 7,500 feet. California proved reserves represented approximately 4% of total proved reserves at December 31, 2012, of which 96% were classified as proved developed. This region produced 13 MMcfe/d or 2% of the Company’s 2012 average
5
Item 1. Business - Continued
daily production. During 2012, the Company invested approximately $1 million to drill in this region. During 2013, the Company anticipates spending approximately 2% of its total oil and natural gas capital budget for development activities in the California region.
East Texas
The East Texas region consists of properties acquired in May 2012. These properties are located in east Texas and primarily produce natural gas from the Cotton Valley formation at depths of approximately 11,000 feet. Proved reserves for these mature, low-decline producing properties, all of which are proved developed, represented approximately 2% of total proved reserves at December 31, 2012. This region produced 16 MMcfe/d or 2% of the Company’s 2012 average daily production. During 2013, the Company anticipates spending approximately 1% of its total oil and natural gas capital budget for development activities in the East Texas region.
Drilling and Acreage
The following sets forth the wells drilled during the periods indicated (“gross” refers to the total wells in which the Company had a working interest and “net” refers to gross wells multiplied by the Company’s working interest):
Year Ended December 31, | |||||||||
2012 | 2011 | 2010 | |||||||
Gross wells: | |||||||||
Productive | 436 | 292 | 138 | ||||||
Dry | 4 | 2 | 1 | ||||||
440 | 294 | 139 | |||||||
Net development wells: | |||||||||
Productive | 223 | 186 | 116 | ||||||
Dry | 2 | 2 | 1 | ||||||
225 | 188 | 117 | |||||||
Net exploratory wells: | |||||||||
Productive | — | — | — | ||||||
Dry | — | — | — | ||||||
— | — | — | |||||||
The totals above do not include 8 lateral segments added to existing vertical wellbores in the Hugoton Basin region during the year ended December 31, 2010. There were no lateral segments added to existing vertical wellbores during the years ended December 31, 2012, or December 31, 2011. At December 31, 2012, the Company had 139 gross (53 net) wells in progress (two wells were temporarily suspended).
This information should not be considered indicative of future performance, nor should it be assumed that there is necessarily any correlation between the number of productive wells drilled and the quantities or economic value of reserves found. Productive wells are those that produce commercial quantities of oil, natural gas or NGL, regardless of whether they generate a reasonable rate of return.
The following sets forth information about the Company’s drilling locations and net acres of leasehold interests as of December 31, 2012:
Total (1) | ||
Proved undeveloped | 2,504 | |
Other locations | 8,477 | |
Total drilling locations | 10,981 | |
Leasehold interests – net acres (in thousands) | 1,770 | |
6
Item 1. Business - Continued
(1) | Does not include optimization projects. |
As shown in the table above, as of December 31, 2012, the Company had 2,504 proved undeveloped drilling locations (specific drilling locations as to which the independent engineering firm, DeGolyer and MacNaughton, assigned proved undeveloped reserves as of such date) and the Company had identified 8,477 additional unproved drilling locations (specific drilling locations as to which DeGolyer and MacNaughton has not assigned any proved reserves) on acreage that the Company has under existing leases. As successful development wells frequently result in the reclassification of adjacent lease acreage from unproved to proved, the Company expects that a significant number of its unproved drilling locations will be reclassified as proved drilling locations prior to the actual drilling of these locations.
Productive Wells
The following sets forth information relating to the productive wells in which the Company owned a working interest as of December 31, 2012. Productive wells consist of producing wells and wells capable of production, including wells awaiting pipeline or other connections to commence deliveries. “Gross” wells refers to the total number of producing wells in which the Company has an interest, and “net” wells refers to the sum of its fractional working interests owned in gross wells. The number of wells below does not include approximately 2,590 productive wells in which the Company owns a royalty interest only.
Natural Gas Wells | Oil Wells | Total Wells | ||||||||||||||||
Gross | Net | Gross | Net | Gross | Net | |||||||||||||
Operated (1) | 6,929 | 5,925 | 4,119 | 3,825 | 11,048 | 9,750 | ||||||||||||
Nonoperated (2) | 2,273 | 564 | 2,483 | 381 | 4,756 | 945 | ||||||||||||
9,202 | 6,489 | 6,602 | 4,206 | 15,804 | 10,695 | |||||||||||||
(1) | The Company had 12 operated wells with multiple completions at December 31, 2012. |
(2) | The Company had no nonoperated wells with multiple completions at December 31, 2012. |
Developed and Undeveloped Acreage
The following sets forth information relating to leasehold acreage as of December 31, 2012:
Developed Acreage | Undeveloped Acreage | Total Acreage | ||||||||||||||||
Gross | Net | Gross | Net | Gross | Net | |||||||||||||
(in thousands) | ||||||||||||||||||
Leasehold acreage | 2,536 | 1,719 | 118 | 51 | 2,654 | 1,770 | ||||||||||||
Production, Price and Cost History
The Company’s natural gas production is primarily sold under market sensitive contracts which are typically priced at a differential to the New York Mercantile Exchange (“NYMEX”) price or the published natural gas index price for the producing area due to the natural gas quality and the proximity to major consuming markets. The Company’s natural gas production is sold to purchasers under percentage-of-proceeds contracts, percentage-of-index contracts or spot price contracts. Under percentage-of-proceeds contracts, the Company receives a percentage of the resale price received by the purchaser for sales of residual natural gas and NGL recovered after transportation and processing of natural gas. These purchasers sell the residual natural gas and NGL based primarily on spot market prices. Under percentage-of-index contracts, the Company receives a price for natural gas based on indexes published for the producing area. Although exact percentages vary daily, as of December 31, 2012, approximately 85% of the Company’s natural gas and NGL production was sold under short-term contracts at market-sensitive or spot prices. At December 31, 2012, the Company had natural gas throughput delivery commitments under long-term contracts of approximately 24 Bcf to be delivered by August 2015.
7
Item 1. Business - Continued
The Company’s oil production is primarily sold under market sensitive contracts, which typically sell at a differential to NYMEX, and as of December 31, 2012, approximately 90% of its oil production was sold under short-term contracts. At December 31, 2012, the Company had no delivery commitments for oil production.
As discussed in the “Strategy” section above, the Company enters into derivative contracts primarily in the form of swap contracts and put options to reduce the impact of commodity price volatility on its net cash provided by operating activities. By removing a significant portion of the price volatility associated with future production, the Company expects to mitigate, but not eliminate, the potential effects of variability in net cash provided by operating activities due to fluctuations in commodity prices.
The following sets forth information regarding average daily production, average prices and average costs for each of the periods indicated:
Year Ended December 31, | ||||||||||||
2012 | 2011 | 2010 | ||||||||||
Average daily production: | ||||||||||||
Natural gas (MMcf/d) | 349 | 175 | 137 | |||||||||
Oil (MBbls/d) | 29.2 | 21.5 | 13.1 | |||||||||
NGL (MBbls/d) | 24.5 | 10.8 | 8.3 | |||||||||
Total (MMcfe/d) | 671 | 369 | 265 | |||||||||
Weighted average prices (unhedged): (1) | ||||||||||||
Natural gas (Mcf) | $ | 2.87 | $ | 4.35 | $ | 4.24 | ||||||
Oil (Bbl) | $ | 88.59 | $ | 91.24 | $ | 75.16 | ||||||
NGL (Bbl) | $ | 32.10 | $ | 42.88 | $ | 39.14 | ||||||
Average NYMEX prices: | ||||||||||||
Natural gas (MMBtu) | $ | 2.79 | $ | 4.05 | $ | 4.40 | ||||||
Oil (Bbl) | $ | 94.20 | $ | 95.12 | $ | 79.53 | ||||||
Costs per Mcfe of production: | ||||||||||||
Lease operating expenses | $ | 1.29 | $ | 1.73 | $ | 1.64 | ||||||
Transportation expenses | $ | 0.31 | $ | 0.21 | $ | 0.20 | ||||||
General and administrative expenses (2) | $ | 0.71 | $ | 0.99 | $ | 1.02 | ||||||
Depreciation, depletion and amortization | $ | 2.47 | $ | 2.48 | $ | 2.46 | ||||||
Taxes, other than income taxes | $ | 0.54 | $ | 0.58 | $ | 0.47 | ||||||
(1) | Does not include the effect of gains (losses) on derivatives. |
(2) | General and administrative expenses for the years ended December 31, 2012, December 31, 2011, and December 31, 2010, include approximately $28 million, $21 million and $13 million, respectively, of noncash unit-based compensation expenses. |
8
Item 1. Business - Continued
Reserve Data
Proved Reserves
The following sets forth estimated proved oil, natural gas and NGL reserves and the standardized measure of discounted future net cash flows at December 31, 2012, based on reserve reports prepared by independent engineers, DeGolyer and MacNaughton:
Estimated proved developed reserves: | |||
Natural gas (Bcf) | 1,661 | ||
Oil (MMBbls) | 131 | ||
NGL (MMBbls) | 113 | ||
Total (Bcfe) | 3,127 | ||
Estimated proved undeveloped reserves: | |||
Natural gas (Bcf) | 910 | ||
Oil (MMBbls) | 60 | ||
NGL (MMBbls) | 66 | ||
Total (Bcfe) | 1,669 | ||
Estimated total proved reserves (Bcfe) | 4,796 | ||
Proved developed reserves as a percentage of total proved reserves | 65 | % | |
Standardized measure of discounted future net cash flows (in millions) (1) | $ | 6,073 | |
Representative NYMEX prices: (2) | |||
Natural gas (MMBtu) | $ | 2.76 | |
Oil (Bbl) | $ | 94.64 | |
(1) | This measure is not intended to represent the market value of estimated reserves. |
(2) | In accordance with Securities and Exchange Commission (“SEC”) regulations, reserves were estimated using the average price during the 12-month period, determined as an unweighted average of the first-day-of-the-month price for each month, excluding escalations based upon future conditions. The average price used to estimate reserves is held constant over the life of the reserves. |
During the year ended December 31, 2012, the Company’s proved undeveloped reserves (“PUDs”) increased to 1,669 Bcfe from 1,336 Bcfe at December 31, 2011, representing an increase of 333 Bcfe. The increase was primarily due to 415 Bcfe added as a result of the Company’s acquisitions in the Mid-Continent, Hugoton Basin, Williston/Powder River Basin, East Texas and Green River Basin regions and 588 Bcfe added as a result of its drilling activities, partially offset by 443 Bcfe of revisions and 227 Bcfe of PUDs developed during 2012.
During the year ended December 31, 2012, the Company incurred approximately $442 million in capital expenditures to convert 208 Bcfe of reserves classified as PUDs at December 31, 2011. Based on the December 31, 2012 reserve report, the amounts of capital expenditures estimated to be incurred in 2013, 2014 and 2015 to develop the Company’s PUDs are approximately $679 million, $688 million and $622 million, respectively. The amount and timing of these expenditures will depend on a number of factors, including actual drilling results, service costs and product prices. None of the 1,669 Bcfe of PUDs at December 31, 2012, has remained undeveloped for five years or more. All PUD properties are included in the Company’s current five-year development plan.
Reserve engineering is inherently a subjective process of estimating underground accumulations of oil, natural gas and NGL that cannot be measured exactly. The accuracy of any reserve estimate is a function of the quality of available data and engineering and geological interpretation and judgment. Accordingly, reserve estimates may vary from the quantities of oil, natural gas and NGL that are ultimately recovered. Future prices received for production may vary, perhaps significantly, from the prices assumed for the purposes of estimating the standardized measure of discounted future net cash flows. The
9
Item 1. Business - Continued
standardized measure of discounted future net cash flows should not be construed as the market value of the reserves at the dates shown. The 10% discount factor required to be used under the provisions of applicable accounting standards may not be the most appropriate discount factor based on interest rates in effect from time to time and risks associated with the Company or the oil and natural gas industry. The standardized measure of discounted future net cash flows is materially affected by assumptions about the timing of future production, which may prove to be inaccurate.
The reserve estimates reported herein were prepared by independent engineers, DeGolyer and MacNaughton. The process performed by the independent engineers to prepare reserve amounts included their estimation of reserve quantities, future producing rates, future net revenue and the present value of such future net revenue, is based in part on data provided by the Company. When preparing the reserve estimates, the independent engineering firm did not independently verify the accuracy and completeness of the information and data furnished by the Company with respect to ownership interests, production, well test data, historical costs of operation and development, product prices, or any agreements relating to current and future operations of the properties and sales of production. However, if in the course of their work, something came to their attention that brought into question the validity or sufficiency of any such information or data, they did not rely on such information or data until they had satisfactorily resolved their questions relating thereto. The estimates of reserves conform to the guidelines of the SEC, including the criteria of “reasonable certainty,” as it pertains to expectations about the recoverability of reserves in future years. The independent engineering firm also prepared estimates with respect to reserve categorization, using the definitions for proved reserves set forth in Regulation S-X Rule 4-10(a) and subsequent SEC staff interpretations and guidance.
The Company’s internal control over the preparation of reserve estimates is a process designed to provide reasonable assurance regarding the reliability of the Company’s reserve estimates in accordance with SEC regulations. The preparation of reserve estimates was overseen by the Company’s Reservoir Engineering Advisor, who has Master of Petroleum Engineering and Master of Business Administration degrees and more than 25 years of oil and natural gas industry experience. The reserve estimates were reviewed and approved by the Company’s senior engineering staff and management, with final approval by its Executive Vice President and Chief Operating Officer. For additional information regarding estimates of reserves, including the standardized measure of discounted future net cash flows, see “Supplemental Oil and Natural Gas Data (Unaudited)” in Item 8. “Financial Statements and Supplementary Data.” The Company has not filed reserve estimates with any federal authority or agency, with the exception of the SEC.
Operational Overview
General
The Company generally seeks to be the operator of its properties so that it can develop drilling programs and optimization projects that not only replace production, but add value through reserve and production growth and future operational synergies. Many of the Company’s wells are completed in multiple producing zones with commingled production and long economic lives.
Principal Customers
For the year ended December 31, 2012, sales of oil, natural gas and NGL to Enbridge Energy Partners, L.P. and DCP Midstream Partners, LP accounted for approximately 24% and 13%, respectively, of the Company’s total production volumes, or 37% in the aggregate. If the Company were to lose any one of its major oil and natural gas purchasers, the loss could temporarily cease or delay production and sale of its oil and natural gas in that particular purchaser’s service area. If the Company were to lose a purchaser, it believes it could identify a substitute purchaser. However, if one or more of these large purchasers ceased purchasing oil and natural gas altogether, it could have a detrimental effect on the oil and natural gas market in general and on the volume of oil and natural gas that the Company is able to sell.
Competition
The oil and natural gas industry is highly competitive. The Company encounters strong competition from other independent operators and master limited partnerships in acquiring properties, contracting for drilling and other related services and securing trained personnel. The Company is also affected by competition for drilling rigs and the availability of related equipment. In the past, the oil and natural gas industry has experienced shortages of drilling rigs, equipment, pipe and
10
Item 1. Business - Continued
personnel, which has delayed development drilling and has caused significant price increases. The Company is unable to predict when, or if, such shortages may occur or how they would affect its drilling program.
Operating Hazards and Insurance
The oil and natural gas industry involves a variety of operating hazards and risks that could result in substantial losses from, among other things, injury or loss of life, severe damage to or destruction of property, natural resources and equipment, pollution or other environmental damage, cleanup responsibilities, regulatory investigation and penalties and suspension of operations. The Company may be liable for environmental damages caused by previous owners of property it purchases and leases. As a result, the Company may incur substantial liabilities to third parties or governmental entities, the payment of which could reduce or eliminate funds available for acquisitions, development or distributions, or result in the loss of properties. In addition, the Company participates in wells on a nonoperated basis and therefore may be limited in its ability to control the risks associated with the operation of such wells.
In accordance with customary industry practices, the Company maintains insurance against some, but not all, potential losses. The Company cannot provide assurance that any insurance it obtains will be adequate to cover any losses or liabilities. The Company has elected to self-insure for certain items for which it has determined that the cost of available insurance is excessive relative to the risks presented. In addition, pollution and environmental risks generally are not fully insurable. The occurrence of an event not fully covered by insurance could have a material adverse effect on the Company’s financial position and results of operations. For more information about potential risks that could affect the Company, see Item 1A. “Risk Factors.”
Title to Properties
Prior to the commencement of drilling operations, the Company conducts a title examination and performs curative work with respect to significant defects. To the extent title opinions or other investigations reflect title defects on those properties, the Company is typically responsible for curing any title defects at its expense prior to commencing drilling operations. Prior to completing an acquisition of producing leases, the Company performs title reviews on the most significant leases and, depending on the materiality of properties, the Company may obtain a title opinion or review previously obtained title opinions. As a result, the Company has obtained title opinions on a significant portion of its properties and believes that it has satisfactory title to its producing properties in accordance with standards generally accepted in the industry. Oil and natural gas properties are subject to customary royalty and other interests, liens for current taxes and other burdens which do not materially interfere with the use of or affect the carrying value of the properties.
Seasonal Nature of Business
Seasonal weather conditions and lease stipulations can limit the drilling and producing activities and other operations in regions of the U.S. in which the Company operates. These seasonal conditions can pose challenges for meeting the well drilling objectives and increase competition for equipment, supplies and personnel, which could lead to shortages and increase costs or delay operations. For example, Company operations may be impacted by ice and snow in the winter and by electrical storms and high temperatures in the spring and summer, as well as by wild fires in the fall.
The demand for natural gas typically decreases during the summer months and increases during the winter months. Seasonal anomalies sometimes lessen this fluctuation. In addition, certain natural gas users utilize natural gas storage facilities and purchase some of their anticipated winter requirements during the summer, which can also lessen seasonal demand fluctuations.
Environmental Matters and Regulation
The Company’s operations are subject to stringent federal, state and local laws and regulations governing the discharge of materials into the environment or otherwise relating to environmental protection. The Company’s operations are subject to the same environmental laws and regulations as other companies in the oil and natural gas industry. These laws and regulations may:
• | require the acquisition of various permits before drilling commences; |
• | require the installation of expensive pollution control equipment; |
11
Item 1. Business - Continued
• | restrict the types, quantities and concentration of various substances that can be released into the environment in connection with drilling and production activities; |
• | limit or prohibit drilling activities on lands lying within wilderness, wetlands, areas inhabited by endangered species and other protected areas; |
• | require remedial measures to prevent pollution from former operations, such as pit closure and plugging of abandoned wells; |
• | impose substantial liabilities for pollution resulting from operations; and |
• | with respect to operations affecting federal lands or leases, require preparation of a Resource Management Plan, an Environmental Assessment, and/or an Environmental Impact Statement. |
These laws, rules and regulations may also restrict the production rate of oil, natural gas and NGL below the rate that would otherwise be possible. The regulatory burden on the industry increases the cost of doing business and consequently affects profitability. Additionally, Congress and federal and state agencies frequently revise environmental laws and regulations, and any changes that result in more stringent and costly waste handling, disposal and cleanup requirements for the oil and natural gas industry could have a significant impact on operating costs.
The environmental laws and regulations applicable to the Company and its operations include, among others, the following U.S. federal laws and regulations:
• | Clean Air Act, and its amendments, which governs air emissions; |
• | Clean Water Act, which governs discharges to and excavations within the waters of the U.S.; |
• | Comprehensive Environmental Response, Compensation and Liability Act (“CERCLA”), which imposes liability where hazardous releases have occurred or are threatened to occur (commonly known as “Superfund”); |
• | Energy Independence and Security Act of 2007, which prescribes new fuel economy standards and other energy saving measures; |
• | National Environmental Policy Act, which governs oil and natural gas production activities on federal lands; |
• | Resource Conservation and Recovery Act (“RCRA”), which governs the management of solid waste; |
• | Safe Drinking Water Act, which governs the underground injection and disposal of wastewater; and |
• | U.S. Department of Interior regulations, which impose liability for pollution cleanup and damages. |
Various states regulate the drilling for, and the production, gathering and sale of, oil, natural gas and NGL, including imposing production taxes and requirements for obtaining drilling permits. States also regulate the method of developing new fields, the spacing and operation of wells and the prevention of waste of resources. States may regulate rates of production and may establish maximum daily production allowables from natural gas wells based on market demand or resource conservation, or both. States do not regulate wellhead prices or engage in other similar direct economic regulations, but there can be no assurance that they will not do so in the future. The effect of these regulations may be to limit the amounts of oil, natural gas and NGL that may be produced from the Company’s wells and to limit the number of wells or locations it can drill. The oil and natural gas industry is also subject to compliance with various other federal, state and local regulations and laws. Some of those laws relate to occupational safety, resource conservation and equal opportunity employment.
The Company believes that it substantially complies with all current applicable environmental laws and regulations and that continued compliance with existing requirements will not have a material adverse impact on its financial condition or results of operations. Future regulatory issues that could impact the Company include new rules or legislation regulating greenhouse gas emissions, hydraulic fracturing, endangered species and air emissions.
Climate Change
In response to findings that emissions of carbon dioxide and certain other gases may be contributing to warming of the Earth’s atmosphere, the Environmental Protection Agency (“EPA”) has adopted regulations under existing provisions of the federal Clean Air Act that would require a reduction in emissions of greenhouse gases (“GHG”) from motor vehicles and also may trigger construction and operating permit review for GHG emissions from certain stationary sources. The EPA has asserted that the final motor vehicle GHG emission standards triggered construction and operating permit requirements for stationary sources. Thus, on June 3, 2010, the EPA issued a final rule to address permitting of GHG emissions from stationary sources under the Clean Air Act’s Prevention of Significant Deterioration (“PSD”) and Title V programs. This final rule “tailors” the PSD and Title V programs to apply to certain stationary sources of GHG emissions in a multi-step
12
Item 1. Business - Continued
process, with the largest sources first subject to permitting. In addition, on November 8, 2010, the EPA published a final rule expanding its existing GHG emissions reporting rule published in October 2009 to include onshore and offshore oil and natural gas production and onshore oil and natural gas processing, transmission, storage and distribution activities. Facilities containing petroleum and natural gas systems that emit 25,000 metric tons or more of CO2 equivalent per year are now required to report annual GHG emissions to the EPA, with the first report for emissions occurring in 2011 due on September 28, 2012. In addition, both houses of Congress have considered legislation to reduce emissions of GHGs, and almost one-half of the states have already taken legal measures to reduce emissions of GHGs, primarily through the planned development of GHG emission inventories and/or regional GHG cap and trade programs. Any laws or regulations that may be adopted to restrict or reduce emissions of U.S. greenhouse gases could require the Company to incur increased operating costs such as costs to purchase and operate emissions control systems, to acquire emissions allowances, or comply with new regulatory or reporting requirements, and could have an adverse effect on demand for oil and natural gas.
Hydraulic Fracturing
Hydraulic fracturing is an important and common practice that is used to stimulate production of hydrocarbons from tight formations. The process involves the injection of water, sand and chemicals under pressure into formations to fracture the surrounding rock and stimulate production. Hydraulic fracturing operations have historically been overseen by state regulators as part of their oil and natural gas regulatory programs. However, the EPA has asserted federal regulatory authority over hydraulic fracturing involving fluids that contain diesel fuel under the Safe Drinking Water Act’s Underground Injection Control Program and has released draft permitting guidance for hydraulic fracturing operations that use diesel fuel in fracturing fluids in those states where the EPA is the permitting authority. Moreover, on November 23, 2011, the EPA announced that it was granting, in part, a petition to initiate rulemaking under the Toxic Substances Control Act, relating to chemical substances and mixtures used in oil and natural gas exploration or production. Further, on May 11, 2012, the Department of the Interior’s Bureau of Land Management (“BLM”) issued a proposed rule that, if adopted, would require public disclosure to the BLM of chemicals used in hydraulic fracturing operations after fracturing operations have been completed and would strengthen standards for well-bore integrity and management of fluids that return to the surface during and after fracturing operations on federal and Indian lands. In addition, legislation has been introduced before Congress that would provide for federal regulation of hydraulic fracturing and would require disclosure of the chemicals used in the fracturing process. If adopted, these bills could result in additional permitting requirements for hydraulic fracturing operations as well as various restrictions on those operations. These permitting requirements and restrictions could result in delays in operations at well sites and also increased costs to make wells productive.
We use a significant amount of water in our hydraulic fracturing operations. Our inability to locate sufficient amounts of water, or dispose of or recycle water used in our drilling and production operations, could adversely impact our operations. Moreover, new environmental initiatives and regulations could include restrictions on our ability to conduct certain operations such as hydraulic fracturing or disposal of waste, including, but not limited to, produced water, drilling fluids and other wastes associated with the development or production of natural gas. Compliance with environmental regulations and permit requirements governing the withdrawal, storage and use of surface water or groundwater necessary for hydraulic fracturing of wells may increase our operating costs and cause delays, interruptions or termination of our operations, the extent of which cannot be predicted, all of which could have an adverse effect on our operations and financial condition.
A number of federal agencies are analyzing or have been requested to review a variety of environmental issues associated with hydraulic fracturing. The EPA is conducting a study of the potential environmental effects of hydraulic fracturing on drinking water and groundwater. On December 12, 2012, the EPA released a progress report outlining work currently underway and is expected to release results of the study in 2014. These on-going or proposed studies, depending on their course and any meaningful results obtained, could spur initiatives to further regulate hydraulic fracturing under the Safe Drinking Water Act, the Toxic Substances Control Act, and/or other regulatory mechanisms. President Obama created the Interagency Working Group on Unconventional Natural Gas and Oil by Executive Order on April 13, 2012, which is charged with coordinating and aligning federal agency research and scientific studies on unconventional natural gas and oil resources. Moreover, some states have adopted, and other states are considering adopting, regulations that could restrict hydraulic fracturing in certain circumstances. For example, both Texas and Louisiana have adopted disclosure regulations requiring varying degrees of disclosure of the constituents in hydraulic fracturing fluids. If new laws or regulations that significantly restrict hydraulic fracturing are adopted, such laws could make it more difficult or costly for us to perform fracturing to stimulate production from tight formations. In addition, any such added regulation could lead to operational delays, increased operating costs and additional regulatory burdens, and reduced production of oil and natural gas, which could adversely affect the Company’s revenues and results of operations.
13
Item 1. Business - Continued
Endangered Species Act
The federal Endangered Species Act (“ESA”) restricts activities that may affect endangered and threatened species or their habitats. Some of the Company’s operations may be located in areas that are designated as habitat for endangered or threatened species. The Company believes that it is currently in substantial compliance with the ESA. However, the designation of previously unprotected species as being endangered or threatened could cause the Company to incur additional costs or become subject to operating restrictions in areas where the species are known to exist.
Air Emissions
On August 15, 2012, the EPA issued final rules that subject oil and natural gas production, processing, transmission and storage operations to regulation under the New Source Performance Standards (“NSPS”) and National Emission Standards for Hazardous Air Pollutants (“NESHAP”) programs. The EPA rules include NSPS standards for completions of hydraulically fractured natural gas wells. These standards require that prior to January 1, 2015, owners/operators reduce volatile organic compounds emissions from natural gas not sent to the gathering line during well completion either by flaring or by capturing the gas using green completions with a completion combustion device. Beginning January 1, 2015, operators must capture the gas and make it available for use or sale, which can be done through the use of green completions. The standards are applicable to newly fractured wells as well as existing wells that are refractured. Further, the finalized regulations also establish specific new requirements, effective in 2012, for emissions from compressors, controllers, dehydrators, storage tanks, gas processing plants and certain other equipment. These rules may require changes to our operations, including the installation of new equipment to control emissions.
The Company cannot predict how future environmental laws and regulations may impact its properties or operations. For the year ended December 31, 2012, the Company did not incur any material capital expenditures for installation of remediation or pollution control equipment at any of the Company’s facilities. The Company is not aware of any environmental issues or claims that will require material capital expenditures during 2013 or that will otherwise have a material impact on its financial position or results of operations.
Employees
As of December 31, 2012, the Company employed approximately 1,136 personnel. None of the employees are represented by labor unions or covered by any collective bargaining agreement. The Company believes that its relationship with its employees is satisfactory.
Principal Executive Offices
The Company is a Delaware limited liability company with headquarters in Houston, Texas. The principal executive offices are located at 600 Travis, Suite 5100, Houston, Texas 77002. The main telephone number is (281) 840-4000.
Company Website
The Company’s internet website is www.linnenergy.com. The Company makes available free of charge on or through its website Annual Reports on Form 10-K, Quarterly Reports on Form 10-Q, Current Reports on Form 8-K, and any amendments to those reports filed or furnished pursuant to Section 13(a) or 15(d) of the Securities Exchange Act of 1934 as soon as reasonably practicable after the Company electronically files such material with, or furnishes it to, the SEC. Information on the Company’s website should not be considered a part of, or incorporated by reference into, this Annual Report on Form 10-K.
The SEC maintains an internet website that contains these reports at www.sec.gov. Any materials that the Company files with the SEC may be read or copied at the SEC’s Public Reference Room at 100 F Street, NE, Washington, DC 20549. Information concerning the operation of the Public Reference Room may be obtained by calling the SEC at (800) 732-0330.
14
Item 1. Business - Continued
Forward-Looking Statements
This Annual Report on Form 10-K contains forward-looking statements that are subject to a number of risks and uncertainties, many of which are beyond the Company’s control. These statements may include discussions about the Company’s:
• | business strategy; |
• | acquisition strategy; |
• | financial strategy; |
• | ability to maintain or grow distributions; |
• | drilling locations; |
• | oil, natural gas and NGL reserves; |
• | realized oil, natural gas and NGL prices; |
• | production volumes; |
• | lease operating expenses, general and administrative expenses and development costs; |
• | future operating results; and |
• | plans, objectives, expectations and intentions. |
All of these types of statements, other than statements of historical fact included in this Annual Report on Form 10-K, are forward-looking statements. These forward-looking statements may be found in Item 1. “Business;” Item 1A. “Risk Factors;” Item 7. “Management’s Discussion and Analysis of Financial Condition and Results of Operations” and other items within this Annual Report on Form 10-K. In some cases, forward-looking statements can be identified by terminology such as “may,” “will,” “could,” “should,” “expect,” “plan,” “project,” “intend,” “anticipate,” “believe,” “estimate,” “predict,” “potential,” “pursue,” “target,” “continue,” the negative of such terms or other comparable terminology.
The forward-looking statements contained in this Annual Report on Form 10-K are largely based on Company expectations, which reflect estimates and assumptions made by Company management. These estimates and assumptions reflect management’s best judgment based on currently known market conditions and other factors. Although the Company believes such estimates and assumptions to be reasonable, they are inherently uncertain and involve a number of risks and uncertainties beyond its control. In addition, management’s assumptions may prove to be inaccurate. The Company cautions that the forward-looking statements contained in this Annual Report on Form 10-K are not guarantees of future performance, and it cannot assure any reader that such statements will be realized or the forward-looking statements or events will occur. Actual results may differ materially from those anticipated or implied in forward-looking statements due to factors listed in the “Risk Factors” section and elsewhere in this Annual Report on Form 10-K. The forward-looking statements speak only as of the date made, and other than as required by law, the Company undertakes no obligation to publicly update or revise any forward-looking statement, whether as a result of new information, future events or otherwise.
Item 1A. Risk Factors
Our business has many risks. Factors that could materially adversely affect our business, financial position, operating results or liquidity and the trading price of our units are described below. This information should be considered carefully, together with other information in this report and other reports and materials we file with the SEC.
We may not have sufficient net cash provided by operating activities to pay the distribution at the current distribution level, or at all, and future distributions to our unitholders may fluctuate from quarter to quarter.
We may not have sufficient net cash provided by operating activities each quarter to pay the distribution at the current distribution level or at all. Under the terms of our limited liability company agreement, the amount of cash otherwise available for distribution will be reduced by our operating expenses and any cash reserve amounts that our Board of Directors establishes to provide for future operations, future capital expenditures, future debt service requirements and future cash distributions to our unitholders. The amount of cash we can distribute on our units principally depends upon the amount of cash we generate from our operations, which will fluctuate from quarter to quarter based on, among other things:
• | produced volumes of oil, natural gas and NGL; |
• | prices at which oil, natural gas and NGL production is sold; |
• | level of our operating costs; |
• | payment of interest, which depends on the amount of our indebtedness and the interest payable thereon; and |
• | level of our capital expenditures. |
15
Item 1A. Risk Factors - Continued
In addition, the actual amount of cash we will have available for distribution will depend on other factors, some of which are beyond our control, including:
• | availability of borrowings on acceptable terms under our Credit Facility to pay distributions; |
• | the costs of acquisitions, if any; |
• | fluctuations in our working capital needs; |
• | timing and collectability of receivables; |
• | restrictions on distributions contained in our Credit Facility and the indentures governing our November 2019 Senior Notes, May 2019 Senior Notes, 2010 Issued Senior Notes, and our Original Senior Notes, as defined in Note 6; |
• | prevailing economic conditions; |
• | access to credit or capital markets; and |
• | the amount of cash reserves established by our Board of Directors for the proper conduct of our business. |
As a result of these factors, the amount of cash we distribute to our unitholders may fluctuate significantly from quarter to quarter and may be significantly less than the current distribution level, or the distribution may be suspended.
We may not have sufficient net cash provided by operating activities to pay our distribution at the current distribution level, or at all, and as a result, future distributions to our unitholders may be reduced or eliminated.
Our net cash provided by operating activities is frequently less than cash distributions to our unitholders. While our Board of Directors makes discretionary adjustments to net cash provided by operating activities when declaring a distribution for the current period, if we generate insufficient net cash provided by operating activities for a sustained period of time, our Board of Directors may determine to reduce or eliminate our distribution to unitholders. Any such reduction in distributions may cause the trading price of our units to decline. Factors that may cause us to generate net cash provided by operating activities that is insufficient to pay our current distribution to unitholders include, among other things, the following:
• | Production from existing assets: Our revenues are dependent on how much oil, natural gas and NGLs we produce. If our existing assets under-perform for a prolonged period of time with respect to expected production volumes, our revenues may be lower than expected, and net cash provided by operating activities could be insufficient to pay our current distribution to unitholders. |
• | NGL commodity prices: We have been and continue to be limited in our ability to effectively hedge our NGL production. As a result, we are subject to the current depressed price environment for NGLs, and in particular, ethane prices. If current price levels for NGLs continue into the future, our revenues and results of operations will be affected, and net cash provided by operating activities could be insufficient to pay our current distribution to unitholders. |
• | Access to and cost of capital: Accretive acquisitions are an integral component of our business strategy. When revenues are expected to be lower as a result of under-performance of assets, weakening commodity prices on unhedged volumes or declining contract prices on hedged volumes, we seek to make accretive acquisitions of oil and natural gas properties to cover potential shortfalls in net cash provided by operating activities in order to maintain our distribution level. As a result of the pending SEC inquiry, we may be limited in our ability to access the capital markets at an acceptable cost or at all; thus our ability to make accretive acquisitions may be limited. |
As a result of these and other factors, the amount of cash we may distribute to our unitholders in the future may be significantly less than the current distribution level or the distribution may be suspended or eliminated.
We actively seek to acquire oil and natural gas properties. Acquisitions involve potential risks that could adversely impact our future growth and our ability to increase or pay distributions at the current level, or at all.
Any acquisition involves potential risks, including, among other things:
• | the risk that reserves expected to support the acquired assets may not be of the anticipated magnitude or may not be developed as anticipated; |
• | the risk of title defects discovered after closing; |
• | inaccurate assumptions about revenues and costs, including synergies; |
• | significant increases in our indebtedness and working capital requirements; |
16
Item 1A. Risk Factors - Continued
• | an inability to transition and integrate successfully or timely the businesses we acquire; |
• | the cost of transition and integration of data systems and processes; |
• | the potential environmental problems and costs; |
• | the assumption of unknown liabilities; |
• | limitations on rights to indemnity from the seller; |
• | the diversion of management’s attention from other business concerns; |
• | increased demands on existing personnel and on our corporate structure; |
• | disputes arising out of acquisitions; |
• | customer or key employee losses of the acquired businesses; and |
• | the failure to realize expected growth or profitability. |
The scope and cost of these risks may ultimately be materially greater than estimated at the time of the acquisition. Further, our future acquisition costs may be higher than those we have achieved historically. Any of these factors could adversely impact our future growth and our ability to increase or pay distributions.
If we do not make future acquisitions on economically acceptable terms, then our growth and ability to increase distributions will be limited.
Our ability to grow and to increase distributions to our unitholders is partially dependent on our ability to make acquisitions that result in an increase in net cash provided by operating activities. We may be unable to make such acquisitions because we are:
• | unable to identify attractive acquisition candidates or negotiate acceptable purchase contracts with them; |
• | unable to obtain financing for these acquisitions on economically acceptable terms; or |
• | outbid by competitors. |
In any such case, our future growth and ability to increase distributions will be limited. Furthermore, even if we do make acquisitions that we believe will increase net cash provided by operating activities, these acquisitions may nevertheless result in a decrease in available cash flow per unit.
If we are unable to fully offset declines in production and proved developed producing reserves from discretionary reductions for a portion of our oil and natural gas development costs, our net cash provided by operating activities could be reduced, which could adversely affect our ability to pay a distribution at the current level or at all.
In determining the amount of cash that we distribute to unitholders, our Board of Directors establishes at the end of each year the estimated amounts (which we refer to as discretionary reductions for a portion of oil and natural gas development costs) that we believe will be necessary during the following year to fully offset declines in production and proved developed producing reserves through drilling and development activities. In determining this portion of oil and natural gas development costs (which includes estimated drilling and development costs associated with projects to convert a portion of non-producing reserves to producing status but does not include the historical cost of acquired properties as those amounts have already been spent in prior periods and were financed primarily with external sources of funding), management evaluates historical results of our drilling and development activities based on periodically revised and updated information from past years to assess the costs, adequacy and effectiveness of such activities and future assumptions regarding cost trends, production and decline rates and reserve recoveries. However, our management does not conduct an analysis to evaluate historical amounts of capital actually spent on such drilling and development activities. Our ability to pursue projects with the intent to fully offset declines in production and proved developed producing reserves through drilling and development activities is limited to our inventory of development opportunities on our existing acreage position. Management’s estimate of this discretionary portion of our oil and natural gas development costs does not include the historical acquisition cost of projects pursued during the year or the acquisition of new oil and natural gas reserves. Moreover, our assumptions regarding costs, production and decline rates and reserve recoveries may prove incorrect. If we are unable to fully offset declines in production and proved developed producing reserves from this discretionary portion of our oil and natural gas development costs, our net cash provided by operating activities could be reduced, which could adversely affect our ability to pay a distribution at the current level or at all. Furthermore, our existing reserves, inventory of drilling locations and production levels will decline over time as a result of development and production activities. Consequently, if we were to limit our total capital expenditures to this discretionary portion of our oil and natural gas development costs and not complete acquisitions of new reserves, total reserves would decrease over time, resulting in an
17
Item 1A. Risk Factors - Continued
inability to sustain production at current levels, which could adversely affect our ability to pay a distribution at the current level or at all.
We have significant indebtedness under our November 2019 Senior Notes, May 2019 Senior Notes, 2010 Issued Senior Notes, and Original Senior Notes (collectively, “Senior Notes”) and, from time to time, our Credit Facility. For a discussion of our Senior Notes, see Note 6. Our Credit Facility and the indentures governing our Senior Notes have substantial restrictions and financial covenants and we may have difficulty obtaining additional credit, which could adversely affect our operations, our ability to make acquisitions and our ability to pay distributions to our unitholders.
As of January 31, 2013, we had an aggregate of approximately $6.1 billion outstanding under Senior Notes and our Credit Facility (with additional borrowing capacity of approximately $1.8 billion under our Credit Facility). As a result of our indebtedness, we will use a portion of our cash flow to pay interest and principal when due, which will reduce the cash available to finance our operations and other business activities and could limit our flexibility in planning for or reacting to changes in our business and the industry in which we operate.
The Credit Facility restricts our ability to obtain additional financing, make investments, lease equipment, sell assets, enter into commodity and interest rate derivative contracts and engage in business combinations. We are also required to comply with certain financial covenants and ratios under our Credit Facility and the indentures governing our Senior Notes. Our ability to comply with these restrictions and covenants in the future is uncertain and will be affected by the levels of cash flow from our operations and events or circumstances beyond our control. Our failure to comply with any of the restrictions and covenants could result in an event of default, which, if it continues beyond any applicable cure periods, could cause all of our existing indebtedness to be immediately due and payable.
We depend, in part, on our Credit Facility for future capital needs. We have drawn on our Credit Facility to fund or partially fund cash distribution payments. Absent such borrowing, we would have at times experienced a shortfall in cash available to pay our declared cash distribution amount. If there is a default by us under our Credit Facility that continues beyond any applicable cure period, we would be unable to make borrowings to fund distributions. In addition, we may finance acquisitions through borrowings under our Credit Facility or the incurrence of additional debt. To the extent that we are unable to incur additional debt under our Credit Facility or otherwise because we are not in compliance with the financial covenants in the Credit Facility, we may not be able to complete acquisitions, which could adversely affect our ability to maintain or increase distributions. Furthermore, to the extent we are unable to refinance our Credit Facility on terms that are as favorable as those in our existing Credit Facility, or at all, our ability to fund our operations and our ability to pay distributions could be affected.
The borrowing base under our Credit Facility is determined semi-annually at the discretion of the lenders and is based in part on oil, natural gas and NGL prices. Significant declines in oil, natural gas or NGL prices may result in a decrease in our borrowing base. The lenders can unilaterally adjust the borrowing base and therefore the borrowings permitted to be outstanding under the Credit Facility. Any increase in the borrowing base requires the consent of all the lenders. Outstanding borrowings in excess of the borrowing base must be repaid immediately, or we must pledge other properties as additional collateral. We do not currently have substantial unpledged properties, and we may not have the financial resources in the future to make any mandatory principal prepayments required under the Credit Facility. Significant declines in our production or significant declines in realized oil, natural gas or NGL prices for prolonged periods and resulting decreases in our borrowing base may force us to reduce or suspend distributions to our unitholders.
Our ability to access the capital and credit markets to raise capital and borrow on favorable terms will be affected by disruptions in the capital and credit markets, which could adversely affect our operations, our ability to make acquisitions and our ability to pay distributions to our unitholders.
Disruptions in the capital and credit markets could limit our ability to access these markets or significantly increase our cost to borrow. Some lenders may increase interest rates, enact tighter lending standards, refuse to refinance existing debt at maturity on favorable terms or at all and may reduce or cease to provide funding to borrowers. If we are unable to access the capital and credit markets on favorable terms, our ability to make acquisitions and pay distributions could be affected.
Our variable rate indebtedness subjects us to interest rate risk, which could cause our debt service obligations to increase significantly.
18
Item 1A. Risk Factors - Continued
Borrowings under our Credit Facility bear interest at variable rates and expose us to interest rate risk. If interest rates increase and we are unable to effectively hedge our interest rate risk, our debt service obligations on the variable rate indebtedness would increase even though the amount borrowed remained the same, and our net income and cash available for servicing our indebtedness would decrease.
Increases in interest rates could adversely affect the demand for our units.
An increase in interest rates may cause a corresponding decline in demand for equity investments, in particular for yield-based equity investments such as our units. Any such reduction in demand for our units resulting from other more attractive investment opportunities may cause the trading price of our units to decline.
Our commodity derivative activities could result in financial losses or could reduce our income, which may adversely affect our ability to pay distributions to our unitholders.
To achieve more predictable net cash provided by operating activities and to reduce our exposure to adverse fluctuations in the prices of oil and natural gas, we enter into commodity derivative contracts for a significant portion of our production. Commodity derivative arrangements expose us to the risk of financial loss in some circumstances, including situations when production is less than expected. If we experience a sustained material interruption in our production or if we are unable to perform our drilling activity as planned, we might be forced to satisfy all or a portion of our derivative obligations without the benefit of the cash flow from our sale of the underlying physical commodity, resulting in a substantial reduction of our liquidity, which may adversely affect our ability to pay distributions to our unitholders.
Our limited ability to hedge our NGL production could adversely impact our net cash provided by operating activities and results of operations.
A liquid, readily available and commercially viable market for hedging NGLs has not developed in the same way that exists for crude oil and natural gas. The current direct NGL hedging market is constrained in terms of price, volume, tenor and number of counterparties, which limits our ability to hedge our NGL production effectively or at all. As a result, our net cash provided by operating activities and results of operations could be adversely impacted by fluctuations in the market prices for NGL products.
Counterparty failure may adversely affect our derivative positions.
We cannot be assured that our counterparties will be able to perform under our derivative contracts. If a counterparty fails to perform and the derivative arrangement is terminated, our net cash provided by operating activities and ability to pay distributions could be impacted.
Commodity prices are volatile, and a significant decline in commodity prices for a prolonged period would reduce our revenues, net cash provided by operating activities and profitability and we may have to lower our distribution or may not be able to pay distributions at all.
Our revenue, profitability and cash flow depend upon the prices of and demand for oil, natural gas and NGL. The oil, natural gas and NGL market is very volatile and a drop in prices can significantly affect our financial results and impede our growth. Changes in oil, natural gas and NGL prices have a significant impact on the value of our reserves and on our net cash provided by operating activities. Prices for these commodities may fluctuate widely in response to relatively minor changes in the supply of and demand for them, market uncertainty and a variety of additional factors that are beyond our control, such as:
• | the domestic and foreign supply of and demand for oil, natural gas and NGL; |
• | the price and level of foreign imports; |
• | the level of consumer product demand; |
• | weather conditions; |
• | overall domestic and global economic conditions; |
• | political and economic conditions in oil and natural gas producing countries; |
• | the ability of members of the Organization of Petroleum Exporting Countries to agree to and maintain price and production controls; |
• | the impact of the U.S. dollar exchange rates on oil, natural gas and NGL prices; |
19
Item 1A. Risk Factors - Continued
• | technological advances affecting energy consumption; |
• | domestic and foreign governmental regulations and taxation; |
• | the impact of energy conservation efforts; |
• | the proximity and capacity of pipelines and other transportation facilities; and |
• | the price and availability of alternative fuels. |
In the past, the prices of oil, natural gas and NGL have been extremely volatile, and we expect this volatility to continue. If commodity prices decline significantly for a prolonged period, our net cash provided by operating activities will decline, and we may have to lower our distribution or may not be able to pay distributions at all.
Future price declines or downward reserve revisions may result in a write down of our asset carrying values, which could adversely affect our results of operations and limit our ability to borrow funds.
Declines in oil, natural gas and NGL prices may result in our having to make substantial downward adjustments to our estimated proved reserves. If this occurs, or if our estimates of development costs increase, production data factors change or drilling results deteriorate, accounting rules may require us to write down, as a noncash charge to earnings, the carrying value of our properties for impairments. We capitalize costs to acquire, find and develop our oil and natural gas properties under the successful efforts accounting method. We are required to perform impairment tests on our assets periodically and whenever events or changes in circumstances warrant a review of our assets. To the extent such tests indicate a reduction of the estimated useful life or estimated future cash flows of our assets, the carrying value may not be recoverable and therefore would require a write down. We have incurred impairment charges in the past and may do so in the future. Any impairment could be substantial and have a material adverse effect on our results of operations in the period incurred and on our ability to borrow funds under our Credit Facility, which in turn may adversely affect our ability to make cash distributions to our unitholders.
Unless we replace our reserves, our reserves and production will decline, which would adversely affect our net cash provided by operating activities from operations and our ability to make distributions to our unitholders.
Producing oil, natural gas and NGL reservoirs are characterized by declining production rates that vary depending upon reservoir characteristics and other factors. The overall rate of decline for our production will change if production from our existing wells declines in a different manner than we have estimated and can change when we drill additional wells, make acquisitions and under other circumstances. Thus, our future oil, natural gas and NGL reserves and production and, therefore, our cash flow and income, are highly dependent on our success in efficiently developing our current reserves and economically finding or acquiring additional recoverable reserves. We may not be able to develop, find or acquire additional reserves to replace our current and future production at acceptable costs, which would adversely affect our net cash provided by operating activities and our ability to make distributions to our unitholders.
Our estimated reserves are based on many assumptions that may prove to be inaccurate. Any material inaccuracies in these reserve estimates or underlying assumptions will materially affect the quantities and present value of our reserves.
No one can measure underground accumulations of oil, natural gas and NGL in an exact manner. Reserve engineering requires subjective estimates of underground accumulations of oil, natural gas and NGL and assumptions concerning future oil, natural gas and NGL prices, production levels and operating and development costs. As a result, estimated quantities of proved reserves and projections of future production rates and the timing of development expenditures may prove to be inaccurate. Independent petroleum engineering firms prepare estimates of our proved reserves. Some of our reserve estimates are made without the benefit of a lengthy production history, which are less reliable than estimates based on a lengthy production history. Also, we make certain assumptions regarding future oil, natural gas and NGL prices, production levels and operating and development costs that may prove incorrect. Any significant variance from these assumptions by actual amounts could greatly affect our estimates of reserves, the economically recoverable quantities of oil, natural gas and NGL attributable to any particular group of properties, the classifications of reserves based on risk of recovery and estimates of the future net cash flows. Numerous changes over time to the assumptions on which our reserve estimates are based, as described above, often result in the actual quantities of oil, natural gas and NGL we ultimately recover being different from our reserve estimates.
The present value of future net cash flows from our proved reserves is not necessarily the same as the current market value of our estimated oil, natural gas and NGL reserves. We base the estimated discounted future net cash flows from our proved
20
Item 1A. Risk Factors - Continued
reserves on an unweighted average of the first-day-of-the month price for each month during the 12-month calendar year and year-end costs. However, actual future net cash flows from our oil and natural gas properties also will be affected by factors such as:
• | actual prices we receive for oil, natural gas and NGL; |
• | the amount and timing of actual production; |
• | the timing and success of development activities; |
• | supply of and demand for oil, natural gas and NGL; and |
• | changes in governmental regulations or taxation. |
In addition, the 10% discount factor required to be used under the provisions of applicable accounting standards when calculating discounted future net cash flows, may not be the most appropriate discount factor based on interest rates in effect from time to time and risks associated with us or the oil and natural gas industry in general.
Our development operations require substantial capital expenditures, which will reduce our cash available for distribution. We may be unable to obtain needed capital or financing on satisfactory terms, which could lead to a decline in our reserves.
The oil and natural gas industry is capital intensive. We make and expect to continue to make substantial capital expenditures in our business for the development and production of oil, natural gas and NGL reserves. These expenditures will reduce our cash available for distribution. We intend to finance our future capital expenditures with net cash provided by operating activities and to the extent necessary, with equity and debt offerings or bank borrowings. Our net cash provided by operating activities and access to capital are subject to a number of variables, including:
• | our proved reserves; |
• | the level of oil, natural gas and NGL we are able to produce from existing wells; |
• | the prices at which we are able to sell our oil, natural gas and NGL; and |
• | our ability to acquire, locate and produce new reserves. |
If our revenues or the borrowing base under our Credit Facility decrease as a result of lower oil, natural gas and NGL prices, operating difficulties, declines in reserves or for any other reason, we may have limited ability to obtain the capital necessary to sustain our operations at current levels. Our Credit Facility restricts our ability to obtain new financing. If additional capital is needed, we may not be able to obtain debt or equity financing on terms favorable to us, or at all. If net cash provided by operating activities or cash available under our Credit Facility is not sufficient to meet our capital requirements, the failure to obtain additional financing could result in a curtailment of our development operations, which in turn could lead to a possible decline in our reserves.
We may decide not to drill some of the prospects we have identified, and locations that we decide to drill may not yield oil, natural gas and NGL in commercially viable quantities.
Our prospective drilling locations are in various stages of evaluation, ranging from a prospect that is ready to drill to a prospect that will require additional geological and engineering analysis. Based on a variety of factors, including future oil, natural gas and NGL prices, the generation of additional seismic or geological information, the availability of drilling rigs and other factors, we may decide not to drill one or more of these prospects. As a result, we may not be able to increase or sustain our reserves or production, which in turn could have an adverse effect on our business, financial position, results of operations and our ability to pay distributions. In addition, the SEC’s reserve reporting rules include a general requirement that, subject to limited exceptions, proved undeveloped reserves may only be booked if they relate to wells scheduled to be drilled within five years of the date of booking. At December 31, 2012, we had 2,504 proved undeveloped drilling locations. To the extent that we do not drill these locations within five years of initial booking, they may not continue to qualify for classification as proved reserves, and we may be required to reclassify such reserves as unproved reserves. The reclassification of such reserves could also have a negative effect on the borrowing base under our Credit Facility.
The cost of drilling, completing and operating a well is often uncertain, and cost factors can adversely affect the economics of a well. Our efforts will be uneconomic if we drill dry holes or wells that are productive but do not produce enough oil, natural gas and NGL to be commercially viable after drilling, operating and other costs. If we drill future wells that we identify as dry holes, our drilling success rate would decline, which could have an adverse effect on our business, financial position or results of operations.
21
Item 1A. Risk Factors - Continued
Our business depends on gathering and transportation facilities. Any limitation in the availability of those facilities would interfere with our ability to market the oil, natural gas and NGL we produce, and could reduce our cash available for distribution and adversely impact expected increases in oil, natural gas and NGL production from our drilling program.
The marketability of our oil, natural gas and NGL production depends in part on the availability, proximity and capacity of gathering and pipeline systems. The amount of oil, natural gas and NGL that can be produced and sold is subject to limitation in certain circumstances, such as pipeline interruptions due to scheduled and unscheduled maintenance, excessive pressure, physical damage to the gathering or transportation system, or lack of contracted capacity on such systems. The curtailments arising from these and similar circumstances may last from a few days to several months. In many cases, we are provided only with limited, if any, notice as to when these circumstances will arise and their duration. In addition, some of our wells are drilled in locations that are not serviced by gathering and transportation pipelines, or the gathering and transportation pipelines in the area may not have sufficient capacity to transport additional production. As a result, we may not be able to sell the oil, natural gas and NGL production from these wells until the necessary gathering and transportation systems are constructed. Any significant curtailment in gathering system or pipeline capacity, or significant delay in the construction of necessary gathering and transportation facilities, would interfere with our ability to market the oil, natural gas and NGL we produce, and could reduce our cash available for distribution and adversely impact expected increases in oil, natural gas and NGL production from our drilling program.
We depend on certain key customers for sales of our oil, natural gas and NGL. To the extent these and other customers reduce the volumes they purchase from us or delay payment, our revenues and cash available for distribution could decline. Further, a general increase in nonpayment could have an adverse impact on our financial position and results of operations.
For the year ended December 31, 2012, Enbridge Energy Partners, L.P. and DCP Midstream Partners, LP accounted for approximately 24% and 13%, respectively, of our total production volumes, or 37% in the aggregate. For the year ended December 31, 2011, Enbridge Energy Partners, L.P. and DCP Midstream Partners, LP accounted for approximately 21% and 19%, respectively, of our total production volumes, or 40% in the aggregate. To the extent these and other customers reduce the volumes of oil, natural gas or NGL that they purchase from us, our revenues and cash available for distribution could decline.
Many of our leases are in areas that have been partially depleted or drained by offset wells.
Our key project areas are located in some of the most active drilling areas of the producing basins in the U.S. As a result, many of our leases are in areas that have already been partially depleted or drained by earlier offset drilling. This may inhibit our ability to find economically recoverable quantities of reserves in these areas.
Our identified drilling location inventories are scheduled out over several years, making them susceptible to uncertainties that could materially alter the occurrence or timing of their drilling, resulting in temporarily lower net cash provided by operating activities, which may impact our ability to pay distributions.
Our management has specifically identified and scheduled drilling locations as an estimation of our future multi-year drilling activities on our existing acreage. As of December 31, 2012, we had identified 10,981 drilling locations, of which 2,504 were proved undeveloped locations and 8,477 were other locations. These identified drilling locations represent a significant part of our growth strategy. Our ability to drill and develop these locations depends on a number of factors, including the availability of capital, seasonal conditions, regulatory approvals, oil, natural gas and NGL prices, costs and drilling results. In addition, DeGolyer and MacNaughton has not estimated proved reserves for the 8,477 other drilling locations we have identified and scheduled for drilling, and therefore there may be greater uncertainty with respect to the success of drilling wells at these drilling locations. Our final determination on whether to drill any of these drilling locations will be dependent upon the factors described above as well as, to some degree, the results of our drilling activities with respect to our proved drilling locations. Because of these uncertainties, we do not know if the numerous drilling locations we have identified will be drilled within our expected timeframe or will ever be drilled or if we will be able to produce oil, natural gas and NGL from these or any other potential drilling locations. As such, our actual drilling activities may materially differ from those presently identified, which could adversely affect our business.
22
Item 1A. Risk Factors - Continued
Drilling for and producing oil, natural gas and NGL are high risk activities with many uncertainties that could adversely affect our financial position or results of operations and, as a result, our ability to pay distributions to our unitholders.
Our drilling activities are subject to many risks, including the risk that we will not discover commercially productive reservoirs. Drilling for oil, natural gas and NGL can be uneconomic, not only from dry holes, but also from productive wells that do not produce sufficient revenues to be commercially viable. In addition, our drilling and producing operations may be curtailed, delayed or canceled as a result of other factors, including:
• | the high cost, shortages or delivery delays of equipment and services; |
• | unexpected operational events; |
• | adverse weather conditions; |
• | facility or equipment malfunctions; |
• | title problems; |
• | pipeline ruptures or spills; |
• | compliance with environmental and other governmental requirements; |
• | unusual or unexpected geological formations; |
• | loss of drilling fluid circulation; |
• | formations with abnormal pressures; |
• | fires; |
• | blowouts, craterings and explosions; and |
• | uncontrollable flows of oil, natural gas and NGL or well fluids. |
Any of these events can cause increased costs or restrict our ability to drill the wells and conduct the operations which we currently have planned. Any delay in the drilling program or significant increase in costs could impact our ability to generate sufficient net cash provided by operating activities to pay distributions to our unitholders at the current distribution level or at all. Increased costs could include losses from personal injury or loss of life, damage to or destruction of property, natural resources and equipment, pollution, environmental contamination, loss of wells and regulatory penalties. We ordinarily maintain insurance against certain losses and liabilities arising from our operations. However, it is impossible to insure against all operational risks in the course of our business. Additionally, we may elect not to obtain insurance if we believe that the cost of available insurance is excessive relative to the perceived risks presented. Losses could therefore occur for uninsurable or uninsured risks or in amounts in excess of existing insurance coverage. The occurrence of an event that is not fully covered by insurance could have a material adverse impact on our business activities, financial position and results of operations.
We have limited control over the activities on properties we do not operate.
Other companies operate some of the properties in which we have an interest. Nonoperated wells represented approximately 30% of our total owned gross wells, or approximately 9% of our owned net wells, as of December 31, 2012. We have limited ability to influence or control the operation or future development of these nonoperated properties, including timing of drilling and other scheduled operations activities, compliance with environmental, safety and other regulations, or the amount of capital expenditures that we are required to fund with respect to them. The failure of an operator of our wells to adequately perform operations, an operator’s breach of the applicable agreements or an operator’s failure to act in ways that are in our best interest could reduce our production and revenues. Our dependence on the operator and other working interest owners for these projects and our limited ability to influence or control the operation and future development of these properties could materially adversely affect the realization of our targeted returns on capital in drilling or acquisition activities and lead to unexpected future costs.
Because we handle oil, natural gas and NGL and other hydrocarbons, we may incur significant costs and liabilities in the future resulting from a failure to comply with new or existing environmental regulations or an accidental release of hazardous substances into the environment.
The operations of our wells, gathering systems, turbines, pipelines and other facilities are subject to stringent and complex federal, state and local environmental laws and regulations. Failure to comply with these laws and regulations may trigger a variety of administrative, civil and criminal enforcement measures, including the assessment of monetary penalties, the imposition of remedial requirements, and the issuance of orders enjoining future operations. There is an inherent risk that we may incur environmental costs and liabilities due to the nature of our business and the substances we handle. Certain
23
Item 1A. Risk Factors - Continued
environmental statutes, including the RCRA, CERCLA and analogous state laws and regulations, impose strict, joint and several liability for costs required to clean up and restore sites where hazardous substances have been disposed of or otherwise released. In addition, an accidental release from one of our wells or gathering pipelines could subject us to substantial liabilities arising from environmental cleanup and restoration costs, claims made by neighboring landowners and other third parties for personal injury and property damage and fines or penalties for related violations of environmental laws or regulations.
Moreover, the possibility exists that stricter laws, regulations or enforcement policies could significantly increase our compliance costs and the cost of any remediation that may become necessary, and these costs may not be recoverable from insurance. For a more detailed discussion of environmental and regulatory matters impacting our business, see Item 1. “Business - Environmental Matters and Regulation.”
We are subject to complex federal, state, local and other laws and regulations that could adversely affect the cost, manner or feasibility of doing business.
Our operations are regulated extensively at the federal, state and local levels. Environmental and other governmental laws and regulations have resulted in delays and increased the costs to plan, design, drill, install, operate and abandon oil and natural gas wells. Under these laws and regulations, we could also be liable for personal injuries, property damage and other damages. Failure to comply with these laws and regulations may result in the suspension or termination of our operations and subject us to administrative, civil and criminal penalties. Moreover, public interest in environmental protection has increased in recent years, and environmental organizations have opposed, with some success, certain drilling projects.
Part of the regulatory environment in which we operate includes, in some cases, legal requirements for obtaining environmental assessments, environmental impact studies and/or plans of development before commencing drilling and production activities. In addition, our activities are subject to the regulations regarding conservation practices and protection of correlative rights. These regulations affect our operations and limit the quantity of oil, natural gas and NGL we may produce and sell. A major risk inherent in our drilling plans is the need to obtain drilling permits from state and local authorities. Delays in obtaining regulatory approvals or drilling permits, the failure to obtain a drilling permit for a well or the receipt of a permit with unreasonable conditions or costs could have a material adverse effect on our ability to develop our properties. Additionally, the regulatory environment could change in ways that might substantially increase the financial and managerial costs of compliance with these laws and regulations and, consequently, adversely affect our ability to pay distributions to our unitholders. For a description of the laws and regulations that affect us, see Item 1. “Business - Environmental Matters and Regulation.”
Federal and state legislation and regulatory initiatives related to hydraulic fracturing could result in increased costs and operating restrictions or delays.
Hydraulic fracturing is an important and common practice that is used to stimulate production of hydrocarbons from tight formations. Due to concerns raised relating to potential impacts of hydraulic fracturing on groundwater quality, legislative and regulatory efforts at the federal level and in some states have been initiated to render permitting and compliance requirements more stringent for hydraulic fracturing or prohibit the activity altogether. For example, the EPA has asserted federal regulatory authority over hydraulic fracturing involving fluids that contain diesel fuel under the Safe Drinking Water Act’s Underground Injection Control Program and has released draft permitting guidance for hydraulic fracturing operations that use diesel fuel in fracturing fluids in those states where the EPA is the permitting authority. In addition, both Texas and Louisiana have adopted disclosure regulations requiring varying degrees of disclosure of the constituents in hydraulic fracturing fluids. Such efforts could have an adverse effect on our oil and natural gas production activities. For a more detailed discussion of hydraulic fracturing matters impacting our business, see Item 1. “Business - Environmental Matters and Regulation.”
We may issue additional units without unitholder approval, which would dilute existing ownership interests.
We may issue an unlimited number of limited liability company interests of any type, including units, without the approval of our unitholders.
The issuance of additional units or other equity securities may have the following effects:
• | an individual unitholder’s proportionate ownership interest in us may decrease; |
24
Item 1A. Risk Factors - Continued
• | the relative voting strength of each previously outstanding unit may be reduced; |
• | the amount of cash available for distribution per unit may decrease; and |
• | the market price of the units may decline. |
Our management may have conflicts of interest with the unitholders. Our limited liability company agreement limits the remedies available to our unitholders in the event unitholders have a claim relating to conflicts of interest.
Conflicts of interest may arise between our management on one hand, and the Company and our unitholders on the other hand, related to the divergent interests of our management. Situations in which the interests of our management may differ from interests of our nonaffiliated unitholders include, among others, the following situations:
• | our limited liability company agreement gives our Board of Directors broad discretion in establishing cash reserves for the proper conduct of our business, which will affect the amount of cash available for distribution. For example, our management will use its reasonable discretion to establish and maintain cash reserves sufficient to fund our drilling program; |
• | our management team, subject to oversight from our Board of Directors, determines the timing and extent of our drilling program and related capital expenditures, asset purchases and sales, borrowings, issuances of additional units and reserve adjustments, all of which will affect the amount of cash that we distribute to our unitholders; and |
• | affiliates of our directors are not prohibited from investing or engaging in other businesses or activities that compete with the Company. |
We do not have the same flexibility as other types of organizations to accumulate cash and equity to protect against illiquidity in the future.
Unlike a corporation, our limited liability company agreement requires us to make distributions to our unitholders of all available cash reduced by any amounts of reserves for commitments and contingencies, including capital and operating costs and debt service requirements. The value of our units may decrease in direct correlation with decreases in the amount we distribute per unit. Accordingly, if we experience a liquidity problem in the future, we may have difficulty issuing more equity to recapitalize.
Our tax treatment depends on our status as a partnership for federal income tax purposes, as well as our not being subject to a material amount of entity level taxation by individual states. If the Internal Revenue Service (“IRS”) were to treat us as a corporation for federal income tax purposes or we were to become subject to entity level taxation for state tax purposes, taxes paid, if any, would reduce the amount of cash available for distribution.
The anticipated after-tax economic benefit of an investment in our units depends largely on our being treated as a partnership for federal income tax purposes. We have not requested, and do not plan to request, a ruling from the IRS on this or any other tax matter that affects us.
If we were treated as a corporation for federal income tax purposes, we would pay federal income tax on our taxable income at the corporate tax rates, currently at a maximum rate of 35%. Distributions would generally be taxed again as corporate distributions, and no income, gain, loss, deduction or credit would flow through to unitholders. Because a tax may be imposed on us as a corporation, our cash available for distribution to our unitholders could be reduced. Therefore, treatment of us as a corporation would result in a material reduction in the anticipated cash flow and after-tax return to our unitholders, likely causing a substantial reduction in the value of our units.
Current law or our business may change so as to cause us to be treated as a corporation for federal income tax purposes or otherwise subject us to entity level taxation. Any modification to current law or interpretations thereof may or may not be applied retroactively and could make it more difficult or impossible to meet the requirements for partnership status, affect or cause us to change our business activities, affect the tax considerations of an investment in us, change the character or treatment of portions of our income and adversely affect an investment in our units.
In addition, because of widespread state budget deficits and other reasons, several states are evaluating ways to subject partnerships and limited liability companies to entity level taxation through the imposition of state income, franchise or other forms of taxation. For example, we are required to pay Texas franchise tax on our total revenue apportioned to Texas at a maximum effective rate of 0.7%. Imposition of a tax on us by any other state would reduce the amount of cash available for distribution to our unitholders.
25
Item 1A. Risk Factors - Continued
A successful IRS contest of the federal income tax positions we take may adversely affect the market for our units, and the cost of an IRS contest will reduce our cash available for distribution to our unitholders.
The IRS may adopt tax positions that differ from the positions we take. It may be necessary to resort to administrative or court proceedings to sustain some or all of the positions we take. A court may not agree with some or all of the positions we take. Any contest with the IRS may materially and adversely impact the market for our units and the price at which they trade.
Unitholders are required to pay taxes on their share of our taxable income, including their share of ordinary income and capital gain upon dispositions of properties by us, even if they do not receive any cash distributions from us. A unitholder’s share of our taxable income, gain, loss and deduction, or specific items thereof, may be substantially different than the unitholder’s interest in our economic profits.
Our unitholders are required to pay federal income taxes and, in some cases, state and local income taxes on their share of our taxable income, whether or not they receive cash distributions from us. Our unitholders may not receive cash distributions from us equal to their share of our taxable income or even equal to the actual tax liability that results from their share of our taxable income. For example, we may sell a portion of our properties and use the proceeds to pay down debt or acquire other properties rather than distributing the proceeds to our unitholders, and some or all of our unitholders may be allocated substantial taxable income with respect to that sale.
A unitholder’s share of our taxable income upon a disposition of property by us may be ordinary income or capital gain or some combination thereof. Even where we dispose of properties that are capital assets, what otherwise would be capital gains may be recharacterized as ordinary income in order to “recapture” ordinary deductions that were previously allocated to that unitholder related to the same property.
A unitholder’s share of our taxable income and gain (or specific items thereof) may be substantially greater than, or our tax losses and deductions (or specific items thereof) may be substantially less than, the unitholder’s interest in our economic profits. This may occur, for example, in the case of a unitholder who purchases units at a time when the value of our units or of one or more of our properties is relatively low or a unitholder who acquires units directly from us in exchange for property whose fair market value exceeds its tax basis at the time of the exchange.
A unitholder’s taxable gain or loss on the disposition of our units could be more or less than expected.
If unitholders sell their units, they will recognize a gain or loss equal to the difference between the amount realized and their tax basis in those units. Prior distributions to our unitholders in excess of the total net taxable income they were allocated for a unit, which decreases their tax basis, will become taxable income to our unitholders if the unit is sold at a price greater than their tax basis in that unit, even if the price received is less than their original cost.
A substantial portion of the amount realized, whether or not representing gain, may be ordinary income. In addition, if unitholders sell their units, they may incur a tax liability in excess of the amount of cash they receive from the sale. If the IRS successfully contests some positions we take, unitholders could recognize more gain on the sale of units than would be the case under those positions, without the benefit of decreased income in prior years.
Tax-exempt entities and non-U.S. persons face unique tax issues from owning our units that may result in adverse tax consequences to them.
Investment in units by tax-exempt entities, such as individual retirement accounts (known as IRAs) and other retirement plans, and non-U.S. persons raises issues unique to them. For example, virtually all of our income allocated to organizations that are exempt from federal income tax, including IRAs and other retirement plans, will be unrelated business taxable income and will be taxable to them. Distributions to non-U.S. persons will be reduced by withholding taxes at the highest applicable effective tax rate, and non-U.S. persons will be required to file U.S. federal tax returns and pay tax on their share of our taxable income.
26
Item 1A. Risk Factors - Continued
We treat each purchaser of units as having the same economic and tax characteristics without regard to the units purchased. The IRS may challenge this treatment, which could adversely affect the value of the units.
Because we cannot match transferors and transferees of units, we must maintain uniformity of the economic and tax characteristics of our units to a purchaser of units. We take depletion, depreciation and amortization and other positions that are intended to maintain such uniformity. These positions may not conform with all aspects of existing Treasury regulations and may affect the amount or timing of income, gain, loss or deduction allocable to a unitholder or the amount of gain from a unitholder’s sale of units. A successful IRS challenge to those positions could also adversely affect the amount or timing of income, gain, loss or deduction allocable to a unitholder, or the amount of gain from a unitholder’s sale of units and could have a negative impact on the value of our units or result in audit adjustments to unitholder tax returns.
The sale or exchange of 50% or more of our capital and profits interests within a 12-month period will result in the deemed termination of our tax partnership for federal income tax purposes.
We will be considered to have terminated for federal income tax purposes if there is a sale or exchange of 50% or more of the total interests in our capital and profits within a 12-month period. Our termination would, among other things, result in the closing of our taxable year for all unitholders and could result in a deferral of depreciation deductions allowable in computing our taxable income. If this occurs, our unitholders will be allocated an increased amount of federal taxable income for the year in which we are considered to be terminated as a percentage of the cash distributed to the unitholders with respect to that period.
We prorate our items of income, gain, loss and deduction between transferors and transferees of our units each month (or in some cases for periods shorter than a month) based upon the ownership of our units on the first day of each month (or shorter period), instead of on the basis of the date a particular unit is transferred. The IRS may challenge this treatment, which could change the allocation of items of income, gain, loss and deduction among our unitholders.
We prorate our items of income, gain, loss and deduction between transferors and transferees of our units each month (or in some cases for periods shorter than a month) based upon the ownership of our units on the first day of each month (or shorter period), instead of on the basis of the date a particular unit is transferred. The use of this proration method may not be permitted under existing Treasury regulations. If the IRS were to challenge this method or new Treasury regulations were issued, we may be required to change the allocation of items of income, gain, loss and deduction among our unitholders.
A unitholder whose units are loaned to a “short seller” to cover a short sale of units may be considered as having disposed of those units. If so, the unitholder would no longer be treated for tax purposes as a partner with respect to those units during the period of the loan and may recognize gain or loss from the disposition.
Because a unitholder whose units are loaned to a “short seller” to cover a short sale of units may be considered as having disposed of the loaned units, the unitholder may no longer be treated for tax purposes as a partner with respect to those units during the period of the loan to the short seller and the unitholder may recognize gain or loss from such disposition. Moreover, during the period of the loan to the short seller, any of our income, gain, loss, or deduction with respect to those units may not be reportable by the unitholder and any cash distributions received by the unitholder as to those units could be fully taxable as ordinary income. Unitholders desiring to assure their status as partners and avoid the risk of gain recognition from a loan to a short seller are urged to modify any applicable brokerage account agreements to prohibit their brokers from borrowing their units.
Unitholders may be subject to state and local taxes and return filing requirements in states and jurisdictions where they do not live as a result of investing in our units.
In addition to federal income taxes, our unitholders will likely be subject to other taxes, including state and local taxes, unincorporated business taxes and estate, inheritance or intangible taxes that are imposed by the various jurisdictions in which we do business or own property now or in the future, even if they do not reside in any of those jurisdictions. Our unitholders will likely be required to file foreign, state and local income tax returns and pay state and local income taxes in some or all of these jurisdictions. Further, our unitholders may be subject to penalties for failure to comply with those requirements. In 2012, we have been registered to do business or have owned assets in Arkansas, California, Colorado, Illinois, Indiana, Kansas, Louisiana, Michigan, Mississippi, Montana, New Mexico, North Dakota, Oklahoma, Pennsylvania, South Dakota, Texas and Wyoming. As we make acquisitions or expand our business, we may do business or own assets in
27
Item 1A. Risk Factors - Continued
other states in the future. It is the responsibility of each unitholder to file all U.S. federal, state and local tax returns that may be required of such unitholder.
Changes to current federal tax laws may affect unitholders’ ability to take certain tax deductions.
Substantive changes to the existing federal income tax laws have been proposed that, if adopted, would affect, among other things, the ability to take certain operations-related deductions, including deductions for intangible drilling and percentage depletion and deductions for U.S. production activities. Other proposed changes may affect our ability to remain taxable as a partnership for federal income tax purposes. We are unable to predict whether any changes, or other proposals to such laws, ultimately will be enacted. Any such changes could negatively impact the value of an investment in our units.
Recently enacted derivatives legislation could have an adverse impact on our ability to use derivative instruments to reduce the effect of commodity price, interest rate and other risks associated with our business.
New comprehensive financial reform legislation was signed into law by the President on July 21, 2010. The legislation calls for the Commodity Futures Trading Commission (the “CFTC”) to regulate certain markets for over-the-counter (“OTC”) derivative products. In its rulemaking under the new legislation, the CFTC has proposed regulations to set position limits for certain futures and option contracts in the major energy markets and for swaps that are their economic equivalent. Certain bona fide hedging transactions or positions would be exempt from these position limits. The position limits rule was challenged in court by two industry associations and was vacated and remanded by a federal district court. The CFTC appealed the district court’s ruling and that appeal is pending. The financial reform legislation may also require our swap-dealer counterparties to comply with margin requirements and/or capital requirements relating to our uncleared swaps with those counterparties, but the timing of any adoption of any such regulations, and their scope, are uncertain. These and other CFTC rules implementing Dodd-Frank could impose burdens on market participants to such an extent that liquidity in the bilateral OTC derivative market decreases substantially. The legislation and new regulations may also require counterparties to our derivative instruments to spin off some of their derivatives activities to separate entities, which may not be as creditworthy as the current counterparties. The new legislation and any new regulations, including determinations with respect to the applicability of margin and capital requirements for uncleared trades, could significantly increase the cost of derivative contracts, materially alter the terms of derivative contracts, reduce the availability of derivatives to protect against risks we encounter, reduce our ability to monetize or restructure our existing derivative contracts, and increase our exposure to less creditworthy counterparties. If we reduce our use of derivatives as a result of the legislation and regulations, our results of operations may become more volatile and our cash flows may be less predictable, which could adversely affect our ability to plan for and fund capital expenditures and to generate sufficient cash flow to pay distributions at the current levels or at all. Any of these consequences could have a material, adverse effect on us, our financial condition, and our results of operations.
Risks Relating to the SEC Inquiry and Shareholder Litigation
We will incur significant costs associated with the pending SEC inquiry and other legal proceedings, and the ultimate outcome of these matters is uncertain.
We, LinnCo and our and LinnCo’s current and former directors and officers are the subjects of a number of purported class action lawsuits and derivative lawsuits, and there is an ongoing private SEC inquiry regarding us and LinnCo. We cannot predict the duration, outcome or impact of these pending matters, but the lawsuits could result in judgments against us and LinnCo and directors and officers named as defendants. Furthermore, we are unable to predict the timing or outcome of the SEC inquiry or estimate the nature or amount of any possible sanction or enforcement action the SEC could seek to impose, which could include fines, penalties, damages, sanctions, administrative remedies and modifications to our disclosure, accounting and business practices, including a prohibition on specific conduct or a potential restatement of our financial statements, any of which could be material. Our legal expenses incurred in defending the lawsuits and responding to the SEC inquiry have been significant and we expect them to continue to be significant in the future. In addition, members of our senior management have been required to divert significant attention and resources to these matters, reducing the time, attention and resources they have available to devote to managing our business. These additional expenses and diversion of attention and resources, along with any reputational issues raised by these lawsuits and inquiry, may materially affect our business and results of operations and consequently our cash flow.
28
Item 1A. Risk Factors - Continued
Our ability to grow and increase cash flow is limited by reduced access to capital markets.
Our business model depends on access to capital markets at an acceptable cost to fund acquisitions and our capital expenditures. Due to uncertainty regarding the timing, duration and subject matter of the SEC’s inquiry and negative press related to such inquiry, we are limited in our ability to access the capital markets. If this situation persists, we may not be able to access the capital markets on acceptable terms, or at all, to make acquisitions or fund our capital expenditures necessary to sustain or increase current production, which may reduce our ability to generate higher revenues and consequently our ability to increase cash flow and sustain or increase distributions.
Failure to complete or delays in completing LinnCo’s pending merger with Berry could have an adverse impact on our unit price and our business.
We expect LinnCo to complete the merger by January 31, 2014. However, due to the pending SEC inquiry, the timing of LinnCo’s pending merger with Berry is uncertain. If the merger is not completed, or there are delays in completing the merger, our unit price and our business could be adversely affected and we would be subject to a number of risks, including the following:
• | the current trading price of our units may reflect a market assumption that the merger will be completed and a failure to complete or delays in completing the merger could result in a further decline in the price of our units; |
• | we may not realize the benefits expected from the merger, including cost savings, increased production, enhanced financial and competitive position and diversification of operating locations and assets; |
• | we will be required to pay certain costs relating to the merger, including certain investment banking, financing, legal and accounting fees and expenses, whether or not the merger is completed; and |
• | we may be responsible, under certain circumstances, for the net losses resulting from the termination of the derivatives transactions entered into by Berry at our request on or after the date of the merger agreement, which net losses could be significant. |
There can be no assurance that these risks will not materialize, and if any of them do, they may have an adverse effect on our financial position, results of operations and net cash provided by operating activities.
The SEC inquiry, shareholder litigation and other factors may make the market price of our units highly volatile.
The market price of our units could fluctuate substantially in the future due to the factors discussed in this “Risk Factors” section, including the risks relating to the SEC inquiry and shareholder litigation, and other factors including rumors or dissemination of false information; changes in coverage or earnings estimates by analysts; our ability to meet analysts’ or market expectations; and sales of our units by existing unitholders. For example, after the announcement of the SEC inquiry, the price of our units dropped significantly. Currently a number of purported class action lawsuits have been filed against us as well as derivative demands on behalf of certain purchasers of our units. Litigation of this kind could result in additional substantial litigation costs, a damages award against us, further diversion of management’s attention and additional volatility in the market price of our units.
Negative press from the SEC inquiry and shareholder litigation or otherwise could have a material adverse effect on our business, financial condition and results of operations.
The negative press resulting from the SEC inquiry and shareholder litigation matters have harmed our reputation and could otherwise result in a loss of future business with our counterparties and business partners. It could also adversely affect the public’s perception of us and lead to reluctance by new parties to do business with us. If our business partners and customers curtail their relationships with us, we could experience higher costs of doing business due to less favorable terms and/or the need to find alternative partners. There can be no assurance that our business partners and customers will not attempt to end or curtail their relationships with us.
29
Item 1A. Risk Factors - Continued
Risks Relating to the Merger
The exchange ratio is fixed and will not be adjusted in the event of any change in either LinnCo’s share price or Berry’s stock price.
Upon the consummation of the merger, each share of Berry common stock will be converted into the right to receive 1.68 LinnCo common shares, with cash paid in lieu of fractional shares. This exchange ratio was fixed in the merger agreement and will not be adjusted for changes in the market price of either LinnCo common shares or Berry common stock. Changes in the price of LinnCo common shares prior to the merger will affect the market value of the merger consideration that Berry stockholders will receive on the date of the merger. Stock price changes may result from a variety of factors (many of which are beyond our control and the control of Berry and LinnCo), including the following factors:
• | market reaction to the announcement of the merger and the prospects of the combined company; |
• | changes in our, Berry’s and LinnCo’s respective businesses, operations, assets, liabilities and prospects; |
• | changes in market assessments of our, Berry’s or LinnCo’s business, operations, financial position and prospects; |
• | market assessments of the likelihood that the merger will be completed; |
• | interest rates, general market and economic conditions and other factors generally affecting the price of LinnCo common shares and Berry common stock; |
• | the status of our SEC inquiry and litigation; |
• | federal, state and local legislation, governmental regulation and legal developments in the businesses in which we, Berry and LinnCo operate; and |
• | other factors beyond our, Berry’s and LinnCo’s control, including those described or referred to elsewhere in this “Risk Factors” section. |
The price of LinnCo common shares at the closing of the merger may vary from its price on the date the merger agreement was executed, on the date of this joint proxy statement/prospectus and on the date of the Berry special meeting and the LinnCo annual meeting. As a result, the market value of the merger consideration represented by the exchange ratio will also vary.
Because the merger will be completed after the dates of our annual meeting, the Berry special meeting and the LinnCo annual meeting, the exact market value of the LinnCo common shares that Berry stockholders will receive upon completion of the merger will be unknown on such date. Our unitholders should consider the following two risks:
• | If the price of LinnCo common shares increases between the date the merger agreement was signed or the date of the LinnCo annual meeting and the effective time of the merger, Berry stockholders will receive LinnCo common shares that have a market value upon completion of the merger that is greater than the market value of such shares calculated pursuant to the exchange ratio when the merger agreement was signed or the date of the LinnCo annual meeting, respectively. Therefore, while the number of LinnCo common shares to be issued per share of Berry common stock is fixed, the LinnCo common shareholders cannot be sure of the market value of the consideration that will be paid to Berry stockholders upon completion of the merger. |
• | If the price of LinnCo common shares declines between the date the merger agreement was signed or the date of the Berry special meeting and the effective time of the merger, including for any of the reasons described above, Berry stockholders will receive LinnCo common shares that have a market value upon completion of the merger that is less than the market value of such shares calculated pursuant to the exchange ratio on the date the merger agreement was signed or on the date of the Berry special meeting, respectively. Therefore, while the number of LinnCo common shares to be issued per share of Berry common stock is fixed, Berry stockholders cannot be sure of the market value of the LinnCo common shares they will receive upon completion of the merger or the market value of LinnCo common shares at any time after the completion of the merger. |
30
Item 1A. Risk Factors - Continued
The merger and related transactions are subject to approval by our unitholders, Berry stockholders and LinnCo shareholders.
In order for the merger to be completed, Berry stockholders must adopt the merger agreement and approve the merger and the other transactions contemplated by the merger agreement, which requires approval by a majority of the votes entitled to be cast by all outstanding shares of Berry common stock as of the record date for the Berry special meeting. While a vote of the LinnCo common shareholders is not required to approve the merger, the approval of the LinnCo common shareholders is required under NASDAQ Marketplace Rule 5635(a) in order for LinnCo to be authorized to issue LinnCo common shares to Berry stockholders in connection with the merger. Approval of the issuance of LinnCo common shares to Berry stockholders under NASDAQ rules requires the affirmative vote of a majority of votes cast by holders of LinnCo common shares at the LinnCo annual meeting. Additionally, the LinnCo common shareholders must approve certain amendments to the limited liability company agreement of LinnCo, which requires the affirmative vote of a majority of outstanding LinnCo voting shares and a majority of outstanding LinnCo common shares, voting as separate classes. In addition, in order for the merger to be completed, our unitholders must approve the issuance of our units to LinnCo in connection with the contribution of Berry to us, which requires the affirmative vote of a majority of the votes cast by holders of our units at our annual meeting under NASDAQ Marketplace Rule 5635(a).
We may experience difficulties in integrating the Berry business, which could cause the combined company to fail to realize many of the anticipated potential benefits of the merger.
We entered into the merger agreement because we believe that the transaction will be beneficial to Berry and its stockholders, LinnCo and its shareholders and us and our unitholders. Achieving the anticipated benefits of the transaction will depend in part upon whether we are able to integrate the business of Berry in an efficient and effective manner. We may not be able to accomplish this integration process smoothly or successfully. The difficulties of integrating Berry’s business with our business potentially will include, among other things, the necessity of coordinating geographically separated organizations and addressing possible differences incorporating cultures and management philosophies, and the integration of certain operations following the transaction, which will require the dedication of significant management resources and which may temporarily distract management’s attention from the day-to-day business of the combined company.
An inability to realize the full extent of the anticipated benefits of the transaction, as well as any delays encountered in the transition process, could have an adverse effect upon our revenues, level of expenses and operating results after the acquisition of Berry, which may affect the value of our units after the closing of the merger.
The terms of Berry’s indebtedness may restrict Berry’s ability to make distributions to us.
Berry’s credit facility and the indentures governing its outstanding notes contain, and any future indebtedness may also contain, a number of restrictive covenants that impose operating restrictions on Berry, including restrictions on Berry’s ability to make distributions to us. Any such restrictions on Berry’s ability to make distributions to us would adversely affect our ability to make distributions to our unitholders.
The market price of our units and LinnCo common shares after the merger may be affected by factors different from those affecting our units or the shares of LinnCo or Berry currently.
Our, Berry’s and LinnCo’s businesses differ and, accordingly, our results of operations after the acquisition of Berry and the market price of our units and LinnCo common shares after the merger may be affected by factors that differ from those currently affecting our, Berry’s or LinnCo’s independent results of operations.
The pendency of the merger could adversely affect our, Berry’s and LinnCo’s business and operations.
In connection with the pending merger, some of our and Berry’s customers or vendors may delay or defer decisions, which could negatively impact our, Berry’s and LinnCo’s revenues, earnings, cash flows and expenses, regardless of whether the merger is completed. In addition, due to operating covenants in the merger agreement, each of us, Berry and LinnCo may be unable, during the pendency of the merger, to pursue certain strategic transactions, undertake certain significant capital projects, undertake certain significant financing transactions and otherwise pursue other actions that are not in the ordinary course of business.
31
Item 1A. Risk Factors - Continued
The merger is subject to the receipt of consents and approvals from governmental entities that may impose conditions that could have an adverse effect on us or LinnCo.
Before the merger may be completed, various waivers, approvals, clearances or consents must be obtained from the FTC, FERC and the Antitrust Division of the Department of Justice (the “Antitrust Division”) and other authorities in the United States. These governmental entities may impose conditions on the completion of the merger or require changes to the terms of the merger. Although Berry and LinnCo do not currently expect that any such conditions or changes will be imposed, there can be no assurance that they will not be, and such conditions or changes could have the effect of delaying completion of the merger or imposing additional costs on us and LinnCo or limiting our and LinnCo’s revenues following the merger, any of which might have an adverse effect on us or LinnCo following the merger.
Failure to complete the merger could negatively affect our unit price and Berry’s and LinnCo’s stock price , respectively, and their respective future businesses and financial results.
If the merger is not completed, our, Berry’s and LinnCo’s ongoing businesses may be adversely affected and we, Berry and LinnCo will be subject to several risks and consequences, including the following:
• | under the merger agreement, Berry may be required, under certain circumstances, to pay LinnCo a termination fee of $83.7 million or $25.7 million in respect of LinnCo’s expenses; |
• | under the merger agreement, LinnCo may be required, under certain circumstances, to pay Berry a termination fee of $83.7 million or $25.7 million in respect of Berry’s expenses; |
• | We, Berry and LinnCo will be required to pay certain costs relating to the merger, whether or not the merger is completed, such as legal, accounting, financial advisor and printing fees; |
• | We, Berry and LinnCo would not realize the expected benefits of the merger; |
• | under the merger agreement, we and each of Berry and LinnCo are subject to certain restrictions on the conduct of its business prior to completing the merger which may adversely affect its ability to execute certain of its business strategies; |
• | matters relating to the merger may require substantial commitments of time and resources by Berry, LinnCo and our management, which could otherwise have been devoted to other opportunities that may have been beneficial to Berry, LinnCo and us as independent companies; and |
• | We, Berry or LinnCo may be responsible for the net losses resulting from the termination of the derivative transactions entered into by Berry on or after the date of the merger agreement, which net losses could be significant. |
In addition, if the merger is not completed, we, Berry and LinnCo may experience negative reactions from the financial markets and from our respective customers and employees. We, Berry and/or LinnCo also could be subject to litigation related to any failure to complete the merger or to enforcement proceedings commenced against us, Berry or LinnCo to attempt to force them to perform their respective obligations under the merger agreement.
We and LinnCo expect to incur substantial expenses related to the merger.
We and LinnCo expect to incur substantial expenses in connection with completing the merger and integrating the business, operations, networks, systems, technologies, policies and procedures of Berry with our own. There are a large number of systems that must be integrated, including billing, management information, purchasing, accounting and finance, sales, payroll and benefits, fixed assets, lease administration and regulatory compliance. Although we and LinnCo have assumed that a certain level of transaction and integration expenses would be incurred, there are a number of factors beyond our control that could affect the total amount or the timing of integration expenses. Many of the expenses that will be incurred, by their nature, are difficult to estimate accurately at the present time. Due to these factors, the transaction and integration expenses associated with the merger could, particularly in the near term, exceed the savings that the combined company expects to achieve from the elimination of duplicative expenses and the realization of economies of scale and cost savings
32
Item 1A. Risk Factors - Continued
related to the integration of the Berry business following the completion of the merger. As a result of these expenses, we and LinnCo expect to take charges against our respective earnings before and after the completion of the merger. The charges taken in connection with the merger are expected to be significant, although the aggregate amount and timing of such charges are uncertain at present.
Following the merger, we and Berry may be unable to retain key employees.
Our success and the success of LinnCo after the merger will depend in part upon our ability to retain key Berry and our employees. Key employees may depart either before or after the merger because of issues relating to the uncertainty and difficulty of integration or a desire not to remain following the merger. Accordingly, no assurance can be given that we will be able to retain key Berry employees or our employees to the same extent as in the past.
Pending litigation against us, Berry and LinnCo could result in an injunction preventing completion of the merger, the payment of damages in the event that the merger is completed and/or may adversely affect the combined company’s business, financial condition or results of operations following the merger.
Purported stockholder class actions have been filed against, among others, us, Berry, LinnCo and the members of the Berry board of directors. Multiple actions seek an injunction barring or rescinding the merger and damages in connection with the proposed transactions. If a final settlement is not reached, or if dismissals of these actions are not obtained, these lawsuits could prevent or delay the completion of the merger, and result in substantial costs to us Berry and LinnCo, including costs associated with the indemnification of directors. Additional lawsuits related to the merger may be filed against us, Berry, LinnCo and each of our respective directors. The defense or settlement of any lawsuit or claim that remains unresolved at the time the merger is completed may adversely affect the combined company’s business, financial condition or results of operations.
Item 1B. Unresolved Staff Comments
None
Item 2. Properties
Information concerning proved reserves, production, wells, acreage and related matters are contained in Item 1. “Business.”
The Company’s obligations under its Credit Facility are secured by mortgages on a substantial majority of its oil and natural gas properties. See Item 7. “Management’s Discussion and Analysis of Financial Condition and Results of Operations” and Note 6 for additional information concerning the Credit Facility.
Offices
The Company’s principal corporate office is located at 600 Travis, Suite 5100, Houston, Texas 77002. The Company maintains additional offices in California, Illinois, Kansas, Louisiana, Michigan, New Mexico, Oklahoma, Texas and Wyoming.
Item 3. Legal Proceedings
For a discussion of general legal proceedings, see Note 11 of Notes to Consolidated Financial Statements.
Item 4. Mine Safety Disclosures
Not applicable
33
Part II
Item 5. | Market for Registrant’s Common Equity, Related Stockholder Matters and Issuer Purchases of Equity Securities |
The Company’s units are listed on the NASDAQ Global Select Market (“NASDAQ”) under the symbol “LINE.” At the close of business on January 31, 2013, there were approximately 202 unitholders of record.
The following sets forth the range of high and low last reported sales prices per unit, as reported by NASDAQ, for the quarters indicated. In addition, distributions declared during each quarter are presented.
Unit Price Range | Cash Distributions Declared Per Unit | |||||||||||
Quarter | High | Low | ||||||||||
2012: | ||||||||||||
October 1 – December 31 | $ | 42.52 | $ | 35.24 | $ | 0.725 | ||||||
July 1 – September 30 | $ | 41.47 | $ | 38.46 | $ | 0.725 | ||||||
April 1 – June 30 | $ | 40.70 | $ | 35.00 | $ | 0.725 | ||||||
January 1 – March 31 | $ | 38.84 | $ | 35.67 | $ | 0.69 | ||||||
2011: | ||||||||||||
October 1 – December 31 | $ | 39.05 | $ | 32.80 | $ | 0.69 | ||||||
July 1 – September 30 | $ | 40.90 | $ | 31.91 | $ | 0.69 | ||||||
April 1 – June 30 | $ | 40.38 | $ | 36.65 | $ | 0.66 | ||||||
January 1 – March 31 | $ | 39.94 | $ | 37.34 | $ | 0.66 | ||||||
Distributions
Under the Company’s limited liability company agreement, unitholders are entitled to receive a distribution of available cash, which includes cash on hand plus borrowings less any reserves established by the Company’s Board of Directors to provide for the proper conduct of the Company’s business (including reserves for future capital expenditures, including drilling, acquisitions and anticipated future credit needs) or to fund distributions over the next four quarters.
Unitholder Return Performance Presentation
The performance graph below compares the total unitholder return on the Company’s units, with the total return of the Standard & Poor’s 500 Index (the “S&P 500 Index”) and the Alerian MLP Index, a weighted composite of 50 prominent energy master limited partnerships. Total return includes the change in the market price, adjusted for reinvested dividends or distributions, for the period shown on the performance graph and assumes that $100 was invested in the Company on December 31, 2007, and the S&P 500 Index and the Alerian MLP Index on the same date. The results shown in the graph below are not necessarily indicative of future performance.
34
Item 5. | Market for Registrant’s Common Equity, Related Stockholder Matters and Issuer Purchases of Equity Securities - Continued |
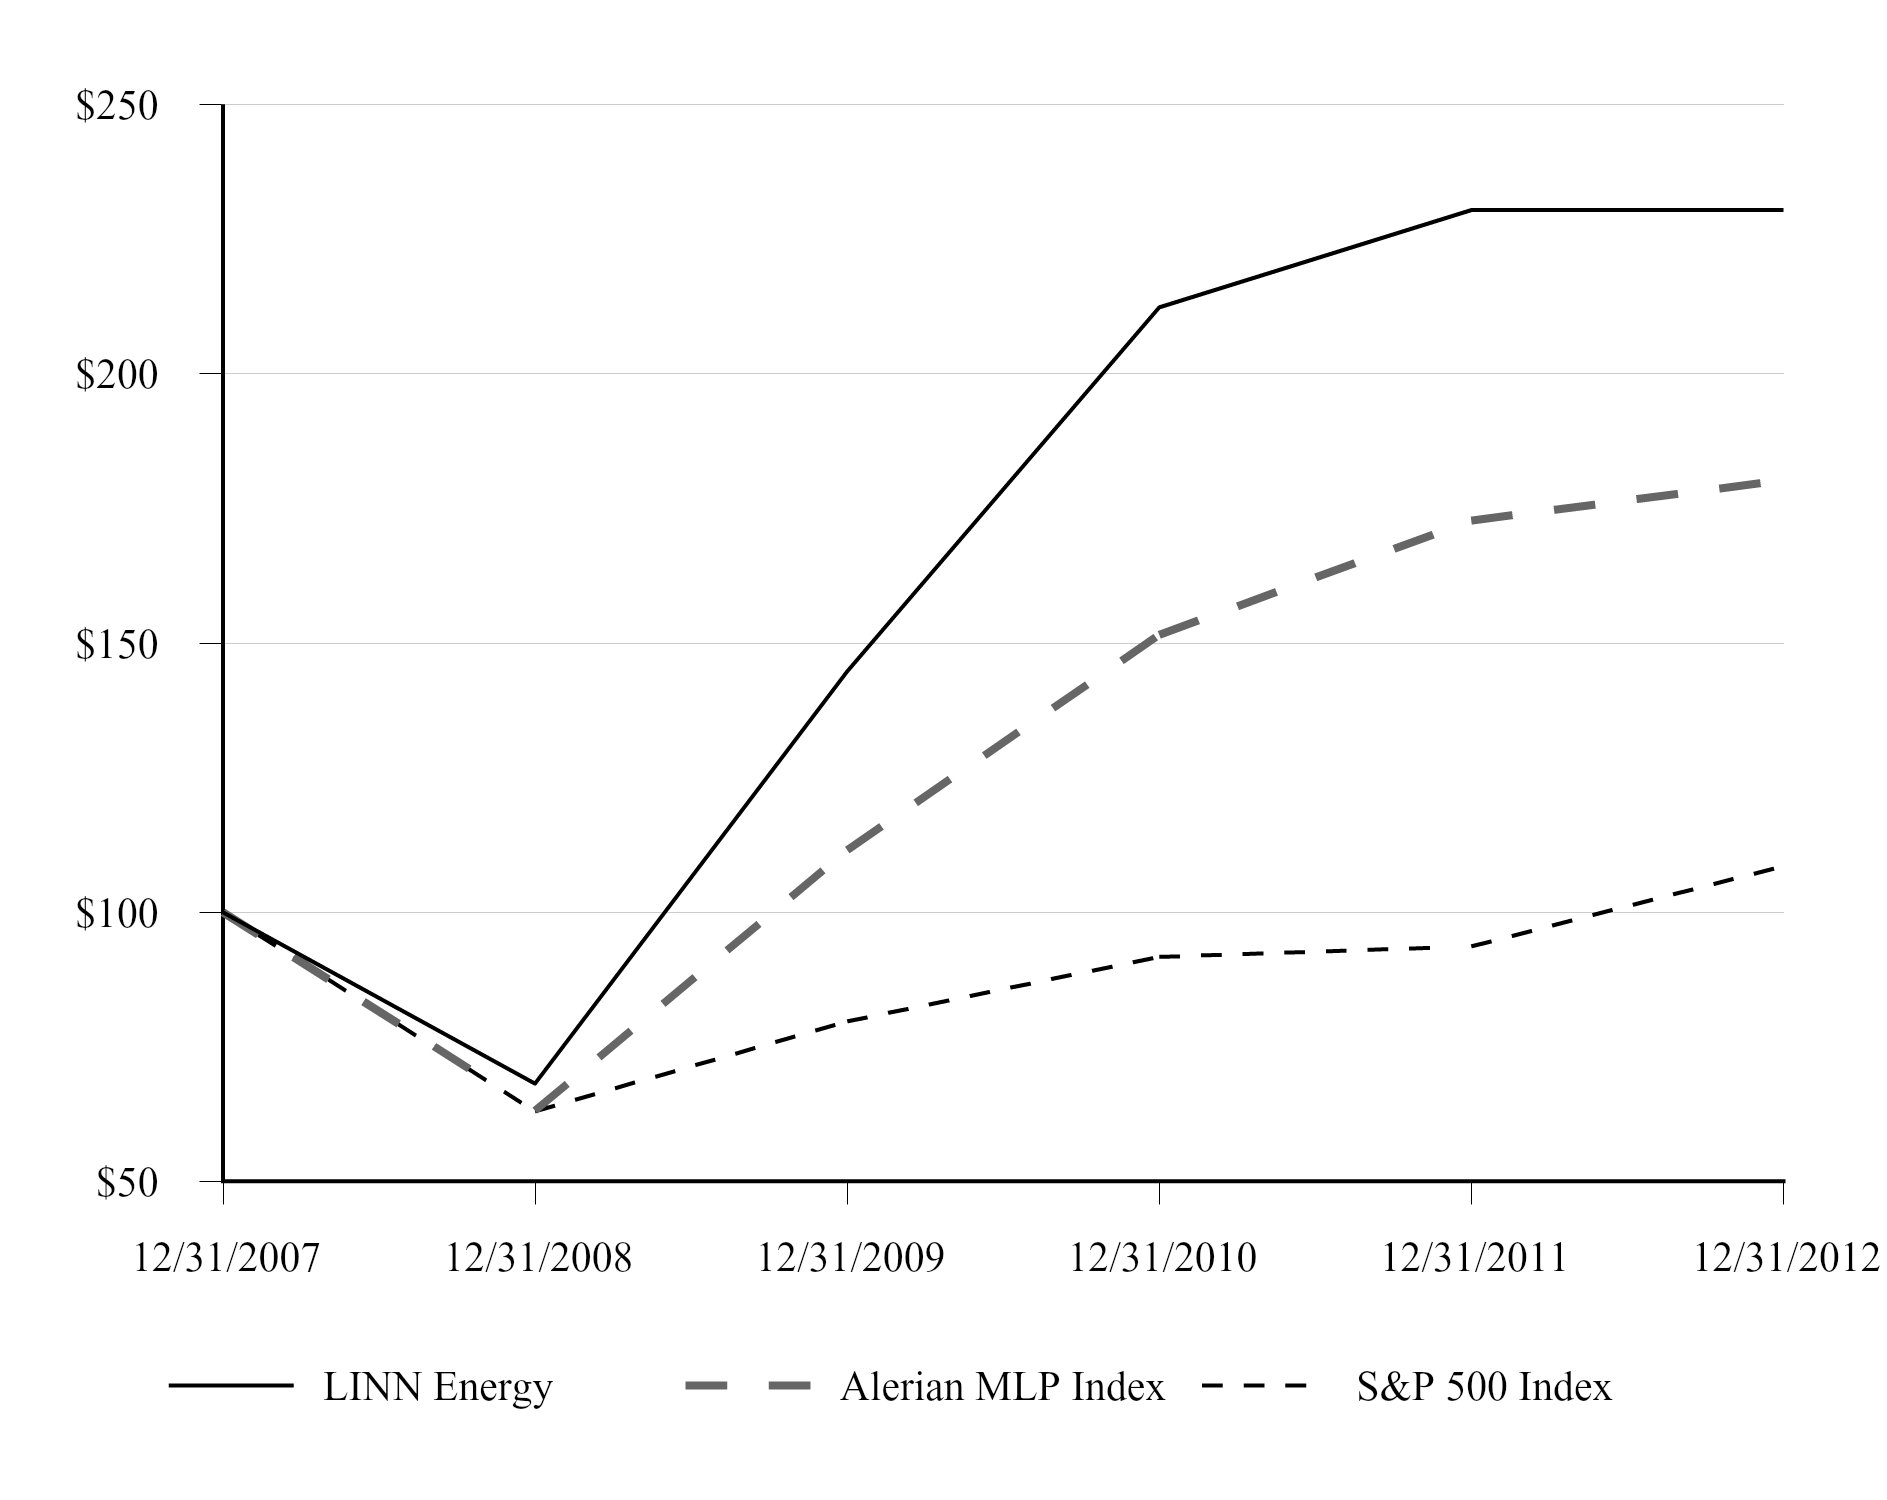
December 31, 2007 | December 31, 2008 | December 31, 2009 | December 31, 2010 | December 31, 2011 | December 31, 2012 | |||||||||||||||||||
LINN Energy | $ | 100 | $ | 68 | $ | 145 | $ | 212 | $ | 230 | $ | 230 | ||||||||||||
Alerian MLP Index | $ | 100 | $ | 63 | $ | 111 | $ | 152 | $ | 173 | $ | 180 | ||||||||||||
S&P 500 Index | $ | 100 | $ | 63 | $ | 80 | $ | 92 | $ | 94 | $ | 109 | ||||||||||||
Notwithstanding anything to the contrary set forth in any of the Company’s previous or future filings under the Securities Act of 1933 or the Securities Exchange Act of 1934 that might incorporate this Annual Report on Form 10-K or future filings with the Securities and Exchange Commission (“SEC”), in whole or in part, the preceding performance information shall not be deemed to be “soliciting material” or to be “filed” with the SEC or incorporated by reference into any filing except to the extent this performance presentation is specifically incorporated by reference therein.
Securities Authorized for Issuance Under Equity Compensation Plans
See the information incorporated by reference under Item 12. “Security Ownership of Certain Beneficial Owners and Management and Related Stockholder Matters” regarding securities authorized for issuance under the Company’s equity compensation plans, which information is incorporated by reference into this Item 5.
Sales of Unregistered Securities
None
Issuer Purchases of Equity Securities
In October 2008, the Board of Directors of the Company authorized the repurchase of up to $100 million of the Company’s outstanding units from time to time on the open market or in negotiated purchases. The repurchase plan does not obligate the Company to acquire any specific number of units and may be discontinued at any time. The Company did not repurchase any units during the three months ended December 31, 2012. At December 31, 2012, approximately $56 million was available for unit repurchase under the program.
35
Item 6. Selected Financial Data
The selected financial data set forth below should be read in conjunction with Item 7. “Management’s Discussion and Analysis of Financial Condition and Results of Operations” and Item 8. “Financial Statements and Supplementary Data.”
Because of rapid growth through acquisitions and development of properties, the Company’s historical results of operations and period-to-period comparisons of these results and certain other financial data may not be meaningful or indicative of future results. The results of the Company’s Appalachian Basin and Mid Atlantic Well Service, Inc. operations, which were disposed of in 2008, are classified as discontinued operations for the years ended December 31, 2008, and December 31, 2009. Unless otherwise indicated, results of operations information presented herein relates only to continuing operations.
At or for the Year Ended December 31, | ||||||||||||||||||||
2012 | 2011 | 2010 | 2009 | 2008 | ||||||||||||||||
(in thousands, except per unit amounts) | ||||||||||||||||||||
Statement of operations data: | ||||||||||||||||||||
Oil, natural gas and natural gas liquids sales | $ | 1,601,180 | $ | 1,162,037 | $ | 690,054 | $ | 408,219 | $ | 755,644 | ||||||||||
Gains (losses) on oil and natural gas derivatives | 124,762 | 449,940 | 75,211 | (141,374 | ) | 662,782 | ||||||||||||||
Depreciation, depletion and amortization | 606,150 | 334,084 | 238,532 | 201,782 | 194,093 | |||||||||||||||
Interest expense, net of amounts capitalized | 379,937 | 259,725 | 193,510 | 92,701 | 94,517 | |||||||||||||||
Income (loss) from continuing operations | (386,616 | ) | 438,439 | (114,288 | ) | (295,841 | ) | 825,657 | ||||||||||||
Income (loss) from discontinued operations, net of taxes (1) | — | — | — | (2,351 | ) | 173,959 | ||||||||||||||
Net income (loss) | (386,616 | ) | 438,439 | (114,288 | ) | (298,192 | ) | 999,616 | ||||||||||||
Income (loss) per unit – continuing operations: | ||||||||||||||||||||
Basic | (1.92 | ) | 2.52 | (0.80 | ) | (2.48 | ) | 7.18 | ||||||||||||
Diluted | (1.92 | ) | 2.51 | (0.80 | ) | (2.48 | ) | 7.18 | ||||||||||||
Income (loss) per unit – discontinued operations: | ||||||||||||||||||||
Basic | — | — | — | (0.02 | ) | 1.52 | ||||||||||||||
Diluted | — | — | — | (0.02 | ) | 1.52 | ||||||||||||||
Net income (loss) per unit: | ||||||||||||||||||||
Basic | (1.92 | ) | 2.52 | (0.80 | ) | (2.50 | ) | 8.70 | ||||||||||||
Diluted | (1.92 | ) | 2.51 | (0.80 | ) | (2.50 | ) | 8.70 | ||||||||||||
Distributions declared per unit | 2.865 | 2.70 | 2.55 | 2.52 | 2.52 | |||||||||||||||
Weighted average units outstanding | 203,775 | 172,004 | 142,535 | 119,307 | 114,140 | |||||||||||||||
Cash flow data: | ||||||||||||||||||||
Net cash provided by (used in): | ||||||||||||||||||||
Operating activities (2) | $ | 350,907 | $ | 518,706 | $ | 270,918 | $ | 426,804 | $ | 179,515 | ||||||||||
Investing activities | (3,684,829 | ) | (2,130,360 | ) | (1,581,408 | ) | (282,273 | ) | (35,550 | ) | ||||||||||
Financing activities | 3,334,051 | 1,376,767 | 1,524,260 | (150,968 | ) | (116,738 | ) | |||||||||||||
Balance sheet data: | ||||||||||||||||||||
Total assets | $ | 11,451,238 | $ | 7,928,854 | $ | 5,933,148 | $ | 4,340,256 | $ | 4,722,020 | ||||||||||
Long-term debt | 6,037,817 | 3,993,657 | 2,742,902 | 1,588,831 | 1,653,568 | |||||||||||||||
Unitholders’ capital | 4,427,180 | 3,428,910 | 2,788,216 | 2,452,004 | 2,760,686 | |||||||||||||||
(1) | Includes gains (losses) on sale of assets, net of taxes. |
36
Item 6. Selected Financial Data - Continued
(2) | Net of payments made for commodity derivative premiums of approximately $583 million, $134 million, $120 million, $94 million and $130 million for the years ended December 31, 2012, December 31, 2011, December 31, 2010, December 31, 2009, and December 31, 2008, respectively. |
At or for the Year Ended December 31, | |||||||||||||||
2012 | 2011 | 2010 | 2009 | 2008 | |||||||||||
Production data: | |||||||||||||||
Average daily production – continuing operations: | |||||||||||||||
Natural gas (MMcf/d) | 349 | 175 | 137 | 125 | 124 | ||||||||||
Oil (MBbls/d) | 29.2 | 21.5 | 13.1 | 9.0 | 8.6 | ||||||||||
NGL (MBbls/d) | 24.5 | 10.8 | 8.3 | 6.5 | 6.2 | ||||||||||
Total (MMcfe/d) | 671 | 369 | 265 | 218 | 212 | ||||||||||
Average daily production – discontinued operations: | |||||||||||||||
Total (MMcfe/d) | — | — | — | — | 12 | ||||||||||
Estimated proved reserves: (1) | |||||||||||||||
Natural gas (Bcf) | 2,571 | 1,675 | 1,233 | 774 | 851 | ||||||||||
Oil (MMBbls) | 191 | 189 | 156 | 102 | 84 | ||||||||||
NGL (MMBbls) | 179 | 94 | 71 | 54 | 51 | ||||||||||
Total (Bcfe) | 4,796 | 3,370 | 2,597 | 1,712 | 1,660 | ||||||||||
(1) | In accordance with Securities and Exchange Commission (“SEC”) regulations, reserves at December 31, 2012, December 31, 2011, December 31, 2010, and December 31, 2009, were estimated using the average price during the 12-month period, determined as an unweighted average of the first-day-of-the-month price for each month, excluding escalations based upon future conditions. In accordance with SEC regulations, reserves at December 31, 2008, were estimated using year-end prices. The price used to estimate reserves is held constant over the life of the reserves. |
37
Item 7. Management’s Discussion and Analysis of Financial Condition and Results of Operations
The following discussion and analysis should be read in conjunction with the “Consolidated Financial Statements” and “Notes to Consolidated Financial Statements,” which are included in this Annual Report on Form 10-K in Item 8. “Financial Statements and Supplementary Data.” The following discussion contains forward-looking statements that reflect the Company’s future plans, estimates, beliefs and expected performance. The forward-looking statements are dependent upon events, risks and uncertainties that may be outside the Company’s control. The Company’s actual results could differ materially from those discussed in these forward-looking statements. Factors that could cause or contribute to such differences include, but are not limited to, market prices for oil, natural gas and NGL, production volumes, estimates of proved reserves, capital expenditures, economic and competitive conditions, credit and capital market conditions, regulatory changes and other uncertainties, as well as those factors discussed below and elsewhere in this Annual Report on Form 10-K, particularly in Item 1A. “Risk Factors.” In light of these risks, uncertainties and assumptions, the forward-looking events discussed may not occur.
A reference to a “Note” herein refers to the accompanying Notes to Consolidated Financial Statements contained in Item 8. “Financial Statements and Supplementary Data.”
Executive Overview
LINN Energy’s mission is to acquire, develop and maximize cash flow from a growing portfolio of long-life oil and natural gas assets. LINN Energy is an independent oil and natural gas company that began operations in March 2003 and completed its initial public offering in January 2006. The Company’s properties are located in eight operating regions in the United States (“U.S.”):
• | Mid-Continent, which includes properties in Oklahoma, Louisiana and the eastern portion of the Texas Panhandle (including the Granite Wash and Cleveland horizontal plays); |
• | Hugoton Basin, which includes properties located primarily in Kansas and the Shallow Texas Panhandle; |
• | Green River Basin, which includes properties located in southwest Wyoming; |
• | Permian Basin, which includes areas in west Texas and southeast New Mexico; |
• | Michigan/Illinois, which includes the Antrim Shale formation in the northern part of Michigan and oil properties in southern Illinois; |
• | Williston/Powder River Basin, which includes the Bakken formation in North Dakota and the Powder River Basin in Wyoming; |
• | California, which includes the Brea Olinda Field of the Los Angeles Basin; and |
• | East Texas, which includes properties located in east Texas. |
Results for the year ended December 31, 2012, included the following:
• | oil, natural gas and NGL sales of approximately $1.6 billion compared to $1.2 billion in 2011; |
• | average daily production of 671 MMcfe/d compared to 369 MMcfe/d in 2011; |
• | net loss of approximately $387 million compared to net income of $438 million in 2011; |
• | net cash provided by operating activities of approximately $351 million compared to $519 million in 2011; |
• | capital expenditures, excluding acquisitions, of approximately $1.1 billion compared to $697 million in 2011; and |
• | 440 wells drilled (436 successful) compared to 294 wells drilled (292 successful) in 2011. |
Acquisitions
On July 31, 2012, the Company completed the acquisition of certain oil and natural gas properties in the Jonah Field located in the Green River Basin of southwest Wyoming from BP America Production Company (“BP”) for total consideration of approximately $990 million. The acquisition included approximately 806 Bcfe of proved reserves as of the acquisition date.
On May 1, 2012, the Company completed the acquisition of certain oil and natural gas properties located in east Texas for total consideration of approximately $168 million. The acquisition included approximately 110 Bcfe of proved reserves as of the acquisition date.
On April 3, 2012, the Company entered into a joint-venture agreement (“JV Agreement”) with an affiliate of Anadarko Petroleum Corporation (“Anadarko”) whereby the Company participates as a partner in the CO2 enhanced oil recovery development of the Salt Creek Field, located in the Powder River Basin of Wyoming. Anadarko assigned the Company 23%
38
Item 7. Management’s Discussion and Analysis of Financial Condition and Results of Operations - Continued
of its interest in the field in exchange for future funding of $400 million of Anadarko’s development costs. As of December 31, 2012, the Company has paid approximately $201 million towards the future funding commitment. The acquisition included approximately 16 MMBoe (96 Bcfe) of proved reserves as of the JV Agreement date.
On March 30, 2012, the Company completed the acquisition of certain oil and natural gas properties and the Jayhawk natural gas processing plant located in the Hugoton Basin in Kansas from BP for total consideration of approximately $1.16 billion. The acquisition included approximately 689 Bcfe of proved reserves as of the acquisition date.
During 2012, the Company completed other smaller acquisitions of oil and natural gas properties located in its various operating regions. The Company, in the aggregate, paid approximately $122 million in total consideration for these properties.
Proved reserves as of the acquisition date for all of the above referenced acquisitions were estimated using the average oil and natural gas prices during the preceding 12-month period, determined as an unweighted average of the first-day-of-the-month prices for each month. Estimates of proved reserves as of the acquisition date for all of the above referenced acquisitions as well as estimates of proved reserves at December 31, 2012, were prepared by the independent engineering firm, DeGolyer and MacNaughton.
Acquisition - Subsequent Event
On February 21, 2013, LinnCo, LLC (“LinnCo”), an affiliate of LINN Energy, and Berry Petroleum Company (“Berry”) announced they had signed a definitive merger agreement under which LinnCo would acquire all of the outstanding common shares of Berry. The transaction has a preliminary value of approximately $4.3 billion, including the assumption of debt, and is expected to close by June 30, 2013, subject to approvals by Berry and LinnCo shareholders, Linn Energy’s unitholders and regulatory agencies.
Under the terms of the agreement, Berry’s shareholders will receive 1.25 of LinnCo common shares for each Berry common share they own. This transaction, which is expected to be a tax-free exchange to Berry’s shareholders, represents value of $46.2375 per common share, based on the closing price of LinnCo common shares on February 20, 2013.
Financing and Liquidity
The Company’s Fifth Amended and Restated Credit Agreement (“Credit Facility”) provides for a revolving credit facility up to the lesser of: (i) the then-effective borrowing base and (ii) maximum commitment amount. The Credit Facility has a borrowing base of $4.5 billion with a maximum commitment amount of $3.0 billion. The maturity date is April 2017. At January 31, 2013, the borrowing capacity under the Credit Facility was approximately $1.8 billion, which includes a $5 million reduction in availability for outstanding letters of credit.
In January 2012, the Company, under its equity distribution agreement, issued and sold 1,539,651 units representing limited liability company interests at an average unit price of $38.02 for proceeds of approximately $57 million (net of approximately $2 million in commissions and professional services expenses). The Company used the net proceeds for general corporate purposes, including the repayment of a portion of the indebtedness outstanding under its Credit Facility. At December 31, 2012, units equaling approximately $411 million in aggregate offering price remained available to be issued and sold under the agreement.
In January 2012, the Company also completed a public offering of units for net proceeds of approximately $674 million. The Company used the net proceeds from the sale of these units to repay a portion of the outstanding indebtedness under its Credit Facility.
In March 2012, the Company issued $1.8 billion in aggregate principal amount of 6.25% senior notes due November 2019 (see Note 6) and used the net proceeds of approximately $1.77 billion to fund the Hugoton acquisition (see Note 2). The remaining proceeds were used to repay indebtedness under the Company’s Credit Facility and for general corporate purposes.
On May 8, 2012, the Company filed a registration statement on Form S-4 to register exchange notes that are identical in all material respects to those of the outstanding May 2019 Senior Notes, except that the transfer restrictions, registration rights and additional interest provisions relating to the outstanding notes do not apply to the exchange notes. On September 24, 2012, the registration statement was declared effective and the Company commenced an offer to exchange any and all of its
39
Item 7. Management’s Discussion and Analysis of Financial Condition and Results of Operations - Continued
$750 million outstanding principal amount of May 2019 Senior Notes for an equal amount of new May 2019 Senior Notes. The offer expired on October 23, 2012.
On October 17, 2012, LinnCo completed its initial public offering (the “LinnCo IPO”) of 34,787,500 common shares representing limited liability company interests for net proceeds of approximately $1.2 billion. The net proceeds LinnCo received from the offering were used to acquire 34,787,500 LINN Energy units which are equal to the number of LinnCo shares sold in the offering. The Company used the proceeds from the sale of the units to LinnCo to pay the expenses of the offering and repay a portion of the outstanding indebtedness under its Credit Facility.
Commodity Derivatives
During the year ended December 31, 2012, the Company entered into commodity derivative contracts consisting of oil swaps for 2012 through 2017, natural gas swaps for 2012 through 2018, and oil and natural gas puts for 2012 through 2017 and paid premiums for put options of approximately $583 million. The Company also entered into natural gas basis swaps for 2012 through 2016 and trade month roll swaps for 2012 through 2017. Currently, the Company has limited abilities to hedge its NGL production because there is no commercially viable market established for this purpose. Therefore, the Company does not directly hedge its NGL production.
Operating Regions
Following is a discussion of the Company’s eight operating regions.
Mid-Continent
The Mid-Continent region includes properties located in Oklahoma, Louisiana and the eastern portion of the Texas Panhandle (including the Granite Wash and Cleveland horizontal plays). Wells in this diverse region produce from both oil and natural gas reservoirs at depths ranging from 1,500 feet to over 18,000 feet. The Granite Wash formation and other shallower producing horizons are currently being developed using horizontal drilling and multi-stage stimulations. In the northern Texas Panhandle and extending into western Oklahoma, the Cleveland formation is being developed as a horizontal oil play. Elsewhere in Oklahoma, several producing formations are being targeted using similar horizontal drilling and completion technologies. The majority of wells in this region are mature, low-decline oil and natural gas wells.
Mid-Continent proved reserves represented approximately 34% of total proved reserves at December 31, 2012, of which 59% were classified as proved developed. This region produced 313 MMcfe/d or 48% of the Company’s 2012 average daily production. During 2012, the Company invested approximately $578 million to drill in this region. During 2013, the Company anticipates spending approximately 49% of its total oil and natural gas capital budget for development activities in the Mid-Continent region, primarily in the Granite Wash formation.
To more efficiently transport its natural gas in the Mid-Continent region to market, the Company owns and operates a network of natural gas gathering systems comprised of approximately 300 miles of pipeline and associated compression and metering facilities. In connection with the horizontal development activities in the Granite Wash formation, the Company continues to expand this gathering system which connects to numerous natural gas processing facilities in the region.
Hugoton Basin
The Hugoton Basin is a large oil and natural gas producing area located in the central portion of the Texas Panhandle extending into southwestern Kansas. The Company’s Texas properties in the basin primarily produce from the Brown Dolomite formation at depths of approximately 3,200 feet. The Company’s Kansas properties in the basin, acquired in March 2012, primarily produce from the Council Grove and Chase formations at depths ranging from 2,500 feet to 3,000 feet. Hugoton Basin proved reserves represented approximately 21% of total proved reserves at December 31, 2012, of which 85% were classified as proved developed. This region produced 120 MMcfe/d or 18% of the Company’s 2012 average daily production. During 2012, the Company invested approximately $11 million to drill in this region. During 2013, the Company anticipates spending approximately 3% of its total oil and natural gas capital budget for development activities in the Hugoton Basin region.
To more efficiently transport its natural gas in the Texas Panhandle to market, the Company owns and operates a network of natural gas gathering systems comprised of approximately 665 miles of pipeline and associated compression and metering facilities that connect to numerous sales outlets in the area. The Company also owns and operates the Jayhawk natural gas
40
Item 7. Management’s Discussion and Analysis of Financial Condition and Results of Operations - Continued
processing plant in southwestern Kansas with a capacity of approximately 450 MMcfe/d, allowing it to extract maximum value from the liquids-rich natural gas produced in the area. The Company’s production in the area is delivered to the plant via a system of approximately 2,100 miles of pipeline and related facilities operated by the Company, of which approximately 250 miles of pipeline are owned by the Company.
Green River Basin
The Green River Basin region consists of properties acquired in July 2012. These properties are located in southwest Wyoming and primarily produce natural gas at depths ranging from 8,000 feet to 12,000 feet. Green River Basin proved reserves represented approximately 21% of total proved reserves at December 31, 2012, of which 43% were classified as proved developed. This region produced 62 MMcfe/d or 9% of the Company’s 2012 average daily production. During 2012, the Company invested approximately $22 million to drill in this region. During 2013, the Company anticipates spending approximately 12% of its total oil and natural gas capital budget for development activities in the Green River Basin region.
Permian Basin
The Permian Basin is one of the largest and most prolific oil and natural gas basins in the U.S. The Company’s properties are located in west Texas and southeast New Mexico and produce at depths ranging from 2,000 feet to 12,000 feet. The Wolfberry trend is located in the north central portion of the basin where the Company has been actively drilling vertical oil wells since 2010. The Company also produces oil and natural gas from mature, low-decline wells including several waterflood properties located across the basin. Permian Basin proved reserves represented approximately 8% of total proved reserves at December 31, 2012, of which 56% were classified as proved developed. This region produced 83 MMcfe/d or 12% of the Company’s 2012 average daily production. During 2012, the Company invested approximately $240 million to drill in this region. During 2013, the Company anticipates spending approximately 20% of its total oil and natural gas capital budget for development activities in the Permian Basin region, primarily in the Wolfberry trend.
Michigan/Illinois
The Michigan/Illinois region includes properties producing from the Antrim Shale formation in the northern part of Michigan and oil properties in southern Illinois. These wells produce at depths ranging from 600 feet to 4,000 feet. Michigan/Illinois proved reserves represented approximately 6% of total proved reserves at December 31, 2012, of which 94% were classified as proved developed. This region produced 35 MMcfe/d or 5% of the Company’s 2012 average daily production. During 2013, the Company anticipates spending approximately 1% of its total oil and natural gas capital budget for development activities in the Michigan/Illinois region.
Williston/Powder River Basin
The Williston/Powder River Basin region includes the Bakken formation in North Dakota and the Powder River Basin in Wyoming. The Company’s nonoperated properties in the Williston Basin, one of the premier oil basins in the U.S., produce at depths ranging from 9,000 feet to 12,000 feet. The Company’s properties in the Powder River Basin, acquired in April 2012, consist of a CO2 flood operated by Anadarko in the Salt Creek Field. Williston/Powder River Basin proved reserves represented approximately 4% of total proved reserves at December 31, 2012, of which 66% were classified as proved developed. This region produced 29 MMcfe/d or 4% of the Company’s 2012 average daily production. During 2012, the Company invested approximately $124 million to drill in this region. During 2013, the Company anticipates spending approximately 12% of its total oil and natural gas capital budget for development activities in the Williston/Powder River Basin region.
California
The California region consists of the Brea Olinda Field of the Los Angeles Basin. The Brea Olinda Field was discovered in 1880 and produces from the shallow Pliocene formation to the deeper Miocene formation at depths ranging from 1,000 feet to 7,500 feet. California proved reserves represented approximately 4% of total proved reserves at December 31, 2012, of which 96% were classified as proved developed. This region produced 13 MMcfe/d or 2% of the Company’s 2012 average daily production. During 2012, the Company invested approximately $1 million to drill in this region. During 2013, the Company anticipates spending approximately 2% of its total oil and natural gas capital budget for development activities in the California region.
41
Item 7. Management’s Discussion and Analysis of Financial Condition and Results of Operations - Continued
East Texas
The East Texas region consists of properties acquired in May 2012. These properties are located in east Texas and primarily produce natural gas from the Cotton Valley formation at depths of approximately 11,000 feet. Proved reserves for these mature, low-decline producing properties, all of which are proved developed, represented approximately 2% of total proved reserves at December 31, 2012. This region produced 16 MMcfe/d or 2% of the Company’s 2012 average daily production. During 2013, the Company anticipates spending approximately 1% of its total oil and natural gas capital budget for development activities in the East Texas region.
42
Item 7. Management’s Discussion and Analysis of Financial Condition and Results of Operations - Continued
Results of Operations
Year Ended December 31, 2012, Compared to Year Ended December 31, 2011
Year Ended December 31, | ||||||||||||
2012 | 2011 | Variance | ||||||||||
(in thousands) | ||||||||||||
Revenues and other: | ||||||||||||
Natural gas sales | $ | 367,550 | $ | 278,714 | $ | 88,836 | ||||||
Oil sales | 946,304 | 714,385 | 231,919 | |||||||||
NGL sales | 287,326 | 168,938 | 118,388 | |||||||||
Total oil, natural gas and NGL sales | 1,601,180 | 1,162,037 | 439,143 | |||||||||
Gains on oil and natural gas derivatives (1) | 124,762 | 449,940 | (325,178 | ) | ||||||||
Marketing and other revenues | 48,298 | 10,477 | 37,821 | |||||||||
1,774,240 | 1,622,454 | 151,786 | ||||||||||
Expenses: | ||||||||||||
Lease operating expenses | 317,699 | 232,619 | 85,080 | |||||||||
Transportation expenses | 77,322 | 28,358 | 48,964 | |||||||||
Marketing expenses | 31,821 | 3,681 | 28,140 | |||||||||
General and administrative expenses (2) | 173,206 | 133,272 | 39,934 | |||||||||
Exploration costs | 1,915 | 2,390 | (475 | ) | ||||||||
Depreciation, depletion and amortization | 606,150 | 334,084 | 272,066 | |||||||||
Impairment of long-lived assets | 422,499 | — | 422,499 | |||||||||
Taxes, other than income taxes | 131,679 | 78,522 | 53,157 | |||||||||
Losses on sale of assets and other, net | 1,539 | 3,494 | (1,955 | ) | ||||||||
1,763,830 | 816,420 | 947,410 | ||||||||||
Other income and (expenses) | (394,236 | ) | (362,129 | ) | (32,107 | ) | ||||||
Income (loss) before income taxes | (383,826 | ) | 443,905 | (827,731 | ) | |||||||
Income tax expense | 2,790 | 5,466 | (2,676 | ) | ||||||||
Net income (loss) | $ | (386,616 | ) | $ | 438,439 | $ | (825,055 | ) | ||||
(1) | During the year ended December 31, 2011, the Company canceled (before the contract settlement date) derivative contracts on estimated future oil and natural gas production resulting in gains of approximately $27 million. The proceeds from the cancellation of the derivative contracts were reallocated within the Company’s derivatives portfolio. |
(2) | General and administrative expenses for the years ended December 31, 2012, and December 31, 2011, include approximately $28 million and $21 million, respectively, of noncash unit-based compensation expenses. |
43
Item 7. Management’s Discussion and Analysis of Financial Condition and Results of Operations - Continued
Year Ended December 31, | |||||||||||
2012 | 2011 | Variance | |||||||||
Average daily production: | |||||||||||
Natural gas (MMcf/d) | 349 | 175 | 99 | % | |||||||
Oil (MBbls/d) | 29.2 | 21.5 | 36 | % | |||||||
NGL (MBbls/d) | 24.5 | 10.8 | 127 | % | |||||||
Total (MMcfe/d) | 671 | 369 | 82 | % | |||||||
Weighted average prices (unhedged): (1) | |||||||||||
Natural gas (Mcf) | $ | 2.87 | $ | 4.35 | (34 | )% | |||||
Oil (Bbl) | $ | 88.59 | $ | 91.24 | (3 | )% | |||||
NGL (Bbl) | $ | 32.10 | $ | 42.88 | (25 | )% | |||||
Average NYMEX prices: | |||||||||||
Natural gas (MMBtu) | $ | 2.79 | $ | 4.05 | (31 | )% | |||||
Oil (Bbl) | $ | 94.20 | $ | 95.12 | (1 | )% | |||||
Costs per Mcfe of production: | |||||||||||
Lease operating expenses | $ | 1.29 | $ | 1.73 | (25 | )% | |||||
Transportation expenses | $ | 0.31 | $ | 0.21 | 48 | % | |||||
General and administrative expenses (2) | $ | 0.71 | $ | 0.99 | (28 | )% | |||||
Depreciation, depletion and amortization | $ | 2.47 | $ | 2.48 | — | ||||||
Taxes, other than income taxes | $ | 0.54 | $ | 0.58 | (7 | )% | |||||
(1) | Does not include the effect of gains (losses) on derivatives. |
(2) | General and administrative expenses for the years ended December 31, 2012, and December 31, 2011, include approximately $28 million and $21 million, respectively, of noncash unit-based compensation expenses. |
44
Item 7. Management’s Discussion and Analysis of Financial Condition and Results of Operations - Continued
Revenues and Other
Oil, Natural Gas and NGL Sales
Oil, natural gas and NGL sales increased by approximately $439 million or 38% to approximately $1.6 billion for the year ended December 31, 2012, from approximately $1.2 billion for the year ended December 31, 2011, due to higher production volumes partially offset by lower commodity prices. Lower natural gas, NGL and oil prices resulted in a decrease in revenues of approximately $189 million, $96 million and $28 million, respectively.
Average daily production volumes increased to 671 MMcfe/d during the year ended December 31, 2012, from 369 MMcfe/d during the year ended December 31, 2011. Higher natural gas, oil and NGL production volumes resulted in an increase in revenues of approximately $277 million, $260 million and $215 million, respectively.
The following sets forth average daily production by region:
Year Ended December 31, | ||||||||||||
2012 | 2011 | Variance | ||||||||||
Average daily production (MMcfe/d): | ||||||||||||
Mid-Continent | 313 | 195 | 118 | 61 | % | |||||||
Hugoton Basin | 120 | 39 | 81 | 208 | % | |||||||
Permian Basin | 83 | 73 | 10 | 14 | % | |||||||
Green River Basin | 62 | — | 62 | — | ||||||||
Michigan/Illinois | 35 | 36 | (1 | ) | (2 | )% | ||||||
Williston/Powder River Basin | 29 | 12 | 17 | 129 | % | |||||||
East Texas | 16 | — | 16 | — | ||||||||
California | 13 | 14 | (1 | ) | (6 | )% | ||||||
671 | 369 | 302 | 82 | % | ||||||||
The increase in average daily production volumes in the Mid-Continent region primarily reflects the Company’s 2011 and 2012 capital drilling programs in the Granite Wash formation, as well as the impact of the acquisition in the Cleveland horizontal play in June 2011 and the acquisition from Plains in December 2011. The increase in average daily production volumes in the Hugoton Basin region primarily reflects the impact of the acquisition from BP in March 2012. The increase in average daily production volumes in the Permian Basin region reflects the impact of acquisitions in 2011 and subsequent development capital spending. Average daily production volumes in the Green River Basin region reflect the impact of the acquisitions in 2012. The Michigan/Illinois and California regions consist of low-decline asset bases and continue to produce at consistent levels. The increase in average daily production volumes in the Williston/Powder River Basin region reflects the impact of acquisitions in 2011 and the joint-venture agreement entered into with Anadarko in April 2012. Average daily production volumes in the East Texas region reflect the impact of the acquisition in May 2012 (see Note 2).
Gains on Oil and Natural Gas Derivatives
Gains on oil and natural gas derivatives decreased by approximately $325 million to gains of approximately $125 million for the year ended December 31, 2012, from gains of approximately $450 million for the year ended December 31, 2011. Gains on oil and natural gas derivatives decreased primarily due to the changes in fair value of the derivative contracts, partially offset by increased cash settlements during the year. The results for 2012 also include gains of approximately $22 million related to the recovery of a bankruptcy claim (see Note 11). The results for 2011 also include gains of approximately $27 million related to canceled contracts of which the proceeds were reallocated within the Company’s derivatives portfolio. The fair value on unsettled derivatives contracts changes as future commodity price expectations change compared to the contract prices on the derivatives. If the expected future commodity prices increase compared to the contract prices on the derivatives, losses are recognized; and if the expected future commodity prices decrease compared to the contract prices on the derivatives, gains are recognized.
During the year ended December 31, 2012, the Company had commodity derivative contracts for approximately 110% of its natural gas production, including natural gas put options used to indirectly hedge NGL revenues, and 106% of its oil production. During the year ended December 31, 2011, the Company had commodity derivative contracts for approximately
45
Item 7. Management’s Discussion and Analysis of Financial Condition and Results of Operations - Continued
101% of its natural gas production, including natural gas put options used to indirectly hedge NGL revenues, and 101% of its oil production.
The Company determines the fair value of its oil and natural gas derivatives utilizing pricing models that use a variety of techniques, including market quotes and pricing analysis. See Item 7A. “Quantitative and Qualitative Disclosures About Market Risk” and Note 7 and Note 8 for additional information about the Company’s commodity derivatives. For information about the Company’s credit risk related to derivative contracts, see “Counterparty Credit Risk” in “Liquidity and Capital Resources” below.
Marketing and Other Revenues
Marketing revenues represent third-party activities associated with company-owned gathering systems and plants. Marketing and other revenues increased by approximately $38 million or 361% to approximately $48 million for the year ended December 31, 2012, from approximately $10 million for the year ended December 31, 2011, primarily due to revenues generated from the Jayhawk natural gas processing plant acquired from BP in March 2012.
Expenses
Lease Operating Expenses
Lease operating expenses include expenses such as labor, field office, vehicle, supervision, maintenance, tools and supplies and workover expenses. Lease operating expenses increased by approximately $85 million or 37% to approximately $318 million for the year ended December 31, 2012, from approximately $233 million for the year ended December 31, 2011. Lease operating expenses increased primarily due to costs associated with properties acquired during 2011 and 2012 (see Note 2). Lease operating expenses per Mcfe decreased to $1.29 per Mcfe for the year ended December 31, 2012, from $1.73 per Mcfe for the year ended December 31, 2011, primarily due to lower rates on newly acquired properties and cost saving initiatives.
Transportation Expenses
Transportation expenses increased by approximately $49 million or 173% to approximately $77 million for the year ended December 31, 2012, from approximately $28 million for the year ended December 31, 2011, primarily due to acquisitions in late 2011 and early 2012.
Marketing Expenses
Marketing expenses represent third-party activities associated with company-owned gathering systems and plants. Marketing expenses increased by approximately $28 million or 765% to approximately $32 million for the year ended December 31, 2012, from approximately $4 million for the year ended December 31, 2011, primarily due to expenses associated with the Jayhawk natural gas processing plant acquired from BP in March 2012.
General and Administrative Expenses
General and administrative expenses are costs not directly associated with field operations and reflect the costs of employees including executive officers, related benefits, office leases and professional fees. General and administrative expenses increased by approximately $40 million or 30% to approximately $173 million for the year ended December 31, 2012, from approximately $133 million for the year ended December 31, 2011. The increase was primarily due to an increase in salaries and benefits related expenses of approximately $20 million, driven primarily by increased employee headcount, and an increase in acquisition related expenses of approximately $16 million. Although general and administrative expenses increased, the unit rate decreased to $0.71 per Mcfe for the year ended December 31, 2012, from $0.99 per Mcfe for the year ended December 31, 2011, as a result of efficiencies gained from being a larger, more scalable organization.
Depreciation, Depletion and Amortization
Depreciation, depletion and amortization increased by approximately $272 million or 81% to approximately $606 million for the year ended December 31, 2012, from approximately $334 million for the year ended December 31, 2011. Higher total production volumes were the primary reason for the increased expense. Depreciation, depletion and amortization per Mcfe decreased to $2.47 per Mcfe for the year ended December 31, 2012, from $2.48 per Mcfe for the year ended December 31, 2011.
46
Item 7. Management’s Discussion and Analysis of Financial Condition and Results of Operations - Continued
Impairment of Long-Lived Assets
During the year ended December 31, 2012, the Company recorded noncash impairment charges, before and after tax, of approximately $422 million associated with proved oil and natural gas properties related to a decline in commodity prices. The Company recorded no impairment charge for the year ended December 31, 2011. See Note 1 and “Critical Accounting Policies and Estimates” below for additional information.
Taxes, Other Than Income Taxes
Taxes, other than income taxes, which consist primarily of severance and ad valorem taxes, increased by approximately $53 million or 68% to approximately $132 million for the year ended December 31, 2012, from approximately $79 million for the year ended December 31, 2011. Severance taxes, which are a function of revenues generated from production, increased by approximately $21 million compared to the year ended December 31, 2011, primarily due to higher production volumes partially offset by lower commodity prices. Ad valorem taxes, which are based on the value of reserves and production equipment and vary by location, increased by approximately $32 million compared to the year ended December 31, 2011, primarily due to property acquisitions in 2011 and 2012 and higher rates on the Company’s base properties.
Other Income and (Expenses)
Year Ended December 31, | ||||||||||||
2012 | 2011 | Variance | ||||||||||
(in thousands) | ||||||||||||
Loss on extinguishment of debt | $ | — | $ | (94,612 | ) | $ | 94,612 | |||||
Interest expense, net of amounts capitalized | (379,937 | ) | (259,725 | ) | (120,212 | ) | ||||||
Other, net | (14,299 | ) | (7,792 | ) | (6,507 | ) | ||||||
$ | (394,236 | ) | $ | (362,129 | ) | $ | (32,107 | ) | ||||
Other income and (expenses) increased by approximately $32 million during the year ended December 31, 2012, compared to the year ended December 31, 2011. Interest expense increased primarily due to higher outstanding debt during the period and higher amortization of financing fees associated with the May 2019 Senior Notes and the November 2019 Senior Notes, as defined in Note 6, and amendments made to the Company’s Credit Facility during 2012. For the year ended December 31, 2011, the Company also recorded a loss on extinguishment of debt of approximately $95 million as a result of the redemptions of and cash tender offers for a portion of the Original Senior Notes, as defined in Note 6. See “Debt” in “Liquidity and Capital Resources” below for additional details.
Income Tax Expense
The Company is a limited liability company treated as a partnership for federal and state income tax purposes, with the exception of the state of Texas, in which income tax liabilities and/or benefits of the Company are passed through to unitholders. Limited liability companies are subject to Texas margin tax. Limited liability companies were also subject to state income taxes in the state of Michigan during 2011. In addition, certain of the Company’s subsidiaries are Subchapter C-corporations subject to federal and state income taxes. The Company recognized income tax expense of approximately $3 million for the year ended December 31, 2012, compared to approximately $5 million for the same period in 2011. Income tax expense decreased primarily due to lower income in 2012 from the Company’s taxable subsidiaries.
Net Income (Loss)
Net income decreased by approximately $825 million or 188% to a net loss of approximately $387 million for the year ended December 31, 2012, from net income of approximately $438 million for the year ended December 31, 2011. The decrease was primarily due to lower gains on oil and natural gas derivatives and higher impairment charges and other expenses, including interest, partially offset by higher production revenues. See discussions above for explanations of variances.
47
Item 7. Management’s Discussion and Analysis of Financial Condition and Results of Operations - Continued
Results of Operations
Year Ended December 31, 2011, Compared to Year Ended December 31, 2010
Year Ended December 31, | ||||||||||||
2011 | 2010 | Variance | ||||||||||
(in thousands) | ||||||||||||
Revenues and other: | ||||||||||||
Natural gas sales | $ | 278,714 | $ | 211,596 | $ | 67,118 | ||||||
Oil sales | 714,385 | 359,996 | 354,389 | |||||||||
NGL sales | 168,938 | 118,462 | 50,476 | |||||||||
Total oil, natural gas and NGL sales | 1,162,037 | 690,054 | 471,983 | |||||||||
Gains on oil and natural gas derivatives (1) | 449,940 | 75,211 | 374,729 | |||||||||
Marketing and other revenues | 10,477 | 7,015 | 3,462 | |||||||||
1,622,454 | 772,280 | 850,174 | ||||||||||
Expenses: | ||||||||||||
Lease operating expenses | 232,619 | 158,382 | 74,237 | |||||||||
Transportation expenses | 28,358 | 19,594 | 8,764 | |||||||||
Marketing expenses | 3,681 | 2,716 | 965 | |||||||||
General and administrative expenses (2) | 133,272 | 99,078 | 34,194 | |||||||||
Exploration costs | 2,390 | 5,168 | (2,778 | ) | ||||||||
Depreciation, depletion and amortization | 334,084 | 238,532 | 95,552 | |||||||||
Impairment of long-lived assets | — | 38,600 | (38,600 | ) | ||||||||
Taxes, other than income taxes | 78,522 | 45,182 | 33,340 | |||||||||
Losses on sale of assets and other, net | 3,494 | 6,490 | (2,996 | ) | ||||||||
816,420 | 613,742 | 202,678 | ||||||||||
Other income and (expenses) | (362,129 | ) | (268,585 | ) | (93,544 | ) | ||||||
Income (loss) before income taxes | 443,905 | (110,047 | ) | 553,952 | ||||||||
Income tax expense | 5,466 | 4,241 | 1,225 | |||||||||
Net income (loss) | $ | 438,439 | $ | (114,288 | ) | $ | 552,727 | |||||
(1) | During the year ended December 31, 2011, the Company canceled (before the contract settlement date) derivative contracts on estimated future oil and natural gas production resulting in gains of approximately $27 million. The proceeds from the cancellation of the derivative contracts were reallocated within the Company’s derivatives portfolio. |
(2) | General and administrative expenses for the years ended December 31, 2011, and December 31, 2010, include approximately $21 million and $13 million, respectively, of noncash unit-based compensation expenses. |
48
Item 7. Management’s Discussion and Analysis of Financial Condition and Results of Operations - Continued
Year Ended December 31, | |||||||||||
2011 | 2010 | Variance | |||||||||
Average daily production: | |||||||||||
Natural gas (MMcf/d) | 175 | 137 | 28 | % | |||||||
Oil (MBbls/d) | 21.5 | 13.1 | 64 | % | |||||||
NGL (MBbls/d) | 10.8 | 8.3 | 30 | % | |||||||
Total (MMcfe/d) | 369 | 265 | 39 | % | |||||||
Weighted average prices (unhedged): (1) | |||||||||||
Natural gas (Mcf) | $ | 4.35 | $ | 4.24 | 3 | % | |||||
Oil (Bbl) | $ | 91.24 | $ | 75.16 | 21 | % | |||||
NGL (Bbl) | $ | 42.88 | $ | 39.14 | 10 | % | |||||
Average NYMEX prices: | |||||||||||
Natural gas (MMBtu) | $ | 4.05 | $ | 4.40 | (8 | )% | |||||
Oil (Bbl) | $ | 95.12 | $ | 79.53 | 20 | % | |||||
Costs per Mcfe of production: | |||||||||||
Lease operating expenses | $ | 1.73 | $ | 1.64 | 5 | % | |||||
Transportation expenses | $ | 0.21 | $ | 0.20 | 5 | % | |||||
General and administrative expenses (2) | $ | 0.99 | $ | 1.02 | (3 | )% | |||||
Depreciation, depletion and amortization | $ | 2.48 | $ | 2.46 | 1 | % | |||||
Taxes, other than income taxes | $ | 0.58 | $ | 0.47 | 23 | % | |||||
(1) | Does not include the effect of gains (losses) on derivatives. |
(2) | General and administrative expenses for the years ended December 31, 2011, and December 31, 2010, include approximately $21 million and $13 million, respectively, of noncash unit-based compensation expenses. |
49
Item 7. Management’s Discussion and Analysis of Financial Condition and Results of Operations - Continued
Revenues and Other
Oil, Natural Gas and NGL Sales
Oil, natural gas and NGL sales increased by approximately $472 million or 68% to approximately $1.2 billion for the year ended December 31, 2011, from approximately $690 million for the year ended December 31, 2010, due to higher commodity prices and higher production volumes. Higher oil, NGL and natural gas prices resulted in an increase in revenues of approximately $126 million, $15 million and $7 million, respectively.
Average daily production volumes increased to 369 MMcfe/d during the year ended December 31, 2011, from 265 MMcfe/d during the year ended December 31, 2010. Higher oil, natural gas and NGL production volumes resulted in an increase in revenues of approximately $228 million, $60 million and $36 million, respectively.
The following sets forth average daily production by region:
Year Ended December 31, | ||||||||||||
2011 | 2010 | Variance | ||||||||||
Average daily production (MMcfe/d): | ||||||||||||
Mid-Continent | 195 | 157 | 38 | 24 | % | |||||||
Hugoton Basin | 39 | 41 | (2 | ) | (6 | )% | ||||||
Permian Basin | 73 | 31 | 42 | 134 | % | |||||||
Michigan/Illinois | 36 | 22 | 14 | 61 | % | |||||||
Williston/Powder River Basin | 12 | — | 12 | — | ||||||||
California | 14 | 14 | — | — | ||||||||
369 | 265 | 104 | 39 | % | ||||||||
The increase in average daily production volumes in the Mid-Continent region primarily reflects the Company’s 2010 and 2011 capital drilling programs in the Granite Wash formation, as well as the impact of the acquisition in the Cleveland horizontal play in June 2011. The decrease in average daily production volumes in the Hugoton Basin region reflects downtime related to weather and third-party plant maintenance, and the effects of natural declines, partially offset by the results of the Company’s drilling and optimization programs. The increase in average daily production volumes in the Permian Basin region reflects the impact of acquisitions in 2010 and 2011 and subsequent development capital spending. The increase in average daily production volumes in the Michigan/Illinois region reflects the full year impact of acquisitions in the second and fourth quarters of 2010. Average daily production volumes in the Williston/Powder River Basin region reflect the impact of the Company’s acquisitions in this region in 2011. The California region consists of a low-decline asset base and continues to produce at a consistent level.
Gains on Oil and Natural Gas Derivatives
Gains on oil and natural gas derivatives increased by approximately $375 million to gains of approximately $450 million for the year ended December 31, 2011, from gains of approximately $75 million for the year ended December 31, 2010. Gains on oil and natural gas derivatives increased primarily due to the changes in fair value of the derivative contracts, partially offset by decreased cash settlements during the year. The results for 2011 also include gains of approximately $27 million related to canceled contracts of which the proceeds were reallocated within the Company’s derivatives portfolio. The fair value on unsettled derivatives contracts changes as future commodity price expectations change compared to the contract prices on the derivatives. If the expected future commodity prices increase compared to the contract prices on the derivatives, losses are recognized; and if the expected future commodity prices decrease compared to the contract prices on the derivatives, gains are recognized.
During the year ended December 31, 2011, the Company had commodity derivative contracts for approximately 101% of its natural gas production, including natural gas put options used to indirectly hedge NGL revenues, and 101% of its oil production. During the year ended December 31, 2010, the Company had commodity derivative contracts for approximately 114% of its natural gas production, including natural gas put options used to indirectly hedge NGL revenues, and 97% of its oil production.
The Company determines the fair value of its oil and natural gas derivatives utilizing pricing models that use a variety of techniques, including market quotes and pricing analysis. See Item 7A. “Quantitative and Qualitative Disclosures About
50
Item 7. Management’s Discussion and Analysis of Financial Condition and Results of Operations - Continued
Market Risk” and Note 7 and Note 8 for additional information about the Company’s commodity derivatives. For information about the Company’s credit risk related to derivative contracts, see “Counterparty Credit Risk” in “Liquidity and Capital Resources” below.
Expenses
Lease Operating Expenses
Lease operating expenses include expenses such as labor, field office, vehicle, supervision, maintenance, tools and supplies and workover expenses. Lease operating expenses increased by approximately $75 million or 47% to approximately $233 million for the year ended December 31, 2011, from approximately $158 million for the year ended December 31, 2010. Lease operating expenses per Mcfe also increased to $1.73 per Mcfe for the year ended December 31, 2011, from $1.64 per Mcfe for the year ended December 31, 2010. Lease operating expenses increased primarily due to costs associated with properties acquired during 2010 and 2011 (see Note 2). Temporary oil handling costs in the Granite Wash formation and higher post-acquisition maintenance costs in the Permian Basin also contributed to the increase.
Transportation Expenses
Transportation expenses increased by approximately $9 million or 45% to approximately $28 million for the year ended December 31, 2011, from approximately $19 million for the year ended December 31, 2010, primarily due to higher production volumes.
General and Administrative Expenses
General and administrative expenses are costs not directly associated with field operations and reflect the costs of employees including executive officers, related benefits, office leases and professional fees. General and administrative expenses increased by approximately $34 million or 35% to approximately $133 million for the year ended December 31, 2011, from approximately $99 million for the year ended December 31, 2010. The increase was primarily due to an increase in salaries and benefits related expenses of approximately $26 million, driven primarily by increased employee headcount, an increase in professional services expense of approximately $3 million and an increase in acquisition integration expenses of approximately $3 million. General and administrative expenses per Mcfe decreased to $0.99 per Mcfe for the year ended December 31, 2011, from $1.02 per Mcfe for the year ended December 31, 2010, due to higher production volumes.
Exploration Costs
Exploration costs decreased by approximately $3 million or 54% to approximately $2 million for the year ended December 31, 2011, from approximately $5 million for the year ended December 31, 2010. The decrease was primarily due to lower leasehold impairment expenses on unproved properties.
Depreciation, Depletion and Amortization
Depreciation, depletion and amortization increased by approximately $95 million or 40% to approximately $334 million for the year ended December 31, 2011, from approximately $239 million for the year ended December 31, 2010. Higher total production volumes were the primary reason for the increased expense. Depreciation, depletion and amortization per Mcfe also increased to $2.48 per Mcfe for the year ended December 31, 2011, from $2.46 per Mcfe for the year ended December 31, 2010.
Impairment of Long-Lived Assets
The Company recorded no impairment charge for the year ended December 31, 2011. During the year ended December 31, 2010, the Company recorded a noncash impairment charge of approximately $39 million primarily associated with the impairment of proved oil and natural gas properties related to an unfavorable marketing contract. See Note 1 and “Critical Accounting Policies and Estimates” below for additional information.
Taxes, Other Than Income Taxes
Taxes, other than income taxes, which consist primarily of severance and ad valorem taxes, increased by approximately $34 million or 74% to approximately $79 million for the year ended December 31, 2011, from approximately $45 million for the year ended December 31, 2010. Severance taxes, which are a function of revenues generated from production, increased by approximately $31 million compared to the year ended December 31, 2010, primarily due to higher commodity prices and higher production volumes. Ad valorem taxes, which are based on the value of reserves and production equipment and vary by location, increased by approximately $3 million compared to the year ended December 31, 2010, primarily due to property acquisitions in 2011.
51
Item 7. Management’s Discussion and Analysis of Financial Condition and Results of Operations - Continued
Other Income and (Expenses)
Year Ended December 31, | ||||||||||||
2011 | 2010 | Variance | ||||||||||
(in thousands) | ||||||||||||
Loss on extinguishment of debt | $ | (94,612 | ) | $ | — | $ | (94,612 | ) | ||||
Interest expense, net of amounts capitalized | (259,725 | ) | (193,510 | ) | (66,215 | ) | ||||||
Settlements on interest rate derivatives | — | (8,021 | ) | 8,021 | ||||||||
Cash settlements on canceled interest rate derivatives | — | (123,865 | ) | 123,865 | ||||||||
Changes in fair value on unsettled interest rate derivatives | — | 63,978 | (63,978 | ) | ||||||||
Other, net | (7,792 | ) | (7,167 | ) | (625 | ) | ||||||
$ | (362,129 | ) | $ | (268,585 | ) | $ | (93,544 | ) | ||||
Other income and (expenses) increased by approximately $94 million during the year ended December 31, 2011, compared to the year ended December 31, 2010. Interest expense increased primarily due to higher outstanding debt during the period and higher amortization of financing fees associated with the 2019 Senior Notes and the 2010 Issued Senior Notes, as defined in Note 6. In addition, in May 2011, the Company entered into a Fifth Amended and Restated Credit Facility, which also resulted in higher amortization of financing fees. For the year ended December 31, 2011, the Company also recorded a loss on extinguishment of debt of approximately $95 million as a result of the redemptions of and cash tender offers for a portion of the Original Senior Notes, as defined in Note 6. See “Debt” in “Liquidity and Capital Resources” below for additional details. The year ended December 31, 2010, included approximately $68 million of losses on interest rate derivatives.
Income Tax Expense
The Company is a limited liability company treated as a partnership for federal and state income tax purposes, with the exception of the state of Texas, in which income tax liabilities and/or benefits of the Company are passed through to unitholders. Limited liability companies are subject to Texas margin tax. Limited liability companies were also subject to state income taxes in the state of Michigan during 2011 and 2010. In addition, certain of the Company’s subsidiaries are Subchapter C-corporations subject to federal and state income taxes. The Company recognized income tax expense of approximately $5 million for the year ended December 31, 2011, compared to approximately $4 million for the same period in 2010. Income tax expense increased primarily due to higher income in 2011 from the Company’s taxable subsidiaries.
Net Income (Loss)
Net income increased by approximately $552 million or 484% to approximately $438 million for the year ended December 31, 2011, from a net loss of approximately $114 million for the year ended December 31, 2010. The increase was primarily due higher revenues, partially offset by higher expenses, including interest. See discussions above for explanations of variances.
52
Item 7. Management’s Discussion and Analysis of Financial Condition and Results of Operations - Continued
Reserve Replacement Metrics
The Company calculates two primary reserve metrics: (i) reserve replacement cost and (ii) reserve replacement ratio, to measure its ability to establish a long-term trend of adding reserves at a reasonable cost. The reserve replacement cost calculation provides an assessment of the cost of adding reserves that is ultimately included in depreciation, depletion and amortization expense. The reserve replacement ratio is an indicator of the Company’s ability to replenish annual production volumes and grow reserves. The metrics are calculated as follow:
Reserve replacement cost per Mcfe | = | Oil and natural gas capital costs expended (1) |
Sum of reserve additions (2) | ||
Reserve replacement ratio | = | Sum of reserve additions (2) |
Annual production | ||
(1) | Oil and natural gas capital costs expended include the costs of property acquisition, exploration and development activities conducted to add reserves and exclude asset retirement costs. The Company expects to incur development costs in the future for proved undeveloped reserves; such future costs are excluded from costs expended and are not considered in the reserve replacement metrics presented herein. |
(2) | Reserve additions include proved reserves (developed and undeveloped) and reflect reserve revisions for prices and performance, extensions, discoveries and other additions and acquisitions, and do not include unproved reserve quantities. |
The reserve replacement metrics are presented separately, both: (i) including and excluding the impact of price revisions on reserves, to demonstrate the effectiveness of the Company’s drilling program exclusive of economic factors (such as price) outside of its control and (ii) including and excluding acquisitions, to demonstrate the Company’s ability to add reserves through its drilling program and through acquisitions. Reserve replacement cost and reserve replacement ratio are non-GAAP financial measures. The methods used by the Company to calculate these measures may differ from methods used by other companies to compute similar measures. As a result, the Company’s measures may not be comparable to similar measures provided by other companies. The Company believes that providing such measures is useful in evaluating the cost to add proved reserves; however, these measures should not be considered in isolation or as a substitute for GAAP measures. The reserve replacement cost per Mcfe and reserve replacement ratio are statistical indicators that have limitations, including their predictive and comparative value. The reserve replacement ratio is limited because it may vary widely based on the extent and timing of new discoveries, project sanctioning and property acquisitions. In addition, since the reserve replacement ratio does not consider the development cost or timing of future production of new reserves, it should not be used as a measure of value creation.
The following presents reserve replacement cost and reserve replacement ratio including and excluding the effect of price revisions on reserves:
Including Price Revisions | Excluding Price Revisions | |||||||||||||||||||||||
Year Ended December 31, | Year Ended December 31, | |||||||||||||||||||||||
2012 | 2011 | 2010 | 2012 | 2011 | 2010 | |||||||||||||||||||
Costs per Mcfe: | ||||||||||||||||||||||||
Reserve replacement cost, including acquisitions | $ | 2.26 | $ | 2.37 | $ | 1.63 | $ | 1.97 | $ | 2.46 | $ | 1.94 | ||||||||||||
Reserve replacement cost, excluding acquisitions (finding and development cost) | NM (1) | $ | 1.94 | $ | 0.79 | $ | 6.92 | $ | 2.15 | $ | 1.57 | |||||||||||||
Percentage of production: | ||||||||||||||||||||||||
Reserve replacement ratio, including acquisitions | 680 | % | 674 | % | 1,014 | % | 781 | % | 651 | % | 854 | % | ||||||||||||
Reserve replacement ratio, excluding acquisitions | NM (1) | 244 | % | 321 | % | 63 | % | 221 | % | 161 | % | |||||||||||||
(1) | Not meaningful due to the impact of a significant decrease in year-end natural gas prices at December 31, 2012, compared to December 31, 2011. |
53
Item 7. Management’s Discussion and Analysis of Financial Condition and Results of Operations - Continued
The Company considers the cost of premiums paid for put options as an investment related to its underlying oil and natural gas properties and includes the cost of acquisition-related derivatives in the transaction economics. For the years ended December 31, 2012, December 31, 2011, and December 31, 2010, the Company paid premiums of approximately $583 million, $134 million and $120 million, respectively, for derivatives designed to reduce its exposure to fluctuations in commodity prices. The amounts paid were for derivative instruments that hedged production for multiple years. Of these amounts, approximately $320 million, $52 million and $21 million was paid for derivatives specifically related to the acquisitions consummated by the Company during the respective years.
If the premiums paid for derivatives were included in the reserve replacement cost calculations for the year ended December 31, 2012, the reserve replacement cost per Mcfe including price revisions and acquisitions would have been approximately $2.61. The reserve replacement cost including price revisions and excluding acquisitions is not meaningful for the year ended December 31, 2012, due to the impact of a significant decrease in year-end natural gas prices at December 31, 2012, compared to December 31, 2011. For the year ended December 31, 2012, the reserve replacement cost per Mcfe excluding price revisions and including acquisitions would have been approximately $2.27 and approximately $8.63 excluding price revisions and acquisitions. If the premiums paid for derivatives were included in the reserve replacement cost calculations for the years ended December 31, 2011, and December 31, 2010, the reserve replacement cost per Mcfe including price revisions and acquisitions would have been approximately $2.52 and $1.75, respectively, and approximately $2.19 and $1.11, respectively, including price revisions and excluding acquisitions. For the same periods, the reserve replacement cost per Mcfe excluding price revisions and including acquisitions would have been approximately $2.62 and $2.08, respectively, and approximately $2.43 and $2.21, respectively, excluding price revisions and acquisitions.
Amounts used for the calculations in the tables above are derived directly from the data presented in “Supplemental Oil and Natural Gas Data (Unaudited)” in Item 8. “Financial Statements and Supplementary Data.” The following provides a reconciliation of oil and natural gas capital costs used in these calculations to its most directly comparable financial measure calculated and presented in accordance with GAAP:
Year Ended December 31, | ||||||||||||
2012 | 2011 | 2010 | ||||||||||
(in thousands) | ||||||||||||
Costs incurred in oil and natural gas property acquisition, exploration and development | $ | 3,779,713 | $ | 2,158,639 | $ | 1,602,086 | ||||||
Less: | ||||||||||||
Asset retirement costs | (4,675 | ) | (2,427 | ) | (748 | ) | ||||||
Property acquisition costs | (2,712,543 | ) | (1,516,737 | ) | (1,356,430 | ) | ||||||
Oil and natural gas capital costs expended, excluding acquisitions | $ | 1,062,495 | $ | 639,475 | $ | 244,908 | ||||||
Liquidity and Capital Resources
The Company utilizes funds from debt and equity offerings, borrowings under its Credit Facility and net cash provided by operating activities for capital resources and liquidity. To date, the primary use of capital has been for acquisitions and the development of oil and natural gas properties. For the year ended December 31, 2012, the Company’s total capital expenditures, excluding acquisitions, were approximately $1.1 billion. For 2013, the Company estimates its total capital expenditures, excluding acquisitions, will be approximately $1.2 billion, including $1.1 billion related to its oil and natural gas capital program and approximately $67 million related to its plant and pipeline capital. This estimate reflects amounts for the development of properties associated with acquisitions (see Note 2), is under continuous review and subject to ongoing adjustments. The Company expects to fund these capital expenditures primarily with net cash provided by operating activities and borrowings under its Credit Facility.
As the Company pursues growth, it continually monitors the capital resources available to meet future financial obligations and planned capital expenditures. The Company’s future success in growing reserves and production volumes will be highly dependent on the capital resources available and its success in drilling for or acquiring additional reserves. The Company actively reviews acquisition opportunities on an ongoing basis. If the Company were to make significant additional acquisitions for cash, it would need to borrow additional amounts under its Credit Facility, if available, or obtain additional debt or equity financing. The Company’s Credit Facility and indentures governing its November 2019 Senior Notes, May
54
Item 7. Management’s Discussion and Analysis of Financial Condition and Results of Operations - Continued
2019 Senior Notes, 2010 Issued Senior Notes, and Original Senior Notes impose certain restrictions on the Company’s ability to obtain additional debt financing. Based upon current expectations, the Company believes liquidity and capital resources will be sufficient to conduct its business and operations. For additional information about the risk that the Company may not have sufficient net cash provided by operating activities to maintain its distribution and other risk factors that could affect the Company, see Item 1A. “Risk Factors.”
Statements of Cash Flows
The following is a comparative cash flow summary:
Year Ended December 31, | ||||||||||||
2012 | 2011 | 2010 | ||||||||||
(in thousands) | ||||||||||||
Net cash: | ||||||||||||
Provided by operating activities (1) | $ | 350,907 | $ | 518,706 | $ | 270,918 | ||||||
Used in investing activities | (3,684,829 | ) | (2,130,360 | ) | (1,581,408 | ) | ||||||
Provided by financing activities | 3,334,051 | 1,376,767 | 1,524,260 | |||||||||
Net increase (decrease) in cash and cash equivalents | $ | 129 | $ | (234,887 | ) | $ | 213,770 | |||||
(1) | The years ended December 31, 2012, December 31, 2011, and December 31, 2010, are net of payments made for commodity derivative premiums of approximately $583 million, $134 million and $120 million, respectively. |
Operating Activities
Cash provided by operating activities for the year ended December 31, 2012, was approximately $351 million, compared to approximately $519 million for the year ended December 31, 2011. The decrease was primarily due to approximately $583 million in premiums paid for derivatives during the year ended December 31, 2012, compared to $134 million in premiums paid during the year ended December 31, 2011. Premiums paid for commodity derivatives increased primarily due to increased acquisition activity during the year ended December 31, 2012, as compared to the year ended December 31, 2011. Higher premiums and expenses were partially offset by higher revenues primarily due to increased production volumes.
Cash provided by operating activities was approximately $519 million for the year ended December 31, 2011, compared to approximately $271 million for the year ended December 31, 2010. The increase was primarily due to increased production volumes and commodity prices partially offset by higher expenses.
Premiums paid during the years ended December 31, 2012, 2011 and 2010, were for commodity derivative contracts that hedge future production. The Company hedges a substantial portion of its production to reduce exposure to fluctuations in the prices of oil and natural gas and provide long-term cash flow predictability to manage its business, service debt and pay distributions. The majority of the Company’s hedges are in the form of fixed price swaps, which are entered into on market terms and without cost. The Company’s ability to enter into swaps is governed by covenants under its Credit Facility which limit the maximum percentage of forecasted future production that may be hedged using swaps to 80% for the current calendar year and the following four calendar years and 70% thereafter. In prior years, the Company has chosen to purchase put options, primarily in connection with acquisitions, to hedge certain volumes in excess of volumes already hedged with swaps to achieve greater downside commodity price protection. Put options require the payment of a premium, which the Company pays in cash at the time of execution and no additional amounts are payable in the future under the contracts.
When the Company evaluates new hedging plans, it considers a variety of factors, including general characteristics of the asset to be hedged, such as commodity type and expectations for production growth, general availability of a liquid market to enter into new hedges, volumes, prices and duration of swaps that comply with the Credit Facility covenants, and attributes associated with put options, such as time value, volatility and premiums for various strike prices relative to swap reference prices. Specifically, for acquisitions which it chose to hedge in part with put options, the Company typically set a budget of approximately 10% of the acquisition contract price to purchase put options covering associated production volumes for multiple years into the future.
The appropriate level of production to be hedged is an ongoing consideration and is based on a variety of factors, including current and future expected commodity market prices, cost and availability of put option contracts, the level of acquisition
55
Item 7. Management’s Discussion and Analysis of Financial Condition and Results of Operations - Continued
activity and the Company’s overall risk profile, including leverage and size and scale considerations. As a result, the appropriate percentage of production volumes to be hedged may change over time. See Note 7 and Note 8 for additional details about the Company’s commodity derivatives.
Investing Activities
The following provides a comparative summary of cash flow from investing activities:
Year Ended December 31, | ||||||||||||
2012 | 2011 | 2010 | ||||||||||
(in thousands) | ||||||||||||
Cash flow from investing activities: | ||||||||||||
Acquisition of oil and natural gas properties, net of cash acquired | $ | (2,640,475 | ) | $ | (1,500,193 | ) | $ | (1,351,033 | ) | |||
Capital expenditures | (1,045,079 | ) | (629,864 | ) | (223,013 | ) | ||||||
Proceeds from sale of properties and equipment and other | 725 | (303 | ) | (7,362 | ) | |||||||
$ | (3,684,829 | ) | $ | (2,130,360 | ) | $ | (1,581,408 | ) | ||||
The primary use of cash in investing activities is for capital spending, including acquisitions and the development of the Company’s oil and natural gas properties. Cash used in investing activities for the year ended December 31, 2012, primarily relates to acquisitions of properties in the Hugoton Basin, Williston/Powder River Basin, East Texas and Green River Basin regions. See Note 2 for additional details of acquisitions. Development expenditures are higher primarily due to increased drilling activities in the Granite Wash formation.
Cash used in investing activities for the year ended December 31, 2011, primarily relates to acquisitions of properties in the Williston/Powder River Basin, Permian Basin and Mid-Continent regions. See Note 2 for additional details of acquisitions. The year ended December 31, 2011, also includes a deposit of approximately $9 million returned to the Company by the other party to a purchase and sale agreement (“PSA”) terminated by the Company in 2010.
Cash used in investing activities for the year ended December 31, 2010, primarily relates to acquisitions and the development of properties in the Permian Basin, Mid-Continent and Michigan/Illinois regions (see Note 2). The year ended December 31, 2010, also includes a deposit made by the Company of approximately $9 million and held by the other party to a PSA terminated by the Company (see Note 2).
Financing Activities
Cash provided by financing activities for the year ended December 31, 2012, was approximately $3.3 billion compared to approximately $1.4 billion for the year ended December 31, 2011. The increase in financing cash flow needs was primarily attributable to increased acquisitions and development activity during the year ended December 31, 2012. In comparison, cash provided by financing activities was approximately $1.5 billion for the year ended December 31, 2010.
The following provides a comparative summary of proceeds from borrowings and repayments of debt:
Year Ended December 31, | ||||||||||||
2012 | 2011 | 2010 | ||||||||||
(in thousands) | ||||||||||||
Proceeds from borrowings: | ||||||||||||
Credit facility | $ | 3,640,000 | $ | 1,790,000 | $ | 1,050,000 | ||||||
Senior notes | 1,799,802 | 744,240 | 2,250,816 | |||||||||
$ | 5,439,802 | $ | 2,534,240 | $ | 3,300,816 | |||||||
Repayments of debt: | ||||||||||||
Credit facility | $ | (3,400,000 | ) | $ | (850,000 | ) | $ | (2,150,000 | ) | |||
Senior notes | — | (451,029 | ) | — | ||||||||
$ | (3,400,000 | ) | $ | (1,301,029 | ) | $ | (2,150,000 | ) | ||||
56
Item 7. Management’s Discussion and Analysis of Financial Condition and Results of Operations - Continued
Debt
The Company’s Fifth Amended and Restated Credit Agreement (“Credit Facility”) provides for a revolving credit facility up to the lesser of: (i) the then-effective borrowing base and (ii) the maximum commitment amount. The Credit Facility has a borrowing base of $4.5 billion with a maximum commitment amount of $3.0 billion. The maturity date is April 2017. At January 31, 2013, the borrowing capacity under the Credit Facility was approximately $1.8 billion, which includes a $5 million reduction in availability for outstanding letters of credit.
As of December 31, 2012, 2011 and 2010, the Company was in compliance with all financial and other covenants of the Credit Facility. If an event of default would occur and were continuing, the Company would be unable to make borrowings and its financial condition and liquidity would be adversely affected. For information related to the Credit Facility, see Note 6.
On March 2, 2012, the Company issued $1.8 billion in aggregate principal amount of 6.25% senior notes due November 2019 (see Note 6) and used the net proceeds of approximately $1.77 billion to fund the Hugoton acquisition (see Note 2). The remaining proceeds were used to repay indebtedness under the Company’s Credit Facility and for general corporate purposes.
On May 8, 2012, the Company filed a registration statement on Form S-4 to register exchange notes that are identical in all material respects to those of the outstanding May 2019 Senior Notes, except that the transfer restrictions, registration rights and additional interest provisions relating to the outstanding notes do not apply to the exchange notes. On September 24, 2012, the registration statement was declared effective and the Company commenced an offer to exchange any and all of its $750 million outstanding principal amount of May 2019 Senior Notes for an equal amount of new May 2019 Senior Notes. The offer expired on October 23, 2012.
The Company depends, in part, on its Credit Facility for future capital needs. In addition, the Company has drawn on the Credit Facility to fund or partially fund cash distribution payments. Absent such borrowings, the Company would have at times experienced a shortfall in cash available to pay the declared cash distribution amount. For additional information, see “Distribution Practices” below. If an event of default occurs and is continuing under the Credit Facility, the Company would be unable to make borrowings to fund distributions. For additional information about this matter and other risk factors that could affect the Company, see Item 1A. “Risk Factors.”
Counterparty Credit Risk
The Company accounts for its commodity derivatives and, when applicable, its interest rate derivatives at fair value. The Company’s counterparties are current participants or affiliates of participants in its Credit Facility or were participants or affiliates of participants in its Credit Facility at the time it originally entered into the derivatives. The Credit Facility is secured by the Company’s oil, natural gas and NGL reserves; therefore, the Company is not required to post any collateral. The Company does not receive collateral from its counterparties. The Company minimizes the credit risk in derivative instruments by: (i) limiting its exposure to any single counterparty; (ii) entering into derivative instruments only with counterparties that meet the Company’s minimum credit quality standard, or have a guarantee from an affiliate that meets the Company’s minimum credit quality standard; and (iii) monitoring the creditworthiness of the Company’s counterparties on an ongoing basis. In accordance with the Company’s standard practice, its commodity derivatives and, when applicable, its interest rate derivatives are subject to counterparty netting under agreements governing such derivatives and therefore the risk of loss due to counterparty nonperformance is somewhat mitigated.
LinnCo Initial Public Offering
On October 17, 2012, LinnCo, an affiliate of LINN Energy, completed the LinnCo IPO of 34,787,500 common shares representing limited liability company interests to the public at a price of $36.50 per share ($34.858 per share, net of underwriting discount and structuring fee) for net proceeds of approximately $1.2 billion (after underwriting discount and structuring fee of approximately $57 million). The net proceeds LinnCo received from the offering were used to acquire 34,787,500 LINN Energy units which are equal to the number of LinnCo shares sold in the offering. The Company used the proceeds from the sale of the units to LinnCo to pay the expenses of the offering and repay a portion of the outstanding indebtedness under its Credit Facility.
57
Item 7. Management’s Discussion and Analysis of Financial Condition and Results of Operations - Continued
Public Offering of Units
In January 2012, the Company sold 19,550,000 units representing limited liability company interests at $35.95 per unit ($34.512 per unit, net of underwriting discount) for net proceeds of approximately $674 million (after underwriting discount and offering expenses of approximately $28 million). The Company used the net proceeds from the sale of these units to repay a portion of the indebtedness outstanding under its Credit Facility.
In March 2011, the Company sold 16,726,067 units representing limited liability company interests at $38.80 per unit ($37.248 per unit, net of underwriting discount) for net proceeds of approximately $623 million (after underwriting discount and offering expenses of approximately $26 million). The Company used a portion of the net proceeds from the sale of these units to fund the March 2011 redemptions of a portion of the outstanding 2017 Senior Notes and 2018 Senior Notes and to fund the cash tender offers and related expenses for a portion of the remaining 2017 Senior Notes and 2018 Senior Notes (see Note 6). The Company used the remaining net proceeds from the sale of units to finance a portion of the March 31, 2011, acquisition in the Williston/Powder Basin region.
Equity Distribution Agreement
In August 2011, the Company entered into an equity distribution agreement, pursuant to which it may from time to time issue and sell units representing limited liability company interests having an aggregate offering price of up to $500 million. Sales of units, if any, will be made through a sales agent by means of ordinary brokers’ transactions, in block transactions, or as otherwise agreed with the agent. The Company expects to use the net proceeds from any sale of the units for general corporate purposes, which may include, among other things, capital expenditures, acquisitions and the repayment of debt.
In January 2012, the Company, under its equity distribution agreement, issued and sold 1,539,651 units representing limited liability company interests at an average unit price of $38.02 for proceeds of approximately $57 million (net of approximately $1 million in commissions). In connection with the issue and sale of these units, the Company also incurred professional service expenses of approximately $700,000. The Company used the net proceeds for general corporate purposes, including the repayment of a portion of the indebtedness outstanding under its Credit Facility. At December 31, 2012, units equaling approximately $411 million in aggregate offering price remained available to be issued and sold under the agreement.
In September 2011, the Company issued and sold 16,060 units representing limited liability company interests at an average unit price of $38.25 for proceeds of approximately $602,000 (net of approximately $12,000 in commissions). In December 2011, the Company issued and sold 772,104 units representing limited liability company interests at an average unit price of $38.03 for proceeds of approximately $29 million (net of approximately $587,000 in commissions). In connection with the issue and sale of these units, the Company also incurred professional service expenses of approximately $139,000. The Company used the net proceeds for general corporate purposes, including the repayment of a portion of the indebtedness outstanding under its Credit Facility.
Unit Repurchase Plan
In October 2008, the Board of Directors of the Company authorized the repurchase of up to $100 million of the Company’s outstanding units from time to time on the open market or in negotiated purchases. In August 2011, the Company repurchased 400,000 units at an average unit price of $32.98 for a total cost of approximately $13 million. In addition, in October 2011, the Company repurchased 129,734 units at an average unit price of $32.08 for a total cost of approximately $4 million. At December 31, 2012, approximately $56 million was available for unit repurchase under the program.
Distributions
Under the Company’s limited liability company agreement, unitholders are entitled to receive a distribution of available cash, which includes cash on hand plus borrowings less any reserves established by the Company’s Board of Directors to provide for the proper conduct of the Company’s business (including reserves for future capital expenditures, including drilling, acquisitions and anticipated future credit needs) or to fund distributions over the next four quarters. The following provides a summary of distributions paid by the Company during the year ended December 31, 2012:
58
Item 7. Management’s Discussion and Analysis of Financial Condition and Results of Operations - Continued
Date Paid | Period Covered by Distribution | Distributions Per Unit | Total Distributions | |||||||
(in millions) | ||||||||||
November 2012 | July 1 – September 30, 2012 | $ | 0.725 | $ | 170 | |||||
August 2012 | April 1 – June 30, 2012 | $ | 0.725 | $ | 145 | |||||
May 2012 | January 1 – March 31, 2012 | $ | 0.725 | $ | 144 | |||||
February 2012 | October 1 – December 31, 2011 | $ | 0.69 | $ | 138 | |||||
On April 24, 2012, the Company’s Board of Directors approved an increase in the quarterly cash distribution from $0.69 per unit to $0.725 per unit, representing an increase of 5%. On January 24, 2013, the Company’s Board of Directors declared a cash distribution of $0.725 per unit, or $2.90 per unit on an annualized basis, with respect to the fourth quarter of 2012. The distribution, totaling approximately $170 million, was paid on February 14, 2013, to unitholders of record as of the close of business on February 7, 2013.
Contingencies
The Company has been named as a defendant in a number of lawsuits, including claims from royalty owners related to disputed royalty payments and royalty valuations. The Company has established reserves that management currently believes are adequate to provide for potential liabilities based upon its evaluation of these matters. For a certain statewide class action royalty payment dispute where a reserve has not yet been established, the Company has denied that it has any liability on the claims and has raised arguments and defenses that, if accepted by the court, will result in no loss to the Company. Discovery related to class certification has concluded. Briefing and the hearing on class certification have been deferred by court order pending the Tenth Circuit Court of Appeals’ resolution of interlocutory appeals of two unrelated class certification orders. As a result, the Company is unable to estimate a possible loss, or range of possible loss, if any. In addition, the Company is involved in various other disputes arising in the ordinary course of business. The Company is not currently a party to any litigation or pending claims that it believes would have a material adverse effect on its overall business, financial position, results of operations or liquidity; however, cash flow could be significantly impacted in the reporting periods in which such matters are resolved.
During the years ended December 31, 2012, December 31, 2011, and December 31, 2010, the Company made no significant payments to settle any legal, environmental or tax proceedings. The Company regularly analyzes current information and accrues for probable liabilities on the disposition of certain matters as necessary. Liabilities for loss contingencies arising from claims, assessments, litigation or other sources are recorded when it is probable that a liability has been incurred and the amount can be reasonably estimated.
59
Item 7. Management’s Discussion and Analysis of Financial Condition and Results of Operations - Continued
Commitments and Contractual Obligations
The following summarizes, as of December 31, 2012, certain long-term contractual obligations that are reflected in the consolidated balance sheets and/or disclosed in the accompanying notes thereto:
Payments Due | ||||||||||||||||||||
Contractual Obligations | Total | 2013 | 2014 – 2015 | 2016 – 2017 | 2018 and Beyond | |||||||||||||||
(in thousands) | ||||||||||||||||||||
Long-term debt obligations: | ||||||||||||||||||||
Credit facility | $ | 1,180,000 | $ | — | $ | — | $ | 1,180,000 | $ | — | ||||||||||
Senior notes | 4,904,898 | — | — | 40,737 | 4,864,161 | |||||||||||||||
Interest (1) | 2,666,850 | 380,306 | 760,612 | 740,784 | 785,148 | |||||||||||||||
Operating lease obligations: | ||||||||||||||||||||
Office, property and equipment leases | 37,375 | 6,459 | 13,378 | 8,777 | 8,761 | |||||||||||||||
Other noncurrent liabilities: | ||||||||||||||||||||
Asset retirement obligations | 151,974 | 5,221 | 6,483 | 5,724 | 134,546 | |||||||||||||||
Other: | ||||||||||||||||||||
Commodity derivatives | 5,027 | 26 | 1,639 | 3,362 | — | |||||||||||||||
$ | 8,946,124 | $ | 392,012 | $ | 782,112 | $ | 1,979,384 | $ | 5,792,616 | |||||||||||
(1) | Represents interest on the Credit Facility computed at the weighted average LIBOR of 1.97% through maturity in April 2017 and interest on the Original Senior Notes, May 2019 Senior Notes, November 2019 Senior Notes, and the 2010 Issued Senior Notes, as defined in Note 6, computed at fixed rates of 11.75%, 9.875%, 6.50%, 6.25%, 8.625% and 7.75% through maturities in May 2017, July 2018, May 2019, November 2019, April 2020 and February 2021, respectively. |
Capital Structure
The Company’s capitalization is presented below:
December 31, | ||||||||
2012 | 2011 | |||||||
(in thousands) | ||||||||
Cash and cash equivalents | $ | 1,243 | $ | 1,114 | ||||
Credit facility | $ | 1,180,000 | $ | 940,000 | ||||
Senior notes due 2017, net | 39,399 | 39,183 | ||||||
Senior notes due 2018, net | 13,941 | 13,913 | ||||||
Senior notes due May 2019, net | 745,172 | 744,593 | ||||||
Senior notes due November 2019, net | 1,799,818 | — | ||||||
Senior notes due 2020, net | 1,274,169 | 1,271,856 | ||||||
Senior notes due 2021, net | 985,318 | 984,112 | ||||||
6,037,817 | 3,993,657 | |||||||
Total unitholders’ capital | 4,427,180 | 3,428,910 | ||||||
$ | 10,464,997 | $ | 7,422,567 | |||||
60
Item 7. Management’s Discussion and Analysis of Financial Condition and Results of Operations - Continued
Distribution Practices
The Company’s Board of Directors determines the appropriate level of distributions on a periodic basis in accordance with the provisions of the Company’s limited liability company agreement. Management considers the timing and size of planned capital expenditures and long-term views about expected results in determining the amount of its distributions. Capital spending and resulting production and net cash provided by operating activities do not typically occur evenly throughout the year due to a variety of factors which are difficult to predict, including rig availability, weather, well performance, the timing of completions and the commodity price environment. Consistent with practices common to publicly traded partnerships, the Company’s Board of Directors historically has not varied the distribution it declares period to period based on uneven net cash provided by operating activities. The Company’s Board of Directors reviews historical financial results and forecasts for future periods, including development activities, as well as considers the impact of significant acquisitions in making a determination to increase, decrease or maintain the current level of distribution. For example, in each of years ended December 31, 2012, 2011 and 2010, following acquisitions and development activities during such years, the Company’s Board of Directors reviewed the excess net cash provided by operating activities after distributions and discretionary adjustments in then-current periods, as well as forecasts of expected future net cash provided by operating activities and determined to increase the distribution in each of those years. If shortfalls are sustained over time and forecasts demonstrate expectations for continued future shortfalls, the Company’s Board of Directors may determine to reduce, suspend or discontinue paying distributions. Please read “Risk Factors – If we are unable to fully offset declines in production and proved developed producing reserves from discretionary reductions for a portion of our oil and natural gas development costs, our net cash provided by operating activities could be reduced, which could adversely affect our ability to pay a distribution at the current level or at all” and “we may not have sufficient net cash provided by operating activities to pay our distribution at the current distribution level, or at all, and as a result, future distributions to our unitholders may be reduced or eliminated.”
The Company intends to fund interest expense, a portion of its oil and natural gas development costs and distributions to unitholders from net cash provided by operating activities. The Company funds premiums paid for derivatives, acquisitions and other capital expenditures primarily with proceeds from debt or equity offerings, borrowings under its Credit Facility or other external sources of funding. Although it is the Company’s practice to acquire or modify derivative instruments with external sources of funding, any cash settlements on derivatives are reported as operating cash flows and may be used to fund distributions. See below for details regarding the discretionary adjustments considered by the Company’s Board of Directors in assessing the appropriate distribution amount for each period, as well as the extent to which sources of funding have been sufficient for the periods presented:
Year Ended December 31, | |||||||||||
2012 | 2011 | 2010 | |||||||||
(in thousands) | |||||||||||
Net cash provided by operating activities | $ | 350,907 | $ | 518,706 | $ | 270,918 | |||||
Distributions to unitholders | (596,935 | ) | (466,488 | ) | (365,711 | ) | |||||
Excess (shortfall) of net cash provided by operating activities after distributions to unitholders | (246,028 | ) | 52,218 | (94,793 | ) | ||||||
Discretionary adjustments considered by the Board of Directors: | |||||||||||
Premiums paid for derivatives (1) | 583,434 | 134,352 | 120,376 | ||||||||
Cash settlements on canceled derivatives (2) | — | (26,752 | ) | 123,865 | |||||||
Cash recoveries of bankruptcy claim (3) | (21,503 | ) | — | — | |||||||
Cash received for acquisitions – revenues less operating expenses (4) | 80,502 | 57,966 | 42,846 | ||||||||
Discretionary reductions for a portion of oil and natural gas development costs (5) | (362,430 | ) | (167,281 | ) | (88,245 | ) | |||||
Provision for legal matters (6) | 414 | 1,086 | 4,362 | ||||||||
Changes in operating assets and liabilities and other, net (7) | 47,951 | 72,147 | (16,646 | ) | |||||||
Excess of net cash provided by operating activities after distributions to unitholders and discretionary adjustments considered by the Board of Directors (8) | $ | 82,340 | $ | 123,736 | $ | 91,765 | |||||
(1) | Represent premiums paid for derivatives during the period. The Company considers the cost of premiums paid for derivatives as an investment related to its underlying oil and natural gas properties. The Company’s statements of cash flows, prepared in accordance |
61
Item 7. Management’s Discussion and Analysis of Financial Condition and Results of Operations - Continued
with GAAP, present cash settlements on derivatives and premiums paid for derivatives as operating activities. However, for purposes of determining the amount available for distribution to unitholders, the Company considers premiums paid for derivatives as investing activities, similar to the way the initial acquisition or development costs of the Company’s oil and natural gas properties are presented as investing activities while the cash flows generated from these assets are included in net cash provided by operating activities. The consideration of premiums paid for derivatives as investing activities for purposes of determining the amount available for distribution differs from the presentation of derivatives activities, including premiums paid, as operating activities in the Company’s financial statements prepared in accordance with GAAP.
(2) | Represent derivatives canceled prior to the contract settlement date. In 2011, commodity derivatives were canceled and the proceeds were reallocated within the Company’s derivatives portfolio. In 2010, interest rate swaps were canceled in connection with the issuances of certain fixed-rate senior notes. |
(3) | Represent the recoveries of a bankruptcy claim against Lehman Brothers which was not a transaction occurring in the ordinary course of the Company’s business. |
(4) | Represents adjustments to the purchase price of acquisitions, based on the Company’s contractual right to revenues less operating expenses for periods from the effective date of a transaction to the closing date of a transaction. When the Company is the buyer, it is legally entitled to revenues less operating expenses generated during this period, and the Company’s Board of Directors has historically made a discretionary adjustment to include this cash in the amount available for distribution. Conversely, when the Company is the seller, the Company’s Board of Directors has historically made a discretionary adjustment to reduce this cash from the amount available for distribution during the period. |
(5) | Represent discretionary reductions for a portion of oil and natural gas development costs, an estimated component of total development costs, which are amounts established by the Board of Directors at the end of each year for the following year, allocated across four quarters, that are intended to fully offset declines in production and proved developed producing reserves during the year as compared to the prior year. The portion of oil and natural gas development costs includes estimated drilling and development costs associated with projects to convert a portion of non-producing reserves to producing status. However, the amounts do not include the historical cost of acquired properties as those amounts have already been spent in prior periods, were financed primarily with external sources of funding and do not affect the Company’s ability to pay distributions in the current period. The Company’s existing reserves, inventory of drilling locations and production levels will decline over time as a result of development and production activities. Consequently, if the Company were to limit its total capital expenditures to this portion of oil and natural gas development costs and not acquire new reserves, total reserves would decrease over time, resulting in an inability to maintain production at current levels, which could adversely affect the Company’s ability to pay a distribution at the current level or at all. However, the Company’s current total reserves do not include reserve additions that may result from converting existing probable and possible resources to additional proved reserves, potential additional discoveries or technological advancements on the Company’s existing acreage position. For additional information, including the risks associated with the process for determining this amount, please also see “Risk Factors - If we are unable to fully offset declines in production and proved developed producing reserves from discretionary reductions for a portion of our oil and natural gas development costs, our net cash provided by operating activities could be reduced, which could adversely affect our ability to pay a distribution at the current level or at all.” |
See below for total development of oil and natural gas properties as presented in the statements of cash flows:
Year Ended December 31, | |||||||||||
2012 | 2011 | 2010 | |||||||||
(in thousands) | |||||||||||
Total development of oil and natural gas properties | $ | 984,530 | $ | 574,635 | $ | 204,832 | |||||
See below for disclosure for the last three years regarding (i) discretionary reductions for a portion of oil and natural gas development costs and (ii) the portion of reserves estimated to be converted from non-producing to producing status through the capital expenditures that are discretionary reductions for a portion of oil and natural gas development costs.
Year Ended December 31, | |||||||||||
2012 | 2011 | 2010 | |||||||||
Discretionary reductions for a portion of oil and natural gas development costs (in thousands) (a) | $ | 362,430 | $ | 167,281 | $ | 88,245 | |||||
Portion of non-producing reserves estimated to be converted to producing status through discretionary reductions (Bcfe) (b) | 265 | 120 | 90 | ||||||||
(a) | Represents the estimated costs to convert non-producing reserves to producing status on the Company’s most efficient projects, with the intent to fully offset declines in production and proved developed producing reserves through drilling and development activities. Includes not only the conversion of reserves from proved undeveloped to producing status but also includes converting reserves that are non-proved to producing status and converting reserves from activities such as recompletions and workovers to |
62
Item 7. Management’s Discussion and Analysis of Financial Condition and Results of Operations - Continued
producing status. Such estimated costs and quantities do not represent actual costs or reserve conversions or additions. See Item 1. “Business” and “Supplemental Oil and Natural Gas Data (Unaudited)” in Item 8. “Financial Statements and Supplementary Data” for information regarding historical reserve conversions or additions and the related costs of such conversions or additions.
(b) | Represents the reserves estimated to be converted from the Company’s most efficient projects, with the intent to fully offset declines in production and proved developed producing reserves through drilling and development activities. Includes not only the conversion of reserves from proved undeveloped to producing status but also includes converting reserves that are non-proved to producing status and converting reserves from activities such as recompletions and workovers to producing status. |
(6) | Represents reserves and settlements related to legal matters. |
(7) | Represents primarily working capital adjustments. These adjustments may or may not impact cash provided by operating activities during the respective period, but are included as discretionary adjustments considered by the Company’s Board of Directors as the Board historically has not varied the distribution it declares period to period based on uneven cash flows. The Company’s Board of Directors, when determining the appropriate level of cash distributions, excluded the impact of the timing of cash receipts and payments; as such, this adjustment is necessary to show the historical amounts considered by the Company’s Board of Directors in assessing the appropriate distribution amount for each period. |
(8) | Represents the excess (shortfall) of net operating cash flow after distributions to unitholders and discretionary adjustments. Any excess was retained by the Company for future operations, future capital expenditures, future debt service or other future obligations. Any shortfall was funded with cash on hand and/or borrowings under the Company’s Credit Facility. |
A summary of the significant sources and uses of funding for the respective periods is presented below:
Year Ended December 31, | |||||||||||
2012 | 2011 | 2010 | |||||||||
(in thousands) | |||||||||||
Net cash provided by operating activities | $ | 350,907 | $ | 518,706 | $ | 270,918 | |||||
Distributions to unitholders | (596,935 | ) | (466,488 | ) | (365,711 | ) | |||||
Excess (shortfall) of net operating cash flow after distributions to unitholders | (246,028 | ) | 52,218 | (94,793 | ) | ||||||
Plus (less): | |||||||||||
Net cash provided by financing activities (excluding distributions to unitholders) | 3,930,986 | 1,843,255 | 1,889,971 | ||||||||
Acquisition of oil and natural gas properties and joint-venture funding | (2,640,475 | ) | (1,500,193 | ) | (1,351,033 | ) | |||||
Development of oil and natural gas properties | (984,530 | ) | (574,635 | ) | (204,832 | ) | |||||
Purchases of other property and equipment | (60,549 | ) | (55,229 | ) | (18,181 | ) | |||||
Proceeds from sale of properties and equipment and other | 725 | (303 | ) | (7,362 | ) | ||||||
Net increase (decrease) in cash and cash equivalents | $ | 129 | $ | (234,887 | ) | $ | 213,770 | ||||
Critical Accounting Policies and Estimates
The discussion and analysis of the Company’s financial condition and results of operations is based upon the consolidated financial statements, which have been prepared in accordance with GAAP. The preparation of these financial statements requires the Company to make estimates and assumptions that affect the reported amounts of assets, liabilities, revenues and expenses, and related disclosures of contingent assets and liabilities. Certain accounting policies involve judgments and uncertainties to such an extent that there is reasonable likelihood that materially different amounts could have been reported under different conditions, or if different assumptions had been used. The Company evaluates its estimates and assumptions on a regular basis. The Company bases estimates on historical experience and various other assumptions that are believed to be reasonable under the circumstances, the results of which form the basis for making judgments about the carrying values of assets and liabilities that are not readily apparent from other sources. Actual results may differ from these estimates and assumptions used in the preparation of financial statements.
Below are expanded discussions of the Company’s more significant accounting policies, estimates and judgments, i.e., those that reflect more significant estimates and assumptions used in the preparation of its financial statements. See Note 1 for details about additional accounting policies and estimates made by Company management.
63
Item 7. Management’s Discussion and Analysis of Financial Condition and Results of Operations - Continued
Recently Issued Accounting Standards
In December 2011, the Financial Accounting Standards Board (“FASB”) issued an Accounting Standards Update (“ASU”) that requires an entity to disclose information about offsetting and related arrangements to enable users of its financial statements to understand the effect of those arrangements on its financial position. The ASU requires disclosure of both gross information and net information about both instruments and transactions eligible for offset in the statement of financial position and instruments and transactions subject to an agreement similar to a master netting arrangement. The ASU will be applied retrospectively and is effective for periods beginning on or after January 1, 2013. The Company is currently evaluating the impact, if any, of the adoption of this ASU on its consolidated financial statements and related disclosures.
In May 2011, the FASB issued an ASU that further addresses fair value measurement accounting and related disclosure requirements. The ASU clarifies the FASB’s intent regarding the application of existing fair value measurement and disclosure requirements, changes the fair value measurement requirements for certain financial instruments, and sets forth additional disclosure requirements for other fair value measurements. The ASU is to be applied prospectively and is effective for periods beginning after December 15, 2011. The Company adopted the ASU effective January 1, 2012. The adoption of the requirements of the ASU, which expanded disclosures, had no effect on the Company’s results of operations or financial position.
Oil and Natural Gas Reserves
Proved reserves are based on the quantities of oil, natural gas and NGL that by analysis of geoscience and engineering data can be estimated with reasonable certainty to be economically producible from a given date forward, from known reservoirs, and under existing economic conditions, operating methods, and government regulations prior to the time at which contracts providing the right to operate expire, unless evidence indicates that renewal is reasonably certain. The independent engineering firm, DeGolyer and MacNaughton, prepared a reserve and economic evaluation of all of the Company properties on a well-by-well basis as of December 31, 2012, and the reserve estimates reported herein were prepared by DeGolyer and MacNaughton. The reserve estimates were reviewed and approved by the Company’s senior engineering staff and management, with final approval by its Executive Vice President and Chief Operating Officer.
Reserves and their relation to estimated future net cash flows impact the Company’s depletion and impairment calculations. As a result, adjustments to depletion and impairment are made concurrently with changes to reserve estimates. The process performed by the independent engineers to prepare reserve amounts included their estimation of reserve quantities, future producing rates, future net revenue and the present value of such future net revenue, based in part on data provided by the Company. The estimates of reserves conform to the guidelines of the Securities and Exchange Commission (“SEC”), including the criteria of “reasonable certainty,” as it pertains to expectations about the recoverability of reserves in future years.
The accuracy of reserve estimates is a function of many factors including the following: the quality and quantity of available data, the interpretation of that data, the accuracy of various mandated economic assumptions and the judgments of the individuals preparing the estimates. In addition, reserve estimates are a function of many assumptions, all of which could deviate significantly from actual results. As such, reserve estimates may materially vary from the ultimate quantities of oil, natural gas and NGL eventually recovered. For additional information regarding estimates of reserves, including the standardized measure of discounted future net cash flows, see “Supplemental Oil and Natural Gas Data (Unaudited)” in Item 8. “Financial Statements and Supplementary Data” and see also Item 1. “Business.”
Oil and Natural Gas Properties
Proved Properties
The Company accounts for oil and natural gas properties in accordance with the successful efforts method. In accordance with this method, all leasehold and development costs of proved properties are capitalized and amortized on a unit-of-production basis over the remaining life of the proved reserves and proved developed reserves, respectively.
The Company evaluates the impairment of its proved oil and natural gas properties on a field-by-field basis whenever events or changes in circumstances indicate that the carrying value may not be recoverable. The carrying values of proved properties are reduced to fair value when the expected undiscounted future cash flows are less than net book value. The fair values of proved properties are measured using valuation techniques consistent with the income approach, converting future
64
Item 7. Management’s Discussion and Analysis of Financial Condition and Results of Operations - Continued
cash flows to a single discounted amount. Significant inputs used to determine the fair values of proved properties include estimates of: (i) reserves; (ii) future operating and development costs; (iii) future commodity prices; and (iv) a market-based weighted average cost of capital rate. The underlying commodity prices embedded in the Company’s estimated cash flows are the product of a process that begins with New York Mercantile Exchange (“NYMEX”) forward curve pricing, adjusted for estimated location and quality differentials, as well as other factors that Company management believes will impact realizable prices. Costs of retired, sold or abandoned properties that constitute a part of an amortization base are charged or credited, net of proceeds, to accumulated depreciation, depletion and amortization unless doing so significantly affects the unit-of-production amortization rate, in which case a gain or loss is recognized currently. Gains or losses from the disposal of other properties are recognized currently. Expenditures for maintenance and repairs necessary to maintain properties in operating condition are expensed as incurred. Estimated dismantlement and abandonment costs are capitalized, net of salvage, at their estimated net present value and amortized on a unit-of-production basis over the remaining life of the related proved developed reserves. The Company capitalizes interest on borrowed funds related to its share of costs associated with the drilling and completion of new oil and natural gas wells. Interest is capitalized only during the periods in which these assets are brought to their intended use. The Company capitalized interest costs of approximately $2 million for the years ended December 31, 2012, and December 31, 2011, and approximately $1 million for the year ended December 31, 2010.
Impairment of Proved Properties
Based on the analysis described above, the Company recorded noncash impairment charges, before and after tax, of approximately $422 million associated with proved oil and natural gas properties related to lower commodity prices for the year ended December 31, 2012, and a noncash impairment charge, before and after tax, of approximately $39 million primarily associated with proved oil and natural gas properties related to an unfavorable marketing contract for the year ended December 31, 2010. The Company recorded no impairment charge for the year ended December 31, 2011. The carrying values of the impaired proved properties were reduced to fair value, estimated using inputs characteristic of a Level 3 fair-value measurement. The charges are included in “impairment of long-lived assets” on the consolidated statements of operations.
Unproved Properties
Costs related to unproved properties include costs incurred to acquire unproved reserves. Because these reserves do not meet the definition of proved reserves, the related costs are not classified as proved properties. The fair values of unproved properties are measured using valuation techniques consistent with the income approach, converting future cash flows to a single discounted amount. Significant inputs used to determine the fair values of unproved properties include estimates of: (i) reserves; (ii) future operating and development costs; (iii) future commodity prices; and (iv) a market-based weighted average cost of capital rate. The market-based weighted average cost of capital rate is subjected to additional project-specific risking factors. Unproved leasehold costs are capitalized and amortized on a composite basis if individually insignificant, based on past success, experience and average lease-term lives. Individually significant leases are reclassified to proved properties if successful and expensed on a lease by lease basis if unsuccessful or the lease term expires. Unamortized leasehold costs related to successful exploratory drilling are reclassified to proved properties and depleted on a unit-of-production basis. The Company assesses unproved properties for impairment quarterly on the basis of its experience in similar situations and other factors such as the primary lease terms of the properties, the average holding period of unproved properties, and the relative proportion of such properties on which proved reserves have been found in the past.
Exploration Costs
Geological and geophysical costs, delay rentals, amortization and impairment of unproved leasehold costs and costs to drill exploratory wells that do not find proved reserves are expensed as exploration costs. The costs of any exploratory wells are carried as an asset if the well finds a sufficient quantity of reserves to justify its capitalization as a producing well and as long as the Company is making sufficient progress towards assessing the reserves and the economic and operating viability of the project. The Company recorded noncash leasehold impairment expenses related to unproved properties of approximately $2 million for the years ended December 31, 2012, and December 31, 2011, and approximately $5 million for the year ended December 31, 2010, which are included in “exploration costs” on the consolidated statements of operations.
Revenue Recognition
Sales of oil, natural gas and NGL are recognized when the product has been delivered to a custody transfer point, persuasive evidence of a sales arrangement exists, the rights and responsibility of ownership pass to the purchaser upon delivery, collection of revenue from the sale is reasonably assured, and the sales price is fixed or determinable.
65
Item 7. Management’s Discussion and Analysis of Financial Condition and Results of Operations - Continued
The Company has elected the entitlements method to account for natural gas production imbalances. Imbalances occur when the Company sells more or less than its entitled ownership percentage of total natural gas production. In accordance with the entitlements method, any amount received in excess of the Company’s share is treated as a liability. If the Company receives less than its entitled share, the underproduction is recorded as a receivable. At December 31, 2012, and December 31, 2011, the Company had natural gas production imbalance receivables of approximately $28 million and $19 million, respectively, which are included in “accounts receivable – trade, net” on the consolidated balance sheets and natural gas production imbalance payables of approximately $18 million and $9 million, respectively, which are included in “accounts payable and accrued expenses” on the consolidated balance sheets.
The Company engages in the purchase, gathering and transportation of third-party natural gas and subsequently markets such natural gas to independent purchasers under separate arrangements. As such, the Company separately reports third-party marketing sales and natural gas marketing expenses.
Asset Retirement Obligations
The Company has the obligation to plug and abandon oil and natural gas wells and related equipment at the end of production operations. Estimated asset retirement costs are recognized when the obligation is incurred, and are amortized over proved developed reserves using the unit-of-production method. Accretion expense is included in “depreciation, depletion and amortization” on the consolidated statements of operations. The fair values of additions to the asset retirement obligations are estimated using valuation techniques that convert future cash flows to a single discounted amount. Significant inputs to the valuation include estimates of: (i) plug and abandon costs per well based on existing regulatory requirements; (ii) remaining life per well; (iii) future inflation factors; and (iv) a credit-adjusted risk-free interest rate. Revisions in estimated liabilities can result from revisions of estimated inflation rates, escalating retirement costs and changes in the estimated timing of settling asset retirement obligations (see Note 10).
Derivative Instruments
The Company uses derivative financial instruments to reduce exposure to fluctuations in the prices of oil and natural gas. By removing a significant portion of the price volatility associated with future production, the Company expects to mitigate, but not eliminate, the potential effects of variability in cash flow from operations due to fluctuations in commodity prices. These transactions are primarily in the form of swap contracts and put options. A swap contract specifies a fixed price that the Company will receive from the counterparty as compared to floating market prices, and on the settlement date the Company will receive or pay the difference between the swap price and the market price. A put option requires the Company to pay the counterparty a premium equal to the fair value of the option at the purchase date and receive from the counterparty the excess, if any, of the fixed price floor over the market price at the settlement date. In addition, the Company may from time to time enter into derivative contracts in the form of interest rate swaps to minimize the effects of fluctuations in interest rates. Currently, the Company has no outstanding derivative contracts in the form of interest rate swaps.
Derivative instruments (including certain derivative instruments embedded in other contracts that require bifurcation) are recorded at fair value and included on the consolidated balance sheets as assets or liabilities. The Company did not designate these contracts as cash flow hedges; therefore, the changes in fair value of these instruments are recorded in current earnings. The Company uses certain pricing models to determine the fair value of its derivative financial instruments. Inputs to the pricing models include publicly available prices and forward price curves generated from a compilation of data gathered from third parties. Company management validates the data provided by third parties by understanding the pricing models used, obtaining market values from other pricing sources, analyzing pricing data in certain situations and confirming that those securities trade in active markets. See Note 7 and Note 8 for additional details about the Company’s derivative financial instruments. See Item 7A. “Quantitative and Qualitative Disclosures About Market Risk” for sensitivity analysis regarding the Company’s derivative financial instruments.
Acquisition Accounting
The Company accounts for business combinations under the acquisition method of accounting (see Note 2). Accordingly, the Company recognizes amounts for identifiable assets acquired and liabilities assumed equal to their estimated acquisition date fair values. Transaction and integration costs associated with business combinations are expensed as incurred.
66
Item 7. Management’s Discussion and Analysis of Financial Condition and Results of Operations - Continued
The Company makes various assumptions in estimating the fair values of assets acquired and liabilities assumed. As fair value is a market-based measurement, it is determined based on the assumptions that market participants would use. The most significant assumptions relate to the estimated fair values of proved and unproved oil and natural gas properties. The fair values of these properties are measured using valuation techniques that convert future cash flows to a single discounted amount. Significant inputs to the valuation include estimates of: (i) reserves; (ii) future operating and development costs; (iii) future commodity prices; and (iv) a market-based weighted average cost of capital rate. The market-based weighted average cost of capital rate is subjected to additional project-specific risking factors. To compensate for the inherent risk of estimating and valuing unproved properties, the discounted future net revenues of probable and possible reserves are reduced by additional risk-weighting factors. In addition, when appropriate, the Company reviews comparable purchases and sales of oil and natural gas properties within the same regions, and uses that data as a proxy for fair market value; i.e., the amount a willing buyer and seller would enter into in exchange for such properties.
Any excess of the acquisition price over the estimated fair value of net assets acquired is recorded as goodwill while any excess of the estimated fair value of net assets acquired over the acquisition price is recorded in current earnings as a gain. Deferred taxes are recorded for any differences between the assigned values and the tax basis of assets and liabilities. Estimated deferred taxes are based on available information concerning the tax basis of assets acquired and liabilities assumed and loss carryforwards at the acquisition date, although such estimates may change in the future as additional information becomes known.
While the estimated fair values of the assets acquired and liabilities assumed have no effect on cash flow, they can have an effect on future results of operations. Generally, higher fair values assigned to oil and natural gas properties result in higher future depreciation, depletion and amortization expense, which results in decreased future net earnings. Also, a higher fair value assigned to oil and natural gas properties, based on higher future estimates of commodity prices, could increase the likelihood of impairment in the event of lower commodity prices or higher operating costs than those originally used to determine fair value. The recording of impairment expense has no effect on cash flow but results in a decrease in net income for the period in which the impairment is recorded.
Legal, Environmental and Other Contingencies
A provision for legal, environmental and other contingencies is charged to expense when the loss is probable and the cost can be reasonably estimated. Determining when expenses should be recorded for these contingencies and the appropriate amounts of the accrual is subject to an estimation process that requires subjective judgment of management. In many cases, management’s judgment is based on the advice and opinions of legal counsel and other advisers, the interpretation of laws and regulations which can be interpreted differently by regulators and/or courts of law, the experience of the Company and other companies dealing with similar matters, and management’s decision on how it intends to respond to a particular matter; for example, a decision to contest it vigorously or a decision to seek a negotiated settlement. The Company’s management closely monitors known and potential legal, environmental and other contingencies and periodically determines when it should record losses for these items based on information available to the Company.
Unit-Based Compensation
The Company recognizes expense for unit-based compensation over the requisite service period in an amount equal to the fair value of unit-based payments granted to employees and nonemployee directors. See Note 1 and Note 5 for additional details about the Company’s accounting for unit-based compensation.
67
Item 7A. | Quantitative and Qualitative Disclosures About Market Risk |
The primary objective of the following information is to provide forward-looking quantitative and qualitative information about potential exposure to market risks. The term “market risk” refers to the risk of loss arising from adverse changes in commodity prices and interest rates. The disclosures are not meant to be precise indicators of expected future losses, but rather indicators of reasonably possible losses. This forward-looking information provides indicators of how the Company views and manages its ongoing market risk exposures. All of the Company’s market risk sensitive instruments were entered into for purposes other than trading.
The following should be read in conjunction with the financial statements and related notes included elsewhere in this Annual Report on Form 10-K. A reference to a “Note” herein refers to the accompanying Notes to Consolidated Financial Statements contained in Item 8. “Financial Statements and Supplementary Data.”
Commodity Price Risk
An important part of the Company’s business strategy includes hedging a significant portion of its forecasted production to reduce exposure to fluctuations in the prices of oil and natural gas and provide long-term cash flow predictability to manage its business, service debt and pay distributions. The current direct NGL hedging market is constrained in terms of price, volume, duration and number of counterparties, which limits the Company’s ability to effectively hedge its NGL production. As a result, currently, the Company directly hedges only its oil and natural gas production. By removing a significant portion of the price volatility associated with future production, the Company expects to mitigate, but not eliminate, the potential effects of variability in net cash provided by operating activities due to fluctuations in commodity prices.
The Company enters into commodity hedging transactions primarily in the form of swap contracts that are designed to provide a fixed price and, from time to time, put options that are designed to provide a fixed price floor with the opportunity for upside. The Company enters into these transactions with respect to a portion of its projected production to provide an economic hedge of the risk related to the future commodity prices received. The Company does not enter into derivative contracts for trading purposes.
The Company maintains a substantial portion of its hedges in the form of swap contracts. From time to time, the Company has chosen to purchase put option contracts primarily in connection with acquisition activity to hedge volumes in excess of those already hedged with swap contracts. The appropriate level of production to be hedged is an ongoing consideration and is based on a variety of factors, including current and future expected commodity market prices, cost and availability of put option contracts, the level of acquisition activity and the Company’s overall risk profile, including leverage and size and scale considerations. As a result, the appropriate percentage of production volumes to be hedged may change over time.
In certain historical periods, the Company paid an incremental premium to increase the fixed price floors on existing put options because the Company typically hedges multiple years in advance and in some cases commodity prices had increased significantly beyond the initial hedge prices. As a result, the Company determined that the existing put option strike prices did not provide reasonable downside protection in the context of the current market.
At December 31, 2012, the fair value of fixed price swaps and put option contracts was a net asset of approximately $899 million. A 10% increase in the index oil and natural gas prices above December 31, 2012, prices would result in a net liability of approximately $29 million, which represents a decrease in the fair value of approximately $928 million; conversely, a 10% decrease in the index oil and natural gas prices below December 31, 2012, prices would result in a net asset of approximately $1.8 billion, which represents an increase in the fair value of approximately $946 million.
At December 31, 2011, the fair value of fixed price swaps and put option contracts was a net asset of approximately $605 million. A 10% increase in the index oil and natural gas prices above December 31, 2011, prices would result in a net asset of approximately $176 million, which represents a decrease in the fair value of approximately $429 million; conversely, a 10% decrease in the index oil and natural gas prices below December 31, 2011, prices would result in a net asset of approximately $1.0 billion, which represents an increase in the fair value of approximately $428 million.
The Company determines the fair value of its oil and natural gas derivatives utilizing pricing models that use a variety of techniques, including market quotes and pricing analysis. Inputs to the pricing models include publicly available prices and forward price curves generated from a compilation of data gathered from third parties. Company management validates the
68
Item 7A. Quantitative and Qualitative Disclosures About Market Risk - Continued
data provided by third parties by understanding the pricing models used, obtaining market values from other pricing sources, analyzing pricing data in certain situations and confirming that those securities trade in active markets.
The prices of oil, natural gas and NGL have been extremely volatile, and the Company expects this volatility to continue. Prices for these commodities may fluctuate widely in response to relatively minor changes in the supply of and demand for such commodities, market uncertainty and a variety of additional factors that are beyond its control. Actual gains or losses recognized related to the Company’s derivative contracts will likely differ from those estimated at December 31, 2012, and will depend exclusively on the price of the commodities on the specified settlement dates provided by the derivative contracts.
The Company cannot be assured that its counterparties will be able to perform under its derivative contracts. If a counterparty fails to perform and the derivative arrangement is terminated, the Company’s cash flow and ability to pay distributions could be impacted.
Interest Rate Risk
At December 31, 2012, the Company had long-term debt outstanding under its Credit Facility of approximately $1.2 billion, which incurred interest at floating rates (see Note 6). A 1% increase in the London Interbank Offered Rate (“LIBOR”) would result in an estimated $12 million increase in annual interest expense.
At December 31, 2011, the Company had long-term debt outstanding under its Credit Facility of $940 million, which incurred interest at floating rates (see Note 6). A 1% increase in the London Interbank Offered Rate (“LIBOR”) would result in an estimated $9 million increase in annual interest expense.
Counterparty Credit Risk
The Company accounts for its commodity derivatives and, when applicable, its interest rate derivatives at fair value on a recurring basis (see Note 8). The fair value of these derivative financial instruments includes the impact of assumed credit risk adjustments, which are based on the Company’s and counterparties’ published credit ratings, public bond yield spreads and credit default swap spreads, as applicable.
At December 31, 2012, the average public bond yield spread utilized to estimate the impact of the Company’s credit risk on derivative liabilities was approximately 2.47%. A 1% increase in the average public bond yield spread would result in an estimated $131,000 increase in net income for the year ended December 31, 2012. At December 31, 2012, the credit default swap spreads utilized to estimate the impact of counterparties’ credit risk on derivative assets ranged between 0% and 3.22%. A 1% increase in each of the counterparties’ credit default swap spreads would result in an estimated $9 million decrease in net income for the year ended December 31, 2012.
At December 31, 2011, the average public bond yield spread utilized to estimate the impact of the Company’s credit risk on derivative liabilities was approximately 4.52%. A 1% increase in the average public bond yield spread would result in an estimated $100,000 increase in net income for the year ended December 31, 2011. At December 31, 2011, the credit default swap spreads utilized to estimate the impact of counterparties’ credit risk on derivative assets ranged between 0% and 4.99%. A 1% increase in each of the counterparties’ credit default swap spreads would result in an estimated $3 million decrease in net income for the year ended December 31, 2011.
69
Item 8. Financial Statements and Supplementary Data
INDEX TO CONSOLIDATED FINANCIAL STATEMENTS AND SUPPLEMENTARY DATA
Page | |
70
MANAGEMENT’S REPORT ON INTERNAL CONTROL OVER FINANCIAL REPORTING
Our management is responsible for establishing and maintaining adequate internal control over financial reporting, as defined in Rules 13a-15(f) and 15d-15(f) of the Securities Exchange Act of 1934, as amended. Our internal control over financial reporting is a process designed under the supervision of our Chief Executive Officer and Chief Financial Officer to provide reasonable assurance regarding the reliability of financial reporting and the preparation of consolidated financial statements for external purposes in accordance with accounting principles generally accepted in the United States.
Because of its inherent limitations, internal control over financial reporting may not detect or prevent misstatements. Projections of any evaluation of the effectiveness to future periods are subject to risk that controls may become inadequate because of changes in conditions, or that the degree of compliance with the policies or processes may deteriorate.
As of December 31, 2012, our management assessed the effectiveness of the Company’s internal control over financial reporting based on the criteria for effective internal control over financial reporting established in Internal Control – Integrated Framework, issued by the Committee of Sponsoring Organizations of the Treadway Commission. Based on the assessment, management determined that we maintained effective internal control over financial reporting as of December 31, 2012, based on those criteria. KPMG LLP, the independent registered public accounting firm that audited the consolidated financial statements of the Company included in this Annual Report on Form 10-K, has issued an attestation report on the effectiveness of the Company’s internal control over financial reporting as of December 31, 2012, which is included herein.
/s/ Linn Energy, LLC
71
REPORT OF INDEPENDENT REGISTERED PUBLIC ACCOUNTING FIRM
The Board of Directors and Unitholders
Linn Energy, LLC:
We have audited the accompanying consolidated balance sheets of Linn Energy, LLC and subsidiaries as of December 31, 2012 and 2011, and the related consolidated statements of operations, unitholders’ capital, and cash flows for each of the years in the three-year period ended December 31, 2012. These consolidated financial statements are the responsibility of the Company’s management. Our responsibility is to express an opinion on these consolidated financial statements based on our audits.
We conducted our audits in accordance with the standards of the Public Company Accounting Oversight Board (United States). Those standards require that we plan and perform the audit to obtain reasonable assurance about whether the financial statements are free of material misstatement. An audit includes examining, on a test basis, evidence supporting the amounts and disclosures in the financial statements. An audit also includes assessing the accounting principles used and significant estimates made by management, as well as evaluating the overall financial statement presentation. We believe that our audits provide a reasonable basis for our opinion.
In our opinion, the consolidated financial statements referred to above present fairly, in all material respects, the financial position of Linn Energy, LLC and subsidiaries as of December 31, 2012 and 2011, and the results of their operations and their cash flows for each of the years in the three-year period ended December 31, 2012, in conformity with U.S. generally accepted accounting principles.
We also have audited, in accordance with the standards of the Public Company Accounting Oversight Board (United States), Linn Energy, LLC’s internal control over financial reporting as of December 31, 2012, based on criteria established in Internal Control–Integrated Framework issued by the Committee of Sponsoring Organizations of the Treadway Commission (COSO), and our report dated February 21, 2013, expressed an unqualified opinion on the effectiveness of the Company’s internal control over financial reporting.
/s/ KPMG LLP
Houston, Texas
February 21, 2013
72
REPORT OF INDEPENDENT REGISTERED PUBLIC ACCOUNTING FIRM
The Board of Directors and Unitholders
Linn Energy, LLC:
We have audited Linn Energy, LLC’s internal control over financial reporting as of December 31, 2012, based on criteria established in Internal Control–Integrated Framework issued by the Committee of Sponsoring Organizations of the Treadway Commission (COSO). Linn Energy, LLC’s management is responsible for maintaining effective internal control over financial reporting and for its assessment of the effectiveness of internal control over financial reporting, included in the accompanying Management’s Report on Internal Control Over Financial Reporting. Our responsibility is to express an opinion on the Company’s internal control over financial reporting based on our audit.
We conducted our audit in accordance with the standards of the Public Company Accounting Oversight Board (United States). Those standards require that we plan and perform the audit to obtain reasonable assurance about whether effective internal control over financial reporting was maintained in all material respects. Our audit included obtaining an understanding of internal control over financial reporting, assessing the risk that a material weakness exists, and testing and evaluating the design and operating effectiveness of internal control based on the assessed risk. Our audit also included performing such other procedures as we considered necessary in the circumstances. We believe that our audit provides a reasonable basis for our opinion.
A company’s internal control over financial reporting is a process designed to provide reasonable assurance regarding the reliability of financial reporting and the preparation of financial statements for external purposes in accordance with generally accepted accounting principles. A company’s internal control over financial reporting includes those policies and procedures that (1) pertain to the maintenance of records that, in reasonable detail, accurately and fairly reflect the transactions and dispositions of the assets of the company; (2) provide reasonable assurance that transactions are recorded as necessary to permit preparation of financial statements in accordance with generally accepted accounting principles, and that receipts and expenditures of the company are being made only in accordance with authorizations of management and directors of the company; and (3) provide reasonable assurance regarding prevention or timely detection of unauthorized acquisition, use, or disposition of the company’s assets that could have a material effect on the financial statements.
Because of its inherent limitations, internal control over financial reporting may not prevent or detect misstatements. Also, projections of any evaluation of effectiveness to future periods are subject to the risk that controls may become inadequate because of changes in conditions, or that the degree of compliance with the policies or procedures may deteriorate.
In our opinion, Linn Energy, LLC maintained, in all material respects, effective internal control over financial reporting as of December 31, 2012, based on criteria established in Internal Control–Integrated Framework issued by the Committee of Sponsoring Organizations of the Treadway Commission.
We also have audited, in accordance with the standards of the Public Company Accounting Oversight Board (United States), the consolidated balance sheets of Linn Energy, LLC and subsidiaries as of December 31, 2012 and 2011, and the related consolidated statements of operations, unitholders’ capital, and cash flows for each of the years in the three-year period ended December 31, 2012, and our report dated February 21, 2013, expressed an unqualified opinion on those consolidated financial statements.
/s/ KPMG LLP
Houston, Texas
February 21, 2013
73
Item 7A. Quantitative and Qualitative Disclosures About Market Risk - Continued
LINN ENERGY, LLC
CONSOLIDATED BALANCE SHEETS
December 31, | ||||||||
2012 | 2011 | |||||||
(in thousands, except unit amounts) | ||||||||
ASSETS | ||||||||
Current assets: | ||||||||
Cash and cash equivalents | $ | 1,243 | $ | 1,114 | ||||
Accounts receivable – trade, net | 371,333 | 213,282 | ||||||
Derivative instruments | 350,695 | 255,063 | ||||||
Other current assets | 88,157 | 80,734 | ||||||
Total current assets | 811,428 | 550,193 | ||||||
Noncurrent assets: | ||||||||
Oil and natural gas properties (successful efforts method) | 11,611,330 | 7,835,650 | ||||||
Less accumulated depletion and amortization | (2,025,656 | ) | (1,033,617 | ) | ||||
9,585,674 | 6,802,033 | |||||||
Other property and equipment | 469,188 | 197,235 | ||||||
Less accumulated depreciation | (73,721 | ) | (48,024 | ) | ||||
395,467 | 149,211 | |||||||
Derivative instruments | 530,216 | 321,840 | ||||||
Other noncurrent assets | 128,453 | 105,577 | ||||||
658,669 | 427,417 | |||||||
Total noncurrent assets | 10,639,810 | 7,378,661 | ||||||
Total assets | $ | 11,451,238 | $ | 7,928,854 | ||||
LIABILITIES AND UNITHOLDERS’ CAPITAL | ||||||||
Current liabilities: | ||||||||
Accounts payable and accrued expenses | $ | 707,861 | $ | 332,167 | ||||
Derivative instruments | 26 | 14,060 | ||||||
Other accrued liabilities | 115,245 | 75,898 | ||||||
Total current liabilities | 823,132 | 422,125 | ||||||
Noncurrent liabilities: | ||||||||
Credit facility | 1,180,000 | 940,000 | ||||||
Senior notes, net | 4,857,817 | 3,053,657 | ||||||
Derivative instruments | 4,114 | 3,503 | ||||||
Other noncurrent liabilities | 158,995 | 80,659 | ||||||
Total noncurrent liabilities | 6,200,926 | 4,077,819 | ||||||
Commitments and contingencies (Note 11) | ||||||||
Unitholders’ capital: | ||||||||
234,513,243 units and 177,364,558 units issued and outstanding at December 31, 2012, and December 31, 2011, respectively | 4,136,240 | 2,751,354 | ||||||
Accumulated income | 290,940 | 677,556 | ||||||
4,427,180 | 3,428,910 | |||||||
Total liabilities and unitholders’ capital | $ | 11,451,238 | $ | 7,928,854 | ||||
The accompanying notes are an integral part of these consolidated financial statements.
74
LINN ENERGY, LLC
CONSOLIDATED STATEMENTS OF OPERATIONS
Year Ended December 31, | ||||||||||||
2012 | 2011 | 2010 | ||||||||||
(in thousands, except per unit amounts) | ||||||||||||
Revenues and other: | ||||||||||||
Oil, natural gas and natural gas liquids sales | $ | 1,601,180 | $ | 1,162,037 | $ | 690,054 | ||||||
Gains on oil and natural gas derivatives | 124,762 | 449,940 | 75,211 | |||||||||
Marketing revenues | 37,393 | 5,868 | 3,966 | |||||||||
Other revenues | 10,905 | 4,609 | 3,049 | |||||||||
1,774,240 | 1,622,454 | 772,280 | ||||||||||
Expenses: | ||||||||||||
Lease operating expenses | 317,699 | 232,619 | 158,382 | |||||||||
Transportation expenses | 77,322 | 28,358 | 19,594 | |||||||||
Marketing expenses | 31,821 | 3,681 | 2,716 | |||||||||
General and administrative expenses | 173,206 | 133,272 | 99,078 | |||||||||
Exploration costs | 1,915 | 2,390 | 5,168 | |||||||||
Depreciation, depletion and amortization | 606,150 | 334,084 | 238,532 | |||||||||
Impairment of long-lived assets | 422,499 | — | 38,600 | |||||||||
Taxes, other than income taxes | 131,679 | 78,522 | 45,182 | |||||||||
Losses on sale of assets and other, net | 1,539 | 3,494 | 6,490 | |||||||||
1,763,830 | 816,420 | 613,742 | ||||||||||
Other income and (expenses): | ||||||||||||
Loss on extinguishment of debt | — | (94,612 | ) | — | ||||||||
Interest expense, net of amounts capitalized | (379,937 | ) | (259,725 | ) | (193,510 | ) | ||||||
Losses on interest rate swaps | — | — | (67,908 | ) | ||||||||
Other, net | (14,299 | ) | (7,792 | ) | (7,167 | ) | ||||||
(394,236 | ) | (362,129 | ) | (268,585 | ) | |||||||
Income (loss) before income taxes | (383,826 | ) | 443,905 | (110,047 | ) | |||||||
Income tax expense | 2,790 | 5,466 | 4,241 | |||||||||
Net income (loss) | $ | (386,616 | ) | $ | 438,439 | $ | (114,288 | ) | ||||
Net income (loss) per unit: | ||||||||||||
Basic | $ | (1.92 | ) | $ | 2.52 | $ | (0.80 | ) | ||||
Diluted | $ | (1.92 | ) | $ | 2.51 | $ | (0.80 | ) | ||||
Weighted average units outstanding: | ||||||||||||
Basic | 203,775 | 172,004 | 142,535 | |||||||||
Diluted | 203,775 | 172,729 | 142,535 | |||||||||
Distributions declared per unit | $ | 2.865 | $ | 2.70 | $ | 2.55 | ||||||
The accompanying notes are an integral part of these consolidated financial statements.
75
LINN ENERGY, LLC
CONSOLIDATED STATEMENTS OF UNITHOLDERS’ CAPITAL
Units | Unitholders’ Capital | Accumulated Income (Deficit) | Treasury Units (at Cost) | Total Unitholders’ Capital | |||||||||||||||
(in thousands) | |||||||||||||||||||
December 31, 2009 | 129,941 | $ | 2,098,599 | $ | 353,405 | $ | — | $ | 2,452,004 | ||||||||||
Sale of units, net of underwriting discounts and expenses of $34,556 | 28,750 | 809,774 | — | — | 809,774 | ||||||||||||||
Issuance of units | 815 | 4,418 | — | — | 4,418 | ||||||||||||||
Cancellation of units | (496 | ) | (11,832 | ) | — | 11,832 | — | ||||||||||||
Purchase of units | — | — | (11,832 | ) | (11,832 | ) | |||||||||||||
Distributions to unitholders | (365,711 | ) | — | — | (365,711 | ) | |||||||||||||
Unit-based compensation expenses | 13,792 | — | — | 13,792 | |||||||||||||||
Reclassification of distributions paid on forfeited restricted units | 59 | — | — | 59 | |||||||||||||||
Net loss | — | (114,288 | ) | — | (114,288 | ) | |||||||||||||
December 31, 2010 | 159,010 | 2,549,099 | 239,117 | — | 2,788,216 | ||||||||||||||
Sale of units, net of underwriting discounts and expenses of $27,427 | 17,514 | 651,522 | — | — | 651,522 | ||||||||||||||
Issuance of units | 1,371 | 7,446 | — | — | 7,446 | ||||||||||||||
Cancellation of units | (530 | ) | (17,352 | ) | — | 17,352 | — | ||||||||||||
Purchase of units | — | — | (17,352 | ) | (17,352 | ) | |||||||||||||
Distributions to unitholders | (466,488 | ) | — | — | (466,488 | ) | |||||||||||||
Unit-based compensation expenses | 22,243 | — | — | 22,243 | |||||||||||||||
Reclassification of distributions paid on forfeited restricted units | 79 | — | — | 79 | |||||||||||||||
Excess tax benefit from unit-based compensation | 4,805 | — | — | 4,805 | |||||||||||||||
Net income | — | 438,439 | — | 438,439 | |||||||||||||||
December 31, 2011 | 177,365 | 2,751,354 | 677,556 | — | 3,428,910 | ||||||||||||||
Sale of units, net of underwriting discounts and expenses of $32,044 | 55,877 | 1,942,045 | — | — | 1,942,045 | ||||||||||||||
Issuance of units | 1,271 | 7,061 | — | — | 7,061 | ||||||||||||||
Distributions to unitholders | (596,935 | ) | — | — | (596,935 | ) | |||||||||||||
Unit-based compensation expenses | 29,533 | — | — | 29,533 | |||||||||||||||
Reclassification of distributions paid on forfeited restricted units | 92 | — | — | 92 | |||||||||||||||
Excess tax benefit from unit-based compensation | 3,090 | — | — | 3,090 | |||||||||||||||
Net loss | — | (386,616 | ) | — | (386,616 | ) | |||||||||||||
December 31, 2012 | 234,513 | $ | 4,136,240 | $ | 290,940 | $ | — | $ | 4,427,180 | ||||||||||
The accompanying notes are an integral part of these consolidated financial statements.
76
LINN ENERGY, LLC
CONSOLIDATED STATEMENTS OF CASH FLOWS
Year Ended December 31, | ||||||||||||
2012 | 2011 | 2010 | ||||||||||
(in thousands) | ||||||||||||
Cash flow from operating activities: | ||||||||||||
Net income (loss) | $ | (386,616 | ) | $ | 438,439 | $ | (114,288 | ) | ||||
Adjustments to reconcile net income (loss) to net cash provided by operating activities: | ||||||||||||
Depreciation, depletion and amortization | 606,150 | 334,084 | 238,532 | |||||||||
Impairment of long-lived assets | 422,499 | — | 38,600 | |||||||||
Unit-based compensation expenses | 29,533 | 22,243 | 13,792 | |||||||||
Loss on extinguishment of debt | — | 94,612 | — | |||||||||
Amortization and write-off of deferred financing fees | 25,598 | 21,526 | 22,113 | |||||||||
Losses on sale of assets and other, net | 92 | 2,021 | 6,619 | |||||||||
Deferred income tax | (360 | ) | 310 | 3,088 | ||||||||
Mark-to-market on derivatives: | ||||||||||||
Total gains | (124,762 | ) | (449,940 | ) | (7,303 | ) | ||||||
Cash settlements | 390,765 | 237,134 | 302,875 | |||||||||
Cash settlements on canceled derivatives | — | 26,752 | (123,865 | ) | ||||||||
Premiums paid for derivatives | (583,434 | ) | (134,352 | ) | (120,376 | ) | ||||||
Changes in assets and liabilities: | ||||||||||||
Increase in accounts receivable – trade, net | (77,573 | ) | (191,338 | ) | (66,283 | ) | ||||||
(Increase) decrease in other assets | (5,451 | ) | (2,951 | ) | 2,926 | |||||||
Increase in accounts payable and accrued expenses | 26,372 | 129,499 | 25,457 | |||||||||
Increase (decrease) in other liabilities | 28,094 | (9,333 | ) | 49,031 | ||||||||
Net cash provided by operating activities | 350,907 | 518,706 | 270,918 | |||||||||
Cash flow from investing activities: | ||||||||||||
Acquisition of oil and natural gas properties, net of cash acquired | (2,640,475 | ) | (1,500,193 | ) | (1,351,033 | ) | ||||||
Development of oil and natural gas properties | (984,530 | ) | (574,635 | ) | (204,832 | ) | ||||||
Purchases of other property and equipment | (60,549 | ) | (55,229 | ) | (18,181 | ) | ||||||
Proceeds from sale of properties and equipment and other | 725 | (303 | ) | (7,362 | ) | |||||||
Net cash used in investing activities | (3,684,829 | ) | (2,130,360 | ) | (1,581,408 | ) | ||||||
Cash flow from financing activities: | ||||||||||||
Proceeds from sale of units | 1,973,989 | 678,949 | 844,330 | |||||||||
Proceeds from borrowings | 5,439,802 | 2,534,240 | 3,300,816 | |||||||||
Repayments of debt | (3,400,000 | ) | (1,301,029 | ) | (2,150,000 | ) | ||||||
Distributions to unitholders | (596,935 | ) | (466,488 | ) | (365,711 | ) | ||||||
Financing fees, offering expenses and other, net | (85,895 | ) | (56,358 | ) | (93,343 | ) | ||||||
Excess tax benefit from unit-based compensation | 3,090 | 4,805 | — | |||||||||
Purchase of units | — | (17,352 | ) | (11,832 | ) | |||||||
Net cash provided by financing activities | 3,334,051 | 1,376,767 | 1,524,260 | |||||||||
Net increase (decrease) in cash and cash equivalents | 129 | (234,887 | ) | 213,770 | ||||||||
Cash and cash equivalents: | ||||||||||||
Beginning | 1,114 | 236,001 | 22,231 | |||||||||
Ending | $ | 1,243 | $ | 1,114 | $ | 236,001 | ||||||
The accompanying notes are an integral part of these consolidated financial statements.
77
LINN ENERGY, LLC
NOTES TO CONSOLIDATED FINANCIAL STATEMENTS
Note 1 – Basis of Presentation and Significant Accounting Policies
Nature of Business
Linn Energy, LLC (“LINN Energy” or the “Company”) is an independent oil and natural gas company that began operations in March 2003 and was formed as a Delaware limited liability company in April 2005. The Company completed its initial public offering (“IPO”) in January 2006 and its units representing limited liability company interests (“units”) are listed on the NASDAQ Global Select Market under the symbol “LINE.” LINN Energy’s mission is to acquire, develop and maximize cash flow from a growing portfolio of long-life oil and natural gas assets.
The Company’s properties are located in the United States (“U.S.”), in the Mid-Continent, the Hugoton Basin, the Green River Basin, the Permian Basin, Michigan, Illinois, the Williston/Powder River Basin, California and east Texas. Effective January 1, 2012, the Company realigned its existing regions. The realignment had no effect on the Company’s operations. The Company added the East Texas region in May 2012 and the Green River Basin region in July 2012, and currently has eight operating regions in the U.S.: Mid-Continent, which includes properties in Oklahoma, Louisiana and the eastern portion of the Texas Panhandle (including the Granite Wash and Cleveland horizontal plays); Hugoton Basin, which includes properties located primarily in Kansas and the Shallow Texas Panhandle; Green River Basin, which includes properties located in southwest Wyoming; Permian Basin, which includes areas in west Texas and southeast New Mexico; Michigan/Illinois, which includes the Antrim Shale formation in the northern part of Michigan and oil properties in southern Illinois; Williston/Powder River Basin, which includes the Bakken formation in North Dakota and the Powder River Basin in Wyoming; California, which includes the Brea Olinda Field of the Los Angeles Basin; and East Texas, which includes properties located in east Texas.
The operations of the Company are governed by the provisions of a limited liability company agreement executed by and among its members. The agreement includes specific provisions with respect to the maintenance of the capital accounts of each of the Company’s unitholders. Pursuant to applicable provisions of the Delaware Limited Liability Company Act (the “Delaware Act”) and the Third Amended and Restated Limited Liability Company Agreement of Linn Energy, LLC (the “LLC Agreement”), unitholders have no liability for the debts, obligations and liabilities of the Company, except as expressly required in the LLC Agreement or the Delaware Act. The Company will remain in existence unless and until dissolved in accordance with the terms of the LLC Agreement.
Principles of Consolidation and Reporting
The Company presents its financial statements in accordance with U.S. generally accepted accounting principles (“GAAP”). The consolidated financial statements include the accounts of the Company and its wholly owned subsidiaries. All significant intercompany transactions and balances have been eliminated upon consolidation. Investments in noncontrolled entities over which the Company exercises significant influence are accounted for under the equity method. The Company’s other investment is carried at cost.
The consolidated financial statements for previous periods include certain reclassifications that were made to conform to current presentation. Such reclassifications have no impact on previously reported net income (loss), unitholders’ capital or cash flows.
Use of Estimates
The preparation of the accompanying consolidated financial statements in conformity with GAAP requires management of the Company to make estimates and assumptions about future events. These estimates and the underlying assumptions affect the amount of assets and liabilities reported, disclosures about contingent assets and liabilities, and reported amounts of revenues and expenses. The estimates that are particularly significant to the financial statements include estimates of the Company’s reserves of oil, natural gas and natural gas liquids (“NGL”), future cash flows from oil and natural gas properties, depreciation, depletion and amortization, asset retirement obligations, certain revenues and operating expenses, fair values of commodity and interest rate derivatives, if any, and fair values of assets acquired and liabilities assumed. As fair value is a market-based measurement, it is determined based on the assumptions that market participants would use. These estimates and assumptions are based on management’s best estimates and judgment. Management evaluates its estimates and assumptions on an ongoing basis using historical experience and other factors, including the current economic environment, which management believes to be reasonable under the circumstances. Such estimates and assumptions are adjusted when
78
facts and circumstances dictate. As future events and their effects cannot be determined with precision, actual results could differ from these estimates. Any changes in estimates resulting from continuous changes in the economic environment will be reflected in the financial statements in future periods.
Recently Issued Accounting Standards
In December 2011, the Financial Accounting Standards Board (“FASB”) issued an Accounting Standards Update (“ASU”) that requires an entity to disclose information about offsetting and related arrangements to enable users of its financial statements to understand the effect of those arrangements on its financial position. The ASU requires disclosure of both gross information and net information about both instruments and transactions eligible for offset in the statement of financial position and instruments and transactions subject to an agreement similar to a master netting arrangement. The ASU will be applied retrospectively and is effective for periods beginning on or after January 1, 2013. The Company is currently evaluating the impact, if any, of the adoption of this ASU on its consolidated financial statements and related disclosures.
In May 2011, the FASB issued an ASU that further addresses fair value measurement accounting and related disclosure requirements. The ASU clarifies the FASB’s intent regarding the application of existing fair value measurement and disclosure requirements, changes the fair value measurement requirements for certain financial instruments, and sets forth additional disclosure requirements for other fair value measurements. The ASU is to be applied prospectively and is effective for periods beginning after December 15, 2011. The Company adopted the ASU effective January 1, 2012. The adoption of the requirements of the ASU, which expanded disclosures, had no effect on the Company’s results of operations or financial position.
Cash Equivalents
For purposes of the consolidated statements of cash flows, the Company considers all highly liquid short-term investments with original maturities of three months or less to be cash equivalents. Outstanding checks in excess of funds on deposit are included in “accounts payable and accrued expenses” on the consolidated balance sheets and are classified as financing activities on the consolidated statements of cash flows.
Accounts Receivable – Trade, Net
Trade accounts receivable are recorded at the invoiced amount and do not bear interest. The Company maintains an allowance for doubtful accounts for estimated losses inherent in its accounts receivable portfolio. In establishing the required allowance, management considers historical losses, current receivables aging, and existing industry and national economic data. The Company reviews its allowance for doubtful accounts monthly. Past due balances over 90 days and over a specified amount are reviewed individually for collectibility. Account balances are charged off against the allowance after all means of collection have been exhausted and the potential recovery is remote. The balance in the Company’s allowance for doubtful accounts related to trade accounts receivable was approximately $450,000 at December 31, 2012, and $1 million at December 31, 2011.
Inventories
Materials, supplies and commodity inventories are valued at the lower of average cost or market.
Oil and Natural Gas Properties
Proved Properties
The Company accounts for oil and natural gas properties in accordance with the successful efforts method. In accordance with this method, all leasehold and development costs of proved properties are capitalized and amortized on a unit-of-production basis over the remaining life of the proved reserves and proved developed reserves, respectively.
The Company evaluates the impairment of its proved oil and natural gas properties on a field-by-field basis whenever events or changes in circumstances indicate that the carrying value may not be recoverable. The carrying values of proved properties are reduced to fair value when the expected undiscounted future cash flows are less than net book value. The fair values of proved properties are measured using valuation techniques consistent with the income approach, converting future cash flows to a single discounted amount. Significant inputs used to determine the fair values of proved properties include
79
estimates of: (i) reserves; (ii) future operating and development costs; (iii) future commodity prices; and (iv) a market-based weighted average cost of capital rate. The underlying commodity prices embedded in the Company’s estimated cash flows are the product of a process that begins with New York Mercantile Exchange (“NYMEX”) forward curve pricing, adjusted for estimated location and quality differentials, as well as other factors that Company management believes will impact realizable prices. Costs of retired, sold or abandoned properties that constitute a part of an amortization base are charged or credited, net of proceeds, to accumulated depreciation, depletion and amortization unless doing so significantly affects the unit-of-production amortization rate, in which case a gain or loss is recognized currently. Gains or losses from the disposal of other properties are recognized currently. Expenditures for maintenance and repairs necessary to maintain properties in operating condition are expensed as incurred. Estimated dismantlement and abandonment costs are capitalized, net of salvage, at their estimated net present value and amortized on a unit-of-production basis over the remaining life of the related proved developed reserves. The Company capitalizes interest on borrowed funds related to its share of costs associated with the drilling and completion of new oil and natural gas wells. Interest is capitalized only during the periods in which these assets are brought to their intended use. The Company capitalized interest costs of approximately $2 million for the years ended December 31, 2012, and December 31, 2011, and approximately $1 million for the year ended December 31, 2010.
Impairment of Proved Properties
Based on the analysis described above, the Company recorded noncash impairment charges, before and after tax, of approximately $422 million associated with proved oil and natural gas properties related to lower commodity prices for the year ended December 31, 2012, and a noncash impairment charge, before and after tax, of approximately $39 million primarily associated with proved oil and natural gas properties related to an unfavorable marketing contract for the year ended December 31, 2010. The Company recorded no impairment charge for the year ended December 31, 2011. The carrying values of the impaired proved properties were reduced to fair value, estimated using inputs characteristic of a Level 3 fair-value measurement. The charges are included in “impairment of long-lived assets” on the consolidated statements of operations.
Unproved Properties
Costs related to unproved properties include costs incurred to acquire unproved reserves. Because these reserves do not meet the definition of proved reserves, the related costs are not classified as proved properties. The fair values of unproved properties are measured using valuation techniques consistent with the income approach, converting future cash flows to a single discounted amount. Significant inputs used to determine the fair values of unproved properties include estimates of: (i) reserves; (ii) future operating and development costs; (iii) future commodity prices; and (iv) a market-based weighted average cost of capital rate. The market-based weighted average cost of capital rate is subjected to additional project-specific risking factors. Unproved leasehold costs are capitalized and amortized on a composite basis if individually insignificant, based on past success, experience and average lease-term lives. Individually significant leases are reclassified to proved properties if successful and expensed on a lease by lease basis if unsuccessful or the lease term expires. Unamortized leasehold costs related to successful exploratory drilling are reclassified to proved properties and depleted on a unit-of-production basis. The Company assesses unproved properties for impairment quarterly on the basis of its experience in similar situations and other factors such as the primary lease terms of the properties, the average holding period of unproved properties, and the relative proportion of such properties on which proved reserves have been found in the past.
Exploration Costs
Geological and geophysical costs, delay rentals, amortization and impairment of unproved leasehold costs and costs to drill exploratory wells that do not find proved reserves are expensed as exploration costs. The costs of any exploratory wells are carried as an asset if the well finds a sufficient quantity of reserves to justify its capitalization as a producing well and as long as the Company is making sufficient progress towards assessing the reserves and the economic and operating viability of the project. The Company recorded noncash leasehold impairment expenses related to unproved properties of approximately $2 million for the years ended December 31, 2012, and December 31, 2011, and approximately $5 million for the year ended December 31, 2010, which are included in “exploration costs” on the consolidated statements of operations.
Other Property and Equipment
Other property and equipment includes natural gas gathering systems, pipelines, buildings, software, data processing and telecommunications equipment, office furniture and equipment, and other fixed assets. These items are recorded at cost and are depreciated using the straight-line method based on expected lives ranging from three to 39 years for the individual asset or group of assets.
80
Revenue Recognition
Revenues representative of the Company’s ownership interest in its properties are presented on a gross basis on the consolidated statements of operations. Sales of oil, natural gas and NGL are recognized when the product has been delivered to a custody transfer point, persuasive evidence of a sales arrangement exists, the rights and responsibility of ownership pass to the purchaser upon delivery, collection of revenue from the sale is reasonably assured, and the sales price is fixed or determinable.
The Company has elected the entitlements method to account for natural gas production imbalances. Imbalances occur when the Company sells more or less than its entitled ownership percentage of total natural gas production. In accordance with the entitlements method, any amount received in excess of the Company’s share is treated as a liability. If the Company receives less than its entitled share, the underproduction is recorded as a receivable. At December 31, 2012, and December 31, 2011, the Company had natural gas production imbalance receivables of approximately $28 million and $19 million, respectively, which are included in “accounts receivable – trade, net” on the consolidated balance sheets and natural gas production imbalance payables of approximately $18 million and $9 million, respectively, which are included in “accounts payable and accrued expenses” on the consolidated balance sheets.
The Company engages in the purchase, gathering and transportation of third-party natural gas and subsequently markets such natural gas to independent purchasers under separate arrangements. As such, the Company separately reports third-party marketing sales and marketing expenses.
The Company generates electricity with excess natural gas, which it uses to serve certain of its operating facilities in Brea, California. Any excess electricity is sold to the California wholesale power market. This revenue is included in “other revenues” on the consolidated statements of operations.
Restricted Cash
Restricted cash of approximately $5 million and $4 million is included in “other noncurrent assets” on the consolidated balance sheets at December 31, 2012, and December 31, 2011, respectively, and represents cash the Company has deposited into a separate account and designated for asset retirement obligations in accordance with contractual agreements.
Derivative Instruments
The Company uses derivative financial instruments to reduce exposure to fluctuations in the prices of oil and natural gas. By removing a significant portion of the price volatility associated with future production, the Company expects to mitigate, but not eliminate, the potential effects of variability in cash flow from operations due to fluctuations in commodity prices. These transactions are primarily in the form of swap contracts and put options. In addition, the Company may from time to time enter into derivative contracts in the form of interest rate swaps to minimize the effects of fluctuations in interest rates. At December 31, 2012, the Company had no outstanding interest rate swap agreements.
Derivative instruments (including certain derivative instruments embedded in other contracts that require bifurcation) are recorded at fair value and included on the consolidated balance sheets as assets or liabilities. The Company did not designate these contracts as cash flow hedges; therefore, the changes in fair value of these instruments are recorded in current earnings. The Company uses certain pricing models to determine the fair value of its derivative financial instruments. Inputs to the pricing models include publicly available prices and forward price curves generated from a compilation of data gathered from third parties. Company management validates the data provided by third parties by understanding the pricing models used, obtaining market values from other pricing sources, analyzing pricing data in certain situations and confirming that those securities trade in active markets. See Note 7 and Note 8 for additional details about the Company’s derivative financial instruments.
Unit-Based Compensation
The Company recognizes expense for unit-based compensation over the requisite service period in an amount equal to the fair value of unit-based payments granted to employees and nonemployee directors. The fair value of unit-based payments, excluding liability awards, is computed at the date of grant and is not remeasured. The fair value of liability awards is
81
remeasured at each reporting date through the settlement date with the change in fair value recognized as compensation expense over that period. The Company currently does not have any awards accounted for as liability awards.
The Company has made a policy decision to recognize compensation expense for service-based awards on a straight-line basis over the requisite service period for the entire award. See Note 5 for additional details about the Company’s accounting for unit-based compensation.
The benefit of tax deductions in excess of recognized compensation costs is required to be reported as financing cash flow rather than operating cash flow. This requirement reduces net operating cash flow and increases net financing cash flow in periods in which such tax benefit exists. The amount of the Company’s excess tax benefit is reported in “excess tax benefit from unit-based compensation” on the consolidated statements of unitholders’ capital.
Deferred Financing Fees
The Company incurred legal and bank fees related to the issuance of debt (see Note 6). At December 31, 2012, and December 31, 2011, net deferred financing fees of approximately $114 million and $94 million, respectively, are included in “other noncurrent assets” on the consolidated balance sheets. These debt issuance costs are amortized over the life of the debt agreement. Upon early retirement or amendment to the debt agreement, certain fees are written off to expense. For the years ended December 31, 2012, December 31, 2011, and December 31, 2010, amortization expense of approximately $13 million, $16 million and $17 million, respectively, is included in “interest expense, net of amounts capitalized” and approximately $8 million, $1 million and $2 million, respectively, was written off to “other, net” on the consolidated statements of operations.
Fair Value of Financial Instruments
The carrying values of the Company’s receivables, payables and Credit Facility (as defined in Note 6) are estimated to be substantially the same as their fair values at December 31, 2012, and December 31, 2011. See Note 6 for fair value disclosures related to the Company’s other outstanding debt. As noted above, the Company carries its derivative financial instruments at fair value. See Note 8 for details about the fair value of the Company’s derivative financial instruments.
Income Taxes
The Company is a limited liability company treated as a partnership for federal and state income tax purposes, with the exception of the state of Texas, in which income tax liabilities and/or benefits of the Company are passed through to unitholders. As such, with the exception of the state of Texas, the Company is not a taxable entity, it does not directly pay federal and state income tax and recognition has not been given to federal and state income taxes for the operations of the Company except as described below.
Limited liability companies are subject to Texas margin tax. Limited liability companies were also subject to state income taxes in the state of Michigan during 2011 and 2010. In addition, certain of the Company’s subsidiaries are Subchapter C-corporations subject to federal and state income taxes, which are accounted for using the asset and liability method. Deferred tax assets and liabilities are recognized for the future tax consequences attributable to differences between the financial statement carrying amounts of existing assets and liabilities and their respective tax basis and operating loss and tax credit carryforwards. Deferred tax assets and liabilities are measured using enacted tax rates expected to apply to taxable income in the years in which those temporary differences are expected to be recovered or settled. The effect on deferred tax assets and liabilities of a change in tax rates is recognized in income in the period that includes the enactment date. See Note 14 for detail of amounts recorded in the consolidated financial statements.
Note 2 – Acquisitions
Acquisitions – 2012
On July 31, 2012, the Company completed the acquisition of certain oil and natural gas properties in the Jonah Field located in the Green River Basin of southwest Wyoming from BP America Production Company (“BP”). The Company paid approximately $990 million in total consideration for these properties. The transaction was financed with borrowings under the Company’s Credit Facility, as defined in Note 6.
82
On May 1, 2012, the Company completed the acquisition of certain oil and natural gas properties located in east Texas. The Company paid approximately $168 million in total consideration for these properties. The transaction was financed with borrowings under the Company’s Credit Facility.
On April 3, 2012, the Company entered into a joint-venture agreement (“JV Agreement”) with an affiliate of Anadarko Petroleum Corporation (“Anadarko”) whereby the Company participates as a partner in the CO2 enhanced oil recovery development of the Salt Creek Field, located in the Powder River Basin of Wyoming. Anadarko assigned the Company 23% of its interest in the field in exchange for future funding of $400 million of Anadarko’s development costs. The Company assigned approximately $392 million to the net assets acquired as of the JV Agreement date, which reflects an imputed discount of approximately $8 million on the future funding of this transaction. As of December 31, 2012, the Company has paid approximately $201 million towards the future funding commitment.
On March 30, 2012, the Company completed the acquisition of certain oil and natural gas properties and the Jayhawk natural gas processing plant located in the Hugoton Basin in Kansas from BP. The Company paid approximately $1.16 billion in total consideration for these properties. The transaction was financed primarily with proceeds from the March 2012 debt offering (see Note 6).
During 2012, the Company completed other smaller acquisitions of oil and natural gas properties located in its various operating regions. The Company, in the aggregate, paid approximately $122 million in total consideration for these properties.
These acquisitions were accounted for under the acquisition method of accounting. Accordingly, the Company conducted assessments of net assets acquired and recognized amounts for identifiable assets acquired and liabilities assumed at their estimated acquisition date fair values, while transaction and integration costs associated with the acquisitions were expensed as incurred. The initial accounting for the business combinations is not complete and adjustments to provisional amounts, or recognition of additional assets acquired or liabilities assumed, may occur as more detailed analyses are completed and additional information is obtained about the facts and circumstances that existed as of the acquisition dates. The results of operations of all acquisitions have been included in the consolidated financial statements since the acquisition or JV Agreement dates.
The following presents the values assigned to the net assets acquired as of the acquisition dates (in thousands):
Assets: | |||
Current | $ | 12,215 | |
Noncurrent | 210,390 | ||
Oil and natural gas properties | 2,701,385 | ||
Total assets acquired | $ | 2,923,990 | |
Liabilities: | |||
Current | $ | 223,114 | |
Asset retirement obligations | 63,663 | ||
Noncurrent | 196,601 | ||
Total liabilities assumed | $ | 483,378 | |
Net assets acquired | $ | 2,440,612 | |
Current assets include receivables and inventory and noncurrent assets include other property and equipment. Current liabilities include payables, ad valorem taxes payable and environmental liabilities. Current liabilities and noncurrent liabilities, as of the JV Agreement date, consist of payables of approximately $195 million and $197 million, respectively, related to the future funding commitment associated with the Anadarko transaction discussed above. As of December 31, 2012, the Company has paid approximately $201 million towards this commitment.
The fair value measurements of assets acquired and liabilities assumed are based on inputs that are not observable in the market and therefore represent Level 3 inputs. The fair values of oil and natural gas properties and asset retirement
83
obligations were measured using valuation techniques that convert future cash flows to a single discounted amount. Significant inputs to the valuation of oil and natural gas properties include estimates of: (i) reserves; (ii) future operating and development costs; (iii) future commodity prices; (iv) estimated future cash flows; and (v) a market-based weighted average cost of capital rate. These inputs require significant judgments and estimates by the Company’s management at the time of the valuation and are the most sensitive and subject to change.
The revenues and expenses related to certain properties acquired from BP, Plains Exploration & Production Company (“Plains”), Panther Energy Company, LLC and Red Willow Mid-Continent, LLC (collectively referred to as “Panther”), SandRidge Exploration and Production, LLC (“SandRidge”) and an affiliate of Concho Resources Inc. (“Concho”) are included in the consolidated results of operations of the Company as of July 31, 2012 (BP Green River Basin acquisition), March 30, 2012 (BP Hugoton Basin acquisition), December 15, 2011 (Plains acquisition), June 1, 2011 (Panther acquisition), April 1, 2011 (SandRidge acquisition), and March 31, 2011 (Concho acquisition). The following unaudited pro forma financial information presents a summary of the Company’s consolidated results of operations for the years ended December 31, 2012, and December 31, 2011, assuming the acquisitions from BP had been completed as of January 1, 2011, and the acquisitions from Plains, Panther, SandRidge and Concho had been completed as of January 1, 2010, including adjustments to reflect the values assigned to the net assets acquired. The pro forma financial information is not necessarily indicative of the results of operations if the acquisitions had been effective as of these dates.
Year Ended December 31, | ||||||||
2012 | 2011 | |||||||
(in thousands, except per unit amounts) | ||||||||
Total revenues and other | $ | 1,937,620 | $ | 2,422,381 | ||||
Total operating expenses | $ | 1,900,231 | $ | 1,293,283 | ||||
Net income (loss) | $ | (391,868 | ) | $ | 639,664 | |||
Net income (loss) per unit: | ||||||||
Basic | $ | (1.95 | ) | $ | 3.65 | |||
Diluted | $ | (1.95 | ) | $ | 3.64 | |||
Acquisitions – 2011 and 2010
The following is a summary of certain significant acquisitions completed by the Company during the years ended December 31, 2011, and December 31, 2010:
• | On December 15, 2011, the Company completed the acquisition of certain oil and natural gas properties located primarily in the Granite Wash of Texas and Oklahoma from Plains Exploration & Production Company for approximately $542 million. |
• | On November 1, 2011, and November 18, 2011, the Company completed two acquisitions of certain oil and natural gas properties located in the Permian Basin for approximately $110 million. |
• | On June 1, 2011, the Company completed the acquisition of certain oil and natural gas properties in the Cleveland play, located in the Texas Panhandle, from Panther Energy Company, LLC and Red Willow Mid-Continent, LLC for approximately $224 million. |
• | On May 2, 2011, and May 11, 2011, the Company completed two acquisitions of certain oil and natural gas properties located in the Williston Basin for approximately $153 million. |
• | On April 1, 2011, and April 5, 2011, the Company completed two acquisitions of certain oil and natural gas properties located in the Permian Basin, including properties from SandRidge Exploration and Production, LLC for approximately $239 million. |
• | On March 31, 2011, the Company completed the acquisition of certain oil and natural gas properties located in the Williston Basin from an affiliate of Concho Resources Inc. for approximately $192 million. |
84
• | On November 16, 2010, the Company completed the acquisition of certain oil and natural gas properties located in the Wolfberry trend of the Permian Basin from Element Petroleum, LP for approximately $118 million. |
• | On October 14, 2010, the Company completed two acquisitions of certain oil and natural gas properties located in the Wolfberry trend of the Permian Basin from Crownrock, LP and Patriot Resources Partners LLC for approximately $260 million. |
• | On August 16, 2010, the Company completed the acquisition of certain oil and natural gas properties located in the Permian Basin from Crownrock, LP and Element Petroleum, LP for approximately $95 million. |
• | On May 27, 2010, the Company completed the acquisition of interests in Henry Savings LP and Henry Savings Management LLC that primarily hold oil and natural gas properties located in the Permian Basin for approximately $323 million. |
• | On April 30, 2010, the Company completed the acquisition of interests in two wholly owned subsidiaries of HighMount Exploration & Production LLC that hold oil and natural gas properties in the Antrim Shale located in northern Michigan for approximately $327 million. |
• | On January 29, 2010, the Company completed the acquisition of certain oil and natural gas properties located in the Anadarko Basin in Oklahoma and Kansas and the Permian Basin in Texas and New Mexico from certain affiliates of Merit Energy Company for approximately $151 million. |
Note 3 – Unitholders’ Capital
LinnCo Initial Public Offering
On October 17, 2012, LinnCo, LLC (“LinnCo”), an affiliate of LINN Energy, completed its initial public offering (the “LinnCo IPO”) of 34,787,500 common shares representing limited liability company interests to the public at a price of $36.50 per share ($34.858 per share, net of underwriting discount and structuring fee) for net proceeds of approximately $1.2 billion (after underwriting discount and structuring fee of approximately $57 million). The net proceeds LinnCo received from the offering were used to acquire 34,787,500 LINN Energy units which are equal to the number of LinnCo shares sold in the offering. The Company used the proceeds from the sale of the units to LinnCo to pay the expenses of the offering and repay a portion of the outstanding indebtedness under its Credit Facility.
Public Offering of Units
In January 2012, the Company sold 19,550,000 units representing limited liability company interests at $35.95 per unit ($34.512 per unit, net of underwriting discount) for net proceeds of approximately $674 million (after underwriting discount and offering expenses of approximately $28 million). The Company used the net proceeds from the sale of these units to repay a portion of the outstanding indebtedness under its Credit Facility.
In March 2011, the Company sold 16,726,067 units representing limited liability company interests at $38.80 per unit ($37.248 per unit, net of underwriting discount) for net proceeds of approximately $623 million (after underwriting discount and offering expenses of approximately $26 million). The Company used a portion of the net proceeds from the sale of these units to fund the March 2011 redemptions of a portion of the outstanding 2017 Senior Notes and 2018 Senior Notes and to fund the cash tender offers and related expenses for a portion of the remaining 2017 Senior Notes and 2018 Senior Notes (see Note 6). The Company used the remaining net proceeds from the sale of units to finance a portion of the March 31, 2011, acquisition in the Williston/Powder Basin region.
In December 2010, the Company sold 11,500,000 units representing limited liability company interests at $35.92 per unit ($34.48 per unit, net of underwriting discount) for net proceeds of approximately $396 million (after underwriting discount and offering expenses of approximately $17 million). The Company used the net proceeds from the sale of these units to repay all outstanding indebtedness under its Credit Facility and for other general corporate purposes, including the partial notes redemption (see Note 6).
In March 2010, the Company sold 17,250,000 units representing limited liability company interests at $25.00 per unit ($24.00 per unit, net of underwriting discount) for net proceeds of approximately $414 million (after underwriting discount and offering expenses of approximately $17 million). The Company used a portion of the net proceeds from the sale of these units to finance the HighMount acquisition.
85
Equity Distribution Agreement
In August 2011, the Company entered into an equity distribution agreement, pursuant to which it may from time to time issue and sell units representing limited liability company interests having an aggregate offering price of up to $500 million. In connection with entering into the agreement, the Company incurred expenses of approximately $423,000. Sales of units, if any, will be made through a sales agent by means of ordinary brokers’ transactions, in block transactions, or as otherwise agreed with the agent. The Company expects to use the net proceeds from any sale of the units for general corporate purposes, which may include, among other things, capital expenditures, acquisitions and the repayment of debt.
In January 2012, the Company, under its equity distribution agreement, issued and sold 1,539,651 units representing limited liability company interests at an average unit price of $38.02 for proceeds of approximately $57 million (net of approximately $1 million in commissions). In connection with the issue and sale of these units, the Company also incurred professional service expenses of approximately $700,000. The Company used the net proceeds for general corporate purposes, including the repayment of a portion of the indebtedness outstanding under its Credit Facility. At December 31, 2012, units equaling approximately $411 million in aggregate offering price remained available to be issued and sold under the agreement.
In September 2011, the Company, under its equity distribution agreement, issued and sold 16,060 units representing limited liability company interests at an average unit price of $38.25 for proceeds of approximately $602,000 (net of approximately $12,000 in commissions). In December 2011, the Company issued and sold 772,104 units representing limited liability company interests at an average unit price of $38.03 for proceeds of approximately $29 million (net of approximately $587,000 in commissions). In connection with the issue and sale of these units, the Company also incurred professional service expenses of approximately $139,000. The Company used the net proceeds for general corporate purposes, including the repayment of a portion of the indebtedness outstanding under its Credit Facility.
Unit Repurchase Plan
In October 2008, the Board of Directors of the Company authorized the repurchase of up to $100 million of the Company’s outstanding units from time to time on the open market or in negotiated purchases. During the year ended December 31, 2011, 529,734 units were repurchased at an average unit price of $32.76 for a total cost of approximately $17 million. During the year ended December 31, 2010, 486,700 units were repurchased at an average unit price of $23.79 for a total cost of approximately $12 million. All units were subsequently canceled.
No units were repurchased by the Company during the year ended December 31, 2012. At December 31, 2012, approximately $56 million was available for unit repurchase under the program. The timing and amounts of any such repurchases are at the discretion of management, subject to market conditions and other factors, and in accordance with applicable securities laws and other legal requirements. The repurchase plan does not obligate the Company to acquire any specific number of units and may be discontinued at any time. Units are repurchased at fair market value on the date of repurchase.
Other Issuance and Cancellation of Units
During the year ended December 31, 2010, the Company purchased 9,055 units for approximately $300,000 in conjunction with units received by the Company for the payment of minimum withholding taxes due on units issued under its equity compensation plan (see Note 5). All units were subsequently canceled. The Company purchased no units for this purpose during the years ended December 31, 2012, and December 31, 2011.
Distributions
Under the LLC Agreement, Company unitholders are entitled to receive a quarterly distribution of available cash to the extent there is sufficient cash from operations after establishment of cash reserves and payment of fees and expenses. Distributions paid by the Company are presented on the consolidated statements of unitholders’ capital. On January 24, 2013, the Company’s Board of Directors declared a cash distribution of $0.725 per unit with respect to the fourth quarter of 2012. The distribution, totaling approximately $170 million, was paid on February 14, 2013, to unitholders of record as of the close of business on February 7, 2013.
86
Note 4 – Business and Credit Concentrations
Cash
The Company maintains its cash in bank deposit accounts which at times may exceed federally insured amounts. The Company has not experienced any losses in such accounts. The Company believes it is not exposed to any significant credit risk on its cash.
Revenue and Trade Receivables
The Company has a concentration of customers who are engaged in oil and natural gas purchasing, transportation and/or refining within the U.S. This concentration of customers may impact the Company’s overall exposure to credit risk, either positively or negatively, in that the customers may be similarly affected by changes in economic or other conditions. The Company’s customers consist primarily of major oil and natural gas purchasers and the Company generally does not require collateral since it has not experienced significant credit losses on such sales. The Company routinely assesses the recoverability of all material trade and other receivables to determine collectibility (see Note 1).
For the year ended December 31, 2012, the Company’s two largest customers represented approximately 12% and 11%, respectively, of the Company’s sales. For the year ended December 31, 2011, the Company’s three largest customers represented approximately 13%, 10% and 10%, respectively, of the Company’s sales. For the year ended December 31, 2010, the Company’s three largest customers represented approximately 17%, 14% and 13%, respectively, of the Company’s sales.
At December 31, 2012, trade accounts receivable from two customers represented approximately 21% and 11%, respectively, of the Company’s receivables. At December 31, 2011, trade accounts receivable from three customers represented approximately 12%, 10% and 10%, respectively, of the Company’s receivables.
Note 5 – Unit-Based Compensation and Other Benefit Plans
Incentive Plan Summary
The Linn Energy, LLC Amended and Restated Long-Term Incentive Plan, as amended (the “Plan”), originally became effective in December 2005. The Plan, which is administered by the Compensation Committee of the Board of Directors (“Compensation Committee”), permits granting unit grants, unit options, restricted units, phantom units and unit appreciation rights to employees, consultants and nonemployee directors under the terms of the Plan. The unit options and restricted units vest ratably over three years. The contractual life of unit options is 10 years.
The Plan limits the number of units that may be delivered pursuant to awards to 12.2 million units. The Board of Directors and the Compensation Committee have the right to alter or amend the Plan or any part of the Plan from time to time, including increasing the number of units that may be granted, subject to unitholder approval as required by the exchange upon which the units are listed at that time. However, no change in any outstanding grant may be made that would materially reduce the benefits to the participant without the consent of the participant.
Upon exercise or vesting of an award of units, or an award settled in units, the Company will issue new units, acquire units on the open market or directly from any person, or use any combination of the foregoing, at the Compensation Committee’s discretion. If the Company issues new units upon exercise or vesting of an award, the total number of units outstanding will increase. To date, the Company has issued awards of unit grants, unit options, restricted units and phantom units. The Plan provides for all of the following types of awards:
Unit Grants – A unit grant is a unit that vests immediately upon issuance.
Unit Options – A unit option is a right to purchase a unit at a specified price at terms determined by the Compensation Committee. Unit options will have an exercise price that will not be less than the fair market value of the units on the date of grant, and in general, will become exercisable over a vesting period but may accelerate upon a change in control of the Company. If a grantee’s employment or service relationship terminates for any reason
87
other than death, the grantee’s unvested unit options will be automatically forfeited unless the option agreement or the Compensation Committee provides otherwise.
Restricted Units – A restricted unit is a unit that vests over a period of time and that during such time is subject to forfeiture, and may contain such terms as the Compensation Committee shall determine. The Company intends the restricted units under the Plan to serve as a means of incentive compensation for performance and not primarily as an opportunity to participate in the equity appreciation of its units. Therefore, Plan participants will not pay any consideration for the restricted units they receive. If a grantee’s employment or service relationship terminates for any reason other than death, the grantee’s unvested restricted units will be automatically forfeited unless the Compensation Committee or the terms of the award agreement provide otherwise.
Phantom Units/Unit Appreciation Rights – These awards may be settled in units, cash or a combination thereof. Such grants contain terms as determined by the Compensation Committee, including the period or terms over which phantom units vest. If a grantee’s employment or service relationship terminates for any reason other than death or retirement, the grantee’s phantom units or unit appreciation rights will be automatically forfeited unless, and to the extent, the Compensation Committee or the terms of the award agreement provide otherwise. Upon death or retirement, as defined in the Plan, a participant’s phantom units vest in full unless the terms of the award agreement provide otherwise. While phantom units require no payment from the grantee, unit appreciation rights will have an exercise price that will not be less than the fair market value of the units on the date of grant. At December 31, 2012, the Company had 36,784 phantom units issued and outstanding. To date, the Company has not issued unit appreciation rights.
Securities Authorized for Issuance Under the Plan
As of December 31, 2012, approximately 4.6 million units were issuable under the Plan pursuant to outstanding award or other agreements, and 769,316 additional units were reserved for future issuance under the Plan.
Accounting for Unit-Based Compensation
The Company recognizes as expense, beginning at the grant date, the fair value of unit options and other equity-based compensation issued to employees and nonemployee directors. The value of the portion of the award that is ultimately expected to vest is recognized as expense over the requisite service period using the straight-line method in the Company’s consolidated statements of operations. A summary of unit-based compensation expenses included on the consolidated statements of operations is presented below:
Year Ended December 31, | ||||||||||||
2012 | 2011 | 2010 | ||||||||||
(in thousands) | ||||||||||||
General and administrative expenses | $ | 27,641 | $ | 21,131 | $ | 13,450 | ||||||
Lease operating expenses | 1,892 | 1,112 | 342 | |||||||||
Total unit-based compensation expenses | $ | 29,533 | $ | 22,243 | $ | 13,792 | ||||||
Income tax benefit | $ | 10,912 | $ | 8,219 | $ | 5,096 | ||||||
88
Restricted/Unrestricted Units
The fair value of unrestricted unit grants and restricted units issued is determined based on the fair market value of the Company units on the date of grant. A summary of the status of the nonvested units as of December 31, 2012, is presented below:
Number of Nonvested Units | Weighted Average Grant-Date Fair Value | ||||||
Nonvested units at December 31, 2011 | 1,859,662 | $ | 31.54 | ||||
Granted | 1,046,590 | $ | 37.42 | ||||
Vested | (875,877 | ) | $ | 27.20 | |||
Forfeited | (77,244 | ) | $ | 34.34 | |||
Nonvested units at December 31, 2012 | 1,953,131 | $ | 36.16 | ||||
The weighted average grant-date fair value of unrestricted unit grants and restricted units granted was $38.54 and $25.89 during the years ended December 31, 2011, and December 31, 2010, respectively. The total fair value of units that vested was approximately $24 million, $13 million and $14 million for the years ended December 31, 2012, December 31, 2011, and December 31, 2010, respectively. As of December 31, 2012, there was approximately $35 million of unrecognized compensation cost related to nonvested restricted units. The cost is expected to be recognized over a weighted average period of approximately 1.6 years .
In January 2013, the Company granted 612,240 restricted units and 105,530 phantom units as part of its annual review of its nonexecutive employees’ compensation.
Changes in Unit Options and Unit Options Outstanding
The following provides information related to unit option activity for the year ended December 31, 2012:
Number of Units Underlying Options | Weighted Average Exercise Price Per Unit | Weighted Average Remaining Contractual Life in Years | Aggregate Intrinsic Value in Millions | ||||||||||
Outstanding at December 31, 2011 | 1,409,993 | $ | 22.14 | 5.83 | $ | 22 | |||||||
Granted | 3,400,000 | $ | 40.01 | ||||||||||
Exercised | (167,188 | ) | $ | 21.65 | |||||||||
Outstanding at December 31, 2012 | 4,642,805 | $ | 35.25 | 6.28 | $ | 16 | |||||||
Exercisable at December 31, 2012 | 1,242,805 | $ | 22.21 | 4.93 | $ | 16 | |||||||
During the year ended December 31, 2012, the weighted average grant-date fair value of unit options granted was $5.31. No unit options were granted during the years ended December 31, 2011, or December 31, 2010. The total intrinsic value of unit options exercised was approximately $3 million, $5 million and $2 million, during the years ended December 31, 2012, December 31, 2011, and December 31, 2010, respectively. The Company received approximately $4 million from the exercise of unit options during the year ended December 31, 2012. No unit options expired during the years ended December 31, 2012, December 31, 2011, or December 31, 2010. As of December 31, 2012, total unrecognized compensation cost related to nonvested unit options was approximately $15 million. The cost is expected to be recognized over a weighted average period of approximately 3.1 years.
89
The fair value of unit-based compensation for unit options was estimated on the date of grant using a Black-Scholes pricing model based on certain assumptions. That value may not be indicative of the fair value observed in a willing buyer/willing seller market transaction. The Company’s determination of the fair value of unit-based payment awards is affected by the Company’s unit price as well as assumptions regarding a number of complex and subjective variables. The Company’s employee unit options have various restrictions including vesting provisions and restrictions on transfers and hedging, among others, and often are expected to be exercised prior to their contractual maturity.
Expected volatilities used in the estimation of fair value of the 2012 unit option grants have been determined using available volatility data for the Company. Expected volatilities used in the estimation of fair value of unit options granted in previous years were determined using available volatility data for the Company as well as an average of volatility computations of other identified peer companies in the oil and natural gas industry. Expected distributions are estimated based on the Company’s distribution rate at the date of grant. Forfeitures are estimated using historical Company data and are revised, if necessary, in subsequent periods if actual forfeitures differ from estimates. The risk-free rate for periods within the expected term of the unit option is based on the U.S. Treasury yield curve in effect at the time of grant. Historical data of the Company is used to estimate expected term. All employees granted awards have been determined to have similar behaviors for purposes of determining the expected term used to estimate fair value. The fair values of the 2012 unit option grants were based upon the following assumptions:
2012 | |||
Expected volatility | 34.10 | % | |
Expected distributions | 7.25 | % | |
Risk-free rate | 0.67 | % | |
Expected term | 5 years | ||
Nonemployee Grants
In 2007, the Company granted an aggregate 150,000 unit warrants to certain individuals in connection with an acquisition transition services agreement. The unit warrants, 15,000 of which remain outstanding, have an exercise price of $25.50 per unit warrant, are fully exercisable at December 31, 2012, and expire 10 years from the date of issuance. During the year ended December 31, 2012, 135,000 unit warrants were exercised, and the Company received approximately $3 million from these exercises.
Defined Contribution Plan
The Company sponsors a 401(k) defined contribution plan for eligible employees. Company contributions to the 401(k) plan consist of a discretionary matching contribution equal to 100% of the first 6% of eligible compensation contributed by the employee on a before-tax basis. The Company contributed approximately $5 million, $4 million and $3 million during the years ended December 31, 2012, December 31, 2011, and December 31, 2010, respectively, to the 401(k) plan’s trustee account. The 401(k) plan funds are held in a trustee account on behalf of the plan participants.
90
Note 6 – Debt
The following summarizes debt outstanding:
December 31, 2012 | December 31, 2011 | |||||||||||||||
Carrying Value | Fair Value (1) | Carrying Value | Fair Value (1) | |||||||||||||
(in millions, except percentages) | ||||||||||||||||
Credit facility (2) | $ | 1,180 | $ | 1,180 | $ | 940 | $ | 940 | ||||||||
11.75% senior notes due 2017 | 41 | 44 | 41 | 46 | ||||||||||||
9.875% senior notes due 2018 | 14 | 15 | 14 | 16 | ||||||||||||
6.50% senior notes due May 2019 | 750 | 755 | 750 | 742 | ||||||||||||
6.25% senior notes due November 2019 | 1,800 | 1,802 | — | — | ||||||||||||
8.625% senior notes due 2020 | 1,300 | 1,414 | 1,300 | 1,406 | ||||||||||||
7.75% senior notes due 2021 | 1,000 | 1,061 | 1,000 | 1,036 | ||||||||||||
Less current maturities | — | — | — | — | ||||||||||||
6,085 | $ | 6,271 | 4,045 | $ | 4,186 | |||||||||||
Unamortized discount | (47 | ) | (51 | ) | ||||||||||||
Total debt, net of discount | $ | 6,038 | $ | 3,994 | ||||||||||||
(1) | The carrying value of the Credit Facility is estimated to be substantially the same as its fair value. Fair values of the senior notes were estimated based on prices quoted from third-party financial institutions. |
(2) | Variable interest rates of 1.97% and 2.57% at December 31, 2012, and December 31, 2011, respectively. |
Credit Facility
The Company’s Fifth Amended and Restated Credit Agreement (“Credit Facility”) provides for a revolving credit facility up to the lesser of: (i) the then-effective borrowing base and (ii) the maximum commitment amount. The Credit Facility has a borrowing base of $4.5 billion with a maximum commitment amount of $3.0 billion. The maturity date is April 2017. At December 31, 2012, the borrowing capacity under the Credit Facility was approximately $1.8 billion, which includes a $5 million reduction in availability for outstanding letters of credit.
During 2012, in connection with amendments to its Credit Facility, the Company incurred financing fees and expenses of approximately $12 million, which will be amortized over the life of the Credit Facility. Such amortized expenses are recorded in “interest expense, net of amounts capitalized” on the consolidated statements of operations.
Redetermination of the borrowing base under the Credit Facility, based primarily on reserve reports that reflect commodity prices at such time, occurs semi-annually, in April and October, as well as upon requested interim redeterminations, by the lenders at their sole discretion. The Company also has the right to request one additional borrowing base redetermination per year at its discretion, as well as the right to an additional redetermination each year in connection with certain acquisitions. Significant declines in commodity prices may result in a decrease in the borrowing base. The Company’s obligations under the Credit Facility are secured by mortgages on its and certain of its material subsidiaries’ oil and natural gas properties and other personal property as well as a pledge of all ownership interests in its direct and indirect material subsidiaries. The Company is required to maintain either: 1) mortgages on properties representing at least 80% of the total value of oil and natural gas properties included on the most recent reserve report, or 2) a Collateral Coverage Ratio of at least 2.5 to 1. Collateral Coverage Ratio is defined as the ratio of the present value of future cash flows from proved reserves from the currently mortgaged properties to the lesser of: (i) the then-effective borrowing base and (ii) the maximum commitment amount. Additionally, the obligations under the Credit Facility are guaranteed by all of the Company’s material subsidiaries and are required to be guaranteed by any future material subsidiaries.
91
At the Company’s election, interest on borrowings under the Credit Facility is determined by reference to either the London Interbank Offered Rate (“LIBOR”) plus an applicable margin between 1.5% and 2.5% per annum (depending on the then-current level of borrowings under the Credit Facility) or the alternate base rate (“ABR”) plus an applicable margin between 0.5% and 1.5% per annum (depending on the then-current level of borrowings under the Credit Facility). Interest is generally payable quarterly for loans bearing interest based on the ABR and at the end of the applicable interest period for loans bearing interest at LIBOR. The Company is required to pay a commitment fee to the lenders under the Credit Facility, which accrues at a rate per annum between 0.375% and 0.5% on the average daily unused amount of the lesser of: (i) the maximum commitment amount of the lenders and (ii) the then-effective borrowing base. The Company is in compliance with all financial and other covenants of the Credit Facility.
Senior Notes Due November 2019
On March 2, 2012, the Company issued $1.8 billion in aggregate principal amount of 6.25% senior notes due November 2019 (“November 2019 Senior Notes”) at a price of 99.989%. The November 2019 Senior Notes were sold to a group of initial purchasers and then resold to qualified institutional buyers, each in transactions exempt from the registration requirements of the Securities Act of 1933, as amended (the “Securities Act”). The Company received net proceeds of approximately $1.77 billion (after deducting the initial purchasers’ discount of $198,000 and offering expenses of approximately $29 million). The Company used the net proceeds to fund the BP acquisition (see Note 2). The remaining proceeds were used to repay indebtedness under the Company’s Credit Facility and for general corporate purposes. The financing fees and expenses of approximately $29 million incurred in connection with the November 2019 Senior Notes will be amortized over the life of the notes. Such amortized financing fees and expenses are recorded in “interest expense, net of amounts capitalized” on the consolidated statements of operations.
The November 2019 Senior Notes were issued under an indenture dated March 2, 2012 (“November 2019 Indenture”), mature November 1, 2019, and bear interest at 6.25%. Interest is payable semi-annually on May 1 and November 1, beginning November 1, 2012. The November 2019 Senior Notes are general unsecured senior obligations of the Company and are effectively junior in right of payment to any secured indebtedness of the Company to the extent of the collateral securing such indebtedness. Each of the Company’s material subsidiaries has guaranteed the November 2019 Senior Notes on a senior unsecured basis. The November 2019 Indenture provides that the Company may redeem: (i) on or prior to November 1, 2015, up to 35% of the aggregate principal amount of the November 2019 Senior Notes at a redemption price of 106.25% of the principal amount redeemed, plus accrued and unpaid interest, with the net cash proceeds of one or more equity offerings; (ii) prior to November 1, 2015, all or part of the November 2019 Senior Notes at a redemption price equal to the principal amount redeemed, plus a make-whole premium (as defined in the November 2019 Indenture) and accrued and unpaid interest; and (iii) on or after November 1, 2015, all or part of the November 2019 Senior Notes at a redemption price equal to 103.125%, and decreasing percentages thereafter, of the principal amount redeemed, plus accrued and unpaid interest. The November 2019 Indenture also provides that, if a change of control (as defined in the November 2019 Indenture) occurs, the holders have a right to require the Company to repurchase all or part of the November 2019 Senior Notes at a redemption price equal to 101%, plus accrued and unpaid interest.
The November 2019 Indenture contains covenants substantially similar to those under the Company’s May 2019 Senior Notes, 2010 Issued Senior Notes and Original Senior Notes, as defined below, that, among other things, limit the Company’s ability to: (i) pay distributions on, purchase or redeem the Company’s units or redeem its subordinated debt; (ii) make investments; (iii) incur or guarantee additional indebtedness or issue certain types of equity securities; (iv) create certain liens; (v) sell assets; (vi) consolidate, merge or transfer all or substantially all of the Company’s assets; (vii) enter into agreements that restrict distributions or other payments from the Company’s restricted subsidiaries to the Company; (viii) engage in transactions with affiliates; and (ix) create unrestricted subsidiaries. The Company is in compliance with all financial and other covenants of the November 2019 Senior Notes.
In connection with the issuance and sale of the November 2019 Senior Notes, the Company entered into a Registration Rights Agreement (“November 2019 Registration Rights Agreement”) with the initial purchasers. Under the November 2019 Registration Rights Agreement, the Company agreed to use its reasonable efforts to file with the Securities and Exchange Commission (“SEC”) and cause to become effective a registration statement relating to an offer to issue new notes having terms substantially identical to the November 2019 Senior Notes in exchange for outstanding November 2019 Senior Notes within 400 days after the notes were issued. In certain circumstances, the Company may be required to file a shelf registration statement to cover resales of the November 2019 Senior Notes. If the Company fails to satisfy these obligations, the Company may be required to pay additional interest to holders of the November 2019 Senior Notes under certain circumstances.
92
Senior Notes Due May 2019
On May 13, 2011, the Company issued $750 million in aggregate principal amount of 6.5% senior notes due 2019 (the “May 2019 Senior Notes”). The indentures related to the May 2019 Senior Notes contain redemption provisions and covenants that are substantially similar to those of the November 2019 Senior Notes. On May 8, 2012, the Company filed a registration statement on Form S-4 to register exchange notes that are also substantially similar to the November 2019 Senior Notes. On September 24, 2012, the registration statement was declared effective and the Company commenced an offer to exchange any and all of its $750 million outstanding principal amount of May 2019 Senior Notes for an equal amount of new May 2019 Senior Notes.
The terms of the new May 2019 Senior Notes are identical in all material respects to those of the outstanding May 2019 Senior Notes, except that the transfer restrictions, registration rights and additional interest provisions relating to the outstanding May 2019 Senior Notes do not apply to the new May 2019 Senior Notes. The exchange offer expired on October 23, 2012. Pursuant to the terms of the registration rights agreement entered into in connection with the May 2019 Senior Notes, the Company agreed to use its reasonable efforts to cause the registration statement relating to the new May 2019 Senior Notes to become effective within 400 days after the notes were issued. The effective date of the registration statement was past the deadline in the registration rights agreement, and therefore, the Company was required to pay additional interest of approximately $850,000 to holders of the May 2019 Senior Notes in November 2012.
Senior Notes Due 2020 and Senior Notes Due 2021
The Company has $1.3 billion in aggregate principal amount of 8.625% senior notes due 2020 (the “2020 Senior Notes”) and $1.0 billion in aggregate principal amount of 7.75% senior notes due 2021 (the “2021 Senior Notes,” and together with the 2020 Senior Notes, the “2010 Issued Senior Notes”). The indentures related to the 2010 Issued Senior Notes contain redemption provisions and covenants that are substantially similar to those of the November 2019 Senior Notes. However, in 2011, the Company caused the trustee to remove the restrictive legends from each of the 2010 Issued Senior Notes making them freely tradable (other than with respect to persons that are affiliates of the Company), thereby terminating the Company’s obligations under each of the registration rights agreements entered into in connection with the issuance of the 2010 Issued Senior Notes.
Senior Notes Due 2017 and Senior Notes Due 2018
The Company also has $41 million (originally $250 million) in aggregate principal amount of 11.75% senior notes due 2017 (the “2017 Senior Notes”) and $14 million (originally $256 million) in aggregate principal amount of 9.875% senior notes due 2018 (the “2018 Senior Notes” and together with the 2017 Senior Notes, the “Original Senior Notes”). The indentures related to the Original Senior Notes initially contained redemption provisions and covenants that were substantially similar to those of the November 2019 Senior Notes; however, in conjunction with the tender offers in 2011, the indentures were amended and most of the covenants and certain default provisions were eliminated. The amendments became effective upon the execution of the supplemental indentures to the indentures governing the Original Senior Notes.
In March 2011 and June 2011, in accordance with the indentures related to the Original Senior Notes, the Company redeemed and also repurchased through cash tender offers, a portion of the Original Senior Notes. In connection with the redemptions and cash tender offers of a portion of the Original Senior Notes, the Company recorded a loss on extinguishment of debt of approximately $95 million for the year ended December 31, 2011.
Note 7 – Derivatives
Commodity Derivatives
The Company utilizes derivative instruments to minimize the variability in cash flow due to commodity price movements. The Company has historically entered into derivative instruments such as swap contracts, put options and collars to economically hedge its forecasted oil, natural gas and NGL sales. The Company did not designate any of these contracts as cash flow hedges; therefore, the changes in fair value of these instruments are recorded in current earnings. See Note 8 for fair value disclosures about oil and natural gas commodity derivatives.
93
The following table summarizes derivative positions for the periods indicated as of December 31, 2012:
2013 | 2014 | 2015 | 2016 | 2017 | 2018 | |||||||||||||||||||
Natural gas positions: | ||||||||||||||||||||||||
Fixed price swaps: | ||||||||||||||||||||||||
Hedged volume (MMMBtu) | 87,290 | 97,401 | 118,041 | 121,841 | 120,122 | 36,500 | ||||||||||||||||||
Average price ($/MMBtu) | $ | 5.22 | $ | 5.25 | $ | 5.19 | $ | 4.20 | $ | 4.26 | $ | 5.00 | ||||||||||||
Puts: (1) | ||||||||||||||||||||||||
Hedged volume (MMMBtu) | 86,198 | 79,628 | 71,854 | 76,269 | 66,886 | — | ||||||||||||||||||
Average price ($/MMBtu) | $ | 5.37 | $ | 5.00 | $ | 5.00 | $ | 5.00 | $ | 4.88 | $ | — | ||||||||||||
Total: | ||||||||||||||||||||||||
Hedged volume (MMMBtu) | 173,488 | 177,029 | 189,895 | 198,110 | 187,008 | 36,500 | ||||||||||||||||||
Average price ($/MMBtu) | $ | 5.29 | $ | 5.14 | $ | 5.12 | $ | 4.51 | $ | 4.48 | $ | 5.00 | ||||||||||||
Oil positions: | ||||||||||||||||||||||||
Fixed price swaps: (2) | ||||||||||||||||||||||||
Hedged volume (MBbls) | 11,871 | 11,903 | 11,599 | 11,464 | 4,755 | — | ||||||||||||||||||
Average price ($/Bbl) | $ | 94.97 | $ | 92.92 | $ | 96.23 | $ | 90.56 | $ | 89.02 | $ | — | ||||||||||||
Puts: | ||||||||||||||||||||||||
Hedged volume (MBbls) | 3,105 | 3,960 | 3,426 | 3,271 | 384 | — | ||||||||||||||||||
Average price ($/Bbl) | $ | 97.86 | $ | 91.30 | $ | 90.00 | $ | 90.00 | $ | 90.00 | $ | — | ||||||||||||
Total: | ||||||||||||||||||||||||
Hedged volume (MBbls) | 14,976 | 15,863 | 15,025 | 14,735 | 5,139 | — | ||||||||||||||||||
Average price ($/Bbl) | $ | 95.57 | $ | 92.52 | $ | 94.81 | $ | 90.44 | $ | 89.10 | $ | — | ||||||||||||
Natural gas basis differential positions: (3) | ||||||||||||||||||||||||
Panhandle basis swaps: | ||||||||||||||||||||||||
Hedged volume (MMMBtu) | 77,800 | 79,388 | 87,162 | 19,764 | — | — | ||||||||||||||||||
Hedged differential ($/MMBtu) | $ | (0.56 | ) | $ | (0.33 | ) | $ | (0.33 | ) | $ | (0.31 | ) | $ | — | $ | — | ||||||||
NWPL - Rockies basis swaps: | ||||||||||||||||||||||||
Hedged volume (MMMBtu) | 34,785 | 36,026 | 38,362 | 39,199 | — | — | ||||||||||||||||||
Hedge differential ($/MMBtu) | $ | (0.20 | ) | $ | (0.20 | ) | $ | (0.20 | ) | $ | (0.20 | ) | $ | — | $ | — | ||||||||
MichCon basis swaps: | ||||||||||||||||||||||||
Hedged volume (MMMBtu) | 9,600 | 9,490 | 9,344 | — | — | — | ||||||||||||||||||
Hedged differential ($/MMBtu) | $ | 0.10 | $ | 0.08 | $ | 0.06 | $ | — | $ | — | $ | — | ||||||||||||
Houston Ship Channel basis swaps: | ||||||||||||||||||||||||
Hedged volume (MMMBtu) | 5,731 | 5,256 | 4,891 | 4,575 | — | — | ||||||||||||||||||
Hedged differential ($/MMBtu) | $ | (0.10 | ) | $ | (0.10 | ) | $ | (0.10 | ) | $ | (0.10 | ) | $ | — | $ | — | ||||||||
Permian basis swaps: | ||||||||||||||||||||||||
Hedged volume (MMMBtu) | 4,636 | 4,891 | 5,074 | — | — | — | ||||||||||||||||||
Hedged differential ($/MMBtu) | $ | (0.20 | ) | $ | (0.21 | ) | $ | (0.21 | ) | $ | — | $ | — | $ | — | |||||||||
Oil timing differential positions: | ||||||||||||||||||||||||
Trade month roll swaps: (4) | ||||||||||||||||||||||||
Hedged volume (MBbls) | 6,944 | 7,254 | 7,251 | 7,446 | 6,486 | — | ||||||||||||||||||
Hedged differential ($/Bbl) | $ | 0.22 | $ | 0.22 | $ | 0.24 | $ | 0.25 | $ | 0.25 | $ | — | ||||||||||||
(1) | Includes certain outstanding natural gas puts of approximately 10,570 MMMBtu for each of the years ending December 31, 2013, December 31, 2014, and December 31, 2015, and 10,599 MMMBtu for the year ending December 31, 2016, used to hedge revenues associated with NGL production. |
94
(2) | Includes certain outstanding fixed price oil swaps of approximately 5,384 MBbls which may be extended annually at a price of $100.00 per Bbl for each of the years ending December 31, 2017, and December 31, 2018, and $90.00 per Bbl for the year ending December 31, 2019, if the counterparties determine that the strike prices are in-the-money on a designated date in each respective preceding year. The extension for each year is exercisable without respect to the other years. |
(3) | Settle on the respective pricing index to hedge basis differential associated with natural gas production. |
(4) | The Company hedges the timing risk associated with the sales price of oil in the Mid-Continent, Hugoton Basin and Permian Basin regions. In these regions, the Company generally sells oil for the delivery month at a sales price based on the average NYMEX price of light crude oil during that month, plus an adjustment calculated as a spread between the weighted average prices of the delivery month, the next month and the following month during the period when the delivery month is prompt (the “trade month roll”). |
During the year ended December 31, 2012, the Company entered into commodity derivative contracts consisting of oil swaps for 2012 through 2017, natural gas swaps for 2012 through 2018, and oil and natural gas puts for 2012 through 2017 and paid premiums for put options of approximately $583 million. The Company also entered into natural gas basis swaps for 2012 through 2016 and trade month roll swaps for 2012 through 2017.
Settled derivatives on natural gas production for the year ended December 31, 2012, included volumes of 140,884 MMMBtu at an average contract price of $5.41 per MMBtu. Settled derivatives on oil production for the year ended December 31, 2012, included volumes of 11,289 MBbls at an average contract price of $97.61 per Bbl. Settled derivatives on natural gas production for the year ended December 31, 2011, included volumes of 64,457 MMMBtu at an average contract price of $8.24 per MMBtu. Settled derivatives on oil production for the year ended December 31, 2011, included volumes of 7,917 MBbls at an average contract price of $85.70 per Bbl. The natural gas derivatives are settled based on the closing price of NYMEX natural gas on the last trading day for the delivery month, which occurs on the third business day preceding the delivery month, or the relevant index prices of natural gas published in Inside FERC’s Gas Market Report on the first business day of the delivery month. The oil derivatives are settled based on the average closing price of NYMEX light crude oil for each day of the delivery month.
Interest Rate Swaps
The Company may from time to time enter into interest rate swap agreements based on LIBOR to minimize the effect of fluctuations in interest rates. If LIBOR is lower than the fixed rate in the contract, the Company is required to pay the counterparty the difference, and conversely, the counterparty is required to pay the Company if LIBOR is higher than the fixed rate in the contract. The Company does not designate interest rate swap agreements as cash flow hedges; therefore, the changes in fair value of these instruments are recorded in current earnings.
In 2010, the Company restructured its interest rate swap portfolio in conjunction with the repayments of all of the outstanding indebtedness under its Credit Facility with net proceeds from the issuances of the 2020 and 2021 Senior Notes (see Note 6). In connection with the repayments of borrowings under its Credit Facility with net proceeds from the issuances of the 2020 and 2021 Senior Notes, the Company canceled (before the contract settlement date) all of its interest rate swap agreements resulting in realized losses of approximately $124 million. At December 31, 2012, and December 31, 2011, the Company had no outstanding interest rate swap agreements.
95
Balance Sheet Presentation
The Company’s commodity derivatives and, when applicable, its interest rate swap derivatives are presented on a net basis in “derivative instruments” on the consolidated balance sheets. The following summarizes the fair value of derivatives outstanding on a gross basis:
December 31, | ||||||||
2012 | 2011 | |||||||
(in thousands) | ||||||||
Assets: | ||||||||
Commodity derivatives | $ | 1,282,390 | $ | 880,175 | ||||
Liabilities: | ||||||||
Commodity derivatives | $ | 405,619 | $ | 320,835 | ||||
By using derivative instruments to economically hedge exposures to changes in commodity prices and interest rates, when applicable, the Company exposes itself to credit risk and market risk. Credit risk is the failure of the counterparty to perform under the terms of the derivative contract. When the fair value of a derivative contract is positive, the counterparty owes the Company, which creates credit risk. The Company’s counterparties are current participants or affiliates of participants in its Credit Facility or were participants or affiliates of participants in its Credit Facility at the time it originally entered into the derivatives. The Credit Facility is secured by the Company’s oil and natural gas reserves; therefore, the Company is not required to post any collateral. The Company does not receive collateral from its counterparties. The maximum amount of loss due to credit risk that the Company would incur if its counterparties failed completely to perform according to the terms of the contracts, based on the gross fair value of financial instruments, was approximately $1.3 billion at December 31, 2012. The Company minimizes the credit risk in derivative instruments by: (i) limiting its exposure to any single counterparty; (ii) entering into derivative instruments only with counterparties that meet the Company’s minimum credit quality standard, or have a guarantee from an affiliate that meets the Company’s minimum credit quality standard; and (iii) monitoring the creditworthiness of the Company’s counterparties on an ongoing basis. In accordance with the Company’s standard practice, its commodity derivatives and, when applicable, its interest rate derivatives are subject to counterparty netting under agreements governing such derivatives and therefore the risk of loss is somewhat mitigated.
Gains (Losses) on Derivatives
Total gains and losses on derivatives, including realized and unrealized gains and losses, were approximately $125 million, $450 million and $7 million for the years ended December 31, 2012, December 31, 2011, and December 31, 2010, respectively, and are reported on the consolidated statements of operations in “gains on oil and natural gas derivatives” and “losses on interest rate swaps.”
Note 8 – Fair Value Measurements on a Recurring Basis
The Company accounts for its commodity derivatives and, when applicable, its interest rate derivatives at fair value (see Note 7) on a recurring basis. The Company uses certain pricing models to determine the fair value of its derivative financial instruments. Inputs to the pricing models include publicly available prices and forward price curves generated from a compilation of data gathered from third parties. Company management validates the data provided by third parties by understanding the pricing models used, obtaining market values from other pricing sources, analyzing pricing data in certain situations and confirming that those securities trade in active markets. Assumed credit risk adjustments, based on published credit ratings, public bond yield spreads and credit default swap spreads, are applied to the Company’s commodity derivatives and, when applicable, its interest rate derivatives.
96
Fair Value Hierarchy
In accordance with applicable accounting standards, the Company has categorized its financial instruments, based on the priority of inputs to the valuation technique, into a three-level fair value hierarchy. The fair value hierarchy gives the highest priority to quoted prices in active markets for identical assets or liabilities (Level 1) and the lowest priority to unobservable inputs (Level 3).
Financial assets and liabilities recorded on the consolidated balance sheets are categorized based on the inputs to the valuation techniques as follows:
Level 1 | Financial assets and liabilities for which values are based on unadjusted quoted prices for identical assets or liabilities in an active market that management has the ability to access. |
Level 2 | Financial assets and liabilities for which values are based on quoted prices in markets that are not active or model inputs that are observable either directly or indirectly for substantially the full term of the asset or liability (commodity derivatives and interest rate swaps). |
Level 3 | Financial assets and liabilities for which values are based on prices or valuation techniques that require inputs that are both unobservable and significant to the overall fair value measurement. These inputs reflect management’s own assumptions about the assumptions a market participant would use in pricing the asset or liability. |
When the inputs used to measure fair value fall within different levels of the hierarchy in a liquid environment, the level within which the fair value measurement is categorized is based on the lowest level input that is significant to the fair value measurement in its entirety. The Company conducts a review of fair value hierarchy classifications on a quarterly basis. Changes in the observability of valuation inputs may result in a reclassification for certain financial assets or liabilities.
The following presents the fair value hierarchy for assets and liabilities measured at fair value on a recurring basis:
Fair Value Measurements on a Recurring Basis December 31, 2012 | ||||||||||||
Level 2 | Netting (1) | Total | ||||||||||
(in thousands) | ||||||||||||
Assets: | ||||||||||||
Commodity derivatives | $ | 1,282,390 | $ | (401,479 | ) | $ | 880,911 | |||||
Liabilities: | ||||||||||||
Commodity derivatives | $ | 405,619 | $ | (401,479 | ) | $ | 4,140 | |||||
(1) | Represents counterparty netting under agreements governing such derivatives. |
97
Note 9 – Other Property and Equipment
Other property and equipment consists of the following:
December 31, | ||||||||
2012 | 2011 | |||||||
(in thousands) | ||||||||
Natural gas plant and pipeline | $ | 371,292 | $ | 129,863 | ||||
Buildings and leasehold improvements | 19,999 | 16,158 | ||||||
Vehicles | 19,731 | 13,653 | ||||||
Drilling and other equipment | 6,265 | 3,645 | ||||||
Furniture and office equipment | 47,623 | 29,972 | ||||||
Land | 4,278 | 3,944 | ||||||
469,188 | 197,235 | |||||||
Less accumulated depreciation | (73,721 | ) | (48,024 | ) | ||||
$ | 395,467 | $ | 149,211 | |||||
Note 10 – Asset Retirement Obligations
Asset retirement obligations associated with retiring tangible long-lived assets are recognized as a liability in the period in which a legal obligation is incurred and becomes determinable and are included in “other noncurrent liabilities” on the consolidated balance sheets. Accretion expense is included in “depreciation, depletion and amortization” on the consolidated statements of operations. The fair value of additions to the asset retirement obligations is estimated using valuation techniques that convert future cash flows to a single discounted amount. Significant inputs to the valuation include estimates of: (i) plug and abandon costs per well based on existing regulatory requirements; (ii) remaining life per well; (iii) future inflation factors (2.0% for each of the years in the three-year period ended December 31, 2012); and (iv) a credit-adjusted risk-free interest rate (average of 6.8%, 7.5% and 8.6% for the years ended December 31, 2012, December 31, 2011, and December 31, 2010, respectively). These inputs require significant judgments and estimates by the Company’s management at the time of the valuation and are the most sensitive and subject to change.
The following presents a reconciliation of the Company’s asset retirement obligations:
December 31, | ||||||||
2012 | 2011 | |||||||
(in thousands) | ||||||||
Asset retirement obligations at beginning of year | $ | 71,142 | $ | 42,945 | ||||
Liabilities added from acquisitions | 63,663 | 19,853 | ||||||
Liabilities added from drilling | 1,799 | 1,277 | ||||||
Current year accretion expense | 8,550 | 4,140 | ||||||
Settlements | (3,640 | ) | (2,218 | ) | ||||
Revision of estimates | 10,460 | 5,145 | ||||||
Asset retirement obligations at end of year | $ | 151,974 | $ | 71,142 | ||||
Note 11 – Commitments and Contingencies
The Company has been named as a defendant in a number of lawsuits, including claims from royalty owners related to disputed royalty payments and royalty valuations. The Company has established reserves that management currently believes are adequate to provide for potential liabilities based upon its evaluation of these matters. For a certain statewide class action royalty payment dispute where a reserve has not yet been established, the Company has denied that it has any liability on the claims and has raised arguments and defenses that, if accepted by the court, will result in no loss to the Company. Discovery related to class certification has concluded. Briefing and the hearing on class certification have been
98
deferred by court order pending the Tenth Circuit Court of Appeals’ resolution of interlocutory appeals of two unrelated class certification orders. As a result, the Company is unable to estimate a possible loss, or range of possible loss, if any. In addition, the Company is involved in various other disputes arising in the ordinary course of business. The Company is not currently a party to any litigation or pending claims that it believes would have a material adverse effect on its overall business, financial position, results of operations or liquidity; however, cash flow could be significantly impacted in the reporting periods in which such matters are resolved.
In 2008, Lehman Brothers Holdings Inc. and Lehman Brothers Commodity Services Inc. (together “Lehman”), filed voluntary petitions for reorganization under Chapter 11 of the U.S. Bankruptcy Code with the U.S. Bankruptcy Court for the Southern District of New York. In March 2011, the Company and Lehman entered into Termination Agreements under which the Company was granted general unsecured claims against Lehman in the amount of $51 million (the “Company Claim”). In December 2011, a Chapter 11 Plan (“Lehman Plan”) was approved by the Bankruptcy Court. Based on the recovery estimates described in the approved disclosure statement relating to the Lehman Plan, the Company expects to ultimately receive a substantial portion of the Company Claim. During 2012, the Company received approximately $28 million of the Company Claim under the Lehman Plan resulting in realized gains of approximately $22 million, which is included in “gains on oil and natural gas derivatives” on the consolidated statement of operations. Additional distributions may occur in the future.
Note 12 – Earnings Per Unit
Basic earnings per unit is computed by dividing net earnings attributable to unitholders by the weighted average number of units outstanding during each period. Diluted earnings per unit is computed by adjusting the average number of units outstanding for the dilutive effect, if any, of unit equivalents. The Company uses the treasury stock method to determine the dilutive effect.
99
The following table provides a reconciliation of the numerators and denominators of the basic and diluted per unit computations for net income (loss):
Net Income (Loss) (Numerator) | Units (Denominator) | Per Unit Amount | |||||||||
(in thousands) | |||||||||||
Year ended December 31, 2012: | |||||||||||
Net loss: | |||||||||||
Allocated to units | $ | (386,616 | ) | ||||||||
Allocated to unvested restricted units | (4,575 | ) | |||||||||
$ | (391,191 | ) | |||||||||
Net loss per unit: | |||||||||||
Basic net loss per unit | 203,775 | $ | (1.92 | ) | |||||||
Dilutive effect of unit equivalents | — | — | |||||||||
Diluted net loss per unit | 203,775 | $ | (1.92 | ) | |||||||
Year ended December 31, 2011: | |||||||||||
Net income: | |||||||||||
Allocated to units | $ | 438,439 | |||||||||
Allocated to unvested restricted units | (4,739 | ) | |||||||||
$ | 433,700 | ||||||||||
Net income per unit: | |||||||||||
Basic net income per unit | 172,004 | $ | 2.52 | ||||||||
Dilutive effect of unit equivalents | 725 | (0.01 | ) | ||||||||
Diluted net income per unit | 172,729 | $ | 2.51 | ||||||||
Year ended December 31, 2010: | |||||||||||
Net loss: | |||||||||||
Allocated to units | $ | (114,288 | ) | ||||||||
Allocated to unvested restricted units | — | ||||||||||
$ | (114,288 | ) | |||||||||
Net loss per unit: | |||||||||||
Basic net loss per unit | 142,535 | $ | (0.80 | ) | |||||||
Dilutive effect of unit equivalents | — | — | |||||||||
Diluted net loss per unit | 142,535 | $ | (0.80 | ) | |||||||
Basic units outstanding excludes the effect of weighted average anti-dilutive unit equivalents related to approximately 2 million unit options and warrants for each of the years ended December 31, 2012, and December 31, 2010. All equivalent units were anti-dilutive for the years ended December 31, 2012, and December 31, 2010, respectively. There were no anti-dilutive unit equivalents for the year ended December 31, 2011.
Note 13 – Operating Leases
The Company leases office space and other property and equipment under lease agreements expiring on various dates through 2019. The Company recognized expense under operating leases of approximately $7 million, $5 million and $5 million, for the years ended December 31, 2012, December 31, 2011, and December 31, 2010, respectively.
100
As of December 31, 2012, future minimum lease payments were as follows (in thousands):
2013 | $ | 6,459 | |
2014 | 6,718 | ||
2015 | 6,660 | ||
2016 | 4,396 | ||
2017 | 4,381 | ||
Thereafter | 8,761 | ||
$ | 37,375 | ||
Note 14 – Income Taxes
The Company is a limited liability company treated as a partnership for federal and state income tax purposes, with the exception of the state of Texas, in which income tax liabilities and/or benefits of the Company are passed through to its unitholders. Limited liability companies are subject to Texas margin tax. Limited liability companies were also subject to state income taxes in the state of Michigan during 2011 and 2010. In addition, certain of the Company’s subsidiaries are Subchapter C-corporations subject to federal and state income taxes. As such, with the exception of the state of Texas and certain subsidiaries, the Company is not a taxable entity, it does not directly pay federal and state income taxes and recognition has not been given to federal and state income taxes for the operations of the Company, except as set forth in the tables below. Amounts recognized for income taxes are reported in “income tax expense” on the consolidated statements of operations.
The Company’s taxable income or loss, which may vary substantially from the net income or net loss reported on the consolidated statements of operations, is includable in the federal and state income tax returns of each unitholder. The aggregate difference in the basis of net assets for financial and tax reporting purposes cannot be readily determined as the Company does not have access to information about each unitholder’s tax attributes.
Certain of the Company’s subsidiaries are Subchapter C-corporations subject to federal and state income taxes. Income tax expense (benefit) consisted of the following:
Year Ended December 31, | ||||||||||||
2012 | 2011 | 2010 | ||||||||||
(in thousands) | ||||||||||||
Current taxes: | ||||||||||||
Federal | $ | 2,711 | $ | 4,551 | $ | 65 | ||||||
State | 439 | 605 | 1,088 | |||||||||
Deferred taxes: | ||||||||||||
Federal | 323 | (1,148 | ) | 2,862 | ||||||||
State | (683 | ) | 1,458 | 226 | ||||||||
$ | 2,790 | $ | 5,466 | $ | 4,241 | |||||||
As of December 31, 2012, the Company’s taxable entities had approximately $10 million of net operating loss carryforwards for federal income tax purposes which will begin expiring in 2031.
101
A reconciliation of the federal statutory tax rate to the effective tax rate is as follows:
Year Ended December 31, | |||||||||
2012 | 2011 | 2010 | |||||||
Federal statutory rate | 35.0 | % | 35.0 | % | 35.0 | % | |||
State, net of federal tax benefit | 0.1 | 0.5 | (1.2 | ) | |||||
Loss excluded from nontaxable entities | (35.6 | ) | (34.4 | ) | (37.5 | ) | |||
Other items | (0.2 | ) | 0.1 | (0.1 | ) | ||||
Effective rate | (0.7 | )% | 1.2 | % | (3.8 | )% | |||
Significant components of the deferred tax assets and liabilities were as follows:
December 31, | ||||||||
2012 | 2011 | |||||||
(in thousands) | ||||||||
Deferred tax assets: | ||||||||
Net operating loss carryforwards | $ | — | $ | 159 | ||||
Unit-based compensation | 10,579 | 9,146 | ||||||
Other | 4,924 | 3,606 | ||||||
Total deferred tax assets | 15,503 | 12,911 | ||||||
Deferred tax liabilities: | ||||||||
Property and equipment principally due to differences in depreciation | (11,049 | ) | (8,226 | ) | ||||
Other | (1,055 | ) | (1,646 | ) | ||||
Total deferred tax liabilities | (12,104 | ) | (9,872 | ) | ||||
Net deferred tax assets | $ | 3,399 | $ | 3,039 | ||||
Net deferred tax assets and liabilities were classified on the consolidated balance sheets as follows:
December 31, | ||||||||
2012 | 2011 | |||||||
(in thousands) | ||||||||
Deferred tax assets | $ | 10,318 | $ | 8,279 | ||||
Deferred tax liabilities | (612 | ) | (589 | ) | ||||
Other current assets | $ | 9,706 | $ | 7,690 | ||||
Deferred tax assets | $ | 5,186 | $ | 4,632 | ||||
Deferred tax liabilities | (11,493 | ) | (9,283 | ) | ||||
Other noncurrent liabilities | $ | (6,307 | ) | $ | (4,651 | ) | ||
In assessing the realizability of deferred tax assets, management considers whether it is more likely than not that some portion or all of the deferred tax assets will not be realized. The ultimate realization of deferred tax assets is dependent upon the generation of future taxable income during the periods in which those temporary differences become deductible. Management considers the scheduled reversal of deferred tax liabilities, projected future taxable income and tax planning strategies in making this assessment. At December 31, 2012, based upon the level of historical taxable income and projections for future taxable income over the periods in which the deferred tax assets are deductible, management believes it is more likely than not that the Company will realize the benefits of these deductible differences. The amount of deferred tax assets considered realizable could be reduced in the future if estimates of future taxable income during the carryforward period are reduced.
102
In accordance with the applicable accounting standard, the Company recognizes only the impact of income tax positions that, based on their merits, are more likely than not to be sustained upon audit by a taxing authority. To evaluate its current tax positions in order to identify any material uncertain tax positions, the Company developed a policy of identifying and evaluating uncertain tax positions that considers support for each tax position, industry standards, tax return disclosures and schedules, and the significance of each position. It is the Company’s policy to recognize interest and penalties, if any, related to unrecognized tax benefits in income tax expense. The Company had no material uncertain tax positions at December 31, 2012, and December 31, 2011.
Note 15 – Supplemental Disclosures to the Consolidated Balance Sheets and Consolidated Statements of Cash Flows
“Other accrued liabilities” reported on the consolidated balance sheets include the following:
December 31, | ||||||||
2012 | 2011 | |||||||
(in thousands) | ||||||||
Accrued compensation | $ | 35,431 | $ | 19,581 | ||||
Accrued interest | 72,668 | 55,170 | ||||||
Other | 7,146 | 1,147 | ||||||
$ | 115,245 | $ | 75,898 | |||||
Supplemental disclosures to the consolidated statements of cash flows are presented below:
Year Ended December 31, | ||||||||||||
2012 | 2011 | 2010 | ||||||||||
(in thousands) | ||||||||||||
Cash payments for interest, net of amounts capitalized | $ | 343,331 | $ | 247,217 | $ | 128,807 | ||||||
Cash payments for income taxes | $ | 366 | $ | 487 | $ | 1,797 | ||||||
Noncash investing activities: | ||||||||||||
In connection with the acquisition of oil and natural gas properties, liabilities were assumed as follow: | ||||||||||||
Fair value of assets acquired | $ | 2,923,990 | $ | 1,523,466 | $ | 1,375,010 | ||||||
Cash paid, net of cash acquired | (2,640,475 | ) | (1,500,193 | ) | (1,351,033 | ) | ||||||
Receivable from seller | 2,132 | 3,557 | 9,976 | |||||||||
Payables to sellers | 443 | (4,847 | ) | — | ||||||||
Liabilities assumed | $ | 286,090 | $ | 21,983 | $ | 33,953 | ||||||
For purposes of the consolidated statements of cash flows, the Company considers all highly liquid short-term investments with original maturities of three months or less to be cash equivalents. Restricted cash of approximately $5 million and $4 million is included in “other noncurrent assets” on the consolidated balance sheets at December 31, 2012, and December 31, 2011, respectively, and represents cash deposited by the Company into a separate account and designated for asset retirement obligations in accordance with contractual agreements.
The Company manages its working capital and cash requirements to borrow only as needed from its Credit Facility. At December 31, 2012, and December 31, 2011, approximately $35 million and $54 million, respectively, were included in “accounts payable and accrued expenses” on the consolidated balance sheets which represent reclassified net outstanding checks. The Company presents these net outstanding checks as cash flows from financing activities on the consolidated statements of cash flows.
103
Note 16 - Related Party Transactions
LinnCo
LinnCo, an affiliate of LINN Energy, was formed on April 30, 2012, for the sole purpose of owning units in LINN Energy. LinnCo expects to have no significant assets or operations other than those related to its interest in LINN Energy. Upon the formation of LinnCo, LINN Energy paid $1,000 for 100% of LinnCo’s sole voting share. In October 2012, LinnCo completed its IPO and used the net proceeds of approximately $1.2 billion from the offering to acquire 34,787,500 of LINN Energy’s units which represent approximately 15% of LINN Energy’s outstanding units at December 31, 2012. All of LinnCo’s common shares are held by the public. See Note 3 for additional details about the LinnCo IPO.
LINN Energy has agreed to provide to LinnCo, or to pay on LinnCo’s behalf, any legal, accounting, tax advisory, financial advisory and engineering fees, printing costs or other administrative and out-of-pocket expenses incurred by LinnCo, along with any other expenses incurred in connection with any public offering of shares in LinnCo or incurred as a result of being a publicly traded entity, including costs associated with annual, quarterly and other reports to holders of LinnCo shares, tax return and Form 1099 preparation and distribution, NASDAQ listing fees, printing costs, independent auditor fees and expenses, legal counsel fees and expenses, limited liability company governance and compliance expenses and registrar and transfer agent fees. In addition, the Company has agreed to indemnify LinnCo and its officers and directors for damages suffered or costs incurred (other than income taxes payable by LinnCo) in connection with carrying out LinnCo’s activities.
For the period from April 30, 2012 (LinnCo’s inception) to December 31, 2012, LinnCo incurred total general and administrative expenses of approximately $1 million, all of which were paid by LINN Energy on LinnCo’s behalf. These expenses included approximately $772,000 related to services provided by LINN Energy necessary for the conduct of LinnCo’s business, such as accounting, legal, tax, information technology and other expenses. LINN Energy also paid, on LinnCo’s behalf, approximately $3 million of offering costs in connection with the LinnCo IPO. All expenses and costs paid by LINN Energy on LinnCo’s behalf are recorded as investment at cost and included in “other noncurrent assets” on the consolidated balance sheet.
In November 2012, the Company paid approximately $25 million in distributions to LinnCo attributable to LinnCo’s interest in LINN Energy. On January 24, 2013, the Company’s Board of Directors declared a cash distribution of $0.725 per unit with respect to the fourth quarter of 2012. The distribution attributable to LinnCo’s interest in LINN Energy, totaling approximately $25 million, was paid to LinnCo on February 14, 2013.
Other
One of the Company’s directors, appointed to the Board in May 2012, is the President and Chief Executive Officer of Superior Energy Services, Inc. (“Superior”), which provides oilfield services to the Company. For the year ended December 31, 2012, the Company paid approximately $21 million to Superior and its subsidiaries for services rendered to the Company. These payments were consummated on terms equivalent to those that prevail in arm’s-length transactions.
Note 17 - Subsidiary Guarantors
The November 2019 Senior Notes, the May 2019 Senior Notes, the 2010 Issued Notes and the Original Senior Notes are guaranteed by all of the Company’s material subsidiaries. The Company is a holding company and has no independent assets or operations of its own, the guarantees under each series of notes are full and unconditional and joint and several, and any subsidiaries of the Company other than the subsidiary guarantors are minor. There are no restrictions on the Company’s ability to obtain cash dividends or other distributions of funds from the guarantor subsidiaries.
Note 18 - Subsequent Event
On February 21, 2013, LinnCo and Berry Petroleum Company (“Berry”) announced they had signed a definitive merger agreement under which LinnCo would acquire all of the outstanding common shares of Berry. The transaction has a preliminary value of approximately $4.3 billion, including the assumption of debt, and is expected to close by June 30, 2013, subject to approvals by Berry and LinnCo shareholders, Linn Energy’s unitholders and regulatory agencies.
Under the terms of the agreement, Berry’s shareholders will receive 1.25 of LinnCo common shares for each Berry common share they own. This transaction, which is expected to be a tax-free exchange to Berry’s shareholders, represents value of $46.2375 per common share, based on the closing price of LinnCo common shares on February 20, 2013.
104
LINN ENERGY, LLC
SUPPLEMENTAL OIL AND NATURAL GAS DATA (Unaudited)
The following discussion and analysis should be read in conjunction with the “Consolidated Financial Statements” and “Notes to Consolidated Financial Statements,” which are included in this Annual Report on Form 10-K in Item 8. “Financial Statements and Supplementary Data.”
Costs Incurred in Oil and Natural Gas Property Acquisition, Exploration and Development Activities
Costs incurred in oil and natural gas property acquisition, exploration and development, whether capitalized or expensed, are presented below:
Year Ended December 31, | ||||||||||||
2012 | 2011 | 2010 | ||||||||||
(in thousands) | ||||||||||||
Property acquisition costs: (1) | ||||||||||||
Proved | $ | 2,531,419 | $ | 1,328,328 | $ | 1,290,826 | ||||||
Unproved | 181,124 | 188,409 | 65,604 | |||||||||
Exploration costs | 452 | 80 | 74 | |||||||||
Development costs | 1,062,043 | 639,395 | 244,834 | |||||||||
Asset retirement costs | 4,675 | 2,427 | 748 | |||||||||
Total costs incurred | $ | 3,779,713 | $ | 2,158,639 | $ | 1,602,086 | ||||||
(1) | See Note 2 for details about the Company’s acquisitions. |
Oil and Natural Gas Capitalized Costs
Aggregate capitalized costs related to oil, natural gas and NGL production activities with applicable accumulated depletion and amortization are presented below:
December 31, | ||||||||
2012 | 2011 | |||||||
(in thousands) | ||||||||
Proved properties: | ||||||||
Leasehold acquisition | $ | 8,603,888 | $ | 6,040,239 | ||||
Development | 2,553,127 | 1,484,486 | ||||||
Unproved properties | 454,315 | 310,925 | ||||||
11,611,330 | 7,835,650 | |||||||
Less accumulated depletion and amortization | (2,025,656 | ) | (1,033,617 | ) | ||||
$ | 9,585,674 | $ | 6,802,033 | |||||
105
Results of Oil and Natural Gas Producing Activities
The results of operations for oil, natural gas and NGL producing activities (excluding corporate overhead and interest costs) are presented below:
Year Ended December 31, | ||||||||||||
2012 | 2011 | 2010 | ||||||||||
(in thousands) | ||||||||||||
Revenues and other: | ||||||||||||
Oil, natural gas and natural gas liquid sales | $ | 1,601,180 | $ | 1,162,037 | $ | 690,054 | ||||||
Gains on oil and natural gas derivatives | 124,762 | 449,940 | 75,211 | |||||||||
1,725,942 | 1,611,977 | 765,265 | ||||||||||
Production costs: | ||||||||||||
Lease operating expenses | 317,699 | 232,619 | 158,382 | |||||||||
Transportation expenses | 77,322 | 28,358 | 19,594 | |||||||||
Severance and ad valorem taxes | 130,805 | 78,458 | 45,114 | |||||||||
525,826 | 339,435 | 223,090 | ||||||||||
Other costs: | ||||||||||||
Exploration costs | 1,915 | 2,390 | 5,168 | |||||||||
Depletion and amortization | 579,382 | 320,096 | 226,552 | |||||||||
Impairment of long-lived assets | 422,499 | — | 38,600 | |||||||||
Gains on sale of assets and other, net | (1,369 | ) | (1,001 | ) | — | |||||||
Texas margin tax (benefit) expense | (787 | ) | 1,599 | 657 | ||||||||
1,001,640 | 323,084 | 270,977 | ||||||||||
Results of operations | $ | 198,476 | $ | 949,458 | $ | 271,198 | ||||||
There is no federal tax provision included in the results above because the Company’s subsidiaries subject to federal tax do not own any of the Company’s oil and natural gas interests. Limited liability companies are subject to Texas margin tax. Limited liability companies were also subject to state income taxes in the state of Michigan during 2011 and 2010; however, no taxes were assessed in this state for producing activities during these years. See Note 14 for additional information about income taxes.
106
Proved Oil, Natural Gas and NGL Reserves
The proved reserves of oil, natural gas and NGL of the Company have been prepared by the independent engineering firm, DeGolyer and MacNaughton. In accordance with SEC regulations, reserves at December 31, 2012, December 31, 2011, and December 31, 2010, were estimated using the average price during the 12-month period, determined as an unweighted average of the first-day-of-the-month price for each month, unless prices are defined by contractual arrangements, excluding escalations based upon future conditions. An analysis of the change in estimated quantities of oil, natural gas and NGL reserves, all of which are located within the U.S., is shown below:
Year Ended December 31, 2012 | ||||||||||||
Natural Gas (Bcf) | Oil (MMBbls) | NGL (MMBbls) | Total (Bcfe) | |||||||||
Proved developed and undeveloped reserves: | ||||||||||||
Beginning of year | 1,675 | 189.0 | 93.5 | 3,370 | ||||||||
Revisions of previous estimates | (559 | ) | (26.5 | ) | (14.1 | ) | (803 | ) | ||||
Purchase of minerals in place | 1,176 | 23.1 | 75.3 | 1,766 | ||||||||
Extensions, discoveries and other additions | 407 | 16.6 | 33.7 | 709 | ||||||||
Production | (128 | ) | (10.7 | ) | (9.0 | ) | (246 | ) | ||||
End of year | 2,571 | 191.5 | 179.4 | 4,796 | ||||||||
Proved developed reserves: | ||||||||||||
Beginning of year | 998 | 124.8 | 47.8 | 2,034 | ||||||||
End of year | 1,661 | 131.4 | 113.0 | 3,127 | ||||||||
Proved undeveloped reserves: | ||||||||||||
Beginning of year | 677 | 64.2 | 45.7 | 1,336 | ||||||||
End of year | 910 | 60.1 | 66.4 | 1,669 | ||||||||
Year Ended December 31, 2011 | ||||||||||||
Natural Gas (Bcf) | Oil (MMBbls) | NGL (MMBbls) | Total (Bcfe) | |||||||||
Proved developed and undeveloped reserves: | ||||||||||||
Beginning of year | 1,233 | 156.4 | 70.9 | 2,597 | ||||||||
Revisions of previous estimates | (71 | ) | (9.2 | ) | 0.9 | (121 | ) | |||||
Purchase of minerals in place | 337 | 39.3 | 1.0 | 579 | ||||||||
Extensions, discoveries and other additions | 240 | 10.3 | 24.6 | 450 | ||||||||
Production | (64 | ) | (7.8 | ) | (3.9 | ) | (135 | ) | ||||
End of year | 1,675 | 189.0 | 93.5 | 3,370 | ||||||||
Proved developed reserves: | ||||||||||||
Beginning of year | 805 | 103.0 | 39.9 | 1,662 | ||||||||
End of year | 998 | 124.8 | 47.8 | 2,034 | ||||||||
Proved undeveloped reserves: | ||||||||||||
Beginning of year | 428 | 53.4 | 31.0 | 935 | ||||||||
End of year | 677 | 64.2 | 45.7 | 1,336 | ||||||||
107
Year Ended December 31, 2010 | ||||||||||||
Natural Gas (Bcf) | Oil (MMBbls) | NGL (MMBbls) | Total (Bcfe) | |||||||||
Proved developed and undeveloped reserves: | ||||||||||||
Beginning of year | 774 | 102.1 | 54.2 | 1,712 | ||||||||
Revisions of previous estimates | 22 | 3.9 | 5.2 | 77 | ||||||||
Purchase of minerals in place | 369 | 49.1 | 1.2 | 671 | ||||||||
Extensions, discoveries and other additions | 118 | 6.1 | 13.3 | 234 | ||||||||
Production | (50 | ) | (4.8 | ) | (3.0 | ) | (97 | ) | ||||
End of year | 1,233 | 156.4 | 70.9 | 2,597 | ||||||||
Proved developed reserves: | ||||||||||||
Beginning of year | 549 | 77.9 | 33.9 | 1,220 | ||||||||
End of year | 805 | 103.0 | 39.9 | 1,662 | ||||||||
Proved undeveloped reserves: | ||||||||||||
Beginning of year | 225 | 24.2 | 20.3 | 492 | ||||||||
End of year | 428 | 53.4 | 31.0 | 935 | ||||||||
The tables above include changes in estimated quantities of oil and NGL reserves shown in Mcf equivalents at a rate of one barrel per six Mcf.
Proved reserves increased by approximately 1,426 Bcfe to approximately 4,796 Bcfe for the year ended December 31, 2012, from 3,370 Bcfe for the year ended December 31, 2011. The year ended December 31, 2012, includes 803 Bcfe of negative revisions of previous estimates, due primarily to 340 Bcfe of negative revisions due to asset performance, 248 Bcfe of negative revisions primarily due to lower natural gas prices and 215 Bcfe of negative revisions due to the SEC five-year development limitation on PUDs. Seven acquisitions during the year ended December 31, 2012, increased proved reserves by approximately 1,766 Bcfe. In addition, extensions and discoveries, primarily from 436 productive wells drilled during the year, contributed approximately 709 Bcfe to the increase in proved reserves.
Proved reserves increased by approximately 773 Bcfe to approximately 3,370 Bcfe for the year ended December 31, 2011, from 2,597 Bcfe for the year ended December 31, 2010. The year ended December 31, 2011, includes 121 Bcfe of negative revisions of previous estimates, due primarily to 153 Bcfe of negative revisions due to asset performance. These negative revisions were partially offset by 32 Bcfe of positive revisions primarily due to higher oil prices. Twelve acquisitions during the year ended December 31, 2011, increased proved reserves by approximately 579 Bcfe. In addition, extensions and discoveries, primarily from 292 productive wells drilled during the year, contributed approximately 450 Bcfe to the increase in proved reserves.
Proved reserves increased by approximately 885 Bcfe to approximately 2,597 Bcfe for the year ended December 31, 2010, from 1,712 Bcfe for the year ended December 31, 2009. The year ended December 31, 2010, includes 77 Bcfe of positive revisions of previous estimates, due primarily to higher oil and natural gas prices, which contributed approximately 155 Bcfe. These positive revisions were partially offset by 78 Bcfe of negative revisions primarily due to asset performance. Eleven acquisitions during the year ended December 31, 2010, increased proved reserves by approximately 671 Bcfe. In addition, extensions and discoveries, primarily from 138 productive wells drilled during the year, contributed approximately 234 Bcfe to the increase in proved reserves.
Standardized Measure of Discounted Future Net Cash Flows and Changes Therein Relating to Proved Reserves
Information with respect to the standardized measure of discounted future net cash flows relating to proved reserves is summarized below. Future cash inflows are computed by applying applicable prices relating to the Company’s proved reserves to the year-end quantities of those reserves. Future production, development, site restoration and abandonment costs are derived based on current costs assuming continuation of existing economic conditions. There are no future income tax expenses because the Company is not subject to federal income taxes. Limited liability companies are subject to Texas margin tax. Limited liabilities companies were also subject to state income taxes in the state of Michigan during 2011 and
108
2010; however, these amounts are not material. See Note 14 for additional information about income taxes.
December 31, | ||||||||||||
2012 | 2011 | 2010 | ||||||||||
(in thousands) | ||||||||||||
Future estimated revenues | $ | 30,374,380 | $ | 29,319,369 | $ | 20,160,275 | ||||||
Future estimated production costs | (11,460,854 | ) | (9,464,319 | ) | (6,825,147 | ) | ||||||
Future estimated development costs | (3,574,058 | ) | (2,848,497 | ) | (1,733,929 | ) | ||||||
Future net cash flows | 15,339,468 | 17,006,553 | 11,601,199 | |||||||||
10% annual discount for estimated timing of cash flows | (9,266,487 | ) | (10,391,693 | ) | (7,377,667 | ) | ||||||
Standardized measure of discounted future net cash flows | $ | 6,072,981 | $ | 6,614,860 | $ | 4,223,532 | ||||||
Representative NYMEX prices: (1) | ||||||||||||
Natural gas (MMBtu) | $ | 2.76 | $ | 4.12 | $ | 4.38 | ||||||
Oil (Bbl) | $ | 94.64 | $ | 95.84 | $ | 79.29 | ||||||
(1) | In accordance with SEC regulations, reserves at December 31, 2012, December 31, 2011, and December 31, 2010, were estimated using the average price during the 12-month period, determined as an unweighted average of the first-day-of-the-month price for each month, unless prices are defined by contractual arrangements, excluding escalations based upon future conditions. The price used to estimate reserves is held constant over the life of the reserves. |
The following summarizes the principal sources of change in the standardized measure of discounted future net cash flows:
Year Ended December 31, | ||||||||||||
2012 | 2011 | 2010 | ||||||||||
(in thousands) | ||||||||||||
Sales and transfers of oil, natural gas and NGL produced during the period | $ | (1,075,354 | ) | $ | (822,602 | ) | $ | (466,964 | ) | |||
Changes in estimated future development costs | 289,762 | 27,236 | (56,001 | ) | ||||||||
Net change in sales and transfer prices and production costs related to future production | (1,463,820 | ) | 784,308 | 886,438 | ||||||||
Purchase of minerals in place | 2,153,651 | 1,452,169 | 1,277,134 | |||||||||
Extensions, discoveries, and improved recovery | 413,702 | 552,704 | 329,642 | |||||||||
Previously estimated development costs incurred during the period | 442,322 | 306,827 | 42,947 | |||||||||
Net change due to revisions in quantity estimates | (1,595,302 | ) | (292,343 | ) | 164,999 | |||||||
Accretion of discount | 661,486 | 422,353 | 172,328 | |||||||||
Changes in production rates and other | (368,326 | ) | (39,324 | ) | 149,727 | |||||||
$ | (541,879 | ) | $ | 2,391,328 | $ | 2,500,250 | ||||||
The data presented should not be viewed as representing the expected cash flow from, or current value of, existing proved reserves since the computations are based on a large number of estimates and arbitrary assumptions. Reserve quantities cannot be measured with precision and their estimation requires many judgmental determinations and frequent revisions. The required projection of production and related expenditures over time requires further estimates with respect to pipeline availability, rates of demand and governmental control. Actual future prices and costs are likely to be substantially different from the current prices and costs utilized in the computation of reported amounts. Any analysis or evaluation of the reported amounts should give specific recognition to the computational methods utilized and the limitations inherent therein.
109
LINN ENERGY, LLC
SUPPLEMENTAL QUARTERLY DATA (Unaudited)
The following discussion and analysis should be read in conjunction with the “Consolidated Financial Statements” and “Notes to Consolidated Financial Statements,” which are included in this Annual Report on Form 10-K in Item 8. “Financial Statements and Supplementary Data.”
Quarterly Financial Data
Quarters Ended | ||||||||||||||||
March 31 | June 30 | September 30 | December 31 | |||||||||||||
(in thousands, except per unit amounts) | ||||||||||||||||
2012: | ||||||||||||||||
Oil, natural gas and natural gas liquid sales | $ | 348,895 | $ | 347,227 | $ | 444,082 | $ | 460,976 | ||||||||
Gains (losses) on oil and natural gas derivatives | 2,031 | 439,647 | (411,405 | ) | 94,489 | |||||||||||
Total revenues and other | 354,090 | 800,597 | 48,328 | 571,225 | ||||||||||||
Total expenses (1) | 269,108 | 460,617 | 376,353 | 656,111 | ||||||||||||
(Gain) losses on sale of assets and other, net | 1,478 | 36 | (14 | ) | 141 | |||||||||||
Net income (loss) | (6,202 | ) | 237,086 | (430,005 | ) | (187,495 | ) | |||||||||
Net income (loss) per unit: | ||||||||||||||||
Basic | $ | (0.04 | ) | $ | 1.19 | $ | (2.18 | ) | $ | (0.83 | ) | |||||
Diluted | $ | (0.04 | ) | $ | 1.19 | $ | (2.18 | ) | $ | (0.83 | ) | |||||
(1) | Includes the following expenses: lease operating, transportation, marketing, general and administrative, exploration, bad debt, depreciation, depletion and amortization, impairment of long-lived assets and taxes, other than income taxes. |
Quarters Ended | ||||||||||||||||
March 31 | June 30 | September 30 | December 31 | |||||||||||||
(in thousands, except per unit amounts) | ||||||||||||||||
2011: | ||||||||||||||||
Oil, natural gas and natural gas liquid sales | $ | 240,707 | $ | 302,390 | $ | 292,482 | $ | 326,458 | ||||||||
Gains (losses) on oil and natural gas derivatives | (369,476 | ) | 205,515 | 824,240 | (210,339 | ) | ||||||||||
Total revenues and other | (126,473 | ) | 510,571 | 1,119,483 | 118,873 | |||||||||||
Total expenses (1) | 165,625 | 195,672 | 211,254 | 240,353 | ||||||||||||
Losses on sale of assets and other, net | 614 | 977 | 279 | 1,646 | ||||||||||||
Net income (loss) | (446,682 | ) | 237,109 | 837,627 | (189,615 | ) | ||||||||||
Net income (loss) per unit: | ||||||||||||||||
Basic | $ | (2.75 | ) | $ | 1.34 | $ | 4.74 | $ | (1.09 | ) | ||||||
Diluted | $ | (2.75 | ) | $ | 1.33 | $ | 4.72 | $ | (1.09 | ) | ||||||
(1) | Includes the following expenses: lease operating, transportation, marketing, general and administrative, exploration, bad debt, depreciation, depletion and amortization and taxes, other than income taxes. |
110
Item 9. Changes in and Disagreements With Accountants on Accounting and Financial Disclosure
None
Item 9A. Controls and Procedures
Evaluation of Disclosure Controls and Procedures
The Company maintains disclosure controls and procedures that are designed to ensure that information required to be disclosed in the Company’s reports under the Securities Exchange Act of 1934, as amended (the “Exchange Act”) is recorded, processed, summarized and reported within the time periods specified in the SEC’s rules and forms, and that such information is accumulated and communicated to management, including the Company’s Chief Executive Officer and Chief Financial Officer, and the Company’s Audit Committee of the Board of Directors, as appropriate, to allow timely decisions regarding required disclosure. In designing and evaluating the disclosure controls and procedures, management recognizes that any controls and procedures, no matter how well designed and operated, can provide only reasonable assurance of achieving the desired control objectives, and management is required to apply its judgment in evaluating the cost-benefit relationship of possible controls and procedures.
The Company carried out an evaluation under the supervision and with the participation of its management, including its Chief Executive Officer and Chief Financial Officer, of the effectiveness of its disclosure controls and procedures as of the end of the period covered by this report. Based on this evaluation, the Chief Executive Officer and Chief Financial Officer concluded that the Company’s disclosure controls and procedures were effective as of December 31, 2012.
Management’s Annual Report on Internal Control Over Financial Reporting
See “Management’s Report on Internal Control Over Financial Reporting” in Item 8. “Financial Statements and Supplementary Data.”
Changes in the Company’s Internal Control Over Financial Reporting
The Company’s management is also responsible for establishing and maintaining adequate internal controls over financial reporting, as defined in Rules 13a-15(f) and 15d-15(f) of the Exchange Act. The Company’s internal controls were designed to provide reasonable assurance as to the reliability of its financial reporting and the preparation and presentation of the consolidated financial statements for external purposes in accordance with accounting principles generally accepted in the U.S.
Because of its inherent limitations, internal control over financial reporting may not detect or prevent misstatements. Projections of any evaluation of the effectiveness to future periods are subject to the risk that controls may become inadequate because of changes in conditions, or that the degree of compliance with the policies or procedures may deteriorate.
There were no changes in the Company’s internal controls over financial reporting during the fourth quarter of 2012 that materially affected, or were reasonably likely to materially affect, the Company’s internal control over financial reporting.
Item 9B. Other Information
On October 17, 2012, LinnCo, LLC (“LinnCo”), an affiliate of LINN Energy, completed its initial public offering of 34,787,500 common shares representing limited liability company interests. LinnCo has elected to be taxed as a corporation, and accordingly, its shareholders will receive a Form 1099 in respect of any dividends paid by LinnCo. The net proceeds from the offering were used to acquire 34,787,500 LINN Energy units which are equal to the number of LinnCo shares sold in the offering. LinnCo will have no significant assets or operations other than those related to its ownership of LINN Energy units. The Company used the proceeds it received from the sale of its units to LinnCo to pay the expenses of the offering and repay a portion of the outstanding indebtedness under its Credit Facility. LinnCo’s common shares are listed on the NASDAQ Global Select Market under the symbol “LNCO.”
111
The Company is a limited liability company and its units representing limited liability company interests (“units”) are listed on the NASDAQ Global Select Market. The SEC’s taxonomy for interactive data reporting does not contain tags that include the term “units” for all existing equity accounts; therefore, in certain instances, the Company has used tags that refer to “shares” or “stock” rather than “units” in its interactive data exhibit. These tags were selected to enhance comparability between the Company and its peers and it should not be inferred from the usage of these tags that an investment in the Company is in any form other than “units” as described above. The Company’s interactive data files are included as Exhibit 101 to this Annual Report on Form 10-K.
112
Part III
Item 10. Directors, Executive Officers and Corporate Governance
Our business and affairs are managed by executive officers and a board of directors. Our executive officers are Mark E. Ellis, Kolja Rockov, Arden L. Walker, Jr. and David B. Rottino. As of the date of this annual report, our board of directors is composed of six directors, including four independent directors constituting our audit committee. Our directors are George A. Alcorn, David D. Dunlap, Mark E. Ellis, Michael C. Linn, Joseph P. McCoy and Jeffrey C. Swoveland.
The following table sets forth specific information for our executive officers and directors. All of our directors are elected annually. Executive officers are appointed for one-year terms.
Name | Age | Position | ||
Mark E. Ellis | 57 | Chairman, President and Chief Executive Officer; Director | ||
Kolja Rockov | 42 | Executive Vice President and Chief Financial Officer | ||
Arden L. Walker, Jr. | 53 | Executive Vice President and Chief Operating Officer | ||
David B. Rottino | 47 | Senior Vice President of Finance, Business Development and Chief Accounting Officer | ||
George A. Alcorn | 81 | Independent Director | ||
David D. Dunlap | 52 | Independent Director | ||
Michael C. Linn | 61 | Founder and Director | ||
Joseph P. McCoy | 62 | Independent Director | ||
Jeffrey C. Swoveland | 57 | Independent Director | ||
Mark E. Ellis is the Chairman, President and Chief Executive Officer and has served in such capacity since December 2011. He previously served as President, Chief Executive Officer and Director from January 2010 to December 2011 and from December 2007 to January 2010, Mr. Ellis served as President and Chief Operating Officer of the Company. Mr. Ellis is a member of the Society of Petroleum Engineers and the National Petroleum Council. Mr. Ellis serves on the boards of America’s Natural Gas Alliance, American Exploration & Production Council, Industry Board of Petroleum Engineering at Texas A&M University, the Visiting Committee of Petroleum Engineering at the Colorado School of Mines, Houston Museum of Natural Science and The Center for the Performing Arts at The Woodlands. In addition, he is Chairman of the Board for The Center for Hearing and Speech, and holds a position as trustee on the Texas A&M University 12th Man Foundation Board of Trustees.
Kolja Rockov is the Executive Vice President and Chief Financial Officer and has served in such capacity since joining the Company in March 2005. Mr. Rockov has more than 15 years of experience in the oil and natural gas finance industry. From October 2004 until he joined the Company in March 2005, Mr. Rockov served as a Managing Director in the Energy Group at RBC Capital Markets, where he was primarily responsible for investment banking coverage of the U.S. exploration and production sector. Mr. Rockov is the founding chairman of a philanthropic organization benefiting Texas Children’s Cancer Center in Houston, which has raised more than $1 million since 2009.
Arden L. Walker, Jr. is the Executive Vice President and Chief Operating Officer and has served in such capacity since January 2011. From January 2010 to January 2011, he served as Senior Vice President and Chief Operating Officer. Mr. Walker joined the Company in February 2007 as Senior Vice President, Operations and Chief Engineer. Mr. Walker is a member of the Society of Petroleum Engineers and Independent Petroleum Association of America. He also serves on the boards of the Sam Houston Area Council of the Boy Scouts of America and Theatre Under The Stars.
David B. Rottino is the Senior Vice President of Finance, Business Development and Chief Accounting Officer and has served in such capacity since July 2010. From June 2008 to July 2010, Mr. Rottino served as the Senior Vice President and Chief Accounting Officer. Prior to joining LINN Energy, Mr. Rottino served as Vice President and E&P Controller for El
113
Item 10. Directors, Executive Officers and Corporate Governance - Continued
Paso Corporation from June 2006 to May 2008. Mr. Rottino is a Certified Public Accountant. In addition, he currently serves on the Board of Camp for All.
George A. Alcorn was appointed to our board of directors in January 2006, and is Chairman of the Nominating and Governance Committee and serves on the Audit Committee. Mr. Alcorn also serves on the LinnCo, LLC (“LinnCo”) board of directors, to which he was appointed in April 2012. Mr. Alcorn serves as President of Alcorn Exploration, Inc., a private exploration and production company. Mr. Alcorn is also a member of the board of directors of EOG Resources, Inc. He is a past chairman of the Independent Petroleum Association of America (the “IPAA”) and a founding member and past chairman of the Natural Gas Council.
David D. Dunlap was appointed to our board of directors in May 2012. Mr. Dunlap is an independent director. Mr. Dunlap serves on our Audit, Compensation, Nominating and Governance and Conflicts Committees. Mr. Dunlap also served on the LinnCo board of directors from May 2012 until February 2013. Mr. Dunlap is President and Chief Executive Officer and Director of Superior Energy Services, Inc. (“Superior”) a position that he has held since April 2010. Prior to joining Superior, Mr. Dunlap was Executive Vice President and Chief Operating Officer for BJ Services Company (“BJ Services”). During a twenty-five year career with BJ Services, he served in a variety of engineering, operations, and management positions including President of BJ Services’ International Division and Vice President of Division Sales. Mr. Dunlap is a member of the Board of Directors of the Texas A&M University Petroleum Engineering Industry Board, The John Cooper School Board of Trustees, the Board of Directors of The Cynthia Woods Mitchell Pavilion, and the Woodlands Children’s Museum Board of Directors.
Michael C. Linn is the founder of Linn Energy, LLC, and has served as a director since December 2011. Prior to that, he was Executive Chairman of our board of directors since January 2010. He served as our Chairman and Chief Executive Officer from December 2007 to January 2010; Chairman, President and Chief Executive Officer from June 2006 to December 2007; and President, Chief Executive Officer and Director from March 2003 to June 2006. Mr. Linn also serves on the LinnCo board of directors, to which he was appointed in April 2012. Mr. Linn also serves on the Board of Directors and is Chairman of the Risk Committee for Nabors Industries, Ltd, Board of Directors for Black Stone Minerals and is a Senior Advisor for Quantum Energy Partners, LLC. Mr. Linn currently serves on: National Petroleum Council; IPAA-Chairman of Political Action Committee; Texas Representative for the Legal and Regulatory Affairs Committee of the Interstate Oil and Gas Compact Commission. He previously served on the following: IPAA-Chairman-Board of Directors; Natural Gas Supply Association-Director; National Gas Council - Chairman and Director; Independent Oil and Gas Associations of New York, Pennsylvania and West Virginia - Chairman and President of each. He was named as the 2011 IPAA Chief Roughneck of the Year, inducted into the All American Wildcatters, and received The Woodrow Wilson Award for Public Service.
Joseph P. McCoy was appointed to our board of directors in September 2007, and is Chairman of the Audit Committee. Mr. McCoy also serves on the LinnCo board of directors, to which he was appointed in April 2012, and is Chairman of the LinnCo Audit Committee. Mr. McCoy served as Senior Vice President and Chief Financial Officer of Burlington Resources Inc. from 2005 until 2006 and Vice President and Controller (Chief Accounting Officer) of Burlington Resources Inc. from 2001 until 2005. Prior to joining Burlington Resources, Mr. McCoy spent 27 years with Atlantic Richfield and affiliates in a variety of financial positions. Mr. McCoy has served on the boards of directors of Global Geophysical Services, Inc. and Scientific Drilling International since 2011 and served as a member of the board of directors of Rancher Energy, Inc. and BPI Energy Corp. from 2007 to 2009. Since 2006, other than his service on LinnCo’s board of directors and the other boards identified above, Mr. McCoy has been retired.
Jeffrey C. Swoveland was appointed to our board of directors in January 2006. Mr. Swoveland is an independent director. Mr. Swoveland is the Chairman of our Compensation Committee and serves on the Audit, Nominating and Governance and Conflicts Committees. Mr. Swoveland also served on the LinnCo board of directors from April 2012 until February 2013. Since June 2009, Mr. Swoveland has served as the Chief Executive Officer of ReGear Life Sciences (formerly known as Coventina Healthcare Enterprises), a medical device company that develops and markets products which reduce pain and increase the rate of healing through therapeutic, deep tissue heating. From May 2006 to June 2009, Mr. Swoveland served as Chief Operating Officer of ReGear Life Sciences. From 2000 to 2006, he served as Chief Financial Officer of BodyMedia, a life-science and bioinformatics company. From 1994 to 2000, he served as Director of Finance, VP Finance & Treasurer and Interim Chief Financial Officer of Equitable Resources, Inc., a diversified natural gas company. Mr. Swoveland is also Chairman of the Board of Directors of PDC Energy, Inc.
114
Item 10. Directors, Executive Officers and Corporate Governance - Continued
Qualifications of Director Nominees
In making its recommendation to nominate the current directors for reelection, the Nominating and Governance Committee of the board of directors (Nominating Committee) determined that each of George A. Alcorn, David D. Dunlap, Mark E. Ellis, Michael C. Linn, Joseph P. McCoy and Jeffrey C. Swoveland, possesses the following qualifications:
1. | personal and professional integrity and high ethical standards; |
2. | good business judgment; |
3. | an excellent reputation in the industry in which the nominee or director is or has been primarily employed; |
4. | a sophisticated understanding of our business or similar businesses; |
5. | curiosity and a willingness to ask probing questions of management; |
6. | the ability and willingness to work cooperatively with other members of the board of directors and with our Chairman, President and Chief Executive Officer and our other members of senior management; and |
7. | the ability and willingness to support us with his preparation for, attendance at and participation in board of directors meetings. |
The Nominating Committee further found that each of the nominees possesses the following experience, qualifications, attributes and skills that, combined with those qualifications identified above, led the Nominating Committee to conclude that such nominee should serve as a member of our board of directors:
1. | George A. Alcorn |
• | As President of Alcorn Exploration, Inc., brings significant knowledge of our business. |
• | Brings significant experience in the oil and natural gas industry, including as former chairman of the IPAA. |
• | As member of the board of directors and committees of EOG Resources, Inc., brings experience and expertise serving on public company boards and as nominating committee chair. |
2. | David D. Dunlap |
• | As current President, CEO and director of Superior, brings significant knowledge of public company governance and process. |
• | Brings significant experience in the oil and natural gas industry. |
• | Brings over 25 years of experience in the well services business. |
3. | Mark E. Ellis |
• | As our current Chairman, President and Chief Executive Officer, is well suited to inform the board of directors of significant strategic matters and to lead the board of directors as Chairman. |
• | Brings significant experience in the oil and natural gas industry, including membership in the Society of Petroleum Engineers. |
• | As an engineer, brings technical expertise. |
4. | Michael C. Linn |
• | As our founder, brings historical knowledge and strategic experience and is well suited to serve as a link between the board of directors and management. |
• | Brings significant experience in the oil and natural gas industry, including as former chairman of the IPAA. |
• | As an attorney, brings legal expertise. |
5. | Joseph P. McCoy |
• | As former Chief Financial Officer of Burlington Resources Inc., brings significant knowledge of our business. |
• | As former director of Rancher Energy, Inc. and BPI Energy Corp. and current director of Global Geophysical Services, Inc. and Scientific Drilling International brings experience serving on public company boards. |
• | As former Chief Financial Officer and Chief Accounting Officer of Burlington Resources Inc., brings |
115
Item 10. Directors, Executive Officers and Corporate Governance - Continued
significant financial expertise and experience in the preparation and review of financial statements and disclosure documents.
6. | Jeffrey C. Swoveland |
• | As former Vice President and Treasurer and Interim Chief Financial Officer of Equitable Resources, Inc., brings significant financial expertise and experience in the preparation and review of financial statements and disclosure documents. |
• | Brings expertise and experience in banking, including credit/financial analysis. |
• | As director and former chair of the audit and compensation committees of PDC Energy, Inc. brings experience serving on public company boards and as compensation committee chair. |
Corporate Governance
Section 16(a) Beneficial Ownership Compliance
Section 16(a) of the Exchange Act requires our executive officers and directors and persons who own more than 10% of our units to file reports of ownership and changes in ownership concerning our units with the SEC and to furnish us with copies of all Section 16(a) forms they file. Based solely upon our review of the Section 16(a) filings that have been received by us and written representations that no other reports were filed, we believe that all filings required to be made under Section 16(a) during 2012 were timely made.
Governance Guidelines and Codes of Ethics
Our board of directors has adopted Corporate Governance Guidelines to assist it in the exercise of its responsibility to provide effective governance over our affairs for the benefit of our unitholders. In addition, we have adopted a Code of Business Conduct and Ethics, which sets forth legal and ethical standards of conduct for all our employees, as well as our directors. We also have adopted a separate code of ethics which applies to our Chief Executive Officer, Chief Financial Officer, Chief Accounting Officer and Controller. All of these documents are available on our website, www.linnenergy.com, and will be provided free of charge to any unitholder requesting a copy by writing to our Corporate Secretary, Linn Energy, LLC, 600 Travis, Suite 5100, Houston, Texas 77002. If any substantive amendments are made to the Code of Ethics for our Chief Executive Officer, Chief Financial Officer, Chief Accounting Officer and Controller or if we grant any waiver, including any implicit waiver, from a provision of such code, we will disclose the nature of such amendment or waiver within four business days on our website. The information on our website is not, and shall not be deemed to be, a part of this Annual Report or incorporated into any other filings we make with the SEC.
Audit Committee
Our board of directors has a standing audit committee. The Audit Committee assists our board of directors in its general oversight of our financial reporting, internal controls and audit functions, and is directly responsible for the appointment, retention, compensation and oversight of the work of our independent public accountant. During 2012, the Audit Committee held seven meetings. The Audit Committee is currently comprised of four directors: Mr. McCoy (Chairman), Mr. Alcorn, Mr. Dunlap and Mr. Swoveland. Terrence Jacobs served on the Audit Committee in 2012 and until his resignation from our board of directors in February 2013. Each member of the Audit Committee is “independent” as defined by the NASDAQ listing standards and applicable SEC rules, and is financially literate. Mr. McCoy has been designated the “audit committee financial expert.” Unitholders should understand that this designation is a disclosure requirement of the SEC related to Mr. McCoy’s experience and understanding with respect to certain accounting and auditing matters. The designation does not impose on Mr. McCoy any duties, obligations or liability that are greater than are generally imposed on him as a member of the Audit Committee and board of directors, and his designation as an audit committee financial expert pursuant to this SEC requirement does not affect the duties, obligations or liability of any other member of the Audit Committee or board of directors.
Our Audit Committee also annually reviews related party transactions and other specific matters that our board of directors believes may involve conflicts of interest. The Audit Committee determines if the related party transaction or resolution of the conflict of interest is in the best interest of our company. In accordance with our limited liability company agreement, any conflict of interest matters approved by the Audit Committee will be conclusively deemed to be fair and reasonable to our company and approved by all of our unitholders.
116
Item 10. Directors, Executive Officers and Corporate Governance - Continued
Nominating and Governance Committee
There have been no material changes to the procedures by which our unitholders may recommend nominees to our board of directors implemented since our most recent disclosure of such procedures in our Proxy Statement for the Annual Meeting of Unitholders held on April 24, 2012.
Item 11. Executive Compensation
2012 Highlights and Executive Summary
Pay for performance is a fundamental tenet of our compensation philosophy. We believe that sustainable performance is what ultimately drives unitholder value and that designing a compensation plan that closely aligns the interests of our Named Officers (defined below) and our unitholders is critical. As a result, a substantial portion of our Named Officers’ total compensation is tied to our performance and delivered as incentive compensation, with a relatively small portion of the total delivered as fixed base salary. We deliver incentive compensation through our cash-based Employee Incentive Compensation Program (“EICP”) and our equity-based Long Term Incentive Plan (“LTIP”). As discussed in more detail below in “–Compensation Discussion and Analysis,” the Compensation Committee believes in setting challenging annual goals that focus our Named Officers on the measures of company performance that create short and long-term value for unitholders.
In 2012, we met or exceeded most of our annual goals and had some extraordinary successes. The following are highlights:
• | We increased the per-unit distribution to unitholders by 5%; |
• | We closed approximately $2.9 billion in acquisitions; |
• | We increased proved reserves by 42% from 3.4 Tcfe in 2011 to 4.8 Tcfe in 2012; |
• | We created and successfully took public LinnCo to broaden our access to capital and provide investors who may not want the tax reporting obligations of a master limited partnership a vehicle to invest in us; |
• | We increased average daily production by 82% year over year from 2011; |
• | We increased adjusted EBITDA (defined below) to $1.4 billion compared to $998 million for 2011; and |
• | We shifted the focus of the Granite Wash drilling program to the oil-producing Hogshooter zone. |
The Compensation Committee’s primary compensation considerations for 2012 were as follows:
• | Our performance described above demonstrated continued successful and profitable growth for our unitholders; |
• | We met or exceeded most of our goals and expectations for the year; |
• | Although we fell short of our quantitative volume targets in some areas, the impact was somewhat offset by the quick shift of the Granite Wash drilling program to the oil-producing Hogshooter zone; |
• | The Compensation Committee intends to continue its performance-oriented pay philosophy to reflect demonstrated performance in both EICP and LTIP awards; |
• | The Compensation Committee compared performance in 2012 to that in 2011 and approved EICP awards equal to 185% of target versus 125% of target awarded in 2011 to reflect our extraordinary achievements outside our quantitative performance targets, including the acquisition and integration of approximately $2.9 billion of assets and the successful IPO of LinnCo; and |
• | The Compensation Committee granted an award of special incentive options to recognize and reward the creativity and effort involved in the success of the IPO of LinnCo. |
Compensation Discussion and Analysis
We use traditional compensation elements of base salary, annual cash incentives, long-term equity-based incentives and employee benefits to deliver attractive and competitive compensation. Our executive compensation programs are administered by an independent compensation committee, with assistance from an independent consultant. We generally target the median of our peer group for total compensation, while providing the Named Officers with an opportunity to earn higher levels of incentive pay based on company performance. Our “Named Officers” for 2012 discussed below are Mark E. Ellis, our Chairman, President and Chief Executive Officer, Kolja Rockov, our Executive Vice President and Chief Financial Officer, Arden L. Walker, Jr., our Executive Vice President and Chief Operating Officer, Charlene A. Ripley, our former
117
Item 11. Executive Compensation - Continued
Senior Vice President and General Counsel and David B. Rottino, our Senior Vice President of Finance, Business Development and Chief Accounting Officer. Ms. Ripley announced her resignation as our Senior Vice President and General Counsel on February 27, 2013.
This Compensation Discussion and Analysis addresses the following topics:
• | the role of the Compensation Committee in establishing executive compensation; |
• | our process for setting executive compensation; |
• | our compensation philosophy and policies regarding executive compensation; and |
• | our compensation decisions with respect to our Named Officers. |
The Compensation Committee
The Compensation Committee has overall responsibility for the approval, evaluation and oversight of all our compensation plans, policies and programs. The fundamental responsibilities of the Compensation Committee are to: (i) establish the goals, objectives and policies relevant to the compensation of our senior management, and evaluate performance in light of those goals to determine compensation levels, (ii) approve and administer our incentive compensation plans, (iii) set compensation levels and make awards under incentive compensation plans that are consistent with our compensation principles and our performance, and (iv) review our disclosure relating to compensation. The Committee also has responsibility for evaluating compensation paid to our non-employee directors.
Compensation Committee Interlocks and Insider Participation
No member of the Compensation Committee serves as a member of the board of directors or compensation committee of any entity that has one or more executive officers serving as a member of our board of directors or Compensation Committee. No member of the Compensation Committee has ever been an officer or employee of us. There are no family relationships among any of our directors or executive officers.
The Compensation Setting Process
Compensation Committee Meetings. The Compensation Committee holds regular quarterly meetings each year, which coincide with our quarterly board of director meetings. It also holds additional meetings as required to carry out its duties. The Compensation Committee chairman works with our corporate secretary to establish each meeting agenda.
At the regular first quarter meeting, the Compensation Committee:
• | considers and approves changes in base salary and EICP targets for the upcoming year; |
• | reviews actual results compared to the pre-established performance measures for the previous year to determine annual cash incentive awards for our executive officers under its Employee Incentive Compensation Plan, or EICP; |
• | grants equity awards under the LTIP based on past performance of the Company and forward looking retention; |
• | approves the performance measures under the EICP for the upcoming year, which may include both quantitative financial and operational measures and qualitative performance measures intended to focus on and reward activities that create unitholder value; |
• | evaluates the compensation paid to our independent directors and, to the extent it deems appropriate, approves any adjustments; and |
• | reviews the summary results of our board of directors’ written evaluations of our Chief Executive Officer, as well as the Chief Executive Officer’s self-evaluation. |
The Compensation Committee receives updates at each quarterly meeting on our progress toward the goals set at the beginning of the year. At a special meeting of the Compensation Committee held in October, the Compensation Committee reviews and discusses a compensation analysis prepared by its independent compensation consultant (please see “–Role of Compensation Consultant” below) and considers compensation for the succeeding calendar year.
The Compensation Committee meets in executive session to consider appropriate compensation for our Chairman, President and Chief Executive Officer. With respect to compensation for all other Named Officers, the Compensation Committee
118
Item 11. Executive Compensation - Continued
generally meets with our Chairman, President and Chief Executive Officer outside the presence of all our other executive officers. When individual compensation decisions are not being considered, the Compensation Committee typically meets in the presence of our Chairman, President and Chief Executive Officer, our General Counsel and our Corporate Secretary. Depending upon the agenda for a particular meeting, the Compensation Committee may also invite other officers, our compensation consultant, and a representative of the Compensation Committee’s compensation consultant to participate in Compensation Committee meetings. The Compensation Committee also regularly meets in executive session without management.
Role of Compensation Consultant. The Compensation Committee’s Charter grants the Compensation Committee the sole and direct authority to retain and terminate compensation advisors and to approve their fees. All such advisors report directly to the Compensation Committee, and all assignments are directed by the Compensation Committee chairman. For 2012, the Compensation Committee engaged Meridian Compensation Partners, LLC (“Meridian”) to assist the Compensation Committee in assessing and determining competitive compensation packages for our executive officers. Meridian did no other work for us in 2012. The Compensation Committee has assessed the independence of Meridian pursuant to SEC rules and concluded that no conflict of interest exists that would prevent Meridian from independently representing the Compensation Committee.
In this capacity, Meridian, at the Compensation Committee’s request and under the direction of the Compensation Committee Chairman, provides input on our compensation program and structure generally and makes recommendations on the program design. Meridian also assembled information regarding comparable executive positions among independent oil and natural gas producers. Meridian’s data for 2012 was based primarily on survey sources, and to a lesser extent on data compiled from the public filings of a peer group of various companies. Reflecting our constant growth, we again revised our peer group for 2013 to add new independent oil and natural gas producers of a similar size, based on a number of criteria including enterprise value, market capitalization, revenues and assets. The chart below identifies the members of our 2012 and 2013 peer groups.
Company Name | 2012 Peer Group | 2013 Peer Group | ||
Cabot Oil & Gas Corporation | ü | ü | ||
Concho Resources Inc. | ü | ü | ||
Continental Resources, Inc. | ü | |||
Cimarex Energy Co. | ü | |||
Denbury Resources Inc. | ü | ü | ||
Devon Energy Corporation | ü | |||
Encana Corporation | ü | |||
EOG Resources, Inc. | ü | |||
Marathon Oil Corporation | ü | |||
Newfield Exploration Company | ü | ü | ||
Noble Energy, Inc. | ü | ü | ||
Petrohawk Energy Corporation | ü | ü | ||
Pioneer Natural Resources Company | ü | ü | ||
Plains Exploration & Production Company | ü | ü | ||
QEP Resources, Inc. | ü | ü | ||
Range Resources Corporation | ü | ü | ||
SM Energy Company | ü | |||
Southwestern Energy Company | ü | ü | ||
Talisman Energy Inc. | ü | |||
Ultra Petroleum Corp. | ü | |||
Whiting Petroleum Corporation | ü | |||
We also employ an individual as a consultant to support us in managing our executive compensation process. Our consultant did not provide any other services to us in 2012.
119
Item 11. Executive Compensation - Continued
Role of Executive Officers. Except with respect to his own compensation, our Chairman, President and Chief Executive Officer, with assistance from our consultant, plays an important role in the Compensation Committee’s establishment of compensation levels for our executive officers. The most significant aspects of his role in the process are:
• | evaluating performance; |
• | recommending EICP award targets and quantitative and qualitative performance measures under the EICP; |
• | recommending base salary levels, actual EICP awards and LTIP awards; and |
• | advising the Compensation Committee with respect to achievement of performance measures under the EICP. |
Executive Compensation Program
Compensation Objectives. Our executive compensation program is intended to align the interests of our executive officers with the interests of our unitholders by motivating our executive officers to focus on those actions which achieve strong financial and operating results and ultimately grow the Company. We believe that profitable growth, both organically and through acquisitions, drives our ability to maintain and increase unitholder distributions. The alignment of interests between unitholders and our executive officers is primarily reflected through our executive officers’ participation in our EICP and LTIP. In addition, our program is designed to achieve the following objectives:
• | attract and retain talented executive officers by providing total compensation levels competitive with that of executives holding comparable positions in similarly situated organizations; |
• | provide total compensation that is supported by individual performance; |
• | provide a performance-based compensation component that balances rewards for short-term and long-term results and is tied to company performance; and |
• | encourage the long-term commitment of our executive officers to us and to our unitholders’ long-term interests. |
Compensation Strategy. To accomplish our objectives, we seek to offer a total direct compensation program to our executive officers that, when valued in its entirety, serves to attract, motivate and retain executives with the character, experience and professional accomplishments required for us to continue to grow and develop. We seek to align executive compensation with unitholders’ interests by placing a significant portion of total direct compensation “at risk.” “At risk” means the executive officer will not realize full value unless (i) for EICP awards, performance goals are achieved, approximately 65% of which are directly tied to our financial performance, and (ii) for restricted units, we maintain or increase both the unit price and per-unit distribution. To appropriately incentivize our executive officers to take a long-term view, unit-based awards under the LTIP are the largest component of our “at risk” compensation.
Our executive compensation program consists of three principal elements: (i) base salary, (ii) potential for annual cash incentive compensation awards under the EICP based upon the achievement of specific performance objectives, and (iii) opportunities to earn unit-based awards under the LTIP, which provide long-term incentives that are intended to encourage the achievement of superior results over time and to align the interests of executive officers with those of our unitholders.
To ensure that the total compensation package we offer our executive officers is competitive, Meridian develops an assessment of market levels of compensation through both an analysis of survey data and information disclosed in peer companies’ public filings. While the Compensation Committee considers this data when assessing the reasonableness of our executive officers’ total compensation, it also considers a number of other factors including: (i) historical compensation levels, (ii) the specific role the executive plays within us, (iii) the individual performance of the executive, and (iv) the relative compensation levels among our executive officers. There is no pre-established policy or target for the Compensation Committee’s allocation of total compensation between long-term compensation in the form of LTIP awards and short-term compensation in the form of base salary and EICP awards. The allocation is at the discretion of the Compensation Committee and generally is based upon an analysis of how our peer companies use long-term and short-term compensation to compensate their executive officers. Each year the Compensation Committee reviews this peer company data when setting EICP targets and LTIP awards for that year but also considers other factors when granting LTIP awards, including our performance and the individual Named Officer’s performance.
120
Item 11. Executive Compensation - Continued
2012 Executive Compensation Components
For 2012, the principal components of compensation for our Named Officers were:
• | short term compensation: |
• | base salary |
• | employee incentive compensation plan |
• | long-term equity compensation in the form of restricted units |
• | other benefits |
Short Term Compensation
Base Salary
We provide Named Officers and other employees with a base salary to provide them with a reasonable base level of monthly income relative to their role and responsibilities. Each of our Named Officers has an employment agreement that provides for a minimum level of base salary and upward adjustments at the discretion of our board of directors. For a summary of the material terms of the Named Officers’ employment agreements, please see “-Narrative Disclosure to the 2012 Summary Compensation Table.”
Salary levels are typically considered annually as part of our performance review process as well as upon a promotion or other change in job responsibilities. During its review of base salaries for executive officers, the Compensation Committee primarily considers:
• | survey and published peer data provided by the Compensation Committee’s independent compensation consultant; |
• | internal review of the executive’s compensation, both individually and relative to other executive officers; and |
• | recommendations by our Chairman, President and Chief Executive Officer. |
For 2012, reviewing peer data and considering the other factors mentioned above under “-Compensation Strategy,” the Compensation Committee increased the base salary of each of our Named Officers to maintain base salary around the median of our peers.
Employee Incentive Compensation Program
EICP Award Targets
Our EICP is an annual cash incentive program which provides guidelines for the calculation of annual cash incentive-based compensation. The EICP program is intended to focus on and reward achievement of near-term financial, operating and strategic priorities that we believe drive long-term value for unitholders. The Compensation Committee reviews peer data in setting EICP award targets and for 2012, using peer data as a guide, set EICP award targets for each Named Officer as a percentage of base salary.
EICP award targets for our Named Officers in 2012 were set as follows:
Named Officer | % of Base Salary | |
Mark E. Ellis | 100% | |
Kolja Rockov | 90% | |
Arden L. Walker, Jr. | 90% | |
Charlene A. Ripley | 80% | |
David B. Rottino | 80% | |
Performance Measures
In early 2012, the Compensation Committee established (i) targets for quantitative performance measures based on our 2012 budget targets and budget ranges (other than unitholder return) and (ii) qualitative strategic pathways designed to align with our strategy and future vision for us. To ensure the right level of focus on the quantitative financial measures, the
121
Item 11. Executive Compensation - Continued
Compensation Committee decided to weight the quantitative measures at 65% and the qualitative measures at 35% in the determination of the total EICP payout.
To provide the Compensation Committee the flexibility it needs to adjust for and react to macroeconomic events, such as dramatic changes in commodity prices or volatile capital markets, or to consider our performance not otherwise reflected in the pre-established performance measures, the Compensation Committee prefers not to rely on a formulaic approach based on pre-established thresholds resulting in automatic payouts. The Compensation Committee always retains discretion to determine awards as it thinks appropriate given all the circumstances at the time of award. See “-Actual Results” below for the specific 2012 quantitative performance measures and budget targets and the qualitative strategic pathways. To determine the EICP payout levels for 2012, the Compensation Committee reviewed (i) our performance on the quantitative performance measures described below and (ii) our progress on and achievement of the qualitative strategic pathways.
Quantitative Performance Measures
For 2012, 65% percent of each Named Officer’s EICP award opportunity was based on our performance with respect to the following measures set at the beginning of 2012:
a) | Operations - measured by actual production volumes, total cash costs (including lease operating expenses and general and administrative expenses) and cash costs on a per-unit basis, each as compared to our budget; |
b) | Ability to Pay Distribution - measured by: |
1. | Our cash flow per unit (defined as adjusted EBITDA less interest expense divided by the number of units outstanding) compared to our budget for 2012; and |
2. | Our Distribution Coverage Ratio as compared to our budget. Distribution Coverage Ratio was defined as Distributable Cash Flow for 2012 divided by total cash distributions. Distributable Cash Flow was defined as adjusted EBITDA (defined below) less cash interest expense and maintenance capital. |
c) | Relative Unitholder Return - measured by our total return for fiscal year 2012 compared to that of a peer group of energy master limited partnerships, selected due to management’s and the Compensation Committee’s view that these companies most closely align with the peer group considered by analysts and investors when comparing our total return. The Compensation Committee selected the following peer group for comparison of total return: EV Energy Partners, L.P., Inergy, L.P., Buckeye Partners, L.P., El Paso Pipeline Partners, L.P., BreitBurn Energy Partners L.P., Magellan Midstream Partners, L.P. and NuStar Energy L.P. |
We defined adjusted EBITDA as net income (loss) plus the following adjustments:
• | Net operating cash flow from acquisitions and divestitures, effective date through closing date; |
• | Interest expense; |
• | Depreciation, depletion and amortization; |
• | Impairment of long-lived assets; |
• | Write off of deferred financing fees; |
• | (Gains) losses on sale of assets and other, net; |
• | Provision for legal matters; |
• | Loss on extinguishment of debt; |
• | Unrealized (gains) losses on commodity derivatives; |
• | Unrealized (gains) losses on interest rate derivatives; |
• | Realized (gains) losses on interest rate derivatives; |
• | Realized (gains) losses on canceled derivatives; |
• | Realized gains on recovery of bankruptcy claim; |
• | Unit-based compensation expenses; |
• | Exploration costs; and |
• | Income tax expense (benefit). |
122
Item 11. Executive Compensation - Continued
In setting the measures in January 2012, the Compensation Committee determined that the measures above should be weighted equally because the Compensation Committee believed that each was a factor important to our overall performance and none should be given more importance or weight than the others. See “-Actual Results” below for how the Compensation Committee actually considered the objectives.
Qualitative Strategic Pathways
The other 35% of the EICP award opportunity was based on our achievement of or progress made on the following qualitative strategic pathways, which were recommended by management and reviewed by the Compensation Committee in January 2012:
• | Consistent Operational Results and Execution; |
• | Acquisitions Excellence; |
• | Culture-People Development and Growth; and |
• | Access to Capital/Optimizing Capital Structure. |
Actual Results
65% of the total EICP award opportunity is allocated to the quantitative performance measures described above. Upon completion of the fiscal year, the Compensation Committee reviewed and assessed our performance for each quantitative measure relative to our original budget, as revised throughout the year (other than unitholder return), and made a subjective determination with respect to our achievement as compared to those metrics.
Results for 2012 were as follows:
Original Budget Target | Revised Budget Target* | Revised Budget Range* | 2012 Estimated Performance as of January 2013 1 | ||||||||||
Operations | |||||||||||||
Volumes (MMcfe/day) | 524 | 692 | 640-744 | 671 | |||||||||
Total Cash Costs (Lease Operating Expenses and General and Administrative Expenses) (in millions) | $ | 406 | $ | 477 | $ 453-501 | $ | 463 | ||||||
Cash Costs per Mcfe (Lease Operating Expenses and General and Administrative Expenses) ($/Mcfe) | $ | 2.12 | $ | 1.89 | $ 2.03-1.75 | $ | 1.89 | ||||||
Ability to Pay Distributions | |||||||||||||
Cash Flow/Unit | $ | 4.40 | $ 3.96-4.84 | $ | 5.06 | ||||||||
Distribution Coverage Ratio | 1.03x | .93x-1.13x | 1.14x | ||||||||||
_______________________
* | Budget targets and ranges were updated throughout the year to reflect acquisition activity. |
(1) | The Compensation Committee based its decisions on estimates of 2012 performance available at the January 2013 Compensation Committee meeting. Actual final results were released in our Annual Report on Form 10-K for the year ended December 31, 2012 and our Earnings Release, filed on Current Report on Form 8-K, each filed on February 21, 2013. |
123
Item 11. Executive Compensation - Continued
Relative Unitholder Return
The below chart reflects our unitholder return in 2012, over the last three years and over the last five years.
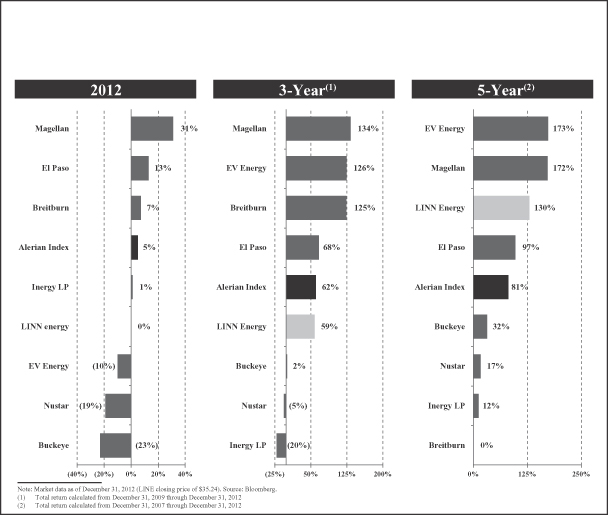
This information was compiled by us using publicly available information. The charts above do not represent the annual performance graph required by Item 201(e) of Regulation S-K, which can be found in Item 5 of our Annual Report on Form 10-K.
The Compensation Committee then reviewed our performance relative to the qualitative strategic pathways, which comprise the other 35% of the total EICP award opportunity, and determined that we had outstanding success with respect to all objectives.
Objective | Outstanding Results | |
Consistent Operational Results and Execution | ü | |
Acquisitions Excellence | ü | |
Culture - People Development and Growth | ü | |
Access to Capital/Optimizing Capital Structure | ü | |
In its consideration of the quantitative measures, the Compensation Committee noted that the budget targets changed significantly throughout the year as a result of acquisitions, so in evaluating the final results, the Compensation Committee
124
Item 11. Executive Compensation - Continued
considered both the original and revised budget targets. In reviewing the quantitative measures, the Compensation Committee focused on:
(1) | the Company significantly exceeding budget targets in cash flow per unit and distribution coverage ratio demonstrating profitable growth in 2012; |
(2) | our overall significant increase in volumes despite the Company falling short of targets that were revised to account for acquisitions; |
(3) | our decrease in costs on a per-unit basis which will continue to enhance our profitability; and |
(4) | given that unit price can fluctuate substantially, our positive total unitholder return relative to our peer group over the past five years as opposed to a return measured at one point in time. |
In reviewing the qualitative measures, the Compensation Committee reviewed examples of our success in each category and focused on:
(1) | our ability to source, execute, close and integrate accretive acquisition opportunities which resulted in a total of approximately $2.9 billion in asset acquisitions closed throughout 2012; |
(2) | our innovative approach to accessing new sources of capital through the creation and successful IPO of LinnCo; |
(3) | our focus on maintaining a strong corporate culture while rapidly growing the Company, thereby allowing us to continue to attract and retain key employees; |
(4) | our focus on growing new leaders from within the Company through extensive leadership training and development for key personnel; |
(5) | our success in capital program execution and our maintenance of safe and environmentally sound operations; and |
(6) | our expanded involvement with our community commensurate with our underlying growth. |
After reviewing the results of the quantitative and qualitative measures with a focus on the above-mentioned factors, and comparing our overall performance in 2012 with our performance in 2011, the Compensation Committee also used subjective discretion and determined that an overall award of 185% of each Named Officer’s EICP award target was appropriate.
Generally, the Compensation Committee believes that our performance is a reflection of executive officer performance in total. The Compensation Committee may, however, apply discretion upward or downward to reflect individual performance. For 2012, the Compensation Committee did not make any differentiation in EICP awards due to individual performance; thus each Named Officer received approximately 185% of his or her EICP award target. As an example, Mr. Rockov, whose EICP award target was 90% of his base salary, received an award of approximately 166.5% of his base salary.
Long-Term Incentive Compensation
Our LTIP encourages participants to focus on our long-term performance and provides an opportunity for executive officers and other employees to increase their stake in us through grants of our units based on a three-year vesting period. Long-term incentive awards benefit us by:
• | enhancing the link between the creation of unitholder value and long-term executive incentive compensation; |
• | maintaining significant forfeitable equity stakes among executives thereby fostering retention; and |
• | maintaining competitive levels of total compensation. |
LTIP awards are typically made in January and have been intended primarily as forward-looking long-term incentives; however, the Compensation Committee considers our performance in the prior year in determining the size of the award. In determining the size of the awards generally, the Compensation Committee uses peer data as a guide and targets the total value of each grant such that each Named Officer’s LTIP award, when combined with base salary and bonus, would place the executives’ total direct compensation between the median and 75th percentile of similarly-situated executives in our compensation peer group. The Compensation Committee always has discretion to award above the 75th percentile in years where it determines that exceptional performance is achieved and below the median of the peer group in years of poor performance or when economic conditions dictate.
125
Item 11. Executive Compensation - Continued
In determining the individual awards, the Compensation Committee considered the market data, our outstanding performance for the previous year, its subjective evaluation of the individual performances of each Named Officer and how that Named Officer contributed to our achievement of quantitative and qualitative performance measures.
The Compensation Committee typically grants all of its awards as restricted units. The Compensation Committee believes that granting restricted units results in a simple, straightforward LTIP program and closely aligns us with how other energy master limited partnerships are currently using long-term incentive awards. Because our Named Officers receive distributions on vested and unvested units at the same rate as all of our unitholders, the Compensation Committee believes that restricted units closely align management’s interests with those of our unitholders, by providing incentive to maintain or increase the level of distributions. Restricted unit grants made in January 2012 fell in line with the Compensation Committee’s usual practice of awarding at levels to place total compensation between the median and 75th percentile.
In October 2012, the Compensation Committee approved a grant of unit options to Named Officers to recognize and reward the creativity and effort involved in the success of the IPO of LinnCo and to act as a retentive tool over the life of the options (“Special Incentive Options”). The Compensation Committee further believes that the options align senior management with the success of the LinnCo IPO and incentivize management to increase unitholder value over the next three to seven years. The options were granted at the closing price of our units on the date of the pricing of the LinnCo IPO. The options have three-year cliff vesting, expire in seven years and Named Officers do not receive distributions on the units underlying the options.
In January 2013, the Compensation Committee approved restricted unit grants to the Named Officers contingent upon approval of the LTIP Amendment by unitholders. These grants were consistent with the Compensation Committee’s usual practice of awarding at levels to place total compensation between the median and 75th percentile. In addition, in October 2013, the committee committed to granting some portion of equity awards with performance based vesting beginning with grants made in 2014.
Restricted Unit Awards
Under the terms of our LTIP, restricted units are subject to a vesting period of at least three years and contain such other terms as the Compensation Committee may determine. For our Named Officers, our Executive Restricted Unit Grant Agreement provides for vesting in equal installments over three years and provides that upon termination of employment with us (a) by us other than for Cause, (b) by the officer with Good Reason or (c) by reason of death, disability or retirement (as those terms are defined herein under “-Payments Made Upon Termination Without Cause or For Good Reason”), all restrictions lapse and the grant immediately vests in full.
Participants, including Named Officers, who receive restricted unit grants under the LTIP receive distributions on all the units awarded (whether vested or unvested), with the units being retained in our transfer agent’s custody and subject to restrictions on sale or transfer until vested. The Compensation Committee does not include amounts received from cash distributions in its calculations of total direct compensation for comparison to our compensation peer group.
Option Awards
Options, when awarded, are awarded at the NASDAQ closing price of our units on the date of the grant. The Compensation Committee has never granted options with an exercise price that is less than the closing price of our units on the grant date, nor has it granted options which are priced on a date other than the grant date.
Other than the Special Incentive Options described above, Named Officer options granted by the Compensation Committee generally vest in equal installments over the first three years of the ten-year option term, with the vesting date scheduled in January of each year. Upon termination of the Named Officer’s employment with us (a) other than for Cause, (b) by the grantee with Good Reason, or (c) by reason of death, disability or retirement (as those terms are defined herein under “-Payments Made Upon Termination Without Cause or For Good Reason”), the option grant automatically and immediately vests in full. Prior to the exercise of a unit option, the holder has no rights as a unitholder with respect to the units subject to such unit option, including voting rights or the right to receive distributions.
126
Item 11. Executive Compensation - Continued
Unit Ownership Guidelines
In August 2009, the Compensation Committee adopted minimum unit ownership guidelines for our executive officers and independent directors. Each of our Named Officers is required to own such number of units representing a value that is the multiple of his or her base salary listed below:
• | Chairman, President and Chief Executive Officer: 5 times base salary |
• | Executive Vice Presidents: 4 times base salary |
• | Senior Vice Presidents: 3 times base salary |
Our independent directors are required to own units representing a value that is three times the annual cash retainer for independent directors. The calculation of the applicable number of units is determined as of the last day of the fiscal year based on the average high and low closing price of our units on the NASDAQ for the prior 12 months and salary or cash retainer in effect as of the last day of the year. The Compensation Committee has discretion to allow sufficient time to permit the Named Officer or director to regain compliance with these guidelines should he or she fall out of compliance due to fluctuating unit price. The Compensation Committee believes that continued unit ownership by executives and independent directors helps tighten the alignment among the interests of board members, executives and unitholders and demonstrate the Named Officers’ and directors’ confidence in us.
Restrictions on Pledging and Derivative Transactions
In January 2013, our board of directors approved certain amendments to our Policy on Trading in Securities which (i) restrict a Named Officer from pledging any of our securities that are subject to the Unit Ownership Guidelines described above and (ii) prohibit any kind of derivative transaction involving our or LinnCo securities.
Other Benefits
Termination Arrangements and Change in Control Provisions
We maintain employment agreements with our Named Officers to encourage their continued service during the term of the agreement. These agreements are described in more detail elsewhere in this annual report. See “-Narrative Disclosure to the 2012 Summary Compensation Table.” These agreements provide for severance compensation to be paid if the officer’s employment is terminated under certain conditions as outlined in the applicable agreement, such as following a change in control, termination by us without cause, termination by the Named Officer for Good Reason, termination by us for “cause,” death or disability.
The employment and other compensatory agreements between us and our Named Officers and the related severance provisions are designed to meet the following objectives:
• | Change of Control. In certain scenarios, a merger or acquisition of us by another person may be in the best interests of our unitholders. We provide severance compensation to the Named Officers if such officer’s employment terminates following a change of control transaction to promote the ability of the officer to act in the best interests of our unitholders even though his or her employment could be terminated as a result of the transaction. |
• | Termination without Cause. If we terminate the employment of certain executive officers “without cause” as defined in the applicable agreement, we are obligated to pay the officer certain compensation and other benefits as described in greater detail in “-Potential Payments Upon Termination or Change of Control” below. We believe these payments are appropriate because the terminated officer is generally bound by confidentiality obligations for five years, and nonsolicitation and non-compete provisions for one year after termination. Both parties have mutually agreed to severance terms that would be in place prior to any termination event. This provides us with more flexibility to make a change in senior management if such a change is in our best interests of us and that of our unitholders. |
Perquisites
We believe in a simple, straight-forward compensation program and as such, Named Officers have not in the past been provided unique perquisites or other personal benefits. The Compensation Committee periodically reviews our charitable contributions, the use of aircraft, vehicles and potential perquisites that could result in personal benefits to our Named Officers. Other than as described below, consistent with the Compensation Committee’s general strategy, no perquisites or other personal benefits exceeded $10,000 for any of our Named Officers in 2012.
127
Item 11. Executive Compensation - Continued
Private Aircraft
Other than our Chairman, President and Chief Executive Officer, Named Officers and employees are discouraged from personal use of company leased aircraft. In an effort to provide for maximum efficiency and security in travel, the Compensation Committee elected to provide 25 hours of flight time on company paid private aircraft in 2012 to our Chairman, President and Chief Executive Officer, at an approximate value of $100,000.
Tax Preparation
In January 2012, in an effort to provide for consistent personal income tax treatment among our Named Officers, the Compensation Committee authorized reimbursement, in an amount up to $10,000 per year, for personal income tax preparation services for each of our Named Officers.
Retirement Savings Plan
All employees, including our Named Officers, may participate in our Retirement Savings Plan, or 401(k) Plan. We provide this plan to help our employees save for retirement in a tax-efficient manner. Employees, including Named Officers, can contribute the maximum amount allowed by law. We currently make a matching contribution equal to 100% of the first 6% of eligible compensation contributed by the employee on a before-tax basis. As contributions are made throughout the year, plan participants become fully vested in the amounts contributed.
Nondiscriminatory Health and Welfare Benefits
All eligible employees, including our Named Officers, may participate in our health and welfare benefit programs, including medical, dental and vision care coverage, disability insurance and life insurance.
Tax and Accounting Implications
Code Section 162(m). Section 162(m) of the Code generally disallows a tax deduction to public companies for compensation over $1 million paid to the principal executive officer, the principal financial officer and the three additional most highly compensated executive officers of a company (other than the principal executive officer or the principal financial officer), as reported in that company’s most recent proxy statement. Qualifying performance-based compensation is not subject to the deduction limit if certain requirements are met. As part of its role, the Compensation Committee reviews and considers the deductibility of executive compensation; however, due to our status as a publicly traded partnership for tax purposes rather than a publicly held corporation, we believe that the provisions of Section 162(m) are inapplicable to us.
Code Section 280G and Code Section 4999. We consider the impact of Sections 280G and 4999 of the Code in determining our post-termination compensation, and provide reimbursement for any excise tax, interest and penalties incurred if payments or benefits received due to a change of control would be subject to an excise tax under Section 4999 of the Code.
Code Section 409A. Section 409A of the Code provides that deferrals of compensation under a nonqualified deferred compensation plan or arrangement are to be included in an individual’s current gross income to the extent that such deferrals are not subject to a substantial risk of forfeiture and have not previously been included in the individual’s gross income, unless certain requirements are met. We structure our executive officer employment agreements, change of control plan and incentive plans, each to the extent they are subject to Section 409A, to be in compliance with Section 409A.
Accounting for Unit-Based Compensation. We recognize expense for unit-based compensation over the requisite service period, in an amount equal to the fair value of unit-based payments granted.
Unitholder Advisory Vote on Executive Compensation
In 2011, our unitholders approved a triennial non-binding advisory vote on executive compensation. As such, we had no advisory vote on executive compensation at our 2012 Annual Meeting.
Summary Description of the Linn Energy, LLC Long-Term Incentive Plan
The LTIP consists of five components: unit options, unit grants, restricted units, phantom units and unit appreciation rights. Any of our or our affiliates’ employees, consultants or directors are eligible to participate in the LTIP. As of September 30, 2013, we had approximately 1,300 participants in the LTIP, comprised of approximately 1,294 employees (including officers) and six directors, and all employees and directors are eligible to participate. The LTIP currently limits the total number of units that may be delivered pursuant to all types of awards to 12,200,000 units. If any award expires or is canceled, forfeited,
128
Item 11. Executive Compensation - Continued
exercised, paid or otherwise terminated without the delivery of units, then the units covered by such award are available for delivery pursuant to other awards. Units withheld to satisfy exercise prices or tax withholding obligations are not available for delivery pursuant to other awards and units underlying a unit appreciation right will not be available for future grant following unit-settled exercise of the unit appreciation right.
Unit Options. A unit option is a right to purchase a unit at a specified price. The Compensation Committee may make option grants under the plan to officers, employees and members of our board of directors containing such terms as the committee shall determine. Unit options will have an exercise price that will not be less than the fair market value of the units on the date of grant. The LTIP prohibits repricing of unit options. In general, unit options granted will become exercisable over a period determined by the Compensation Committee. In addition, the unit options will become exercisable upon a change in control of us, unless provided otherwise by the Compensation Committee. If a grantee’s employment, consulting relationship or membership on our board of directors terminates for any reason, the grantee’s unvested unit options will be automatically forfeited unless, and to the extent, the option agreement or the Compensation Committee provides otherwise.
Upon exercise of a unit option (or a unit appreciation right, as defined below, settled in units), we will issue new units, acquire units on the open market or directly from any person or use any combination of the foregoing, in the Compensation Committee’s discretion. If we issue new units upon exercise of the unit options (or a unit appreciation right settled in units), the total number of units outstanding will increase. The availability of unit options and unit appreciation rights is intended to furnish additional compensation to employees and members of our board of directors and to align their economic interests with those of unitholders.
As of September 30, 2013, there were 4,195,630 units subject to outstanding unit options granted from the LTIP. The weighted average exercise price of the outstanding unit options is $35.37 and the weighted average remaining contractual life of such outstanding options is 5.53 years.
Unit Grants. A unit grant is the grant of an unrestricted unit, meaning a unit that vests immediately upon issuance. The Compensation Committee may make unit grants under the plan to officers, employees and members of our board of directors. There were no outstanding unit grants that were unvested or otherwise subject to forfeiture as of September 30, 2013.
Restricted Units and Performance Based Restricted Units. A restricted unit is a unit that vests over a period of time and that during such time is subject to forfeiture. The Compensation Committee may make grants of restricted units under the plan to officers, employees and directors containing such terms as the Compensation Committee shall determine. The Compensation Committee will determine the period over which restricted units (and distributions related to such units) will vest. Generally, the Compensation Committee elects to grant restricted units that vest equally over a three year period. In certain circumstances, the committee may elect a shorter vesting period. The committee may base its determination upon the achievement of specified performance objectives. While the committee has not previously elected to grant restricted units with performance based vesting, the committee is considering the implementation of such a performance based vesting beginning with grants made in 2014. In addition, the restricted units will vest upon a change of control of us, as defined in the plan, unless provided otherwise by the committee. If a grantee’s employment, consulting relationship or membership on our board of directors terminates for any reason, other than death, the grantee’s restricted units will be automatically forfeited unless, and to the extent, the Compensation Committee or the terms of the award agreement provide otherwise.
Units to be delivered as restricted units may be units issued by us, units acquired by us in the open market, units already owned by us, units acquired by us from any other person or any combination of the foregoing. If we issue new units upon the grant of the restricted units, the total number of units outstanding will increase. We intend the restricted units under the plan to serve as a means of incentive compensation for performance. Therefore, plan participants will not pay any consideration (other than services) for the units they receive, and we will receive no remuneration (other than services) for the units.
As of September 30, 2013, there were 1,619,109 restricted units outstanding under the LTIP. The weighted average period over which such outstanding restricted units is expected to vest is 1.61 years.
Phantom Units and Performance Based Phantom Units. A phantom unit entitles the grantee to receive a unit upon the vesting of the phantom unit or, in the discretion of the Compensation Committee, cash equivalent to the value of a unit. The Compensation Committee may make grants of phantom units under the LTIP to officers, employees and directors containing such terms as the Compensation Committee shall determine. The Compensation Committee will determine the period over which phantom units will vest, subject to applicable minimum vesting periods except with respect to phantom unit grants to nonemployee directors. The Compensation Committee may base its determination upon the achievement of specified financial objectives. In addition, the phantom units will vest upon a change of control of us, unless provided otherwise by the
129
Item 11. Executive Compensation - Continued
Compensation Committee. If a grantee’s employment, or membership on our board of directors terminates for any reason, other than death or retirement, the grantee’s phantom units will be automatically forfeited unless, and to the extent, the Compensation Committee or the terms of the award agreement provide otherwise.
Units to be delivered upon the vesting of phantom units may be units issued by us, units acquired by us in the open market, units already owned by us, units acquired by us from any other person or any combination of the foregoing. If we issue new units upon vesting of the phantom units, the total number of units outstanding will increase. The Compensation Committee may grant tandem distribution equivalent rights with respect to phantom units that entitle the holder to receive cash equal to any cash distributions made on units while the phantom units are outstanding. We intend the issuance of any units upon vesting of the phantom units under the LTIP to serve as a means of incentive compensation for performance. Therefore, LTIP participants will not pay any consideration (other than services) for the units they receive, and we will receive no remuneration (other than services) for the units.
As of September 30, 2013, there were 85,420 unvested phantom units outstanding under the LTIP. The weighted average period over which such outstanding phantom units are expected to vest is 2.38 years.
Unit Appreciation Rights. A unit appreciation right is an award that, upon exercise, entitles the participant to receive the excess of the fair market value of a unit on the exercise date over the exercise price established for the unit appreciation right. Such excess may be paid in units, cash or a combination thereof, as determined by the Compensation Committee in its discretion. In the future, the Compensation Committee may make grants of unit appreciation rights under the plan to employees, consultants and directors containing such terms as the Compensation Committee shall determine. Unit appreciation rights will have an exercise price that will not be less than the fair market value of the units on the date of grant. In general, unit appreciation rights will become exercisable over a period determined by the Compensation Committee. In addition, the unit appreciation rights will become exercisable upon a change in control of us, unless provided otherwise by the Compensation Committee. If a grantee’s employment or membership on our board of directors terminates for any reason, the grantee’s unvested unit appreciation rights will be automatically forfeited unless, and to the extent, the grant agreement or Compensation Committee provides otherwise. As of September 30, 2013, we had not granted any unit appreciation rights under the LTIP.
United States Federal Income Tax Consequences
The following summary is based on an analysis of the Internal Revenue Code as currently in effect, which is subject to change, including retroactively. The summary is for general information only and is intended to summarize briefly the U.S. federal tax consequences to participants arising from participation in the LTIP. Actual tax consequences may vary depending on the particular situation and may, therefore, be subject to special rules not discussed below. No attempt has been made to discuss any potential foreign, state, or local tax consequences. In addition, unit options or unit appreciation rights that provide for a “deferral of compensation” within the meaning of Section 409A, phantom units, and certain other awards that may be granted pursuant to the LTIP could be subject to additional taxes unless they are designed to comply with certain restrictions set forth in Section 409A and the guidance promulgated thereunder.
Unit Options; Unit Appreciation Rights. Participants will not realize taxable income upon the grant of a unit option or a unit appreciation right. Upon the exercise or, if later, the settlement of a unit option or a unit appreciation right, a participant will recognize ordinary compensation income (subject to withholding) in an amount equal to the excess of (i) the amount of cash or the fair market value of the units received, over (ii) the exercise price (if any) paid therefor. A participant will generally have a tax basis in any units received pursuant to the exercise of a unit appreciation right, or pursuant to the cash exercise of a unit option, that equals the fair market value of the units on the date of exercise. Subject to the below discussion, we expect to receive a deduction for federal income tax purposes that corresponds as to timing and amount with the compensation income recognized by a participant under the foregoing rules.
When a participant sells the units acquired as a result of the exercise of a unit option or unit appreciation right, any appreciation (or depreciation) in the value of the units after the exercise date is treated as long- or short-term capital gain (or loss) for federal income tax purposes, depending on the holding period. The units must be held for more than 12 months in order to qualify for long-term capital gain treatment.
Phantom Units; Restricted Units; Other Awards. A participant will recognize ordinary compensation income upon receipt of cash pursuant to a cash award or, if earlier, at the time the cash is otherwise made available for the participant to draw upon. A participant will not have taxable income at the time of a grant of an award in the form of a phantom unit award, but rather, will generally recognize ordinary compensation income at the time he receives units or a cash payment in satisfaction of the
130
Item 11. Executive Compensation - Continued
phantom unit award in an amount equal to the fair market value of the units received or the cash payment, whichever is applicable. In addition, the participant will be subject to ordinary income tax upon the payment of any distribution equivalents. In general, a participant will recognize ordinary compensation income as a result of the receipt of units pursuant to a restricted unit award or a unit award in an amount equal to the fair market value of the units when the units are received, provided, that if the units are not transferable or are subject to a substantial risk of forfeiture when received, the participant will recognize ordinary compensation income in an amount equal to the fair market value of the units (i) when the units first become transferable or are no longer subject to a substantial risk of forfeiture, in cases where a participant does not make a valid election under Section 83(b) of the Code, or (ii) when the units are received, in cases where a participant makes a valid election under Section 83(b) of the Code.
A participant who is an employee will be subject to withholding for federal, and generally for state and local, income taxes at the time he recognizes income under the rules described above with respect to units or cash received. Directors and consultants must make their own arrangements for satisfying any tax obligations they may incur in connection with the receipt of an award under the LTIP. Distributions that are received by a participant prior to the time that the units are taxed to the participant under the rules described in the preceding paragraph are taxed as additional compensation, not as distributions on units. The tax basis in the units received by a participant will equal the amount recognized by him as compensation income under the rules described in the preceding paragraph, and the participant’s capital gains holding period in those units will commence on the date of receipt of the units.
Subject to the below discussion, we expect to receive a deduction for federal income tax purposes that corresponds as to timing and amount with the compensation income recognized by a participant under the foregoing rules.
Tax Code Limitations on Deductibility. In order for the amounts described above to be deductible by us, or one of our affiliates, the amounts must constitute reasonable compensation for services rendered or to be rendered and must be ordinary and necessary business expenses.
Limited Partnership Interest. We are not intended to be a taxable entity, and as such, we do not expect to incur any federal income tax liability. Instead, each holder of our units is required to report on his income tax return his share of our income, gains, losses and deductions in computing his federal income tax liability, regardless of whether cash distributions are made to him by us. Distributions by us to a holder of our units are generally not taxable unless the amount of cash distributed is in excess of the holder’s adjusted basis in his interest. Usually at the beginning of each year, we will mail to each unitholder a Schedule K-1 showing the amounts of income, gains, losses, and deductions that the unitholder is required to reflect on his federal income tax return as a unitholder for the preceding year. A unitholder will not qualify for using Form 1040EZ or 1040A, and may not file his federal income tax return until he has received his Schedule K-1 and reflected the relevant information contained therein in his tax return.
New Plan Benefits. The benefits or amounts that may be received or allocated to participants under the LTIP for future periods will be determined at the discretion of the Compensation Committee and are not determinable at this time. On January 23, 2013, the Compensation Committee approved an award of 5,205 restricted units to each of our non-employee directors, which award for each non-employee director had a grant date fair value (as determined in accordance with FASB ASC Topic 718) of $198,258. The following table sets forth the benefits and amounts that were allocated in 2012 to the following: (i) our Named Executive Officers (“Named Officers”) individually; (ii) our Named Officers as a group; (iii) all current directors who are not executive officers as a group; and (iv) all employees, including all current officers and executive officers who are not Named Officers, as a group:
131
Item 11. Executive Compensation - Continued
Name and Position | Number of Units Subject to Options Granted in 2012 (#) | Number of Restricted Units Granted in 2012 (#) | Grant Date Fair Value of Awards Granted in 2012 ($) (1) | ||||||
Mark E. Ellis, Chairman, President and Chief Executive Officer | 950,000 | 136,277 | 10,124,242 | ||||||
Kolja Rockov, Executive Vice President and Chief Financial Officer | 400,000 | 54,511 | 4,155,890 | ||||||
Arden L. Walker, Jr., Executive Vice President and Chief Operating Officer | 400,000 | 54,511 | 4,155,890 | ||||||
Charlene A. Ripley, Senior Vice President and General Counsel | 300,000 | 32,707 | 2,812,107 | ||||||
David B. Rottino, Senior Vice President of Finance, Business Development and Chief Accounting Officer | 300,000 | 32,707 | 2,812,107 | ||||||
Named Officer Group | 2,350,000 | 310,713 | 24,060,236 | ||||||
Non-Employee Director Group | — | 28,620 | 1,056,650 | ||||||
Non-Named Officer Employee Group | 1,050,000 | 707,257 | 29,816,566 | ||||||
_______________________
(1) | Represents the total amount of the grant date fair value for awards in accordance with valuation methodology in FASB ASC Topic 718. |
Securities Authorized for Issuance Under Equity Compensation Plans. The following summarizes information regarding the number of units that are available for issuance under all of our equity compensation plans as of December 31, 2012:
Plan Category | Number of Securities to be Issued upon Exercise of Outstanding Unit Options, Warrants and Rights (1) (a) (#) | Weighted Average Exercise Price of Outstanding Unit Options, Warrants and Rights (b) ($) | Number of Securities Remaining Available for Future Issuance Under Equity Compensation Plans (excluding securities reflected in column (a)) (c) (#) | |||||||
Equity Compensation Plans Approved by Security Holders | 4,642,805 | $ | 35.25 | 769,316 | ||||||
Equity Compensation Plans Not Approved by Security Holders | — | — | — | |||||||
Total | 4,642,805 | $ | 35.25 | 769,316 | ||||||
_______________________
(1) | Includes all unit options granted as of December 31, 2012, less all that have been exercised or canceled as of December 31, 2012. |
Compensation Committee Report
The Compensation Committee has reviewed and discussed the Compensation Discussion and Analysis required by Item 402(b) of Regulation S-K with management and, based on such review and discussions, the Compensation Committee recommended to the Board that the Compensation Discussion and Analysis be included in this annual report.
Submitted By:
Compensation Committee of Linn Energy, LLC
Jeffrey C. Swoveland, Chair
George A. Alcorn
David D. Dunlap
Joseph P. McCoy
132
Item 11. Executive Compensation - Continued
Notwithstanding anything to the contrary set forth in any of our previous or future filings under the Securities Act of 1933 or the Securities Exchange Act of 1934 that might incorporate this annual report or future filings with the SEC, in whole or in part, the preceding report shall not be deemed to be “soliciting material” or to be “filed” with the SEC or incorporated by reference into any filing except to the extent the foregoing report is specifically incorporated by reference therein.
2012 Summary Compensation Table
The following table sets forth certain information with respect to the compensation paid for the fiscal year ended December 31, 2012 to our Chief Executive Officer, our Chief Financial Officer and our three other most highly compensated executive officers (the Named Officers).
(a) Name and Principal Position | (b) Year | (c) Salary ($) | (d) Bonus ($) | (e) Unit Awards ($) (2) | (f) Option Awards ($) (2) | (g) Non-Equity Incentive Plan Compensation ($) (3) | (h) All other Compensation ($) (4) | (i) Total ($) (5) | |||||||||||||||
Mark E. Ellis | 2012 | 775,000 | — | 5,080,407 | 5,043,835 | 1,434,000 | 125,000 | 12,458,242 | |||||||||||||||
Chairman, President and Chief Executive Officer | 2011 | 750,000 | — | 7,201,460 | — | 1,000,000 | 79,700 | 9,031,160 | |||||||||||||||
2010 | 600,000 | — | 2,968,446 | — | 1,050,000 | 14,700 | 4,633,146 | ||||||||||||||||
Kolja Rockov | 2012 | 430,000 | — | 2,032,170 | 2,123,720 | 716,000 | 25,000 | 5,326,890 | |||||||||||||||
Executive Vice President and Chief Financial Officer | 2011 | 415,000 | — | 2,469,071 | — | 470,000 | 14,700 | 3,368,771 | |||||||||||||||
2010 | 315,000 | — | 1,113,180 | — | 470,000 | 14,700 | 1,912,880 | ||||||||||||||||
Arden L. Walker, Jr. | 2012 | 430,000 | — | 2,032,170 | 2,123,720 | 716,000 | 25,000 | 5,326,890 | |||||||||||||||
Executive Vice President and Chief Operating Officer | 2011 | 415,000 | — | 2,057,566 | — | 470,000 | 14,700 | 2,957,266 | |||||||||||||||
2010 | 300,000 | — | 788,514 | — | 345,000 | 14,700 | 1,448,214 | ||||||||||||||||
Charlene A. Ripley (1) | 2012 | 390,000 | — | 1,219,317 | 1,592,790 | 578,000 | 25,000 | 3,805,107 | |||||||||||||||
Senior Vice President and General Counsel | 2011 | 375,000 | — | 1,646,060 | — | 375,000 | 14,700 | 2,410,760 | |||||||||||||||
2010 | 300,000 | — | 742,111 | — | 360,000 | 14,700 | 1,416,811 | ||||||||||||||||
David B. Rottino | 2012 | 390,000 | — | 1,219,317 | 1,592,790 | 578,000 | 25,000 | 3,805,107 | |||||||||||||||
Senior Vice President of Finance, Business Development and Chief Accounting Officer | 2011 | 375,000 | — | 1,646,060 | — | 375,000 | 14,700 | 2,410,760 | |||||||||||||||
2010 | 275,000 | — | 602,980 | — | 315,000 | 14,700 | 1,207,680 | ||||||||||||||||
_______________________
(1) | Effective February 27, 2013, Ms. Ripley resigned her position as Senior Vice President and General Counsel. |
(2) | The amounts in columns (e) and (f) reflect the aggregate grant date fair value of awards granted under our LTIP, computed in accordance with FASB ASC Topic 718. Assumptions used in the calculation of these amounts are included in Note 5 to our audited consolidated financial statements for the fiscal year ended December 31, 2012, included in our Form 10-K. |
(3) | The amounts in column (g) reflect the cash awards approved by the Compensation Committee under our EICP for performance in 2010, 2011 and 2012. The 2010 amounts were not actually paid until February 2011, the 2011 amounts were not actually paid until February 2012 and the 2012 amounts were not actually paid until February 2013. |
(4) | For each Named Officer, the amount shown in column (h) reflects (1) matching contributions allocated by us to each of our Named Officers pursuant to the Retirement Savings Plan (which is more fully described under the heading “-Other Benefits”) and (2) $10,000 paid by us for reimbursement of certain tax preparation expenses. Mr. Ellis’s 2012 amount also includes $100,000 paid by us for personal usage of company-leased aircraft. |
(5) | Distributions paid during 2012 on issued, but unvested units pursuant to the equity awards are not shown in column (i) because the fair value shown in column (e) reflects the value of distributions. Distributions are paid to our Named |
133
Item 11. Executive Compensation - Continued
Officers at the same rate as all unitholders, currently $2.90 per unit on an annualized basis. Distributions paid in 2010, 2011 and 2012 are shown below.
Executive | 2012 ($) | 2011 ($) | 2010 ($) | ||||||
Mark E. Ellis | 857,810 | 814,447 | 531,471 | ||||||
Kolja Rockov | 319,989 | 317,393 | 265,106 | ||||||
Arden L. Walker, Jr. | 287,477 | 242,614 | 176,070 | ||||||
Charlene A. Ripley | 202,916 | 210,848 | 181,156 | ||||||
David B. Rottino | 197,708 | 189,200 | 162,359 | ||||||
Narrative Disclosure to the 2012 Summary Compensation Table
Mark E. Ellis, Chairman, President and Chief Executive Officer.
We entered into a First Amended and Restated Employment Agreement with Mr. Ellis, effective December 17, 2008, as amended effective January 1, 2010, that provides for an annual base salary not less than $600,000, subject to annual review and upward adjustment by the Compensation Committee. Mr. Ellis is entitled to receive incentive compensation payable at the discretion of the Compensation Committee. The Compensation Committee may set, in advance, an annual target bonus. Mr. Ellis is eligible for awards under the LTIP at the discretion of the Compensation Committee. Under the LTIP and the related grant agreements, Mr. Ellis receives distributions payable on all vested and unvested restricted units at the same rate as that paid to all unitholders, currently $2.90 per unit on an annualized basis.
Mr. Ellis’ agreement contains certain confidentiality and non-compete obligations that restrict his ability to compete with our business for up to one year following his termination, unless the termination occurs within the change of control period (as defined in the agreement).
Kolja Rockov, Executive Vice President and Chief Financial Officer.
We entered into a Third Amended and Restated Employment Agreement with Mr. Rockov, effective December 17, 2008, that provides for an annual base salary of not less than $285,000, subject to annual review and upward adjustment by the Compensation Committee. The remaining terms governing Mr. Rockov’s compensation under the agreement are the same as Mr. Ellis’s employment agreement.
Arden L. Walker, Jr., Executive Vice President and Chief Operating Officer.
We entered into a First Amended and Restated Employment Agreement with Mr. Walker, effective December 17, 2008, and as amended on April 26, 2011, that provides for an annual base salary of $415,000, subject to annual review and upward adjustment by the Compensation Committee. The remaining terms governing Mr. Walker’s compensation under the agreement are the same as Mr. Ellis’ employment agreement.
Charlene A. Ripley, Senior Vice President and General Counsel.
We entered into a First Amended and Restated Employment Agreement with Ms. Ripley, effective December 17, 2008, that provides for an annual base salary of $255,000, subject to annual review and upward adjustment by the Compensation Committee. The remaining terms governing Ms. Ripley’s compensation under the agreement are the same as Mr. Ellis’ employment agreement. Ms. Ripley’s agreement does not contain confidentiality and non-compete provisions. Effective February 27, 2013, Ms. Ripley resigned her position as our Senior Vice President and General Counsel.
David B. Rottino, Senior Vice President of Finance, Business Development and Chief Accounting Officer.
We entered into a Second Amended and Restated Employment Agreement with Mr. Rottino, effective December 17, 2008, that provides for an annual base salary of $235,000, subject to annual review and upward adjustment by the Compensation Committee. The remaining terms governing Mr. Rottino’s compensation under the agreement are the same as Mr. Ellis’ employment agreement.
Please read “-Quantification of Payments on Termination” for a summary of the compensation upon termination provisions of each Named Officer’s employment agreement.
134
Item 11. Executive Compensation - Continued
2012 Grants of Plan Based Awards
(a) Name | (c) Grant Date (1) | (e) Estimated Future Payouts Under Non- Equity Incentive Plan Awards Target ($) (2) | (g) All Other Unit Awards: Number of Units (#) | (h) All Other Option Awards: Number of Securities Underlying Options (#) | (i) Option Exercise Price ($/unit) | (j) Grant Date Fair Value of Unit and Option Awards ($) (3) | ||||||||||
Mark E. Ellis | 1/26/2012 | 775,000 | 136,277 | 5,080,407 | ||||||||||||
Mark E. Ellis | 10/11/2012 | 950,000 | 40.01 | 5,043,835 | ||||||||||||
Kolja Rockov | 1/26/2012 | 387,000 | 54,511 | 2,032,170 | ||||||||||||
Kolja Rockov | 10/11/2012 | 400,000 | 40.01 | 2,123,720 | ||||||||||||
Arden L. Walker, Jr. | 1/26/2012 | 387,000 | 54,511 | 2,032,170 | ||||||||||||
Arden L. Walker, Jr. | 10/11/2012 | 400,000 | 40.01 | 2,123,720 | ||||||||||||
Charlene A. Ripley | 1/26/2012 | 312,000 | 32,707 | 1,219,317 | ||||||||||||
Charlene A. Ripley | 10/11/2012 | 300,000 | 40.01 | 1,592,790 | ||||||||||||
David B. Rottino | 1/26/2012 | 312,000 | 32,707 | 1,219,317 | ||||||||||||
David B. Rottino | 10/11/2012 | 300,000 | 40.01 | 1,592,790 | ||||||||||||
_______________________
(1) | In each case, the grant date is the same as the date of Compensation Committee approval. |
(2) | In January 2012, the Compensation Committee set EICP targets for 2012 as a percentage of base salary. There is no threshold or maximum payout; the Compensation Committee has discretion to adjust the actual award above or below the target. The amount shown represents the payout at target; the actual awards for 2012 (awarded on January 23, 2013) are shown in column (g) of the Summary Compensation Table. |
(3) | The amounts shown in column (j) represent the grant date fair value for each award under FASB ASC Topic 718. Assumptions used in the calculation of these amounts are included in Note 5 to our audited consolidated financial statements for the fiscal year ended December 31, 2012, included in our Form 10-K. |
135
Item 11. Executive Compensation - Continued
Outstanding Equity Awards at December 31, 2012
Option Awards | Unit Awards | |||||||||||||||
Name | Units Underlying Unexercised Options Exercisable (#) | Number of Units Underlying Options Unexercisable (#) | Option Exercise Price ($) | Option Expiration Date (1) | Number of Units That Have Not Vested (#) | Market Value of Unvested Units ($) (2) | ||||||||||
Mark E. Ellis (3) | 50,000 | — | 32.18 | 12/18/2016 | ||||||||||||
Mark E. Ellis (3) | 50,000 | — | 23.61 | 12/18/2017 | ||||||||||||
Mark E. Ellis (3) | 125,000 | — | 21.70 | 1/29/2018 | ||||||||||||
Mark E. Ellis (3) | 135,765 | — | 15.95 | 2/4/2019 | ||||||||||||
Mark E. Ellis (7) | — | 950,000 | 40.01 | 10/11/2019 | ||||||||||||
Mark E. Ellis (4) | 38,788 | 1,366,889 | ||||||||||||||
Mark E. Ellis (5) | 124,345 | 4,381,918 | ||||||||||||||
Mark E. Ellis (6) | 136,277 | 4,802,401 | ||||||||||||||
Kolja Rockov (3) | 111,250 | — | 21.00 | 1/19/2016 | ||||||||||||
Kolja Rockov (3) | 85,000 | — | 27.94 | 12/6/2016 | ||||||||||||
Kolja Rockov (3) | 83,350 | — | 21.70 | 1/29/2018 | ||||||||||||
Kolja Rockov (3) | 88,625 | — | 15.95 | 2/4/2019 | ||||||||||||
Kolja Rockov (7) | — | 400,000 | 40.01 | 10/11/2019 | ||||||||||||
Kolja Rockov (4) | 14,546 | 512,601 | ||||||||||||||
Kolja Rockov (5) | 42,632 | 1,502,352 | ||||||||||||||
Kolja Rockov (6) | 54,511 | 1,920,968 | ||||||||||||||
Arden L. Walker Jr. (3) | 50,000 | — | 33.00 | 2/5/2017 | ||||||||||||
Arden L. Walker Jr. (3) | 45,850 | — | 21.70 | 1/29/2018 | ||||||||||||
Arden L. Walker Jr. (3) | 57,700 | — | 15.95 | 2/4/2019 | ||||||||||||
Arden L. Walker Jr. (7) | — | 400,000 | 40.01 | 10/11/2019 | ||||||||||||
Arden L. Walker Jr. (4) | 10,303 | 363,078 | ||||||||||||||
Arden L. Walker Jr. (5) | 35,527 | 1,251,971 | ||||||||||||||
Arden L. Walker Jr. (6) | 54,511 | 1,920,968 | ||||||||||||||
Charlene A. Ripley (3) | 30,000 | — | 35.00 | 4/11/2017 | ||||||||||||
Charlene A. Ripley (3) | 54,200 | — | 21.70 | 1/29/2018 | ||||||||||||
Charlene A. Ripley (3) | 58,075 | — | 15.95 | 2/4/2019 | ||||||||||||
Charlene A. Ripley (7) | — | 300,000 | 40.01 | 10/11/2019 | ||||||||||||
Charlene A. Ripley (4) | 9,697 | 341,722 | ||||||||||||||
Charlene A. Ripley (5) | 28,422 | 1,001,591 | ||||||||||||||
Charlene A. Ripley (6) | 32,707 | 1,152,595 | ||||||||||||||
David B. Rottino (3) | 50,000 | — | 24.29 | 6/9/2018 | ||||||||||||
David B. Rottino (3) | 42,240 | — | 15.95 | 2/4/2019 | ||||||||||||
David B. Rottino (7) | — | 300,000 | 40.01 | 10/11/2019 | ||||||||||||
David B. Rottino (4) | 7,879 | 277,656 | ||||||||||||||
David B. Rottino (5) | 28,422 | 1,001,591 | ||||||||||||||
David B. Rottino (6) | 32,707 | 1,152,595 | ||||||||||||||
_______________________
(1) | Except as otherwise indicated, options expire ten years from date of grant. |
(2) | Based on the closing sales price of our units on December 31, 2012 of $35.24. |
(3) | These unit options are fully vested as of the date of this annual report. |
(4) | These restricted unit awards vest in three equal installments on January 27, 2011, 2012, 2013. |
(5) | These restricted unit awards vest in three equal installments on January 28, 2012, 2013 and 2014. |
(6) | These restricted unit awards vest in three equal installments on January 26, 2013, 2014 and 2015. |
(7) | These unit options vest in full on January 19, 2016, and expire seven years from the date of grant. |
136
Item 11. Executive Compensation - Continued
2012 Option Exercises and Units Vested
Option Awards | Unit Awards | |||||||||||
(a) Name | (b) Number of Units Acquired on Exercise (#) | (c) Value Realized on Exercise ($) | (d) Number of Units Acquired on Vesting (#) | (e) Value Realized on Vesting ($) (1) | ||||||||
Mark E. Ellis (2) | — | — | 138,514 | 5,126,950 | ||||||||
Kolja Rockov (3) | — | — | 60,375 | 2,227,746 | ||||||||
Arden L. Walker, Jr. (4) | — | — | 44,027 | 1,626,418 | ||||||||
Charlene A. Ripley (5) | — | — | 39,973 | 1,475,078 | ||||||||
David B. Rottino (6) | — | — | 33,773 | 1,248,155 | ||||||||
_______________________
(1) | The value realized represents the total fair market value of the units on the vesting date reported as earned compensation during 2012. |
(2) | Mr. Ellis vested and sold 47,917 units to satisfy statutory federal payroll tax withholding requirements. |
(3) | Mr. Rockov vested and sold 19,418 units to satisfy statutory federal payroll tax withholding requirements. |
(4) | Mr. Walker vested and sold 13,474 units to satisfy statutory federal payroll tax withholding requirements. |
(5) | Ms. Ripley vested and sold 11,994 units to satisfy statutory federal payroll tax withholding requirements. |
(6) | Mr. Rottino vested and sold 9,742 units to satisfy statutory federal payroll tax withholding requirements. |
Pension Benefits
We do not provide pension benefits for our Named Officers or other employees. Retirement benefits are provided through the Retirement Savings Plan, as discussed previously.
Non-Qualified Deferred Compensation
We do not have a non-qualified deferred compensation plan. The Retirement Savings Plan is a 401(k) deferred compensation arrangement and a qualified plan under section 401(a) of the Internal Revenue Code (Code).
Potential Payments Upon Termination or Change in Control
Payments Made Upon Termination For Any Reason
Under each of our Named Officer’s employment agreement, regardless of the manner in which his or her employment terminates, the executive will be entitled to receive amounts earned (but unpaid) during his or her term of employment. Such amounts include:
• | earned, but unpaid base salary; |
• | unused vacation pay; |
• | amounts contributed and vested through our Retirement Savings Plan; and |
• | any other amounts that may be reimbursable by us to the Named Officer under his or her employment agreement. |
Payments Made Upon Termination Without Cause or for Good Reason
In addition to the payments described above, in the event of termination by us other than for “Cause” or termination by the executive for “Good Reason” except in the event of a change of control, each Named Officer’s employment agreement provides for severance payments equal to two times the Named Officer’s highest base salary in effect at any time during the 36 months prior to the date of the termination. Each Named Officer will also receive his earned, but unpaid EICP awards determined as follows:
(i) If the Named Officer was employed for the entire previous year but was terminated prior to the Compensation Committee finally determining his or her EICP award for the preceding year, then the Named Officer will be deemed to have been awarded 100% of his target EICP award for that year; or
(ii) If the Named Officer was employed for the entire previous year and the Compensation Committee had already finally determined the EICP award for the preceding year by the date of termination, but it had not yet been paid, then the Named Officer will receive the actual amount of the EICP award; plus, in either case an amount representing a pro-rata, deemed (assuming an award at 100% of his or her target) EICP award for the fiscal year in
137
Item 11. Executive Compensation - Continued
which the termination date occurs. We will also pay our portion of COBRA continuation coverage, as well as pay certain costs of continuing medical coverage after the expiration of the maximum required period under COBRA. The footnotes to the table below describe each Named Officer’s specific severance payments.
In addition, in the event of termination by the Company other than for “Cause” or termination by the Named Officer for “Good Reason,” all outstanding restricted unit and unit option awards will vest in full.
We will have “Cause” to terminate the Named Officer’s employment by reason of any of the following: (i) his or her conviction of, or plea of nolo contendere to, any felony or to any crime or offense causing substantial harm to us (whether or not for personal gain) or involving acts of theft, fraud, embezzlement, moral turpitude or similar conduct; (ii) his or her repeated intoxication by alcohol or drugs during the performance of his or her duties; (iii) his or her willful and intentional misuse of any of our funds; (iv) embezzlement by him or her; (v) his or her willful and material misrepresentations or concealments on any written reports submitted to us; (vi) his or her willful and intentional material breach of his or her employment agreement; (vii) his or her willful and material failure to follow or comply with the reasonable and lawful written directives of the board of directors; or (viii) conduct constituting a material breach of our then current (A) Code of Business Conduct and Ethics, and any other written policy referenced therein, or (B) the Code of Ethics for Chief Executive Officer and Senior Financial Officers, if applicable, provided that in each case the Named Officer knew or should have known such conduct to be a breach.
“Good Reason” will mean any of the following to which the Named Officer will not consent in writing: (i) a reduction in his or her then-current base salary; (ii) failure by us to pay in full on a current basis (A) any of the compensation or benefits described in the Named Officer’s employment agreement that are due and owing, or (B) any amounts that are due and owing to the Named Officer under any long-term or short-term or other incentive compensation plans, agreements or awards; (iii) material breach of any provision of the Named Officer’s employment agreement by us; (iv) any material reduction in the Named Officer’s title, authority or responsibilities; or (v) a relocation of the Named Officer’s primary place of employment to a location more than fifty (50) miles from our then-current location in Houston, Texas.
If the Named Officer is terminated for “Cause” or voluntarily terminates his or her employment without “Good Reason,” the Named Officer will receive only the amounts identified under “-Payments Made Upon Termination For Any Reason.”
Payments Made Upon Death, Disability or Retirement
In the event of the death, “Disability” or “Retirement” of a Named Officer, he or she will receive amounts earned (but unpaid) during his or her term of employment as described above. In addition, upon the death or “Disability” of a Named Officer, all outstanding restricted units and unit option awards will vest in full. Upon “Retirement,” all unvested awards will be canceled and new immediately vested unit grant awards will be made in an equivalent amount of the unvested portion.
“Disability” means the earlier of (a) written determination by a physician selected by us and reasonably agreed to by the Named Officer that the Named Officer has been unable to perform substantially his or her usual and customary duties for a period of at least one hundred twenty (120) consecutive days or a non-consecutive period of one hundred eighty (180) days during any twelve-month period as a result of incapacity due to mental or physical illness or disease; and (b) “Disability” as such term is defined in our applicable long-term disability insurance plan.
“Retirement” shall mean termination of the Named Officer’s service relationship with us on or after his or her attainment of age 60 with at least 5 years of employment with us or our affiliates.
Payments Made Upon a Termination Following a Change of Control
Our LTIP and the employment agreements with each Named Officer provide certain benefits if his or her employment is terminated by us without Cause (as defined above) or by the Named Officer for Good Reason (as defined above) during the period beginning six (6) months prior to a Change of Control and ending two (2) years following the Change of Control.
In addition to the earned benefits and amounts listed under the heading “-Payments Made Upon Termination For Any Reason,” the Named Officer will receive:
• | a lump sum severance payment that ranges from two to three times the sum of the Named Officer’s base salary at the highest rate in effect at any time during the thirty-six (36) month period immediately preceding the termination date, plus the highest EICP award that the Employee was paid in the thirty-six (36) months immediately preceding the Change of Control; |
138
Item 11. Executive Compensation - Continued
• | COBRA continuation coverage as described above upon a termination without “Cause” or for “Good Reason;” |
• | his or her earned, but unpaid EICP award determined as described above upon a termination without “Cause” or for “Good Reason;” |
• | an amount equal to the excise tax charged to the Named Officer as a result of the receipt of any change of control payments; and |
• | all restricted unit and unit options awards held by the Named Officer will automatically vest and become exercisable. |
With respect to the definition of “Change of Control,” each of the Named Officers’ employment agreements are the same. “Change of Control” means the first to occur of:
(1) | The acquisition by any individual, entity or group (within the meaning of Section 13(d) (3) or 14(d) (2) of the Exchange Act) (a “Person”) of beneficial ownership (within the meaning of Rule 13d-3 promulgated under the Exchange Act) of thirty-five percent (35%) or more of either (A) the then-outstanding equity interests of the Company (the “Outstanding Equity”) or (B) the combined voting power of the then-outstanding voting securities of the Company entitled to vote generally in the election of directors (the “Outstanding Voting Securities”); provided, however, that, for purposes of this Section 1 of this definition, the following acquisitions will not constitute a Change of Control: (i) any acquisition directly from us, (ii) any acquisition by us, (iii) any acquisition by any employee benefit plan (or related trust) sponsored or maintained by us or any affiliated company, or (iv) any acquisition by any corporation or other entity pursuant to a transaction that complies with Section (3)(A), Section (3)(B) or Section (3)(C) below; |
(2) | Any time at which individuals who, as of the date of such Named Officer’s employment agreement with us, constitute the board of directors (the “Incumbent Board”) cease for any reason to constitute at least a majority of the board of directors; provided, however, that any individual becoming a director subsequent to such date whose election, or nomination for election by our Unitholders, was approved by a vote of at least a majority of the directors then comprising the Incumbent Board will be considered as though such individual were a member of the Incumbent Board, but excluding, for this purpose, any such individual whose initial assumption of office occurs as a result of an actual or threatened election contest with respect to the election or removal of directors or other actual or threatened solicitation of proxies or consents by or on behalf of a person other than the Incumbent Board; |
(3) | Consummation of a reorganization, merger, statutory share exchange or consolidation or similar corporate transaction involving us or any of our subsidiaries, a sale or other disposition of all or substantially all of our assets, or the acquisition of assets or equity interests of another entity by us or any of our subsidiaries (each, a “Business Combination”), in each case unless, following such Business Combination, (A) all or substantially all of the individuals and entities that were the beneficial owners of the Outstanding Equity and the Outstanding Voting Securities immediately prior to such Business Combination beneficially own, directly or indirectly, more than fifty percent (50%) of the then-outstanding equity interests and the combined voting power of the then-outstanding voting securities entitled to vote generally in the election of directors, as the case may be, of the corporation resulting from such Business Combination (including, without limitation, a corporation or other entity that, as a result of such transaction, owns us or all or substantially all of our assets either directly or through one or more subsidiaries) in substantially the same proportions as their ownership immediately prior to such Business Combination of the Outstanding Equity and the Outstanding Voting Securities, as the case may be, (B) no Person (excluding any corporation resulting from such Business Combination or any employee benefit plan (or related trust) of the Company or such corporation or other entity resulting from such Business Combination) beneficially owns, directly or indirectly, thirty-five percent (35%) or more of, respectively, the then-outstanding equity interests of the corporation or other entity resulting from such Business Combination or the combined voting power of the then-outstanding voting securities of such corporation or other entity, except to the extent that such ownership existed prior to the Business Combination, and (C) at least a majority of the members of the board of directors of the corporation or equivalent body of any other entity resulting from such Business Combination were members of the Incumbent Board at the time of the execution of the initial agreement or of the action of the Board providing for such Business Combination; or |
(4) | Consummation of a complete liquidation or dissolution of the Company. |
Excise Taxes
If any benefits payable or otherwise provided under each Named Officer’s employment agreement would be subject to the excise tax imposed by Section 4999 of the Code (“Excise Tax”), then we will provide for the payment of, or otherwise reimburse the executive for, an amount up to such Excise Tax and any related taxes, fees or penalties thereon.
139
Item 11. Executive Compensation - Continued
Non-Competition Provisions
The non-competition provisions of the employment agreements of each of the Named Officers are described above in the section titled “-Narrative Disclosure to the 2012 Summary Compensation Table.”
Quantification of Payments on Termination
The chart below reflects the amount of compensation to each of our Named Officers in the event of termination of such officer’s employment pursuant to his or her employment agreement and our LTIP. The amount of compensation payable to each Named Officer upon voluntary termination with “Good Reason,” involuntary termination other than for “Cause,” termination following a “Change of Control” and the occurrence of the “Disability”, death or retirement of the executive is shown below. The amounts shown are calculated assuming that such termination was effective as of December 31, 2012, and thus include amounts earned through such time (other than amounts payable pursuant to our Retirement Savings Plan) and are estimates of the amounts which would be paid to the executives upon their termination. The actual amounts to be paid out can only be determined at the time of the Named Officer’s actual separation from us.
Name and Reason for Termination | Severance Pay ($) | Bonus ($) (4) | Health Benefits ($) | Early Vesting of Equity Awards ($) (a) | Estimated Tax Gross Up ($) (5) | Total ($) | ||||||||||||
Mark E. Ellis (1) | ||||||||||||||||||
Without cause or good reason | 1,550,000 | 775,000 | 42,274 | 10,551,208 | — | 12,918,482 | ||||||||||||
Change of Control | 6,627,000 | 775,000 | 63,411 | 10,551,208 | — | 18,016,619 | ||||||||||||
Disability, Death or Retirement | — | 775,000 | — | 10,551,208 | — | 11,326,208 | ||||||||||||
Kolja Rockov (2) | ||||||||||||||||||
Without cause or good reason | 860,000 | 387,000 | 30,698 | 3,935,920 | — | 5,213,618 | ||||||||||||
Change of Control | 2,865,000 | 387,000 | 38,372 | 3,935,920 | — | 7,226,292 | ||||||||||||
Disability, Death or Retirement | — | 387,000 | — | 3,935,920 | — | 4,322,920 | ||||||||||||
Arden L. Walker, Jr. (2) | ||||||||||||||||||
Without cause or good reason | 860,000 | 387,000 | 29,054 | 3,536,017 | — | 4,812,071 | ||||||||||||
Change of Control | 2,865,000 | 387,000 | 29,054 | 3,536,017 | — | 6,817,071 | ||||||||||||
Disability, Death or Retirement | — | 387,000 | 3,536,017 | — | 3,923,017 | |||||||||||||
Charlene A. Ripley (3) | ||||||||||||||||||
Without cause or good reason | 780,000 | 312,000 | 33,134 | 2,495,908 | — | 3,621,042 | ||||||||||||
Change of Control | 1,936,000 | 312,000 | 33,134 | 2,495,908 | — | 4,777,042 | ||||||||||||
Disability, Death or Retirement | — | 312,000 | — | 2,495,908 | — | 2,807,908 | ||||||||||||
David B. Rottino (3) | ||||||||||||||||||
Without cause or good reason | 780,000 | 312,000 | 41,932 | 2,431,842 | — | 3,565,774 | ||||||||||||
Change of Control | 1,936,000 | 312,000 | 41,932 | 2,431,842 | — | 4,721,774 | ||||||||||||
Disability, Death or Retirement | — | 312,000 | — | 2,431,842 | — | 2,743,842 | ||||||||||||
_______________________
(a) | Closing price of our units on December 31, 2012 was $35.24. All awards under the LTIP fully vest upon termination without cause, good reason, death, disability or a change of control (as each is defined in the respective employment agreements). Upon retirement, unvested awards are canceled and an equivalent amount of immediately vested unit grants are made. |
(1) | If Mr. Ellis’ employment is terminated without cause or by employee for good reason, his employment agreement provides that, in addition to the amounts earned but unpaid, (1) he will receive a lump sum severance payment of two times his base salary at the highest rate in effect at any time during the thirty-six (36) month period |
140
Item 11. Executive Compensation - Continued
immediately preceding the termination (“Severance Pay”), (2) we will pay our portion of COBRA continuation coverage, as well as pay certain costs of continuing medical coverage for Mr. Ellis for up to six months after the expiration of the maximum required period under COBRA, and (3) all of Mr. Ellis’s granted but unvested awards under the LTIP shall immediately vest.
If Mr. Ellis is terminated without cause or by him for good reason during the period beginning six (6) months prior to a Change of Control and ending two (2) years following a Change of Control (“COC Period”), he is entitled to the same severance benefits described above, except that (1) the Severance Pay will be three times the sum of a) his highest base salary in effect at any time during the 36-month period immediately preceding termination (“Highest Base Salary”) and b) his highest annual EICP award in the 36 months prior to the change of control (“Highest EICP Award”) and (2) the period for continued coverage of medical benefits will be up to eighteen months after the expiration of the maximum period required by COBRA. Mr. Ellis will also receive a gross up of any Excise Tax (“Excise Tax Gross Up”) and of any Section 409A penalties and interest.
(2) | If either of Mr. Rockov or Mr. Walker is terminated without cause or by him for good reason, his employment agreement provides for severance benefits substantially similar to Mr. Ellis. If Mr. Rockov or Mr. Walker is terminated without cause or by him for good reason during the COC Period, each will be entitled to substantially the same benefits as Mr. Ellis except that 1) his Severance Pay is 2.5 times the sum of his Highest Base Salary and Highest EICP Award and 2) the period for continued coverage of medical benefits will be up to twelve months after the expiration of the maximum required period under COBRA. Mr. Rockov’s and Mr. Walker’s employment agreements include the Excise Tax Gross Up but no gross up for penalties or interest under Section 409A. |
(3) | If Mr. Rottino is terminated without cause or by him for good reason, the employment agreement provides for severance benefits substantially similar to Mr. Ellis. If Mr. Rottino is terminated without cause or by him for good reason during the COC Period, he will be entitled to substantially the same benefits as Mr. Ellis, except (1) Severance Pay shall be two times the sum of his Highest Base Salary and Highest EICP Award and (2) the period for continued coverage of medical benefits will remain up to six months after the expiration of the maximum required period under COBRA. Mr. Rottino’s employment agreement includes the Excise Tax Gross Up but no gross up for penalties or interest under Section 409A. |
(4) | The amounts listed under Bonus represent each Named Officer’s target EICP award for 2012. As described above under “-Payments Made Upon Termination Without Cause or for Good Reason,” if the Named Officer was employed for the entire previous year but was terminated prior to the Compensation Committee finally determining his or her EICP award for the preceding year (in the hypothetical case presented in the table above, on December 31, 2012), he or she would have received his or her target EICP award. The Compensation Committee determined actual EICP awards for 2012 performance on January 23, 2013; the actual awards for each Named Officer are identified in column (g) of the Summary Compensation Table, but are not reflected in the table above. |
(5) | Using a hypothetical termination date of December 31, 2012, we determined that none of our Named Officers would have “excess parachute payments” as defined in Section 280G of the Code; thus none would be entitled to a tax gross up. |
Director Compensation
We use a combination of cash and unit-based incentive compensation to attract and retain qualified candidates to serve on our board of directors. In setting director compensation, we consider the significant amount of time that directors expend in fulfilling their duties to us as well as the skill level required by us of members of our board of directors.
Annual Retainer and Fees. In 2012, each independent director (as determined by our board of directors pursuant to applicable NASDAQ listing standards) received the following cash compensation for serving on our board of directors:
• | An annual cash retainer of $50,000 paid in four installments quarterly; |
• | A per meeting fee of $1,500, payable quarterly; |
• | A per committee meeting fee of $1,000, payable quarterly; and |
• | Committee chair fees (each payable quarterly) of: |
• | $15,000 for the Audit Committee chair; |
• | $7,500 for the Nominating and Governance Committee chair; and |
• | $10,000 for the Compensation Committee chair. |
• | Lead director fee of $10,000 per year, payable quarterly. |
141
Item 11. Executive Compensation - Continued
Restricted Unit Grant. In January 2012, the Compensation Committee approved an annual grant of 4,770 restricted units to each of our independent directors. Restricted units are granted under the LTIP and vest over three years. The restricted units have the same terms and conditions as grants made to our Named Officers.
2012 Director Summary Compensation Table
The table below summarizes the compensation we paid to our non-employee directors for the fiscal year ended December 31, 2012.
(a) Name (1) | (b) Fees Earned or Paid in Cash ($) | (c) Unit Awards ($) (2) (3) | (e) All Other Compensation ($) (4) | (f) Total ($) | ||||||||
George A. Alcorn | 90,500 | 177,826 | 55,060 | 323,386 | ||||||||
David D. Dunlap | 66,500 | 167,522 | 6,917 | 240,939 | ||||||||
Terrence S. Jacobs | 94,500 | 177,826 | 55,060 | 327,386 | ||||||||
Michael C. Linn | 65,000 | 177,826 | 280,707 | 523,533 | ||||||||
Joseph P. McCoy | 98,000 | 177,826 | 46,465 | 322,291 | ||||||||
Jeffrey C. Swoveland | 94,500 | 177,826 | 55,060 | 327,386 | ||||||||
______________________
(1) | Mark E. Ellis, our Chairman, President and Chief Executive Officer, is not included in this table as he was an employee in 2012 and thus received no additional compensation for his service as director. Mr. Ellis’s compensation is shown in the Summary Compensation Table above. |
(2) | Reflects the aggregate grant date fair value of 2012 awards computed in accordance with FASB ASC Topic 718. The following represents outstanding unit grant awards as of December 31, 2012: |
Director | Phantom Unit Awards (#) | Value at Grant Date ($) | Vested Phantom Units (#) | Vested Unit Options (#) | Exercise Price ($) | Restricted Unit Awards (#) | Value at Grant Date ($) | ||||||||||||||
George A. Alcorn | 9,946 | 277,918 | 9,946 | 2,000 | 20.18 | 9,272 | 333,386 | ||||||||||||||
David D. Dunlap | — | — | — | — | — | 4,770 | 167,522 | ||||||||||||||
Terrence S. Jacobs | 9,946 | 277,918 | 9,946 | — | — | 9,272 | 333,386 | ||||||||||||||
Michael C. Linn | — | — | — | — | — | 97,978 | 3,300,218 | ||||||||||||||
Joseph P. McCoy | 6,946 | 196,798 | 6,946 | — | — | 9,272 | 333,386 | ||||||||||||||
Jeffrey C. Swoveland | 9,946 | 277,918 | 9,946 | 10,000 | 20.18 | 9,272 | 333,386 | ||||||||||||||
_______________________
(3) | In addition, the Compensation Committee approved the following restricted unit grants to our directors on January 23, 2013: |
Director | Restricted Unit Awards (#) | Value at Grant Date ($) | ||||
George A. Alcorn | 5,205 | 198,258 | ||||
David D. Dunlap | 5,205 | 198,258 | ||||
Terrence S. Jacobs | 5,205 | 198,258 | ||||
Michael C. Linn | 5,205 | 198,258 | ||||
Joseph P. McCoy | 5,205 | 198,258 | ||||
Jeffrey C. Swoveland | 5,205 | 198,258 | ||||
_______________________
(4) | Reflects the dollar amount of distributions paid in 2012 on the phantom and restricted units reported in (2) above. |
142
Item 12. Security Ownership of Certain Beneficial Owners and Management and Related Stockholder Matters
The following table sets forth as of October 1, 2013, the number of units beneficially owned by: (i) each person who is known to us to beneficially own more than 5% of a class of units; (ii) the current directors and nominees of our board of directors; (iii) each Named Officer; and (iv) all current directors, executive officers and Named Officers as a group. We obtained certain information in the table from filings made with the SEC. Unless otherwise noted, each beneficial owner has sole voting power and sole investment power.
Name of Beneficial Owner (1) | Units Beneficially Owned | Percentage of Units Beneficially Owned | |||
LinnCo, LLC | 34,787,500 | 14.8% | |||
Mark E. Ellis (2)(3)(4) | 967,527 | * | |||
Kolja Rockov (2)(3)(5) | 639,945 | * | |||
Arden L. Walker, Jr. (2)(3)(6) | 313,286 | * | |||
Charlene A. Ripley (2)(3) | 162,713 | * | |||
David B. Rottino (2)(3)(7) | 217,490 | * | |||
George A. Alcorn (2)(3)(8) | 39,486 | * | |||
David D. Dunlap (2)(3) | 21,680 | * | |||
Michael C. Linn (2)(3)(9) | 681,832 | * | |||
Joseph P. McCoy (2)(3)(10) | 40,470 | * | |||
Jeffrey C. Swoveland (2)(3)(11) | 46,766 | * | |||
All executive officers, directors and Named Officers as a group (10 persons) (12) | 3,131,195 | * | |||
_______________________
* | Less than 1% of class based on 235,178,498 units outstanding as of October 1, 2013. |
(1) | To our knowledge after reviewing Schedule 13G/Ds filed with the SEC, LinnCo, LLC is the only holder of which we are aware that beneficially own more than 5% of our units. |
(2) | The address of each beneficial owner, unless otherwise noted, is c/o Linn Energy, LLC, 600 Travis, Suite 5100, Houston, Texas 77002. |
(3) | Includes unvested restricted unit awards that vest in equal installments, generally over approximately three years. Please see “–Outstanding Equity Awards at December 31, 2012” for vesting schedule of unvested awards. |
(4) | Includes 310,765 units underlying options currently exercisable. Includes 494,664 units Mr. Ellis has pledged to secure certain personal accounts. |
(5) | Includes 400 units as custodian under certain Uniform Gifts to Minors Accounts (UGMA) for immediate family members as to which Mr. Rockov disclaims beneficial ownership. Includes 240,127 units Mr. Rockov has pledged to secure certain personal accounts and 279,665 units underlying options currently exercisable. |
(6) | Includes 103,550 units underlying options currently exercisable. |
(7) | Includes 92,240 units underlying options currently exercisable. |
(8) | Includes 2,000 units underlying options currently exercisable and 9,946 phantom units. |
(9) | Includes 102,301 units underlying options currently exercisable. |
(10) | Includes 6,946 phantom units. |
(11) | Includes 10,000 units underlying options currently exercisable and 9,946 phantom units. |
(12) | Percentage ownership of executive officers and directors is based on total units outstanding as of October 1, 2013. |
143
Item 13. Certain Relationships and Related Transactions, and Director Independence
In the ordinary course of our business, we purchase products or services from, or engage in other transactions with, various third parties. Occasionally, these transactions may involve entities that are affiliated with one or more members of our board of directors. When they occur, these transactions are conducted in the ordinary course and on an arm’s-length basis.
Review and Approval of Related Party Transactions
We review all relationships and transactions in which we and our directors and executive officers or their immediate family members are participants to determine whether such persons have a direct or indirect material interest. We have developed and implemented processes and controls to obtain information from our directors and executive officers with respect to related person transactions and for then determining, based on the facts and circumstances, whether we or a related person has a direct or indirect material interest in the transaction. As required under SEC rules, transactions that are determined to be directly or indirectly material to us or a related person are disclosed in our annual proxy statement. In addition, our Audit Committee or board of directors (if appropriate) reviews and approves or ratifies or disapproves any related person transaction that is required to be disclosed. In the course of its review of a disclosable related party transaction, consideration is given to:
• | the nature of the related person’s interest in the transaction; |
• | the material terms of the transaction, including, without limitation, the amount and type of transaction; |
• | the importance of the transaction to the related person; |
• | the importance of the transaction to us; |
• | whether the transaction would impair the judgment of a director or executive officer to act in our best interest; and |
• | any other matters deemed appropriate. |
Any director who is a related person with respect to a transaction under review may not participate in the deliberations or vote respecting approval or ratification of the transaction; provided, however, that such director may be counted in determining the presence of a quorum at the meeting where the transaction is considered.
Our Relationship with LinnCo, LLC
General. As of September 30, 2013, LinnCo owns approximately 15% of our outstanding units. We control LinnCo’s management and operations through our ownership of LinnCo’s sole voting share.
Omnibus Agreement. Concurrent with the closing of its initial public offering (“IPO”), LinnCo entered into an agreement with us (the “Omnibus Agreement”) pursuant to which we agree to provide LinnCo certain financial, legal, accounting, tax advisory, financial advisory and engineering services or to pay on LinnCo’s behalf or reimburse LinnCo for any expenses incurred in connection with securing these services from third parties, as well as printing costs and other administrative and out-of-pocket expenses LinnCo incurs, along with any other expenses LinnCo incurred in connection with the IPO or will incur in any future offering of its shares or as a result of being a publicly traded entity, including costs associated with annual, quarterly and other reports to LinnCo shareholders, tax return and Form 1099 preparation and distribution, NASDAQ listing fees, printing costs, independent auditor fees and expenses, legal counsel fees and expenses, limited liability company governance and compliance expenses and registrar and transfer agent fees. We will also provide LinnCo with cash management services, including treasury services with respect to the payment of dividends and allocation of reserves for taxes. These cash management services are intended to optimize the use of LinnCo’s cash on hand and to reduce the likelihood of a change in the amount of any dividend paid to LinnCo shareholders across periods other than as a result of any change in the amount of distributions paid by us. In addition, we will indemnify LinnCo and its officers and directors for damages suffered or costs incurred (other than income taxes payable by LinnCo) in connection with carrying out LinnCo’s activities. Finally, we have granted LinnCo a license to utilize our trademarks.
144
Item 13. | Certain Relationships and Related Transactions, and Director Independence - Continued |
Future Offerings. LinnCo will purchase from us a number of our units equal to or greater than the number of shares LinnCo sells in any future offering for an amount equal to or less than the net cash proceeds of such offering (after deducting underwriting discounts but before payment of other offering expenses) plus any properties or assets received by LinnCo in such offering. As a result, we will indirectly bear the cost of any underwriting discounts associated with future offerings of LinnCo common shares.
Contribution Agreement. In connection with the proposed merger with Berry Petroleum Company with and into LinnCo (the “merger”), LinnCo entered into a contribution agreement with us with respect to the issuance of our units to LinnCo in connection with the contribution by LinnCo of all of the outstanding limited liability company interests in Linn Acquisition Company, LLC (“LinnCo Merger Sub”) to us (the “Contribution”). The closing of the Contribution is expected to occur on the closing date of the merger. Under the contribution agreement, the number of our units to be issued to LinnCo in exchange for all of the limited liability company interests in LinnCo Merger Sub will be equal to the greater of (i) the aggregate number of LinnCo common shares issued in the LinnCo Merger (as defined in the Merger Agreement) and (ii) the number of our units required to cause LinnCo to own no less than one-third of all of our outstanding units following the Contribution.
The contribution agreement contains representations, warranties and covenants of the parties customary for a transaction of this type. In addition, certain covenants under the contribution agreement require each party to use reasonable best efforts to cause the Contribution to be consummated, including filing the appropriate government and regulatory approvals. The closing of the Contribution is subject to certain negotiated conditions, including: the representations and warranties of both parties being true and correct in all material respects, the merger having been consummated, and all waiting periods applicable to the merger contemplated by the Hart-Scott-Rodino Antitrust Improvements Act of 1976, and the rules and regulations promulgated thereunder, having been expired or terminated. Satisfaction of the conditions to the consummation of the contribution is a condition to the closing of the merger.
The contribution agreement provides that LinnCo will receive from us payments of $6 million, or $0.06 per unit, in each of 2013, 2014 and 2015 to reasonably compensate LinnCo for the anticipated actual increase in its tax liability that results from the consummation of the transactions. In addition, the contribution agreement provides that in the event that, within seven years following the Contribution, we desire to effect a disposition of a material portion of the assets acquired in a manner that results in a material increase to the tax liability resulting from the allocation of income or gain pursuant to Section 704(c) of the Code (a “Material Disposition Transaction”), such Material Disposition Transaction would be approved by an independent committee appointed for such purpose by the LinnCo board of directors.
Indemnification of Officers and Directors
Our limited liability company agreement provides that we will generally indemnify officers and members of our board of directors against all losses, claims, damages or similar events. Our limited liability company agreement is filed as an exhibit to the Form 10-K. Subject to any terms, conditions or restrictions set forth in our limited liability company agreement, Section 18-108 of the LLC Act empowers a Delaware limited liability company to indemnify and hold harmless any member or manager or other person from and against all claims and demands whatsoever. We have also entered into individual indemnity agreements with each of our executive officers and directors which supplement the indemnification provisions in our limited liability company agreement.
Director Independence
The Nominating Committee reviews director independence on an annual basis and makes a threshold determination as to the status of each director’s independence. After this initial determination is made, the Nominating Committee makes a recommendation to the full board of directors, who then ultimately determine director independence. This subjective determination is made by considering all direct or indirect business relationships between each director (including his immediate family) and our company, as well as relationships between our company and charitable organizations with which the director is affiliated. The full board of directors, upon recommendation by the Nominating Committee, has determined that Messrs. Alcorn, Dunlap, McCoy and Swoveland qualify as “independent” in accordance with the published listing requirements of NASDAQ. The NASDAQ independence definition includes a series of objective tests, including that the director is not an employee of our company and has not engaged in various types of business dealings with our company. In addition, as further required by the NASDAQ rules, the Nominating Committee has made a subjective determination as to each independent director that no relationships exist which, in the opinion of the Nominating Committee, would interfere with the exercise of his independent judgment in carrying out the responsibilities of a director. Mr. Linn is not independent by virtue of employment within the last three years with our company and Mr. Ellis is not independent by virtue of his role as
145
Item 13. | Certain Relationships and Related Transactions, and Director Independence - Continued |
our Chairman, President and Chief Executive Officer. During the board of directors’ most recent review of independence, the board of directors specifically considered that Mr. Dunlap is the President and Chief Executive Officer of Superior, which provides certain oilfield services to us. According to disclosures made by Mr. Dunlap, for the year ended December 31, 2012, we were billed approximately $23 million from Superior and its subsidiaries for services rendered to us. These transactions were consummated on terms equivalent to those that prevail in arm’s-length transactions and do not represent more than 5% of the consolidated gross revenues of Superior. The board of directors then determined that our relationship with Superior would not interfere with Mr. Dunlap’s exercise of his independent judgment in carrying out his responsibilities as our director.
Item 14. Principal Accounting Fees and Services
The Audit Committee has selected KPMG LLP to continue as its independent public accountant for 2013. KPMG LLP has served as our independent public accountant since 2005. The Audit Committee has determined to submit KPMG LLP’s selection to unitholders for ratification. Unitholder ratification of the selection of KPMG LLP as our independent public accountant for 2013 is not required by our limited liability company agreement. We submit the selection of KPMG LLP to unitholders for ratification as a matter of good corporate practice.
Audit Fees
The fees for professional services rendered by KPMG LLP for the audit of our annual consolidated financial statements for each of the fiscal years ended December 31, 2011 and 2012, and the reviews of the financial statements included in any of our Quarterly Reports on Forms 10-Q for each of those fiscal years were approximately $1,300,000 and $1,350,000, respectively.
Audit-Related Fees
KPMG LLP also received fees for services in connection with, and comfort letters for, our senior notes offerings and equity offerings in 2011 and 2012 as well as an audit of our 401(k) plan in 2011. These fees totaled approximately $1,100,000 and $730,000 for the years ended December 31, 2011 and 2012, respectively.
Tax Fees
We incurred no fees in the fiscal years ended December 31, 2011 and 2012 for tax-related services provided by KPMG LLP.
All Other Fees
We incurred no other fees in the fiscal years ended December 31, 2011 and 2012 for any other services provided by KPMG LLP.
Audit Committee Approval of Audit and Non-Audit Services
The Audit Committee pre-approves all audit and non-audit services to be provided to us by our independent public accountant in the upcoming year at the last meeting of each calendar year and at subsequent meetings as necessary. The non-audit services to be provided are specified and shall not exceed a specified dollar limit. During the course of a fiscal year, if additional non-audit services are identified, these services are presented to the Audit Committee for pre-approval. All of the services covered under the caption “Audit-Related Fees” were approved by the Audit Committee and none were provided under the de minimis exception of Section 10A of the Exchange Act.
146
Part IV
Item 15. Exhibits and Financial Statement Schedules
(a) - 1. Financial Statements:
All financial statements are omitted for the reason that they are not required or the information is otherwise supplied in Item 8. “Financial Statements and Supplementary Data” in this Annual Report on Form 10-K.
(a) - 2. Financial Statement Schedules:
All schedules are omitted for the reason that they are not required or the information is otherwise supplied in Item 8. “Financial Statements and Supplementary Data” in this Annual Report on Form 10-K.
(a) - 3. Exhibits:
The exhibits required to be filed by this Item 15 are set forth in the “Index to Exhibits” accompanying this report.
147
SIGNATURES
Pursuant to the requirements of the Securities Exchange Act of 1934, the Registrant has duly caused this report to be signed on its behalf by the undersigned, thereunto duly authorized.
LINN ENERGY, LLC | ||
Date: November 5, 2013 | By: | /s/ Mark E. Ellis |
Mark E. Ellis | ||
Chairman, President and Chief Executive Officer | ||
Date: November 5, 2013 | By: | /s/ David B. Rottino |
David B. Rottino | ||
Senior Vice President of Finance, Business Development and Chief Accounting Officer | ||
Pursuant to the requirements of the Securities Exchange Act of 1934, this Annual Report has been signed below by the following persons on behalf of the Registrant and in the capacities and on the dates indicated.
Signature | Title | Date | ||
/s/ Mark E. Ellis | Chairman, President and Chief Executive Officer (Principal Executive Officer) | November 5, 2013 | ||
Mark E. Ellis | ||||
/s/ Kolja Rockov | Executive Vice President and Chief Financial Officer (Principal Financial Officer) | November 5, 2013 | ||
Kolja Rockov | ||||
/s/ David B. Rottino | Senior Vice President of Finance, Business Development and Chief Accounting Officer (Principal Accounting Officer) | November 5, 2013 | ||
David B. Rottino | ||||
148
INDEX TO EXHIBITS
Exhibit Number | Description | |
2.1 | — | Agreement and Plan of Merger, dated as of February 20, 2013, by and among Berry Petroleum Company, Bacchus HoldCo, Inc., Bacchus Merger Sub, Inc., LinnCo, LLC, Linn Acquisition Company, LLC and Linn Energy, LLC (incorporated herein by reference to Annex A of Part I of the document included in the Registration Statement on Form S-4 (File No. 333-187484) filed on March 22, 2013) |
2.2 | — | Contribution Agreement, dated as of February 20, 2013, by and between LinnCo, LLC and Linn Energy, LLC (incorporated herein by reference to Annex B of Part I of the document included in the Registration Statement on Form S-4 (File No. 333-187484) filed on March 22, 2013) |
3.1 | — | Certificate of Formation of Linn Energy Holdings, LLC (now Linn Energy, LLC) (incorporated herein by reference to Exhibit 3.1 to Registration Statement on Form S-1 (File No. 333-125501) filed by Linn Energy, LLC on June 3, 2005) |
3.2 | — | Certificate of Amendment to Certificate of Formation of Linn Energy Holdings, LLC (now Linn Energy, LLC) (incorporated herein by reference to Exhibit 3.2 to Registration Statement on Form S-1 (File No. 333-125501) filed by Linn Energy, LLC on June 3, 2005) |
3.3 | — | Third Amended and Restated Limited Liability Company Agreement of Linn Energy, LLC dated as of September 3, 2010, (incorporated herein by reference to Exhibit 3.1 to Current Report on Form 8-K, filed on September 7, 2010) |
4.1 | — | Form of specimen unit certificate for the units of Linn Energy, LLC (incorporated herein by reference to Exhibit 4.1 to Annual Report on Form 10-K for the year ended December 31, 2005, filed on May 31, 2006) |
4.2 | — | Indenture, dated as of June 27, 2008, among Linn Energy, LLC, Linn Energy Finance Corp., the Subsidiary Guarantors named therein and U.S. Bank National Association, as Trustee (incorporated herein by reference to Exhibit 4.1 to Current Report on Form 8-K filed on June 30, 2008) |
4.3 | — | Indenture, dated as of May 18, 2009, among Linn Energy, LLC, Linn Energy Finance Corp., the Subsidiary Guarantors named therein and U. S. Bank National Association, as Trustee (incorporated herein by reference to Exhibit 4.1 to Current Report on Form 8-K filed on May 18, 2009) |
4.4 | — | Indenture, dated as of April 6, 2010, among Linn Energy, LLC, Linn Energy Finance Corp., the Subsidiary Guarantors named therein and U.S. Bank National Association, as Trustee (incorporated herein by reference to Exhibit 4.1 to Current Report on Form 8-K filed on April 9, 2010) |
4.5 | — | Indenture, dated as of September 13, 2010, among Linn Energy, LLC, Linn Energy Finance Corp., the Subsidiary Guarantors named therein and U.S. Bank National Association, as Trustee (incorporated herein by reference to Exhibit 4.1 to Current Report on Form 8-K filed on September 13, 2010) |
4.6 | — | Indenture, dated as of May 13, 2011, among Linn Energy, LLC, Linn Energy Finance Corp., the Subsidiary Guarantors named therein and U.S. Bank National Association, as Trustee (incorporated herein by reference to Exhibit 4.1 to Current Report on Form 8-K filed on May 16, 2011) |
4.7 | — | Indenture, dated as of March 2, 2012, among Linn Energy, LLC, Linn Energy Finance Corp., the Subsidiary Guarantors named therein and U. S. Bank National Association, as Trustee (incorporated herein by reference to Exhibit 4.1 to Current Report on Form 8-K filed on March 2, 2012) |
4.8 | — | First Supplemental Indenture, dated as of July 2, 2010, to Indenture, dated as of June 27, 2008, between Linn Energy, LLC, Linn Energy Finance Corp., the Subsidiary Guarantors named therein and U.S. Bank National Association, as Trustee (incorporated herein by reference to Exhibit 4.1 to Quarterly Report on Form 10-Q filed on July 29, 2010) |
4.9 | — | First Supplemental Indenture, dated as of July 2, 2010, to Indenture, dated as of May 18, 2009, between Linn Energy, LLC, Linn Energy Finance Corp., the Subsidiary Guarantors named therein and U.S. Bank National Association, as Trustee (incorporated herein by reference to Exhibit 4.2 to Quarterly Report on Form 10-Q filed on July 29, 2010) |
4.10 | — | First Supplemental Indenture, dated as of July 2, 2010, to Indenture, dated as of April 6, 2010, between Linn Energy, LLC, Linn Energy Finance Corp., the Subsidiary Guarantors named therein and U.S. Bank National Association, as Trustee (incorporated herein by reference to Exhibit 4.3 to Quarterly Report on Form 10-Q filed on July 29, 2010) |
149
INDEX TO EXHIBITS - Continued
Exhibit Number | Description | |
4.11 | — | Second Supplemental Indenture, dated as of March 16, 2011, to Indenture, dated as of May 18, 2009, by and among Linn Energy LLC, Linn Energy Finance Corp., the Guarantors party thereto and U.S. Bank National Association (incorporated herein by reference to Exhibit 4.1 to Current Report on Form 8-K filed on March 22, 2011) |
4.12 | — | Second Supplemental Indenture, dated as of March 16, 2011, to the Indenture dated as of June 27, 2008, by and among Linn Energy LLC, Linn Energy Finance Corp., the Guarantors party thereto and U.S. Bank National Association (incorporated herein by reference to Exhibit 4.1 to Current Report on Form 8-K filed on March 22, 2011) |
4.13 | — | Registration Rights Agreement, dated as of March 2, 2012, among Linn Energy, LLC, Linn Energy Finance Corp., the Subsidiary Guarantors named therein and the representatives of the Initial Purchasers named therein (incorporated herein by reference to Exhibit 4.2 to Current Report on Form 8-K filed on March 2, 2012) |
10.1* | — | Linn Energy, LLC Amended and Restated Long-Term Incentive Plan (incorporated herein by reference to Annex A to the Proxy Statement for 2008 Annual Meeting, filed on April 21, 2008) |
10.2* | — | Amendment No. 1 to Linn Energy, LLC Amended and Restated Long-Term Incentive Plan, dated February 4, 2009, (incorporated herein by reference to Exhibit 10.2 to Annual Report on Form 10-K for the year ended December 31, 2008, filed on February 26, 2009) |
10.3* | — | Amendment No. 2 to Linn Energy, LLC Amended and Restated Long-Term Incentive Plan, dated July 19, 2010, (incorporated herein by reference to Exhibit 10.3 to Quarterly Report on Form 10-Q filed on July 29, 2010) |
10.4* | — | Form of Executive Unit Option Agreement pursuant to the Linn Energy, LLC Amended and Restated Long-Term Incentive Plan, as amended (incorporated herein by reference to Exhibit 10.3 to Annual Report on Form 10-K for the year ended December 31, 2008, filed on February 26, 2009) |
10.5* | — | Form of Executive Restricted Unit Agreement pursuant to the Linn Energy, LLC Amended and Restated Long-Term Incentive Plan, as amended (incorporated herein by reference to Exhibit 10.4 to Annual Report on Form 10-K for the year ended December 31, 2008, filed on February 26, 2009) |
10.6* | — | Form of Phantom Unit Grant Agreement for Independent Directors pursuant to the Linn Energy, LLC Amended and Restated Long-Term Incentive Plan, as amended (incorporated herein by reference to Exhibit 10.1 to Current Report on Form 8-K filed on August 9, 2006) |
10.7* | — | Form of Director Restricted Unit Grant Agreement pursuant to the Linn Energy, LLC Amended and Restated Long-Term Incentive Plan, as amended (incorporated herein by reference to Exhibit 10.6 to Annual Report on Form 10-K for the year ended December 31, 2008, filed on February 26, 2009) |
10.8* | — | Form of Non-Executive Phantom Unit Agreement pursuant to the Linn Energy, LLC Amended and Restated Long-Term Incentive Plan, as amended (incorporated herein by reference to Exhibit 10.8 to Annual Report on Form 10-K for the year ended December 31, 2012, filed on February 21, 2013) |
10.9* | — | Form of Executive Phantom Unit Agreement pursuant to the Linn Energy, LLC Amended and Restated Long-Term Incentive Plan, as amended (incorporated herein by reference to Exhibit 10.9 to Annual Report on Form 10-K for the year ended December 31, 2012, filed on February 21, 2013) |
10.10* | — | Retirement Agreement, dated as of November 29, 2011, by and among Linn Operating, Inc., Linn Energy, LLC and Michael C. Linn (incorporated herein by reference to Exhibit 10.1 to Current Report on Form 8-K filed on December 1, 2011) |
10.11* | — | Third Amended and Restated Employment Agreement, dated effective as of December 17, 2008, between Linn Operating, Inc. and Kolja Rockov (incorporated herein by reference to Exhibit 10.8 to Annual Report on Form 10-K for the year ended December 31, 2008, filed on February 26, 2009) |
10.12* | — | Amended and Restated Employment Agreement, dated effective as of December 17, 2008, between Linn Operating, Inc. and Mark E. Ellis (incorporated herein by reference to Exhibit 10.9 to Annual Report on Form 10-K for the year ended December 31, 2008, filed on February 26, 2009) |
10.13* | — | Amendment No. 1, dated effective as of January 1, 2010, to Amended and Restated Employment Agreement, dated effective as of December 17, 2008, between Linn Operating, Inc. and Mark E. Ellis (incorporated herein by reference to Exhibit 10.29 to Annual Report on Form 10-K for the year ended December 31, 2009, filed on February 25, 2010) |
150
INDEX TO EXHIBITS - Continued
Exhibit Number | Description | |
10.14* | — | Amended and Restated Employment Agreement, dated effective December 17, 2008, between Linn Operating, Inc. and Charlene A. Ripley (incorporated herein by reference to Exhibit 10.10 to Annual Report on Form 10-K for the year ended December 31, 2008, filed on February 26, 2009) |
10.15* | — | Amended and Restated Employment Agreement, dated effective December 17, 2008, between Linn Operating, Inc. and Arden L. Walker, Jr. (incorporated herein by reference to Exhibit 10.11 to Annual Report on Form 10-K for the year ended December 31, 2008, filed on February 26, 2009) |
10.16* | — | Amendment No. 1, dated April 26, 2011, to First Amended and Restated Employment Agreement, dated December 17, 2008, between Linn Operating, Inc. and Arden L. Walker, Jr. (incorporated herein by reference to Quarterly Report on Form 10-Q filed on April 28, 2011) |
10.17* | — | Second Amended and Restated Employment Agreement, dated December 17, 2008, between Linn Operating, Inc. and David B. Rottino (incorporated herein by reference to Exhibit 10.12 to Annual Report on Form 10-K for the year ended December 31, 2008, filed on February 26, 2009) |
10.18* | — | Indemnity Agreement, dated as of February 4, 2009, between Linn Energy, LLC and George A. Alcorn (incorporated herein by reference to Exhibit 10.15 to Annual Report on Form 10-K for the year ended December 31, 2008, filed on February 26, 2009) |
10.19* | — | Indemnity Agreement, dated as of February 4, 2009, between Linn Energy, LLC and Joseph P. McCoy (incorporated herein by reference to Exhibit 10.16 to Annual Report on Form 10-K for the year ended December 31, 2008, filed on February 26, 2009) |
10.20* | — | Indemnity Agreement, dated as of February 4, 2009, between Linn Energy, LLC and Terrence S. Jacobs (incorporated herein by reference to Exhibit 10.17 to Annual Report on Form 10-K for the year ended December 31, 2008, filed on February 26, 2009) |
10.21* | — | Indemnity Agreement, dated as of February 4, 2009, between Linn Energy, LLC and Jeffrey C. Swoveland (incorporated herein by reference to Exhibit 10.18 to Annual Report on Form 10-K for the year ended December 31, 2008, filed on February 26, 2009) |
10.22* | — | Indemnity Agreement, dated as of February 4, 2009, between Linn Energy, LLC and Michael C. Linn (incorporated herein by reference to Exhibit 10.19 to Annual Report on Form 10-K for the year ended December 31, 2008, filed on February 26, 2009) |
10.23* | — | Indemnity Agreement, dated as of February 4, 2009, between Linn Energy, LLC and Mark E. Ellis (incorporated herein by reference to Exhibit 10.20 to Annual Report on Form 10-K for the year ended December 31, 2008, filed on February 26, 2009) |
10.24* | — | Indemnity Agreement, dated as of February 4, 2009, between Linn Energy, LLC and Kolja Rockov (incorporated herein by reference to Exhibit 10.21 to Annual Report on Form 10-K for the year ended December 31, 2008, filed on February 26, 2009) |
10.25* | — | Indemnity Agreement, dated as of February 4, 2009, between Linn Energy, LLC and Charlene A. Ripley (incorporated herein by reference to Exhibit 10.22 to Annual Report on Form 10-K for the year ended December 31, 2008, filed on February 26, 2009) |
10.26* | — | Indemnity Agreement, dated as of February 4, 2009, between Linn Energy, LLC and David B. Rottino (incorporated herein by reference to Exhibit 10.23 to Annual Report on Form 10-K for the year ended December 31, 2008, filed on February 26, 2009) |
10.27* | — | Indemnity Agreement, dated as of February 4, 2009, between Linn Energy, LLC and Arden L. Walker, Jr. (incorporated herein by reference to Exhibit 10.24 to Annual Report on Form 10-K for the year ended December 31, 2008, filed on February 26, 2009) |
10.28* | — | Indemnity Agreement, dated as of July 10, 2012, between Linn Energy, LLC and David D. Dunlap (incorporated herein by reference to Exhibit 10.28 to Annual Report on Form 10-K for the year ended December 31, 2012, filed on February 21, 2013) |
10.29* | — | Indemnity Agreement, dated as of February 4, 2013, between Linn Energy, LLC and Linda M. Stephens (incorporated herein by reference to Exhibit 10.29 to Annual Report on Form 10-K for the year ended December 31, 2012, filed on February 21, 2013) |
10.30 | — | Fifth Amended and Restated Credit Agreement dated as of May 2, 2011, among Linn Energy, LLC as Borrower, BNP Paribas, as Administrative Agent, and the Lenders and agents Party thereto (incorporated herein by reference to Exhibit 10.1 to Quarterly Report on Form 10-Q filed on July 28, 2011) |
151
INDEX TO EXHIBITS - Continued
Exhibit Number | Description | |
10.31 | — | First Amendment to Fifth Amended and Restated Credit Agreement, dated February 29, 2012, among Linn Energy, LLC, BNP Paribas, as administrative agent, and the other agents and lenders party thereto (incorporated herein by reference to Exhibit 1.2 to Current Report on Form 8-K filed on March 2, 2012) |
10.32 | — | Second Amendment to Fifth Amended and Restated Credit Agreement, dated May 10, 2012, among Linn Energy, LLC, Wells Fargo Bank, National Association, as administrative agent, and the other agents and lenders party thereto (incorporated herein by reference to Exhibit 10.1 to Current Report on Form 8-K filed on May 15, 2012) |
10.33 | — | Third Amendment to Fifth Amended and Restated Credit Agreement, dated July 25, 2012, among Linn Energy, LLC, Wells Fargo Bank, National Association, as administrative agent, and the other agents and lenders party thereto (incorporated herein by reference to Exhibit 10.2 to Quarterly Report on Form 10-Q filed on July 26, 2012) |
10.34 | — | Fourth Amendment to the Fifth Amended and Restated Credit Agreement among Linn Energy, LLC, as borrower, Wells Fargo Bank, National Association , as administrative agent, and the lenders and agents party thereto (incorporated herein by reference to Exhibit 10.31 to Amendment No. 5 to Registration Statement on Form S-1/A filed on October 10, 2012) |
10.35 | — | Fifth Amendment, dated February 20, 2013, to the Fifth Amended and Restated Credit Agreement among Linn Energy, LLC, as borrower, Wells Fargo Bank, National Association, as administrative agent, and the lenders and agents party thereto (incorporated herein by reference to Exhibit 10.35 to Annual Report on Form 10-K for the year ended December 31, 2012, filed on February 21, 2013) |
10.36 | — | Fifth Amended and Restated Guaranty and Pledge Agreement, dated as of May 2, 2011, made by Linn Energy, LLC and each of the other Obligors in favor of BNP Paribas, as Administrative Agent (incorporated herein by reference to Exhibit 10.1 to Quarterly Report on Form 10-Q filed on July 28, 2011) |
10.37 | — | Linn Energy, LLC Change of Control Protection Plan, dated as of April 25, 2009, (incorporated herein by reference to Exhibit 10.3 to Quarterly Report on Form 10-Q filed on May 7, 2009) |
10.38 | — | Salt Creek EOR Participation Agreement, dated April 3, 2012, by and between Howell Petroleum Corporation and Linn Energy Holdings, LLC (incorporated herein by reference to Exhibit 10.2 to Quarterly Report on Form 10-Q filed on April 26, 2012) |
12.1 | — | Computation of Ratio of Earnings to Fixed Charges (incorporated herein by reference to Exhibit 12.1 to Annual Report on Form 10-K for the year ended December 31, 2012, filed on February 21, 2013) |
21.1 | — | Significant Subsidiaries of Linn Energy, LLC (incorporated herein by reference to Exhibit 21.1 to Annual Report on Form 10-K for the year ended December 31, 2012, filed on February 21, 2013) |
23.1** | — | Consent of KPMG LLP |
23.2** | — | Consent of DeGolyer and MacNaughton |
31.1** | — | Section 302 Certification of Mark E. Ellis, Chairman, President and Chief Executive Officer of Linn Energy, LLC |
31.2** | — | Section 302 Certification of Kolja Rockov, Executive Vice President and Chief Financial Officer of Linn Energy, LLC |
32.1** | — | Section 906 Certification of Mark E. Ellis, Chairman, President and Chief Executive Officer of Linn Energy, LLC |
32.2** | — | Section 906 Certification of Kolja Rockov, Executive Vice President and Chief Financial Officer of Linn Energy, LLC |
99.1** | — | 2012 Report of DeGolyer and MacNaughton dated as of June 3, 2013 |
101.INS | — | XBRL Instance Document (previously furnished as Exhibit 101.INS to Annual Report on Form 10-K for the year ended December 31, 2012, filed on February 21, 2013) |
101.SCH | — | XBRL Taxonomy Extension Schema Document (previously furnished as Exhibit 101.SCH to Annual Report on Form 10-K for the year ended December 31, 2012, filed on February 21, 2013) |
101.CAL | — | XBRL Taxonomy Extension Calculation Linkbase Document (previously furnished as Exhibit 101.CAL to Annual Report on Form 10-K for the year ended December 31, 2012, filed on February 21, 2013) |
152
INDEX TO EXHIBITS - Continued
Exhibit Number | Description | |
101.DEF | — | XBRL Taxonomy Extension Definition Linkbase Document (previously furnished as Exhibit 101.DEF to Annual Report on Form 10-K for the year ended December 31, 2012, filed on February 21, 2013) |
101.LAB | — | XBRL Taxonomy Extension Label Linkbase Document (previously furnished as Exhibit 101.LAB to Annual Report on Form 10-K for the year ended December 31, 2012, filed on February 21, 2013) |
101.PRE | — | XBRL Taxonomy Extension Presentation Linkbase Document (previously furnished as Exhibit 101.PRE to Annual Report on Form 10-K for the year ended December 31, 2012, filed on February 21, 2013) |
* | Management Contract or Compensatory Plan or Arrangement required to be filed as an exhibit hereto pursuant to Item 601 of Regulation S-K. |
** | Filed herewith. |
153