Attached files
| file | filename |
|---|---|
| EX-99.1 - EX-99.1 - Energy Future Holdings Corp /TX/ | d620490dex991.htm |
| 8-K - FORM 8-K - Energy Future Holdings Corp /TX/ | d620490d8k.htm |
 EFH
Corp. Q3 2013 Investor Call
November 5, 2013
Exhibit 99.2 |
 1
Safe Harbor Statement
Forward Looking Statements
This presentation contains forward-looking statements, which are subject to
various risks and uncertainties. A discussion of risks and uncertainties that could
cause actual results to differ materially from management's current projections,
forecasts, estimates and expectations is contained in EFH Corp.'s filings with the
Securities and Exchange Commission (SEC). In addition to the risks and
uncertainties set forth in EFH Corp.'s SEC filings, the forward-looking statements
in this presentation regarding the company’s natural gas hedging program could
be affected by, among other things: changes in the ERCOT electricity market,
including a regulatory or legislative change, that results in wholesale electricity
prices not generally moving with natural gas prices; any decrease in market heat
rates as the program generally does not mitigate exposure to changes in market
heat rates; the unwillingness or failure of any hedge counterparty to perform their
respective obligations; or any other event that results in the inability to continue to
use a first lien on TCEH’s assets to secure a substantial portion of the hedges
under the program.
Regulation G
This presentation includes certain non-GAAP financial measures. A reconciliation of
these measures to the most directly comparable GAAP measures is included in the
appendix to this presentation. |
 2
Today’s Agenda
Q&A
Financial and Operational
Overview
Q3 2013 Review
Paul Keglevic
Executive Vice President & CFO |
 Consolidated:
Reconciliation of GAAP net income (loss) to adjusted (non-GAAP) operating results Q3
12 vs. Q3 13; $ millions, after tax
1
Three months ended September 30.
EFH Corp.
Adjusted
(Non-GAAP)
Operating
Results
-
QTR
3
Factor
Q3 12
Q3 13
Change
EFH Corp. GAAP net income (loss)
(407)
5
412
Unrealized commodity-related mark-to-market net loss
339
105
(234)
Unrealized mark-to-market net (gain) loss on interest rate swaps
14
(269)
(283)
-
(38)
(38)
Asset impairments
20
19
(1)
EFH Corp. adjusted (non-GAAP) operating loss
(34)
(178)
(144)
Items
excluded
from
adjusted
(non-GAAP)
operating
results
(after
tax)
-
noncash:
Effect
of
favorable
resolution
of
income
tax
positions
-
Competitive
Business
1 |
 Consolidated: Key
drivers of the change in adjusted (non-GAAP) operating results Q3 12 vs. Q3 13; $ millions,
after tax EFH Corp.
Adjusted
(Non-GAAP)
Operating
Results
Key
Drivers
-
QTR
Description / Drivers
Better (Worse)
Than
Q3 12
Competitive Business¹:
Lower net margin from asset management and retail activities driven by lower natural gas hedge volumes
and prices (108)
2
Contribution margin
(106)
Lower income tax benefit driven by a lower lignite depletion deduction
(23)
Higher professional services fees for liability management program
(19)
Higher net interest expense driven by higher average borrowings
(16)
Lower nuclear generation maintenance costs reflecting the fall 2012 planned outage
8
7
(149)
Regulated Business:
Higher revenues driven by transmission cost recovery
21
(12)
Higher depreciation and amortization reflecting infrastructure investment
(3)
(1)
Change in Regulated Business (~80% owned by EFH Corp.)
5
Total change in EFH Corp. adjusted (non-GAAP) operating results
(144)
1
Competitive Business consists of Competitive Electric segment and Corporate & Other.
4
All
other
–
net
All
other
–
net
Total
change
-
Competitive
Business
All
other
–
net
rd
Higher 3 party transmission fees |
 Consolidated: Reconciliation of GAAP net loss to adjusted (non-GAAP) operating
results YTD
1
12
vs.
YTD
13;
$
millions,
after
tax
1
Nine months ended September 30.
EFH Corp.
Adjusted
(Non-GAAP)
Operating
Results
-
YTD
5
Factor
YTD 12
YTD 13
Change
EFH Corp. GAAP net loss
(1,408)
(635)
773
Items
excluded
from
adjusted
(non-GAAP)
operating
results
(after
tax)
-
noncash:
Unrealized commodity-related mark-to-market net loss
831
446
(385)
Unrealized mark-to-market net (gain) loss on interest rate swaps
8
(587)
(595)
Effect
of
favorable
resolution
of
income
tax
positions
-
Competitive
Business
-
(305)
(305)
Effect
of
favorable
resolution
of
income
tax
positions
-
Oncor
-
(11)
(11)
Asset impairments
20
19
(1)
EFH Corp. adjusted (non-GAAP) operating loss
(549)
(1,073)
(524) |
 Description /
Drivers Better
(Worse)
Than
YTD 12
Competitive Business¹:
Lower net margin from asset management and retail activities driven by lower natural gas hedge volumes
and prices (407)
Higher coal generation volumes due to fewer outages, partially offset by lower nuclear generation
volumes due to refueling outage 8
Lower amortization of intangibles arising from purchase accounting
7
All other -
net
3
Contribution margin
(389)
Higher net interest expense driven by higher average borrowings
(55)
Higher professional services fees for liability management program
(43)
Higher operating costs associated with timing of outages at nuclear and scope of outages at coal
generating units (39)
Higher depreciation reflecting retirement of coal plant assets and capital investment
(10)
Lower employee-related compensation expenses reflecting
lower benefit costs and incentive compensation
15
2
Total change -
Competitive Business
(519)
Regulated Business:
Higher revenues driven by transmission cost recovery
54
(20)
Higher depreciation and amortization reflecting infrastructure investment
(16)
Lower interest income resulting from settlement of TCEH transition bond reimbursement agreement
(11)
Higher operation and maintenance expense driven by labor and benefit costs
(4)
(8)
Total change -
Regulated Business (~80% owned by EFH Corp.)
(5)
Total change in EFH Corp. adjusted (non-GAAP) operating results
(524)
Consolidated: Key drivers of the change in adjusted (non-GAAP) operating results
YTD 12 vs. YTD 13; $ millions, after tax
EFH Corp.
Adjusted
(Non-GAAP)
Operating
Results
Key
Drivers
(after
tax)
-
YTD
6
1
Competitive business consists of Competitive Electric segment and Corp. & Other.
rd
All
other
–
net
All
other
–
net
Higher 3 party transmission fees |
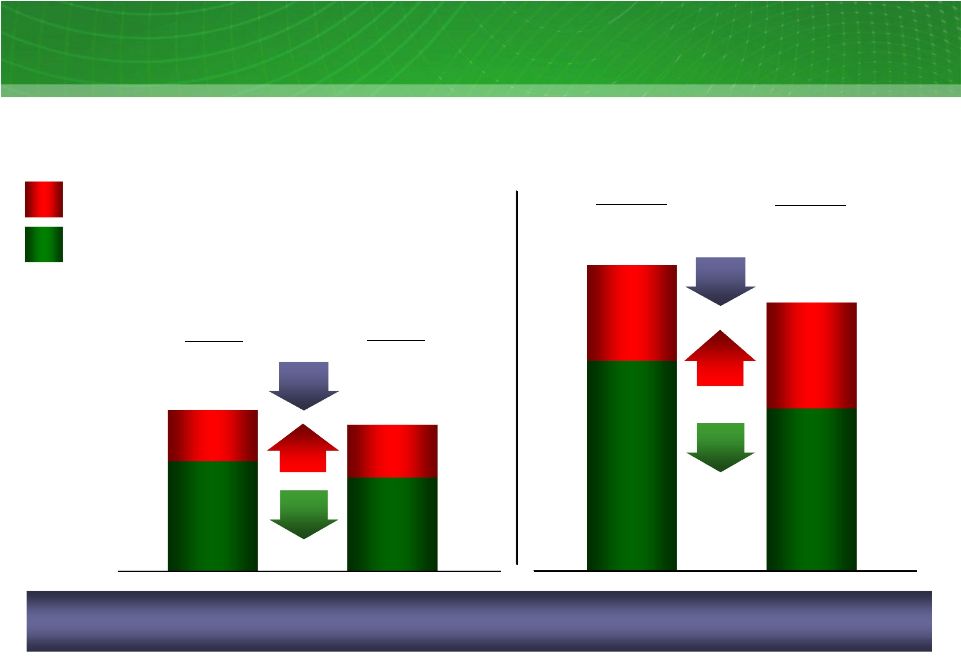 EFH
Corp. Adjusted EBITDA (Non-GAAP) EFH Corp. Adjusted EBITDA
(non-GAAP) Q3 12 vs. Q3 13 and YTD 12 vs. YTD 13;
$ millions
Q3 13
Q3 12
1,493
953
539
TCEH
Oncor
Q3 and YTD Adjusted EBITDA was largely driven by the same key drivers impacting
adjusted (non-GAAP) operating results.
7
3%
1
See Appendix for Regulation G reconciliations and definition. Includes $(2)
million, $1 million, $14 million and $7 million in Q3 12, Q3 13, YTD 12 and YTD 13, respectively, of Corp. &
Other Adjusted EBITDA.
YTD 13
YTD 12
3,618
2,207
1,404
4%
1,120
521
1,639
2,854
1,354
4,222
23%
14%
15%
9%
1 |
 Luminant Operational Results
8
Nuclear-fueled generation; GWh
Coal-fueled generation; GWh
Q3 2013 Coal-Fueled Plant Results
Solid operational performance
1.6 TWh more generation due to higher
market prices, partially offset by 0.4 TWh
less generation due to more outage days
Q3 13
Q3 12
5,276
15,772
YTD 12
YTD 13
15,170
YTD 12
Q3 12
16,474
15,179
40,004
35,929
Q3 13
YTD 13
11%
YTD
9%
QTR
4%
YTD
5,273
Q3 2013 Nuclear-Fueled Plant Results
Solid operational performance
Top decile industry performance for
reliability and cost
Solid safety performance |
 9
TXU Energy Operational Results
Total
residential
customers
3
End of period, thousands
Retail electricity sales volumes by customer class;
GWh
1,525
1,512
1
SMB –
small business.
2
LCI –
large commercial and industrial.
3
Includes December 2012 acquisition of customers.
4
Last twelve months.
YTD 12
SMB
1
LCI
2
Residential
Q3 12
12,488
31,262
Q3 12
Q2 13
3.3%
LTM
4
Q3 13
Q3 13
1,512
1,563
0.9%
QTR
29,273
Q3 13
YTD 13
4.5%
QTR
6.4%
YTD
11,920
1,757
2,846
7,885
1,635
2,679
7,606
4,694
7,892
18,676
4,156
7,478
17,639
Q3
2013
Results
Sales volumes declined 5% driven by
business volumes and residential
customer counts
Lowest Q3 residential attrition rate since
2008
YTD
2013
Results
Last twelve month residential attrition rate
improved 42% compared to 2012. Best
performance since 2009
Lower
SMB
1
and
LCI
2
volumes
reflect
competitive intensity and a focus on
margin discipline
Reduced PUC complaints to record low,
continuing top tier PUC complaint
performance |
 10
Oncor Operational Results
Electric
energy
billed
volumes
4
;
GWh
Q3 12
Q3 13
1
SMB –
small business.
2
LCI –
large commercial and industrial.
3
CREZ –
Competitive Renewable Energy Zone.
4
On average, billed volumes are on an approximate 17-day calendar lag; therefore, amounts
shown reflect partial impacts
from prior quarters. 5
Last twelve months.
Residential
SMB
1
&
LCI
2
3,232
3,275
1%
LTM
5
Electricity distribution points of delivery
End of period, thousands of meters
Q3 13
Q2 13
3,266
3,275
Q3 13
34,247
85,466
85,492
Q3 12
YTD 12
YTD 13
1%
QTR
1%
QTR
14,259
19,834
20,082
14,165
53,188
32,278
32,166
53,326
Q3
2013
Results
Slightly lower residential volumes
principally due to decreased
consumption as a result of milder
weather, partially offset by customer
growth
Slightly
higher
SMB
1
&
LCI
2
energy
volumes principally due to customer
growth
$1.842
billion
spent
on
CREZ
3
through September 30, 2013; $382
million spent YTD 2013
34,093 |
 EFH Corp. Liquidity
Management As of September 30, 2013
11
Cash and Equivalents
TCEH
Letter
of
Credit
Facility
1
TCEH Revolving Credit Facility
3,116
EFH Corp. (excluding Oncor) available liquidity
As of 9/30/13; $ millions
1,987
1
At September 30, 2013, restricted cash totaled $947 million, after reduction for a $115 million letter
of credit drawn in 2009 related to a building financing. The restricted cash supports
letters of credit, of which $776 million are outstanding, leaving $171 million available.
171
2,830
Facility Limit
LOCs/Cash Borrowings
Availability
1,816
2,054
776
1,062
2,054
EFH Corp., TCEH and EFIH continue to monitor near-term liquidity needs and opportunities
for liability management. |
 12
12
12
Commodity Prices
Commodity
Units
Q3 13
Actual
Q3 12
Actual
FY 12
1
Actual
13E
2
NYMEX gas price
3
$/MMBtu
$3.55
$2.87
$2.75
$3.60
HSC gas price
3
$/MMBtu
$3.54
$2.86
$2.71
$3.54
7x24 market heat rate (HSC)
4
MMBtu/MWh
9.14
9.31
9.53
8.09
North Hub 7x24 power price
$/MWh
$32.40
$26.68
$25.17
$28.63
TCEH weighted avg. hedge price
5
$/MMBtu
$6.89
$7.29
$7.36
$6.89
Gulf Coast ultra-low sulfur diesel
$/gallon
$3.01
$3.07
$3.05
$2.92
PRB 8400 coal
$/ton
$9.55
$6.67
$7.57
$9.25
LIBOR interest rate
6
percent
0.39%
0.71%
0.69%
0.37%
Commodity prices
Q3 13, Q3 12, FY 12 and 13E; mixed measures
1
FY 2012: Year ended December 31, 2012.
2
13E: 2013 estimate based on average of monthly commodity prices as of September 30,
2013 for October 2013 through December 2013. 3
The
actual
prices
are
computed
based
on
settled
Gas
Daily
prices
for
Henry
Hub
or
Houston
Ship
Channel
(HSC)
respectively.
4
Based on ERCOT Nodal market clearing price for North Hub.
5
Weighted
average
prices
in
the
TCEH
natural
gas
hedging
program.
Based
on
NYMEX
Henry
Hub
prices
of
forward
natural
gas
sales
positions
in
the
hedging
program
(excluding
the
impact
of
offsetting
purchases
for
rebalancing
and
pricing
point
basis
transactions).
6
The index for the settled value is a 6-month LIBOR rate.
|
 13
Factor
Measure
2013
2014
Total
06/30/13
Natural gas hedges
mm MMBtu
~123
~146
~269
Wtd.
avg.
hedge
price
1
$/MMBtu
~$6.89
~$7.80
Natural gas prices
$/MMBtu
~$3.64
~$3.91
Cum.
MtM
gain
at
06/30/13
2
$ billions
~$0.5
~$0.6
~$1.1
09/30/13
Natural
gas
hedges
3
mm MMBtu
~65
~146
~211
Wtd.
avg.
hedge
price
1
$/MMBtu
~$6.89
~$7.80
Natural gas prices
4
$/MMBtu
~$3.60
~$3.86
Cum.
MtM
gain
at
09/30/13
2
$ billions
~$0.2
~$0.6
~$0.8
Q3 13 MtM (loss) gain
$ billions
~$(0.3)
~$0.0
~$(0.3)
13
Unrealized Mark-To-Market Impact Of Hedging
Unrealized mark-to-market impact of hedging program
09/30/13 vs. 06/30/13; mixed measures, pre-tax
Overall hedge program value has decreased due to settlement of Q3 position.
1
Weighted
average
prices
are
based
on
forward
natural
gas
sales
positions
in
the
natural
gas
hedging
program
(excluding
the
impact
of
offsetting
purchases
for
rebalancing).
Where
collars
are reflected, sales price represents the approximate collar floor price. June 30, 2013
prices for 2013 represent July 1, 2013 through December 31, 2013 values and September 30, 2013
prices for 2013 represent October 1, 2013 through December 31, 2013 values.
2
MtM values include the effects of all transactions in the natural gas hedging program
including offsetting purchases (for re-balancing). 3
September 30, 2013 prices for 2013 represent October 1, 2013 through December 31, 2013
volumes. The 2014 position includes a delta equivalent short position of approximately 150
million MMBtu costless collar.
4
2013 represents the average of monthly forward prices for October 1, 2013 though December
31, 2013. |
 14
14
TCEH Natural Gas Exposure
TCEH Natural Gas Position
13-15
; million MMBtu
Hedges Backed by Asset First Lien
Open Position
Factor
Measure
2013
2014
2015
Natural gas hedging program
million MMBtu
~42
~146
0
TXUE and LUME net positions
million MMBtu
~22
~247
~34
Overall estimated percent of
total NG position hedged
percent
~96%
~78%
~7%
TCEH has hedged approximately 96% of its estimated natural gas price exposure for
2013. 1
As of September 30, 2013. Balance of 2013 is from November 1, 2013 to December 31,
2013. Assumes conversion of electricity positions based on a ~8.5 heat rate with natural gas
generally
being
on
the
margin
~70-90%
of
the
time
(i.e.
when
other
technologies
are
forecast
to
be
on
the
margin,
no
natural
gas
position
is
assumed
to
be
generated).
Includes
impacts
of
economic
backdown
and
reliability
(~3M
MMBtu
for
balance
of
2013,
~10M
MMBtu
for
2014,
~7M
MMBtu
for
2015).
Includes
Martin
Lake
3
seasonal
outage
for
2014-2015.
2
Includes estimated forward net wholesale and retail sales. Excludes any
transactions associated with proprietary trading positions. 3
The 2014 position includes delta equivalent short position of approximately 150
million MMBtu costless collar with strikes of ~$7.80/MMbtu and ~$11.75/MMBtu for puts and calls,
respectively.
3
67
42
3
22
506
113
146
247
507
473
34
2014
2013
2015
1
TXUE and Luminant Net Positions
2 |
 15
15
15
EFH Corp. Adjusted EBITDA Sensitivities
Commodity
Percent Hedged at
September 30, 2013
Change
BOY 13E Impact
$ millions
~95
0.1 MMBtu/MWh
~0
NYMEX gas price ($/MMBtu)
~96
$1/MMBtu
~3
Diesel ($/gallon)³
~91
$1/gallon
~1
Base coal ($/ton)
~97
$2/ton
~1
Generation operations
Nuclear-
and coal / lignite-fueled generation (TWh)
N/A
1 TWh
~15
Retail operations
BOY 2013
Residential contribution margin ($/MWh)
4 TWh
$1/MWh
~4
Residential consumption
4 TWh
1%
~2
Business markets consumption
3 TWh
1%
~1
Impact on EFH Corp. Adjusted EBITDA
13E
; mixed measures
The majority of 2013 commodity-related risks are significantly mitigated.
1
2013 estimate based on commodity positions as of September 30, 2013 and reflects
the existing regulatory environment under the Clean Air Interstate Rule, net of natural gas hedges and
net wholesale and retail sales. Excludes gains and losses incurred prior to
September 30, 2013. 2
Simplified
representation
of
heat
rate
position
in
a
single
TWh
position.
Heat
rate
impacts
are
typically
differentiated
across
plants
and
respective
pricing
periods:
nuclear
and
coal-fueled
plants generation (linked primarily to changes in North Hub 7x24), natural gas
plants (primarily North Hub 5x16) and wind (primarily West Hub 7x8). Assumes conversion of electricity
positions based on a ~8.5 market heat rate with natural gas generally being on the
margin ~70-90% of the time (i.e., when coal is forecast to be on the margin, no natural gas position is
assumed to be generated).
3
Includes positions related to fuel surcharge on rail transportation.
4
Excludes fuel surcharge on rail transportation.
7X24 market heat rate (MMBtu/MWh)²
4
1 |
 Estimate as of September 30, 2013; $ billions
EFH / EFIH
TCEH
1
1st Lien
-
$0.41
2
2nd Lien
$0.25
$1.88
3
Total
$0.25
$2.29
Estimated
Secured
Debt
Capacity
at
EFH
/
EFIH
and
TCEH
1
16
1
The
debt
capacity
numbers
presented
above
are
for
informational purposes
only
and
should
not
be
relied
upon
in
connection
with
any
investment
decision
regarding the
securities
of
EFH
Corp. or its subsidiaries. All of these amounts are estimates based on EFH Corp.'s current
interpretation of the covenants set forth in its and its subsidiaries' applicable debt agreements and
do not take into account exceptions in the agreements that may allow for the incurrence of
additional secured debt, including, but not limited to, acquisition debt, coverage ratio debt,
refinancing
debt,
capital
leases
and
hedging
obligations.
Moreover,
such
amounts could
change
from
time
to
time
as
a
result
of,
among
other
things,
the
termination
of
any
debt
agreement
(or specific terms therein) or a change in the debt agreement that results from negotiations
with new or existing lenders. In addition, covenants included in agreements governing additional,
future debt may impose greater or lesser restrictions on the incurrence of secured debt by
EFH Corp. and its subsidiaries. Consequently, the actual amount of senior secured debt that EFH
Corp. and its subsidiaries are permitted to incur under their respective debt agreements
could be materially different than the amounts provided above. In addition, notwithstanding available
debt
capacity,
EFH
Corp.,
EFIH
and
TCEH
may
not
be
able
to
incur
additional debt
due
to
their
financial
condition,
market
conditions
or
other
reasons.
EFH
Corp.
encourages you
to
review,
in
consultation
with
your
own
advisors,
its
and
its
subsidiaries’
various
debt
agreements,
which
are
on
file
with
the
SEC,
in
order
to
assess
the
ability
and
capacity
of
EFH
Corp.
and
its
subsidiaries
to
incur
additional debt (secured and
unsecured)
in
the
future.
2
Of this amount, $1.0B is permitted to be issued for cash (entire amount is permitted to be
issued for exchanges). 3
TCEH is permitted to issue an unlimited amount of additional first-priority debt in
order to refinance the first-priority debt outstanding under the TCEH Senior Secured Facilities.
2nd Lien
1st Lien
$0.25
$2.29
$0.25
$1.88
2
$0.41
3 |
 17
Today’s Agenda
Q&A
Financial and Operational
Overview
Q3 2013 Review
John Young
President & CEO |
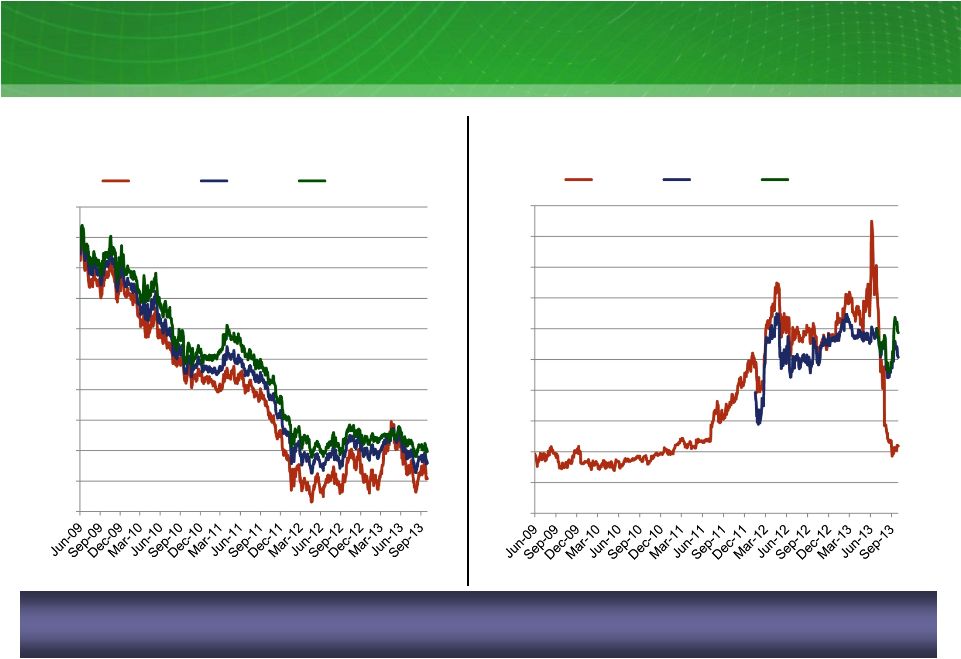 HSC Natural Gas
Prices $/MMBtu
ERCOT North Hub ATC (7x24) Heat Rate
MMBtu/MWh
Forward Natural Gas Prices and Heat Rates
Forward gas prices have shown some indications of stabilizing, but
forward heat rate markets continue to show volatility.
1
2
18
1
$7.50
$8.00
$6.50
$7.00
$5.50
$6.00
$4.50
$5.00
$3.50
$4.00
$3.00
Cal 2013
Cal 2014
Cal 2015
Cal 2013
Cal 2014
Cal 2015
11.50
12.00
10.50
11.00
9.50
10.00
8.50
9.00
7.50
8.00
7.00
1
Calendar 2013 represents market price for the balance of the year. For example, as of
September 30, 2013, the market price is for October to December 2013. 2
2015
heat
rate
represents
observable
market
data
starting
June
28,
2013. |
 19
Today’s Agenda
Q&A
Financial and Operational
Overview
Q3 2013 Review
EFH Corp. Senior Executive Team |
 20
Questions & Answers |
 21
Appendix –
Additional Slides and
Regulation G Reconciliations
Appendix |
 Financial Definitions
Measure
Definition
Adjusted (non-GAAP)
Operating Results
Net income (loss) adjusted for items representing income or losses that are not
reflective of underlying operating results. These items include
unrealized mark-to-market gains and losses, noncash impairment charges and other charges, credits or gains that
are unusual or nonrecurring. EFH Corp. uses adjusted (non-GAAP) operating
results as a measure of performance and believes that analysis of its business
by external users is enhanced by visibility to both net income (loss) prepared in accordance with
GAAP and adjusted (non-GAAP) operating earnings (losses).
Adjusted EBITDA
(non-GAAP)
EBITDA adjusted to exclude interest income, noncash items, unusual items, results of
discontinued operations and other adjustments. Adjusted EBITDA is not
intended to be an alternative to GAAP results as a measure of operating performance or an
alternative
to
cash
flows
from
operating
activities
as
a
measure
of
liquidity
or
an
alternative
to
any
other
measure
of
financial
performance presented in accordance with GAAP, nor is it intended to be used as a
measure of free cash flow available for EFH Corp.’s discretionary use,
as the measure excludes certain cash requirements such as interest payments, tax payments and other
debt service requirements. Because not all companies use identical
calculations, Adjusted EBITDA may not be comparable to similarly titled
measures of other companies. See EFH Corp.’s filings with the SEC for a detailed reconciliation of EFH Corp.’s net
income prepared in accordance with GAAP to Adjusted EBITDA.
Competitive Business
Results
Refers to the combined results of the Competitive Electric segment and Corporate
& Other. Competitive Electric segment refers to the EFH Corp.
business segment that consists principally of TCEH. Contribution Margin
(non- GAAP)
Operating revenues less fuel, purchased power costs, and delivery fees, plus or
minus net gain (loss) from commodity hedging and trading activities, which on
an adjusted (non-GAAP) basis, exclude unrealized gains and losses.
EBITDA
(non-GAAP)
Net income (loss) before interest expense and related charges, income tax expense
(benefit) and depreciation and amortization. GAAP
Generally accepted accounting principles.
Purchase Accounting
The purchase method of accounting for a business combination as prescribed by GAAP,
whereby the purchase price of a business combination
is
allocated
to
identifiable
assets
and
liabilities
(including
intangible
assets)
based
upon
their
fair
values.
The
excess
of the purchase price over the fair values of assets and liabilities is recorded as
goodwill. Depreciation and amortization due to purchase accounting represents
the net increase in such noncash expenses due to recording the fair market values of property,
plant and equipment, debt and other assets and liabilities, including intangible
assets such as emission allowances, customer relationships and sales and
purchase contracts with pricing favorable to market prices at the date of the Merger. Amortization is
reflected in revenues, fuel, purchased power costs and delivery fees, depreciation
and amortization and interest expense in the income statement.
Regulated Business Results
Refers to the results of the Regulated Delivery segment, which consists largely of
EFH Corp.’s investment in Oncor. 22 |
 23
Table 1: EFH Corp. Adjusted EBITDA Reconciliation
Three and Nine Months Ended September 30, 2012 and 2013
$ millions
1
Includes amortization of the intangible net asset value of retail and wholesale power sales
agreements, environmental credits, coal purchase contracts, nuclear fuel contracts and power
purchase
agreements
and
the
stepped-up
value
of
nuclear
fuel.
Also
includes
certain
credits
and
gains
on
asset
sales
not
recognized
in
net
income
due
to
purchase
accounting.
2012
also
reflects the write-down of mineral interests in third quarter 2012.
2
Represents
amounts
recorded
under
stock-based
compensation
accounting
standards
and
excludes
capitalized
amounts.
3
Includes certain incentive compensation expenses as well as professional fees and other
costs related to supply chain and information technology efficiency initiatives. 2012 also includes
costs related to generation plant reliability.
4
Primarily represents Sponsor Group management fees.
5
2013 includes costs associated with EFH Corp.’s liability management program.
6
Reflects noncapital outage costs.
Factor
Q3 12
Q3 13
YTD 12
YTD 13
Net income (loss)
(407)
5
(1,408)
(635)
Income tax benefit
(296)
(100)
(879)
(925)
Interest expense and related charges
944
533
2,746
1,915
Depreciation and amortization
335
335
1,015
1,030
EBITDA
576
773
1,474
1,385
Adjustments to EBITDA (pre-tax):
Oncor Holdings distributions of earnings
31
68
100
148
Interest income
(1)
-
(2)
(1)
Amortization of nuclear fuel
41
40
124
114
Purchase
accounting
adjustments
1
33
9
74
20
Impairment and write-down of other assets
8
29
9
30
Equity in earnings of unconsolidated subsidiary (net of tax)
(109)
(114)
(249)
(255)
Unrealized net loss resulting from hedging and trading transactions
526
164
1,290
693
Noncash
compensation
expense
2
4
2
11
5
Transition
and
business
optimization
costs
3
12
4
31
17
Transaction
and
merger
expenses
4
10
10
29
29
Restructuring
and
other
5
9
37
8
77
Expenses
incurred
to
upgrade
or
expand
a
generation
station
6
9
-
69
100
Subtotal
1,149
1,022
2,968
2,362
Add Oncor Adjusted EBITDA (reduced by Oncor Holdings distributions)
490
471
1,254
1,256
EFH Corp. Adjusted EBITDA per Restricted Payments Covenant
1,639
1,493
4,222
3,618 |
 24
Table 2: TCEH Adjusted EBITDA Reconciliation
Three and Nine Months Ended September 30, 2012 and 2013
$ millions
1
Includes amortization of the intangible net asset value of retail and wholesale power sales
agreements, environmental credits, coal purchase contracts, nuclear fuel contracts and power
purchase agreements and the stepped-up value of nuclear fuel. Also includes
certain credits and gains on asset sales not recognized in net income due to purchase accounting. 2012 also
reflects the write-down of mineral interests in third quarter 2012.
2
Represents
amounts
recorded
under
stock-based
compensation
accounting
standards
and
excludes
capitalized
amounts.
3
Includes certain incentive compensation expenses as well as professional fees and other
costs related to supply chain and information technology efficiency initiatives. 2012 also includes
costs related to generation plant reliability.
4
Primarily represents Sponsor Group management fees.
5
2013 includes costs associated with EFH Corp.’s liability management program.
6
Reflects noncapital outage costs.
Factor
Q3 12
Q3 13
YTD 12
YTD 13
Net income (loss)
(369)
60
(1,252)
(679)
Income tax benefit
(221)
(16)
(670)
(468)
Interest expense and related charges
749
335
2,200
1,324
Depreciation and amortization
328
331
992
1,012
EBITDA
487
710
1,270
1,189
Adjustments to EBITDA (pre-tax):
Interest income
(10)
(1)
(36)
(6)
Amortization of nuclear fuel
41
40
124
114
Purchase
accounting
adjustments
1
33
9
54
20
Impairment of assets and inventory write down
1
3
1
3
Unrealized net loss resulting from hedging and trading transactions
526
164
1,290
693
Net loss attributable to non-controlling interests
-
-
1
-
EBITDA amount attributable to consolidated unrestricted subsidiaries and other equity interests
(2)
(6)
(6)
(15)
Corp. depreciation, interest and income tax expense included in SG&A
4
1
13
8
Noncash
compensation
expense
2
3
1
8
3
Transition
and
business
optimization
costs
3
11
4
30
15
Transaction
and
merger
expenses
4
10
10
29
29
Restructuring
and
other
5
7
18
7
54
Expenses
incurred
to
upgrade
or
expand
a
generation
station
6
9
-
69
100
TCEH Adjusted EBITDA per Incurrence Covenant
1,120
953
2,854
2,207
Expenses related to unplanned generation station outages
15
16
64
35
TCEH Adjusted EBITDA per Maintenance Covenant
1,135
969
2,918
2,242 |
 25
1
Purchase accounting adjustments consist of amounts related to the accretion of an
adjustment (discount) to regulatory assets. Table 3: Oncor Adjusted EBITDA
Reconciliation Three and Nine Months Ended September 30, 2012 and 2013
$ millions
Factor
Q3 12
Q3 13
YTD 12
YTD 13
Net income
139
146
321
329
Income tax expense
92
94
213
191
Interest expense and related charges
96
94
279
283
Depreciation and amortization
201
207
577
608
EBITDA
528
541
1,390
1,411
Interest income
(3)
-
(24)
(2)
Purchase accounting adjustments
(6)
(4)
(18)
(14)
Transition and business optimization costs and other
2
2
6
9
Oncor Adjusted EBITDA
521
539
1,354
1,404
1 |