Attached files
| file | filename |
|---|---|
| 8-K - CURRENT REPORT OF MATERIAL EVENTS OR CORPORATE CHANGES - BATTALION OIL CORP | a13-22831_18k.htm |
Exhibit 99.1
|
|
NEWS RELEASE |

Halcón Resources Announces Third Quarter 2013 Financial
Results and Provides 2014 Outlook
Halcón Reports 3Q13 Average Daily Production of 37,707 Boe/d; +237% Year-Over-Year
Company Guiding to >40% Pro Forma Production Growth in 2014
Halcón Expects >20% Reduction in Drilling & Completion Capex in 2014
New Company Record IP Rates; 3,914 Boe/d in Williston Basin and 1,262 Boe/d in El Halcón
Halcón Announces Positive Early Stage Downspacing Results in Williston Basin
HOUSTON, TEXAS — November 4, 2013 — Halcón Resources Corporation (NYSE:HK) (“Halcón” or the “Company”) today announced its third quarter 2013 financial results and provided guidance for 2014.
Halcón generated total revenues of $305.0 million for the three months ended September 30, 2013, which represents an increase of 316% compared to the three months ended September 30, 2012. Net production for the period increased 237% year-over-year to an average of 37,707 barrels of oil equivalent per day (Boe/d). Third quarter 2013 production was comprised of 83% oil, 6% natural gas liquids (NGLs) and 11% natural gas.
The Company realized 95% of the average NYMEX oil price, 96% of the average NYMEX natural gas price and 34% of the average NYMEX oil price for NGLs during the third quarter of 2013, excluding the impact of derivatives.
Halcón reported cash flow from operations before changes in working capital of $179.3 million, or $0.39 per diluted share for the three months ended September 30, 2013 (see Condensed Consolidated Statements of Cash Flows for a reconciliation to net cash provided by operating activities). After adjusting for selected items (see Condensed Consolidated Statements of Cash Flows and Selected Item Review and Reconciliation table for additional information), cash flow from operations before changes in working capital was $179.6 million for the quarter, or $0.39 per diluted share, compared to $29.2 million, or $0.15 per diluted share for the same period of 2012.
Total operating costs per unit during the third quarter of 2013 (including lease operating expense, workover and other expense, taxes other than income, gathering and other and general and administrative expense), after adjusting for selected items (see Selected Operating Data table for additional information), decreased by 17% to $28.30 per Boe, compared to the third quarter of 2012.
After adjusting for selected items (primarily related to non-cash impairment charges and the non-cash impact of derivatives), the Company reported net income for the quarter of $18.1 million, or $0.04 per diluted share, compared to net loss of $0.9 million, or $0.01 per diluted share in the comparable quarter of 2012 (see Selected Item Review and Reconciliation table for additional information). Halcón reported a net loss available to common stockholders of $859.9 million, or $2.19 per diluted share for the quarter. The reported net loss available to common stockholders includes non-cash pre-tax impairment charges of $1.2 billion. Transfers of unevaluated Woodbine and certain Utica/Point Pleasant property costs to the full cost pool during the period contributed to the impairment charges. There were no additional proved reserves associated with these property transfers.
Floyd C. Wilson, Chairman and Chief Executive Officer, commented, “Third quarter results were defined by continued expansion of our activities in the Williston Basin, El Halcón and other areas. We are focused on exploiting the substantial growth potential in our core plays and translating that growth into value for shareholders.”
Capital Spending, Liquidity and Recent Developments
During the third quarter of 2013, the Company incurred capital costs of $390.1 million on drilling and completions, $59.1 million on infrastructure/seismic and $65.9 million on other capital expenditures. In addition, $155.7 million was incurred to acquire producing properties and undeveloped acreage during the quarter.
Halcón received proceeds from common stock and senior unsecured notes offerings of approximately $607 million during the period, which were used to repay a portion of then outstanding borrowings under its senior secured revolving credit facility.
The Company recently closed on two of the three previously disclosed divestitures of certain non-core conventional assets. Halcón anticipates closing on the third divestiture by the end of 2013. In aggregate, as of December 31, 2012, estimated proved reserves associated with these non-core conventional assets were approximately 19.9 million barrels of oil equivalent, 67% of which was proved developed. Proved reserves were approximately 82% oil and NGLs, and these assets produced an average of approximately 4,300 Boe/d in the third quarter of 2013. As previously disclosed, total consideration for the divestment of these non-core conventional assets is estimated to be approximately $300 million, prior to closing adjustments.
The Company is reiterating previously issued 2013 production guidance of 30,000 to 34,000 Boe/d; despite the impact to fourth quarter production from the divestiture of certain non-core conventional assets. On a pro forma basis, adjusting for the impact of Halcón’s 2013 acquisition and divestiture activity, previously issued 2013 production guidance would be reduced by approximately 4,000 Boe/d.
The borrowing base on the Company’s revolving credit facility was recently increased to $850 million from $710 million in conjunction with Halcón’s regular fall redetermination. The borrowing base will be reduced to $800 million upon closing of the third non-core conventional asset divestiture. The Company anticipates it will continue to strategically divest non-core assets in 2014.
Pro forma for the borrowing base redetermination and non-core conventional asset sales, Halcón’s liquidity as of September 30, 2013 was $869.2 million, which consisted of cash on hand plus undrawn capacity on its senior secured revolving credit facility.
On October 31, 2013, the Company’s Board of Directors declared a quarterly dividend on shares of its 5.75% Series A Cumulative Perpetual Convertible Preferred Stock equal to accrued dividends from September 1, 2013 through November 30, 2013. Halcón will pay the dividend on December 2, 2013 to holders of record on November 15, 2013. The dividend payments on all of the outstanding Series A Cumulative Perpetual Preferred Stock will total approximately $5.0 million, and will be paid in shares of common stock having a fair market value (as determined under the certificate of designation governing such preferred stock) equal to the aggregate dividend amount. The Company will pay cash in lieu of issuing any fractional shares.
Bakken/Three Forks
Halcón operated an average of six rigs in the Williston Basin during the third quarter and expects to operate an average of five to six rigs in the play during the fourth quarter of 2013. Current expectations are to operate an average of four to five rigs in the basin in 2014.
The Company spudded 14 wells (7 Bakken/7 Three Forks) and put 13 wells (8 Bakken/5 Three Forks) online in the Fort Berthold area during the three months ended September 30, 2013. In addition, Halcón spudded eight Bakken wells and put four Bakken wells online in Williams County during the period. The Company also participated in 44 non-operated wells during the quarter with an average working interest of approximately 4%.
The implementation of drilling and completion modifications continues to yield positive results. Average time from spud to total depth decreased by approximately 15% to 17.7 days in the Fort Berthold area and by 17% to 17.1 days in Williams County quarter-over-quarter. Net production from the Williston Basin increased by approximately 40% quarter-over-quarter. All
Halcón-operated wells that have been drilled and completed with the modified techniques are performing significantly better than wells drilled and completed with the previous methods. During the third quarter, the Company reported its strongest Bakken IP rate to date, 3,914 Boe/d, in the Fort Berthold area.
Halcón believes increasing stage density and the amount of proppant volume per lateral foot are the primary factors contributing to the improved results in all areas of the Williston Basin. The Company also believes that the use of slickwater as the fluid type for completions has been and will continue to be a contributing factor for improved results.
Halcón recently completed its first three Bakken wells in the Fort Berthold area using slickwater as the fluid type and results are encouraging. Two wells were drilled in the South Fort Berthold area (McGregory Buttes) and had an average 60-day rate of 1,542 Boe/d, which is 58% higher than the average of all other Company-operated Bakken wells put online in this area in 2013. The third slickwater well was completed in the North Fort Berthold area (Antelope) and recently came online producing 2,820 Boe/d, a 20% improvement compared to the average of all other Company-operated Bakken wells put online in this area in 2013.
Early stage results from Halcón’s initial three well 660 foot Bakken downspacing pilot test in the North Fort Berthold area are promising. These three downspacing pilot wells recently came online producing an average of 2,665 Boe/d, which compares favorably to all other Bakken wells recently put online in the area. Based on these results, the Company has scheduled the majority of future drilling in the Fort Berthold area at 660 foot spacing. Drilling Bakken and Three Forks wells 660 feet apart has commenced on four additional pads with initial results expected late in the first quarter of 2014. In addition, Halcón plans to conduct initial Bakken downspacing tests in Williams County in early 2014. The Company is also a 15.5% working interest partner in the Continental Resources operated Rollefstad Unit, which is testing the first three benches of the Three Forks formation. Halcón expects results from this Continental Resources operated test by year end 2013.
The following is a diagram depicting the development plan for the drilling spacing unit (DSU) in the North Fort Berthold area that contains results from the Company’s initial three well 660 foot downspacing pilot test. The combined IP rate for the five wells completed with the modified techniques and recently put online in the DSU was 13,503 Boe/d.
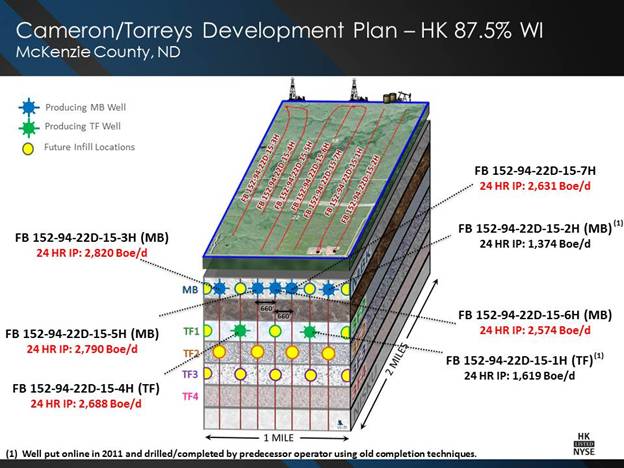
As illustrated above, continued downspacing success in the Fort Berthold area could significantly increase Halcón’s drilling inventory, production and reserves.
There are currently 132 Bakken wells producing, 5 Bakken wells being completed or waiting on completion and 3 Bakken wells being drilled on the Company’s operated acreage in the Williston Basin. In addition, there are currently 39 Three Forks wells producing, 3 Three Forks wells being completed or waiting on completion and 3 Three Forks wells being drilled on Halcón’s operated acreage.
East Texas Eagle Ford - El Halcón
The Company operated an average of three rigs in El Halcón during the three months ended September 30, 2013 and expects to operate an average of three rigs during the fourth quarter of 2013. Current expectations are to operate an average of three to four rigs in the play in 2014.
Halcón spudded 13 wells and put 19 wells online during the period. Net production increased by approximately 204% quarter-over-quarter and the Company is currently producing
approximately 6,500 Boe/d net from this core area. The Company continues to make significant progress towards optimizing well spacing and completion designs in an effort to maximize recoveries and improve returns.
Average time from spud to total depth decreased by 37% to 14.4 days during the quarter compared to the second quarter of 2013, and the average cost per foot decreased by 19% over the same period. A new Company record was recently achieved by drilling a well with an 8,000 foot lateral from spud to total depth in 7.3 days.
Halcón is in the process of drilling step out wells and early results are positive. The Company’s initial step out well, the Stasny-Honza 1H in Brazos County, Texas located approximately five miles south of the nearest Company-operated producing well, came online in the third quarter producing 1,262 Boe/d. This is a record IP rate for Halcón in this area and further de-risks its acreage position.
The Company is making substantial progress towards its goal of leasing 100,000 net acres or more in the play and currently has approximately 90,000 net acres leased or under contract. There are currently 31 Eagle Ford wells producing, 8 wells being completed or waiting on completion and 3 wells being drilled.
Utica/Point Pleasant
During the quarter, Halcón tested four wells and connected two wells into sales pipelines. The Company recently connected the Kibler 1H (Trumbull County, Ohio) into a sales pipeline.
The Kibler 1H was originally scheduled to connect into Blue Racer Midstream’s Warren 2 pipeline, but production from this well had to be rerouted as a result of the recent Natrium (West Virginia) gas processing plant fire. A temporary alternate route was finalized and made available for the early October 2013 start-up. The Kibler 1H produced an average of 358 barrels of condensate per day and 1.6 million cubic feet of gas per day into sales over the first 30 days on a restricted 24/64 choke, which is in line with internal expectations. Halcón currently expects production from this well to be flowing into Blue Racer Midstream’s Warren 2 pipeline in the first quarter of 2014.
The Company recently spudded its first offset well to the Kibler 1H. Halcón intends to continue to optimize completion techniques on its next few wells in an effort to improve performance and recoveries. In the near-term, the Company anticipates it will limit drilling in this play to the Southwest portion of its acreage in Trumbull and Mahoning Counties, Ohio.
There are currently three Utica/Point Pleasant wells producing, five wells that have been tested and are shut-in awaiting infrastructure, one well resting and one well being drilled. Halcón
expects to operate one rig in the play throughout the remainder of 2013 and anticipates six wells to be flowing into sales pipelines by year end. The Company currently expects to operate one rig in the play in 2014.
2014 Outlook
The following guidance has been adjusted to exclude production from the divestiture of certain non-core conventional assets.
|
|
|
Full Year |
| |
|
|
|
2014E |
| |
|
Production (Boe/d) |
|
|
| |
|
Low |
|
38,000 |
| |
|
High |
|
42,000 |
| |
|
% Oil |
|
80 |
% | |
|
% NGLs |
|
5 |
% | |
|
% Gas |
|
15 |
% | |
|
Operating Costs and Expenses ($/Boe) |
|
|
| |
|
Lease Operating & Workover |
|
|
| |
|
Low |
|
$ |
8.00 |
|
|
High |
|
$ |
10.00 |
|
|
Production Taxes |
|
|
| |
|
Low |
|
$ |
6.00 |
|
|
High |
|
$ |
8.00 |
|
|
Cash G&A |
|
|
| |
|
Low |
|
$ |
7.00 |
|
|
High |
|
$ |
9.00 |
|
|
Gathering, Transportation & Other |
|
|
| |
|
Low |
|
$ |
1.00 |
|
|
High |
|
$ |
2.00 |
|
|
Drilling & Completion Capex - Excluding A&D ($ in billions) (1) |
|
$ |
1.1 |
|
(1) Excludes capitalized interest/G&A and discretionary capital related to leasehold acquisitions, infrastructure and other.
Note: Guidance is forward-looking information that is subject to a number of risks and uncertainties, many of which are beyond the Company’s control. See “Forward-Looking Statements” section below.
Conference Call and Webcast Information
Halcón Resources Corporation (NYSE:HK) has scheduled a conference call for Tuesday, November 5, 2013, at 10:00 a.m. EST (9:00 a.m. CST). To participate in the conference call, dial (877) 810-3368 for domestic callers, and (914) 495-8561 for international callers a few minutes before the call begins and reference Halcón Resources conference ID 60080252. The conference call will also be webcast live over the Internet on Halcón Resources’ website at http://www.halconresources.com in the Investor Relations section under Events & Presentations. A telephonic replay of the call will be available approximately two hours after the live broadcast ends and will be accessible until November 12, 2013. To access the replay, dial (855) 859-2056 for domestic callers or (404) 537-3406 for international callers, in both cases referencing conference ID 60080252.
About Halcón Resources
Halcón Resources Corporation is an independent energy company engaged in the acquisition, production, exploration and development of onshore oil and natural gas properties in the United States.
For more information contact Scott Zuehlke, Vice President of Investor Relations, at 832-538-0314 or szuehlke@halconresources.com.
Forward-Looking Statements
This release may contain forward-looking statements within the meaning of Section 27A of the Securities Act of 1933, as amended, and Section 21E of the Securities Exchange Act of 1934, as amended. Statements that are not strictly historical statements, including, without limitation; relating to future plans or expectations, such as Halcón’s 2014 Outlook, constitute forward-looking statements and may often, but not always, be identified by the use of such words such as “expects”, “believes”, “intends”, “anticipates”, “plans”, “estimates”, “potential”, “possible”, or “probable” or statements that certain actions, events or results “may”, “will”, “should”, or “could” be taken, occur or be achieved. Additionally, initial production rates, average 60 day production rates and improvements mentioned herein are not necessarily indicative of future production rates or performance. Forward-looking statements are based on current beliefs and expectations and involve certain assumptions or estimates that involve various risks and uncertainties that could cause actual results to differ materially from those reflected in the statements. These risks include, but are not limited to, those set forth in the Company’s Annual Report on Form 10-K for the fiscal year ended December 31, 2012, Form 10-Q for the quarter ended September 30, 2013 and other filings submitted by the Company to the U.S. Securities and Exchange Commission (SEC), copies of which may be obtained from
the SEC’s website at www.sec.gov or through the Company’s website at www.halconresources.com. Readers should not place undue reliance on any such forward-looking statements, which are made only as of the date hereof. The Company has no duty, and assumes no obligation, to update forward-looking statements as a result of new information, future events or changes in the Company’s expectations.
HALCÓN RESOURCES CORPORATION
CONDENSED CONSOLIDATED STATEMENTS OF OPERATIONS (Unaudited)
(In thousands, except share and per share amounts)
|
|
|
Three Months Ended September 30, |
|
Nine Months Ended September 30, |
| ||||||||
|
|
|
2013 |
|
2012 |
|
2013 |
|
2012 |
| ||||
|
Operating revenues: |
|
|
|
|
|
|
|
|
| ||||
|
Oil, natural gas and natural gas liquids sales: |
|
|
|
|
|
|
|
|
| ||||
|
Oil |
|
$ |
288,850 |
|
$ |
65,670 |
|
$ |
672,167 |
|
$ |
109,050 |
|
|
Natural gas |
|
7,457 |
|
3,918 |
|
19,971 |
|
6,875 |
| ||||
|
Natural gas liquids |
|
7,894 |
|
3,230 |
|
15,976 |
|
7,080 |
| ||||
|
Total oil, natural gas and natural gas liquids sales |
|
304,201 |
|
72,818 |
|
708,114 |
|
123,005 |
| ||||
|
Other |
|
806 |
|
489 |
|
2,090 |
|
560 |
| ||||
|
Total operating revenues |
|
305,007 |
|
73,307 |
|
710,204 |
|
123,565 |
| ||||
|
|
|
|
|
|
|
|
|
|
| ||||
|
Operating expenses: |
|
|
|
|
|
|
|
|
| ||||
|
Production: |
|
|
|
|
|
|
|
|
| ||||
|
Lease operating |
|
37,539 |
|
14,197 |
|
94,676 |
|
30,113 |
| ||||
|
Workover and other |
|
2,029 |
|
1,123 |
|
4,276 |
|
2,384 |
| ||||
|
Taxes other than income |
|
26,613 |
|
5,814 |
|
62,616 |
|
9,648 |
| ||||
|
Gathering and other |
|
3,766 |
|
167 |
|
6,901 |
|
274 |
| ||||
|
Restructuring |
|
— |
|
725 |
|
507 |
|
1,732 |
| ||||
|
General and administrative |
|
33,762 |
|
33,124 |
|
98,885 |
|
66,327 |
| ||||
|
Depletion, depreciation and accretion |
|
143,091 |
|
22,726 |
|
320,264 |
|
34,661 |
| ||||
|
Impairment charges |
|
1,205,227 |
|
— |
|
1,205,227 |
|
— |
| ||||
|
Total operating expenses |
|
1,452,027 |
|
77,876 |
|
1,793,352 |
|
145,139 |
| ||||
|
Income (loss) from operations |
|
(1,147,020 |
) |
(4,569 |
) |
(1,083,148 |
) |
(21,574 |
) | ||||
|
Other income (expenses): |
|
|
|
|
|
|
|
|
| ||||
|
Net gain (loss) on derivative contracts |
|
(54,427 |
) |
(9,575 |
) |
(38,749 |
) |
(849 |
) | ||||
|
Interest expense and other, net |
|
(13,663 |
) |
(5,074 |
) |
(24,245 |
) |
(22,250 |
) | ||||
|
Total other income (expenses) |
|
(68,090 |
) |
(14,649 |
) |
(62,994 |
) |
(23,099 |
) | ||||
|
Income (loss) before income taxes |
|
(1,215,110 |
) |
(19,218 |
) |
(1,146,142 |
) |
(44,673 |
) | ||||
|
Income tax benefit (provision) |
|
360,283 |
|
(963 |
) |
333,868 |
|
(1,171 |
) | ||||
|
Net income (loss) |
|
(854,827 |
) |
(20,181 |
) |
(812,274 |
) |
(45,844 |
) | ||||
|
Non-cash preferred dividend |
|
— |
|
— |
|
— |
|
(88,445 |
) | ||||
|
Series A preferred dividends |
|
(5,070 |
) |
— |
|
(5,786 |
) |
— |
| ||||
|
Net income (loss) available to common stockholders |
|
$ |
(859,897 |
) |
$ |
(20,181 |
) |
$ |
(818,060 |
) |
$ |
(134,289 |
) |
|
|
|
|
|
|
|
|
|
|
| ||||
|
Net income (loss) per share of common stock: |
|
|
|
|
|
|
|
|
| ||||
|
Basic |
|
$ |
(2.19 |
) |
$ |
(0.11 |
) |
$ |
(2.22 |
) |
$ |
(1.01 |
) |
|
Diluted |
|
$ |
(2.19 |
) |
$ |
(0.11 |
) |
$ |
(2.22 |
) |
$ |
(1.01 |
) |
|
|
|
|
|
|
|
|
|
|
| ||||
|
Weighted average common shares outstanding: |
|
|
|
|
|
|
|
|
| ||||
|
Basic |
|
392,726 |
|
191,846 |
|
368,696 |
|
132,460 |
| ||||
|
Diluted |
|
392,726 |
|
191,846 |
|
368,696 |
|
132,460 |
| ||||
HALCÓN RESOURCES CORPORATION
CONDENSED CONSOLIDATED BALANCE SHEETS (Unaudited)
(In thousands, except share and per share amounts)
|
|
|
September 30, |
|
December 31, |
| ||
|
|
|
2013 |
|
2012 |
| ||
|
Current assets: |
|
|
|
|
| ||
|
Cash |
|
$ |
461 |
|
$ |
2,506 |
|
|
Accounts receivable |
|
292,278 |
|
262,809 |
| ||
|
Receivables from derivative contracts |
|
3,246 |
|
7,428 |
| ||
|
Current portion of deferred income taxes |
|
10,992 |
|
5,307 |
| ||
|
Inventory |
|
6,370 |
|
3,116 |
| ||
|
Prepaids and other |
|
16,142 |
|
6,691 |
| ||
|
Total current assets |
|
329,489 |
|
287,857 |
| ||
|
Oil and natural gas properties (full cost method): |
|
|
|
|
| ||
|
Evaluated |
|
4,806,377 |
|
2,669,245 |
| ||
|
Unevaluated |
|
1,982,188 |
|
2,326,598 |
| ||
|
Gross oil and natural gas properties |
|
6,788,565 |
|
4,995,843 |
| ||
|
Less - accumulated depletion |
|
(1,809,963 |
) |
(588,207 |
) | ||
|
Net oil and natural gas properties |
|
4,978,602 |
|
4,407,636 |
| ||
|
Other operating property and equipment: |
|
|
|
|
| ||
|
Gas gathering and other operating assets |
|
110,940 |
|
59,748 |
| ||
|
Less - accumulated depreciation |
|
(10,330 |
) |
(8,119 |
) | ||
|
Net other operating property and equipment |
|
100,610 |
|
51,629 |
| ||
|
Other noncurrent assets: |
|
|
|
|
| ||
|
Goodwill |
|
— |
|
227,762 |
| ||
|
Receivables from derivative contracts |
|
5,629 |
|
371 |
| ||
|
Debt issuance costs, net |
|
63,258 |
|
51,609 |
| ||
|
Deferred income taxes |
|
171,000 |
|
— |
| ||
|
Equity in oil and natural gas partnerships |
|
10,821 |
|
11,137 |
| ||
|
Funds in escrow |
|
847 |
|
2,090 |
| ||
|
Other |
|
11,182 |
|
934 |
| ||
|
Total assets |
|
$ |
5,671,438 |
|
$ |
5,041,025 |
|
|
|
|
|
|
|
| ||
|
Current liabilities: |
|
|
|
|
| ||
|
Accounts payable and accrued liabilities |
|
$ |
695,052 |
|
$ |
590,551 |
|
|
Liabilities from derivative contracts |
|
30,387 |
|
10,429 |
| ||
|
Asset retirement obligations |
|
1,391 |
|
2,319 |
| ||
|
Current portion of long-term debt |
|
695 |
|
— |
| ||
|
Promissory notes |
|
— |
|
74,669 |
| ||
|
Total current liabilities |
|
727,525 |
|
677,968 |
| ||
|
Long-term debt |
|
3,003,855 |
|
2,034,498 |
| ||
|
Other noncurrent liabilities: |
|
|
|
|
| ||
|
Liabilities from derivative contracts |
|
1,146 |
|
2,461 |
| ||
|
Asset retirement obligations |
|
86,646 |
|
72,813 |
| ||
|
Deferred income taxes |
|
— |
|
160,055 |
| ||
|
Other |
|
2,510 |
|
10 |
| ||
|
Commitments and contingencies |
|
|
|
|
| ||
|
Mezzanine equity: |
|
|
|
|
| ||
|
Preferred stock: 1,000,000 shares of $0.0001 par value authorized; none and 10,880 shares of 8% Automatically Convertible, issued and outstanding as of September 30, 2013 and December 31, 2012, respectively |
|
— |
|
695,238 |
| ||
|
Stockholders’ equity: |
|
|
|
|
| ||
|
Preferred stock: 1,000,000 shares of $0.0001 par value authorized; 345,000 and none shares of 5.75% Cumulative Perpetual Convertible Series A, issued and outstanding as of September 30, 2013 and December 31, 2012, respectively |
|
— |
|
— |
| ||
|
Common stock: 670,000,000 and 336,666,666 shares of $0.0001 par value authorized; 414,616,509 and 259,802,377 shares issued; 414,616,509 and 258,152,468 outstanding at September 30, 2013 and December 31, 2012, respectively |
|
41 |
|
26 |
| ||
|
Additional paid-in capital |
|
2,940,585 |
|
1,681,717 |
| ||
|
Treasury stock: none and 1,649,909 shares at September 30, 2013 and December 31, 2012, respectively, at cost |
|
— |
|
(9,298 |
) | ||
|
Accumulated deficit |
|
(1,090,870 |
) |
(274,463 |
) | ||
|
Total stockholders’ equity |
|
1,849,756 |
|
1,397,982 |
| ||
|
Total liabilities and stockholders’ equity |
|
$ |
5,671,438 |
|
$ |
5,041,025 |
|
HALCÓN RESOURECS CORPORATION
CONDENSED CONSOLIDATED STATEMENTS OF CASH FLOWS (Unaudited)
(In thousands)
|
|
|
Three Months Ended September 30, |
|
Nine Months Ended September 30, |
| ||||||||
|
|
|
2013 |
|
2012 |
|
2013 |
|
2012 |
| ||||
|
Cash flows from operating activities: |
|
|
|
|
|
|
|
|
| ||||
|
Net income (loss) |
|
$ |
(854,827 |
) |
$ |
(20,181 |
) |
$ |
(812,274 |
) |
$ |
(45,844 |
) |
|
Adjustments to reconcile net income (loss) to net cash provided by (used in) operating activities: |
|
|
|
|
|
|
|
|
| ||||
|
Depletion, depreciation and accretion |
|
143,091 |
|
22,726 |
|
320,264 |
|
34,661 |
| ||||
|
Impairment charges |
|
1,205,227 |
|
— |
|
1,205,227 |
|
— |
| ||||
|
Deferred income tax provision (benefit) |
|
(356,186 |
) |
894 |
|
(334,881 |
) |
1,030 |
| ||||
|
Share-based compensation, net |
|
5,019 |
|
1,401 |
|
11,994 |
|
3,866 |
| ||||
|
Unrealized loss (gain) on derivative contracts |
|
38,095 |
|
11,233 |
|
18,956 |
|
3,197 |
| ||||
|
Amortization and write-off of deferred loan costs |
|
835 |
|
(52 |
) |
1,343 |
|
6,247 |
| ||||
|
Non-cash interest and amortization of discount and premium |
|
341 |
|
887 |
|
1,395 |
|
8,620 |
| ||||
|
Other income (expense) |
|
(2,329 |
) |
487 |
|
(5,241 |
) |
470 |
| ||||
|
Cash flow from operations before changes in working capital |
|
179,266 |
|
17,395 |
|
406,783 |
|
12,247 |
| ||||
|
Changes in working capital, net of acquisitions |
|
(19,027 |
) |
(12,889 |
) |
(15,178 |
) |
(10,369 |
) | ||||
|
Net cash provided by (used in) operating activities |
|
160,239 |
|
4,506 |
|
391,605 |
|
1,878 |
| ||||
|
|
|
|
|
|
|
|
|
|
| ||||
|
Cash flows from investing activities: |
|
|
|
|
|
|
|
|
| ||||
|
Oil and natural gas capital expenditures |
|
(802,979 |
) |
(247,835 |
) |
(1,828,969 |
) |
(716,112 |
) | ||||
|
Other operating property and equipment capital expenditures |
|
(39,379 |
) |
(14,560 |
) |
(120,071 |
) |
(18,133 |
) | ||||
|
Proceeds received from sales of oil and gas assets |
|
160,268 |
|
— |
|
160,268 |
|
— |
| ||||
|
Acquisition of GeoResources, Inc., net of cash acquired |
|
— |
|
(579,497 |
) |
— |
|
(579,497 |
) | ||||
|
Acquisition of East Texas Assets |
|
— |
|
(296,139 |
) |
— |
|
(296,139 |
) | ||||
|
Acquisition of Williston Basin Assets |
|
(2,442 |
) |
— |
|
(32,181 |
) |
— |
| ||||
|
Funds held in escrow and other |
|
25,258 |
|
26,604 |
|
(5,547 |
) |
(2,435 |
) | ||||
|
Net cash provided by (used in) investing activities |
|
(659,274 |
) |
(1,111,427 |
) |
(1,826,500 |
) |
(1,612,316 |
) | ||||
|
|
|
|
|
|
|
|
|
|
| ||||
|
Cash flows from financing activities: |
|
|
|
|
|
|
|
|
| ||||
|
Proceeds from borrowings |
|
1,232,000 |
|
1,044,845 |
|
2,760,000 |
|
1,282,255 |
| ||||
|
Repayments of borrowings |
|
(943,000 |
) |
(120,000 |
) |
(1,858,400 |
) |
(328,000 |
) | ||||
|
Debt issuance costs |
|
(7,775 |
) |
(18,604 |
) |
(19,302 |
) |
(23,657 |
) | ||||
|
Offering costs |
|
(7,655 |
) |
(402 |
) |
(17,313 |
) |
(18,535 |
) | ||||
|
Common stock repurchased |
|
— |
|
— |
|
— |
|
(2,139 |
) | ||||
|
Series A preferred stock issued |
|
— |
|
— |
|
345,000 |
|
— |
| ||||
|
Preferred stock issued |
|
— |
|
— |
|
— |
|
311,556 |
| ||||
|
Preferred beneficial conversion feature |
|
— |
|
— |
|
— |
|
88,445 |
| ||||
|
Common stock issued |
|
222,870 |
|
— |
|
222,870 |
|
275,000 |
| ||||
|
Warrants issued |
|
— |
|
— |
|
— |
|
43,590 |
| ||||
|
Other |
|
(5 |
) |
— |
|
(5 |
) |
— |
| ||||
|
Net cash provided by (used in) financing activities |
|
496,435 |
|
905,839 |
|
1,432,850 |
|
1,628,515 |
| ||||
|
|
|
|
|
|
|
|
|
|
| ||||
|
Net increase (decrease) in cash |
|
(2,600 |
) |
(201,082 |
) |
(2,045 |
) |
18,077 |
| ||||
|
|
|
|
|
|
|
|
|
|
| ||||
|
Cash at beginning of period |
|
3,061 |
|
219,208 |
|
2,506 |
|
49 |
| ||||
|
Cash at end of period |
|
$ |
461 |
|
$ |
18,126 |
|
$ |
461 |
|
$ |
18,126 |
|
|
|
|
|
|
|
|
|
|
|
| ||||
|
Disclosure of non-cash investing and financing activities: |
|
|
|
|
|
|
|
|
| ||||
|
Accrued capitalized interest |
|
$ |
12,025 |
|
$ |
11,771 |
|
$ |
10,549 |
|
$ |
11,690 |
|
|
Asset retirement obligations |
|
4,684 |
|
643 |
|
10,077 |
|
689 |
| ||||
|
Non-cash preferred dividend |
|
— |
|
— |
|
— |
|
88,445 |
| ||||
|
Series A preferred dividends paid in common stock |
|
4,133 |
|
— |
|
4,133 |
|
— |
| ||||
|
Payment-in-kind interest |
|
— |
|
5,804 |
|
— |
|
14,669 |
| ||||
|
Common stock issued for GeoResources, Inc. |
|
— |
|
321,416 |
|
— |
|
321,416 |
| ||||
|
Common stock issued for the East Texas Assets |
|
— |
|
130,623 |
|
— |
|
130,623 |
| ||||
HALCÓN RESOURCES CORPORATION
SELECTED OPERATING DATA
(Unaudited)
|
|
|
Three Months Ended September 30, |
|
Nine Months Ended September 30, |
| ||||||||
|
|
|
2013 |
|
2012 |
|
2013 |
|
2012 |
| ||||
|
Production volumes: |
|
|
|
|
|
|
|
|
| ||||
|
Oil (MBbls) |
|
2,885 |
|
704 |
|
7,028 |
|
1,151 |
| ||||
|
Natural gas (Mmcf) |
|
2,195 |
|
1,441 |
|
5,887 |
|
2,640 |
| ||||
|
Natural gas liquids (MBbls) |
|
218 |
|
85 |
|
456 |
|
163 |
| ||||
|
Total (MBoe) |
|
3,469 |
|
1,029 |
|
8,465 |
|
1,754 |
| ||||
|
Average daily production (Boe) |
|
37,707 |
|
11,185 |
|
31,007 |
|
6,401 |
| ||||
|
|
|
|
|
|
|
|
|
|
| ||||
|
Average prices: |
|
|
|
|
|
|
|
|
| ||||
|
Oil (per Bbl) |
|
$ |
100.12 |
|
$ |
93.28 |
|
$ |
95.64 |
|
$ |
94.74 |
|
|
Natural gas (per Mcf) |
|
3.40 |
|
2.72 |
|
3.39 |
|
2.60 |
| ||||
|
Natural gas liquids (per Bbl) |
|
36.21 |
|
38.00 |
|
35.04 |
|
43.44 |
| ||||
|
Total per Boe |
|
87.69 |
|
70.77 |
|
83.65 |
|
70.13 |
| ||||
|
|
|
|
|
|
|
|
|
|
| ||||
|
Cash effect of derivative contracts: |
|
|
|
|
|
|
|
|
| ||||
|
Oil (per Bbl) |
|
$ |
(6.03 |
) |
$ |
0.65 |
|
$ |
(3.03 |
) |
$ |
0.04 |
|
|
Natural gas (per Mcf) |
|
0.48 |
|
0.83 |
|
0.26 |
|
1.09 |
| ||||
|
Natural gas liquids (per Bbl) |
|
— |
|
— |
|
— |
|
— |
| ||||
|
Total per Boe |
|
(4.71 |
) |
1.61 |
|
(2.34 |
) |
1.67 |
| ||||
|
|
|
|
|
|
|
|
|
|
| ||||
|
Average prices computed after cash effect of settlement of derivative contracts: |
|
|
|
|
|
|
|
|
| ||||
|
Oil (per Bbl) |
|
$ |
94.09 |
|
$ |
93.93 |
|
$ |
92.61 |
|
$ |
94.78 |
|
|
Natural gas (per Mcf) |
|
3.88 |
|
3.55 |
|
3.65 |
|
3.69 |
| ||||
|
Natural gas liquids (per Bbl) |
|
36.21 |
|
38.00 |
|
35.04 |
|
43.44 |
| ||||
|
Total per Boe |
|
82.98 |
|
72.38 |
|
81.31 |
|
71.80 |
| ||||
|
|
|
|
|
|
|
|
|
|
| ||||
|
Average cost per Boe: |
|
|
|
|
|
|
|
|
| ||||
|
Production: |
|
|
|
|
|
|
|
|
| ||||
|
Lease operating, as adjusted(1) |
|
$ |
10.82 |
|
$ |
13.80 |
|
$ |
11.18 |
|
$ |
16.87 |
|
|
Workover and other |
|
0.58 |
|
1.09 |
|
0.51 |
|
1.36 |
| ||||
|
Taxes other than income |
|
7.67 |
|
5.65 |
|
7.40 |
|
5.50 |
| ||||
|
Gathering and other |
|
1.09 |
|
0.16 |
|
0.82 |
|
0.16 |
| ||||
|
General and administrative, as adjusted(1) |
|
8.14 |
|
13.56 |
|
9.95 |
|
17.11 |
| ||||
|
Restructuring costs |
|
— |
|
0.70 |
|
0.06 |
|
0.99 |
| ||||
|
Depletion |
|
40.31 |
|
20.99 |
|
36.94 |
|
18.32 |
| ||||
(1) Represents lease operating and general and administrative costs per Boe, adjusted for items noted in the reconciliation below:
|
General and administrative: |
|
|
|
|
|
|
|
|
| ||||
|
General and administrative, as reported |
|
$ |
9.74 |
|
$ |
32.19 |
|
$ |
11.68 |
|
$ |
37.81 |
|
|
Share-based compensation: |
|
|
|
|
|
|
|
|
| ||||
|
Cash |
|
— |
|
— |
|
— |
|
(1.03 |
) | ||||
|
Non-cash |
|
(1.45 |
) |
(1.36 |
) |
(1.42 |
) |
(2.41 |
) | ||||
|
Recapitalization and change in control: |
|
|
|
|
|
|
|
|
| ||||
|
Cash |
|
— |
|
— |
|
— |
|
(5.05 |
) | ||||
|
Non-cash |
|
— |
|
— |
|
— |
|
— |
| ||||
|
Acquisition and merger transaction costs: |
|
|
|
|
|
|
|
|
| ||||
|
Cash |
|
(0.15 |
) |
(17.27 |
) |
(0.31 |
) |
(12.21 |
) | ||||
|
General and administrative, as adjusted |
|
$ |
8.14 |
|
$ |
13.56 |
|
$ |
9.95 |
|
$ |
17.11 |
|
|
|
|
|
|
|
|
|
|
|
| ||||
|
Lease operating costs, as reported |
|
$ |
10.82 |
|
$ |
13.80 |
|
$ |
11.18 |
|
$ |
17.17 |
|
|
Recapitalization and change in control: |
|
|
|
|
|
|
|
|
| ||||
|
Cash |
|
— |
|
— |
|
— |
|
(0.30 |
) | ||||
|
Lease operating costs, as adjusted |
|
$ |
10.82 |
|
$ |
13.80 |
|
$ |
11.18 |
|
$ |
16.87 |
|
|
|
|
|
|
|
|
|
|
|
| ||||
|
Total operating costs, as reported |
|
$ |
29.90 |
|
$ |
52.89 |
|
$ |
31.59 |
|
$ |
62.00 |
|
|
Total adjusting items |
|
(1.60 |
) |
(18.63 |
) |
(1.73 |
) |
(21.00 |
) | ||||
|
Total operating costs, as adjusted(2) |
|
$ |
28.30 |
|
$ |
34.26 |
|
$ |
29.86 |
|
$ |
41.00 |
|
(2) Represents lease operating, workover and other expense, taxes other than income, gathering and other expense and general and administrative costs per Boe, adjusted for items noted in reconciliation above.
HALCÓN RESOURCES CORPORATION
SELECTED ITEM REVIEW AND RECONCILIATION (Unaudited)
(In thousands, except per share amounts)
|
|
|
Three Months Ended September 30, |
|
Nine Months Ended September 30, |
| ||||||||
|
|
|
2013 |
|
2012 |
|
2013 |
|
2012 |
| ||||
|
|
|
|
|
|
|
|
|
|
| ||||
|
Unrealized loss (gain) on derivatives contracts: |
|
|
|
|
|
|
|
|
| ||||
|
Crude oil |
|
$ |
37,935 |
|
$ |
10,717 |
|
$ |
23,108 |
|
$ |
2,670 |
|
|
Natural gas |
|
160 |
|
1,100 |
|
(2,729 |
) |
1,971 |
| ||||
|
Interest rate |
|
— |
|
— |
|
— |
|
(518 |
) | ||||
|
Total mark-to-market non-cash charge |
|
38,095 |
|
11,817 |
|
20,379 |
|
4,123 |
| ||||
|
Impairment charges |
|
1,205,227 |
|
— |
|
1,205,227 |
|
— |
| ||||
|
Deferred financing costs expensed, net(1) |
|
891 |
|
— |
|
891 |
|
— |
| ||||
|
Recapitalization expenditures(2) |
|
— |
|
— |
|
— |
|
21,980 |
| ||||
|
Restructuring(3) |
|
— |
|
725 |
|
507 |
|
1,732 |
| ||||
|
Acquisition and merger transaction costs and other |
|
533 |
|
17,773 |
|
2,585 |
|
21,412 |
| ||||
|
Selected items, before income taxes and preferred dividend |
|
1,244,746 |
|
30,315 |
|
1,229,589 |
|
49,247 |
| ||||
|
Income tax effect of selected items(4) |
|
(373,536 |
) |
(11,004 |
) |
(367,963 |
) |
(17,877 |
) | ||||
|
Selected items, net of tax and before preferred dividends |
|
871,210 |
|
19,311 |
|
861,626 |
|
31,370 |
| ||||
|
Non-cash preferred dividend |
|
— |
|
— |
|
— |
|
88,445 |
| ||||
|
Series A Preferred dividends |
|
5,070 |
|
— |
|
5,786 |
|
— |
| ||||
|
Selected items, net of tax |
|
876,280 |
|
19,311 |
|
867,412 |
|
119,815 |
| ||||
|
Net income (loss) available to common stockholders, as reported |
|
(859,897 |
) |
(20,181 |
) |
(818,060 |
) |
(134,289 |
) | ||||
|
Net income (loss) available to common stockholders, excluding selected items |
|
16,383 |
|
(870 |
) |
49,352 |
|
(14,474 |
) | ||||
|
Interest on convertible debt, net |
|
1,698 |
|
— |
|
3,671 |
|
— |
| ||||
|
Net income (loss) available to common stockholders after assumed conversions, excluding selected items |
|
$ |
18,081 |
|
$ |
(870 |
) |
$ |
53,023 |
|
$ |
(14,474 |
) |
|
|
|
|
|
|
|
|
|
|
| ||||
|
Basic net income (loss) per common share, as reported |
|
$ |
(2.19 |
) |
$ |
(0.11 |
) |
$ |
(2.22 |
) |
$ |
(1.01 |
) |
|
Impact of selected items |
|
2.23 |
|
0.10 |
|
2.35 |
|
0.90 |
| ||||
|
Basic net income (loss) per common share, excluding selected items |
|
$ |
0.04 |
|
$ |
(0.01 |
) |
$ |
0.13 |
|
$ |
(0.11 |
) |
|
|
|
|
|
|
|
|
|
|
| ||||
|
Diluted net income (loss) per common share, as reported |
|
$ |
(2.19 |
) |
$ |
(0.11 |
) |
$ |
(2.22 |
) |
$ |
(1.01 |
) |
|
Impact of selected items |
|
2.23 |
|
0.10 |
|
2.34 |
|
0.90 |
| ||||
|
Diluted net income (loss) per common share, excluding selected items(5) |
|
$ |
0.04 |
|
$ |
(0.01 |
) |
$ |
0.12 |
|
$ |
(0.11 |
) |
|
|
|
|
|
|
|
|
|
|
| ||||
|
Cash flow from operations before changes in working capital |
|
$ |
179,266 |
|
$ |
17,395 |
|
$ |
406,783 |
|
$ |
12,247 |
|
|
Cash components of selected items |
|
533 |
|
18,498 |
|
3,092 |
|
36,810 |
| ||||
|
Income tax effect of selected items |
|
(196 |
) |
(6,715 |
) |
(1,137 |
) |
(13,362 |
) | ||||
|
Cash flow from operations before changes in working capital, adjusted for selected items |
|
$ |
179,603 |
|
$ |
29,178 |
|
$ |
408,738 |
|
$ |
35,695 |
|
|
|
|
|
|
|
|
|
|
|
| ||||
|
Cash flow from operations before changes in working capital per diluted share(5) |
|
$ |
0.39 |
|
$ |
0.09 |
|
$ |
0.90 |
|
$ |
0.09 |
|
|
Impact of selected items |
|
— |
|
0.06 |
|
0.01 |
|
0.18 |
| ||||
|
Cash flow from operations before changes in working capital per diluted share, adjusted for selected items(5) |
|
$ |
0.39 |
|
$ |
0.15 |
|
$ |
0.91 |
|
$ |
0.27 |
|
(1) Represents charges related to the write-off of debt issuance costs associated with decreases in the Company’s borrowing base under its senior revolving credit facility.
(2) Represents costs related to the recapitalization, change in control and credit facility refinancing.
(3) Represents costs related to relocating key administrative functions to corporate headquarters.
(4) Represents tax impact using an estimated tax rate of 36.77%. Also included in this line item is $84.2 million associated with the writeoff of goodwill which is non-deductible for income tax purposes.
(5) The impact of selected items for the three months and nine months ended September 30, 2013 was calculated based upon weighted average diluted shares of 462.8 million and 450.7 million, respectively, due to the net income available to common stockholders, excluding selected items.