Attached files
| file | filename |
|---|---|
| 8-K - 8-K - ASSOCIATED BANC-CORP | d621939d8k.htm |
 FOURTH QUARTER 2013
ASSOCIATED BANC-CORP
INVESTOR
PRESENTATION
Exhibit 99.1 |
 FORWARD-LOOKING STATEMENTS
1
Important note regarding forward-looking statements:
Statements made in this presentation which are not purely historical are
forward-looking statements, as defined in the Private Securities
Litigation Reform Act of 1995. This includes any statements regarding
management’s plans, objectives, or goals for future operations,
products or services, and forecasts of its revenues, earnings, or other measures of
performance.
Such forward-looking statements may be identified by the use of words such
as “believe”, “expect”, “anticipate”,
“plan”, “estimate”, “should”, “will”, “intend”, “outlook”, or
similar expressions.
Forward-looking statements are based on current management
expectations and, by their nature, are subject to risks and uncertainties. Actual
results may differ
materially
from
those
contained
in
the
forward-looking
statements.
Factors
which
may
cause actual results to differ materially from those contained in such
forward-looking statements include those identified in the
company’s most recent Form 10-K and subsequent SEC filings.
Such factors are incorporated herein by reference. |
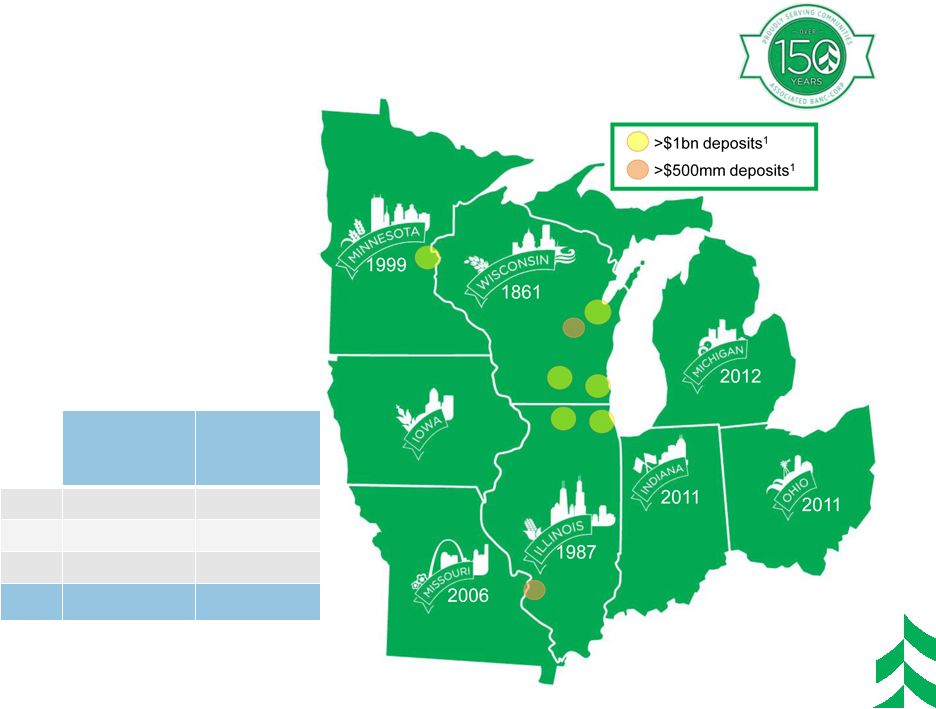 OUR
FOOTPRINT AND FRANCHISE •
Top 50, publicly traded,
U.S. bank holding
company
•
$24 billion in assets;
largest bank
headquartered in
Wisconsin
•
239 branches serving
approximately one
million customers
About Associated
ASBC
Deposits² ($
in billions)
ASBC
Branches²
WI
$11.9
170
IL
$4.9
44
MN
$1.5
25
Total
$18.3
239
1
FDIC market share data 6/30/13
2
As of 9/30/13 (Period End)
2 |
 ATTRACTIVE MIDWEST MARKETS
3
•
Population:
Over
60
mm
people
live
in
our
footprint
(~
20%
of
USA)
1
.
–
Favorable
Credit:
Five
of
the
top
ten
cities
with
the
best
consumer
credit
scores
are
in
our
footprint.
2
•
GDP
Metrics:
$2.9
trillion
in
2012
(18.4%
of
US
GDP).
4%
growth
from
2011
is
consistent
with
the
national
average.
3
–
Manufacturing
Concentrated:
Top
3
states
(Indiana,
Wisconsin,
and
Iowa)
for
concentration
of
manufacturing
jobs
and
two
other
states
in
the
top 10.
4
–
Manufacturing
Growth:
Midwest
Manufacturing
output
is
up
6.7%
CAGR
from
2011
vs.
national
index
increase
of
3.2%
CAGR
5
.
•
Favorable
Outlook:
State
Leading
Indexes
has
Indiana,
Minnesota
and
Wisconsin
as
three
of
highest
in
expected
6
month
economic
growth.
6
1
US
Census
Bureau
2012
;
2
Experian
State
of
Credit
Survey
2012
3
US
Department
of
Commerce;
4
March
2012
Brookings
Paper
;
5
FRB
Chicago
Midwest Manufacturing Index, Aug 2013.Aug 2012, Aug 2011;
6
Federal Reserve of Philadelphia –
State Leading Indexes –
Aug 2013 |
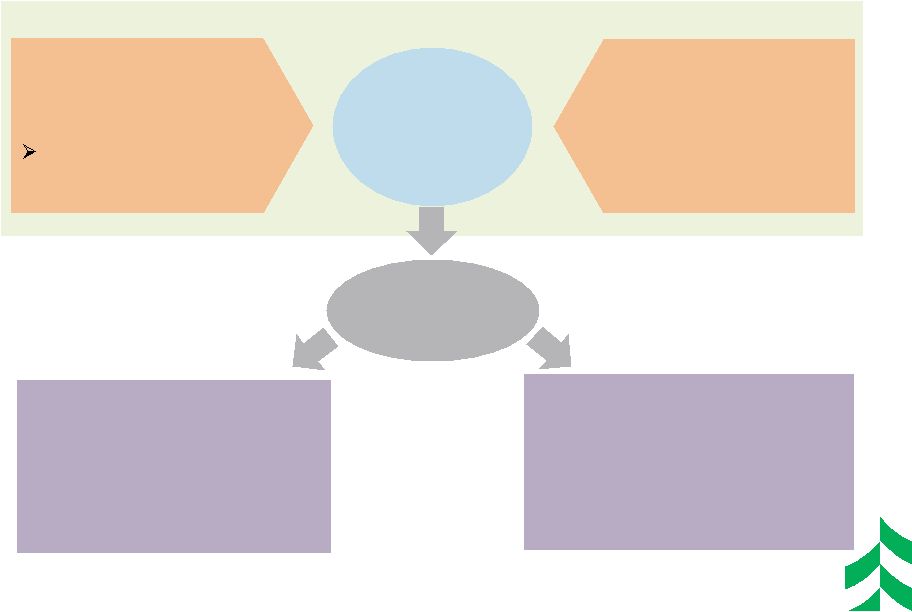
 ASSOCIATED AT ITS CORE
4
Community
bank values,
flexibility,
decision-
making,
attention to
relationships
and service
Big bank
products,
strength,
lending limits,
efficiency,
innovation,
depth of
expertise |
 2013
HIGHLIGHTS AND OUTLOOK 5
•
Net income of $137 mm; EPS of
$0.82, up 11% from YTD 2012
•
Average loans of $15.7 bn, up 5%
compared to 3Q 2012
•
Average deposits up $2 bn from
3Q 2012 to $17.6 bn
•
Efficiency Ratio down 90 bps,
FTEs down 5%
•
T1CE ratio of 11.6%
•
Repurchased $120 mm of stock
(through October 2013)
2013 (YTD Sep) Highlights:
Outlook –
Growing the
Franchise & Creating Long-
Term Shareholder Value
•
Continued focus on organic
growth opportunities
•
Defending NIM compression
in low-rate environment
•
Strong focus on efficiency &
expense management
•
Disciplined focus on
deploying capital to drive
long-term shareholder value |
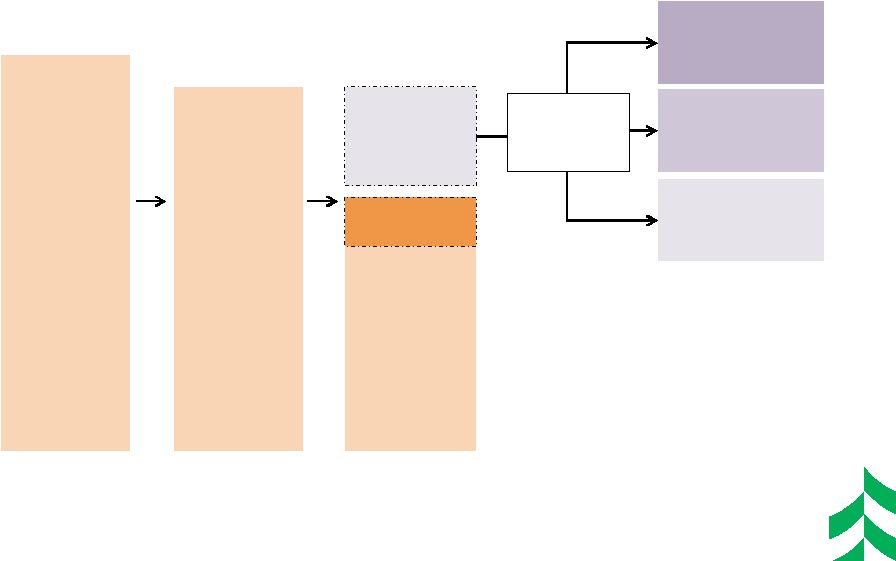
 Strong lending base in high-quality, low-
volatility diversified assets to provide
foundation for selective and prudent risk
taking in higher risk asset classes.
Core lending markets in Midwest with
primary emphasis placed on Wisconsin,
Minnesota, Illinois, Missouri, Iowa, Indiana,
Ohio and Michigan.
•
Retail –
30-40%
•
C&I –
30-40%
•
CRE –
25-35%
INTERNAL PORTFOLIO MANAGEMENT
6
Asset Mix
Geographic Mix
Industry Mix
39%
37%
24%
~88% in
footprint
•
Oil/Gas: 3%
•
Power/
Utilities 3%
Goals
Current |
 RESHAPING & REBUILDING THE LOAN
PORTFOLIO
1
7
1
Based on Average Balances, $ in Billions
Installment
Home Equity
Residential
Mortgage &
HE 1 Liens
Construction
CRE
Investor
Commercial
&
Business
Lending
st |
 Current Market Conditions
UNDERWRITING CONSIDERATIONS
8
Stronger Bank Balance
Sheets
•
Unused Capital
•
Improved Credit trends
leading to more
“supply”/more appetite
for credit
More
Competition
Low Economic Growth
•
Low new loan demand
•
Borrower de-leveraging
Competitive
Industry Wide
Implications
Loosening Structures:
Higher LTVs, Less up front
cash equity, Limited personal
recourse, Higher hold
positions, Longer loan terms,
Covenant-lite
Tighter Pricing:
Mainly with C&I, More bidding
on term sheets, Margin
compression |
 YOY
LOAN PORTFOLIO GROWTH AVERAGE LOAN GROWTH OF $808 MILLION OR 5% FROM Q3 2012 TO
Q3 2013 9
YOY Average Net Loan Change to 3Q 2013
($ in millions)
Home Equity & Installment
Commercial Real Estate
Residential Mortgage
Power & Utilities
Oil & Gas
Mortgage Warehouse
General Commercial Loans
+11.9%
% Change
+30.9%
(17.9%)
(28.0%)
+9.6%
+7.2%
+148%
Total
Commercial
& Business
Lending =
11.4% |
 GROWING NET INTEREST INCOME WHILE
MARGIN COMPRESSES
10
Yield on Interest-earning Assets
Cost of Interest-bearing Liabilities
Net Interest Income & Net Interest Margin
($ in millions) |
 COMMITTED TO EFFICIENCY IMPROVEMENTS
$ IN MILLIONS
11
Efficiency Ratio Trend
1
–
Efficiency
ratio
=
Noninterest
expense,
excluding
amortization
of
intangibles,
divided
by
sum
of
taxable
equivalent
net
interest
income
plus
noninterest
income,
excluding
investment
securities
gains,
net,
and
asset
gains,
net.
This
is
a
non-GAAP
financial
measure.
Please
refer
to
the
appendix
for
a
reconciliation
of
this
and
other
non-GAAP
items.
2
–
Peer
Average
=
based
on
ASBC’s
peer
group
and
sourced
from
SNL.
3
–
Net
Interest
Income
after
provision
for
loan
losses.
64.5%
Peer Average
Net Interest Income Trend
Noninterest Income Trend
Noninterest Expense Trend
Opportunity
3
1
2 |
 PURSUING EFFICIENCY GAINS
12
Areas of Focus
Back Office Initiatives:
•
Implementing
technology solutions
in labor intensive
processes
Real Estate Initiatives:
•
Actions to optimize
our real estate
holdings and capacity
Distribution Model
Initiatives:
•
Optimize the ways
that we interact with
our customers
Examples
•
New commercial loan
system with end to
end processing
•
Outsourcing testing
and development
•
Right-sizing
mortgage processing
Examples
•
Consolidation of
corporate offices in
Green Bay and
Chicago
•
Consolidating certain
operations in Green
Bay and Stevens
Point
Examples
•
Footprint
improvements
•
Channel
development and
optimization |
 RATIONALIZE FOOTPRINT
13
Consolidated 24% of branches since 2007.
* Projection based on three branches closing during 4Q 2013 and eight more in 1Q
2014. |
 Deposit
Automation
ATM
REINVIGORATE MODEL
14
Lower Cost Branch Concepts
•
Deposit
Automation
ATM
•
Transaction
Express
•
Financial
Outlets
Enhanced Virtual Banking
•
Online &
Mobile
Banking
•
Remote
Deposit
•
Person-to-
Person
Digital Channels
•
Digital
Shopping
•
Digital Sales
•
Digital
Service
Person to
Person Virtual
•
Inbound
Sales
•
Outbound
Sales
•
Service to
Sales
Strategic Channel Evolution
Financial
Outlet
Mobile Banking &
Remote Deposit |
 CAPITAL MANAGEMENT PRIORITIES
15
Funding Organic
Growth
Paying a
Competitive
Dividend
Non-organic
Growth
Opportunities
Share Buybacks
and Redemptions
Priority
Highest
Lowest
2012
2013
•
Fund Loan Growth and other Capital Investments
•
Repurchased $60 mm of
Common Stock
•
Redeemed $205 mm in
Trust Preferred
•
Repurchased $120 mm
YTD of Common Stock
•
Retired $26 mm in Sub-
Debt
•
Increased quarterly
dividend to $0.08/share in
Q4 2012
•
Increased quarterly
dividend to $0.09/ share in
Q4 2013
•
Cost Take-out Provides Greater Value
•
Maintain Discipline in Pricing of any Transaction |
 CAPITAL
DEPLOYMENT OPPORTUNITIES 16
Basel I ASBC
3Q = 11.6%
3Q = 11.0%
8% -
9.5%
Basel III ASBC
Basel III
2
Systematically Important Financial Institutions
1
Regional and Community Banks
= 7%
+1 -
2.5%
Organic Asset
Growth
Non Organic
Cash Acquisition
Repurchase /
Special Dividend
Capacity
3
In July 2013, the Federal Reserve and the OCC published final rules (the
“Basel III Capital Rules”) establishing a new comprehensive
capital framework for U.S. banking organizations. 11.0% is 3Q estimate of
Basel III capital ratio. Potential
Excess Capital
1.5 –
3%
Capital
Deployment
Options
2
1
3 |
 WHY
ASSOCIATED 17
•
Committed to Efficiency Ratio Improvement
•
Strong Capital Profile & Opportunities for
Capital Deployment
•
Leading Midwest Bank Operating in
Attractive Markets
•
Core Organic Growth Opportunity
•
Disciplined Loan and Deposit Pricing
•
Improving Credit Quality
•
Improving Earnings Profile
Reasons to Invest
Net Income Available to Common & ROT1CE
Management Team Focused on Creating
Long-Term Shareholder Value
1
–
Return
on
Tier
1
Common
Equity
(ROT1CE)
=
Management
uses
Tier
1
common
equity,
along
with
other
capital measures, to assess and monitor our capital position. This is a
non-GAAP financial measure. Please refer to the appendix for a
definition of this and other non-GAAP items. Net Income Available
to Common
($ in millions)
Return on Tier 1
Common Equity
1 |
 PROMOTING THE ASSOCIATED BRAND
18 |
 ADVERTISING CAMPAIGN
19 |
 OUR
VISION 20
ASSOCIATED
will
be
the
most
admired Midwestern financial
services company, distinguished by
sound, value-added financial
solutions with personal service for
our customers, built upon a strong
commitment to our colleagues and
the communities we serve, resulting
in exceptional value for our
shareholders. |
 APPENDIX
21 |
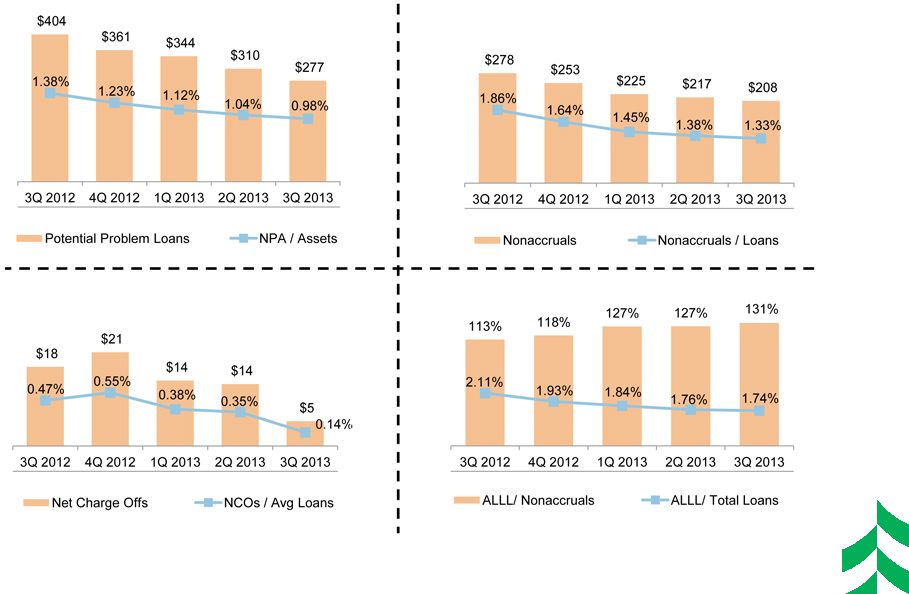 IMPROVEMENT IN CREDIT QUALITY INDICATORS
($ IN MILLIONS)
22 |
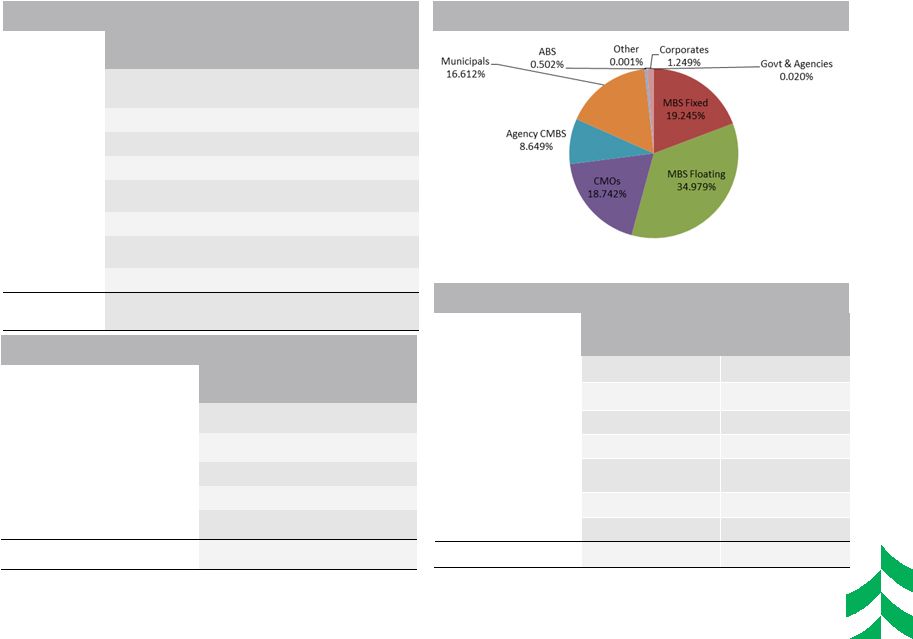 Market Value Composition –
September 30, 2013
Investment Portfolio –
September 30, 2013
Credit Rating
($ in thousands)
Mkt Value
(000’s)
% of Total
Govt & Agency
$ 4,047,191
81.6%
AAA
77,000
1.6%
AA
613,006
12.4%
A
211,919
4.3%
BAA1, BAA2 & BAA3
633
0.0%
BA1 & Lower
2,438
0.1%
Non-rated
9,338
0.2%
TOTAL
$4,961,525
100.0%
Type
Bk Value
(000’s)
Mkt Value
(000’s)
TEY
(%)
Duration
(Yrs)
Govt &
Agencies
$ 1,002
$ 1,003
0.30
0.88
MBS
2,703,454
2,690,339
2.64
3.69
CMOs
931,009
929,900
2.56
2.22
Agency CMBS
444,534
429,108
1.90
3.87
Municipals
803,225
824,217
5.20
4.92
ABS
24,913
24,924
0.61
0.10
Corporates
61,096
61,974
1.73
1.26
Other
18
60
---
---
TOTAL HTM &
AFS
$4,969,251
$4,961,525
2.96
3.59
INVESTMENT SECURITIES PORTFOLIO
23
Portfolio Composition Ratings –
September 30, 2013
Type
Mk Value
(000’s)
% of Total
0% RWA
$ 485,025
10%
20% RWA
4,414,378
89%
50% RWA
23,015
0%
=>100% RWA
49,009
1%
Not subject to RW
-9,902
0%
TOTAL Market Value
$4,961,525
100%
Risk –
Weighted Profile –
September 30, 2013
Risk –
weighted profile estimated as of October 11,2013
|
 SEGMENT PROFITABILITY
YTD SEPTEMBER 2013
24
* Average Earning Assets |
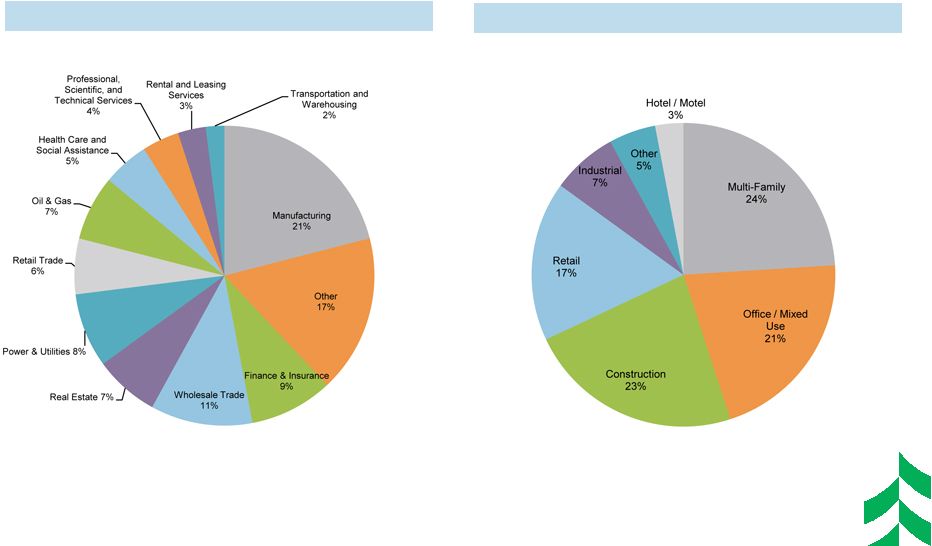 COMMERCIAL LOANS BY INDUSTRY
AS OF SEPTEMBER 30, 2013
25
CB&L Loans by Industry
1
Based on NAICS codes
($5.9 billion)
CRE Loans by Industry
($3.7 billion)
1 |
 COMMERCIAL LOAN PORTFOLIOS BY
GEOGRAPHY
AS OF SEPTEMBER 30, 2013
26
Commercial & Business Loans by State
CRE Loans by State
($5.9 billion)
($3.7 billion)
1
Includes Missouri, Indiana, Ohio, Michigan, & Iowa
|
 CONSUMER LOAN PORTFOLIOS BY
GEOGRAPHY
AS OF SEPTEMBER 30, 2013
27
Residential Mortgage Loans by State
Home Equity Loans by State
Approximately half of home equity
portfolio is in first-lien position
($3.7 billion)
($1.9 billion)
1
Includes Missouri, Indiana, Ohio, Michigan, & Iowa
|
 NONINTEREST INCOME AND EXPENSE
COMPOSITION
YTD SEPTEMBER 2013
28
Noninterest Income by Category
Noninterest Expense by Category
($237 million)
($501 million) |
 RECONCILIATION AND DEFINITIONS OF
NON-GAAP ITEMS
29
YTD 2013
YTD 2012
3Q 2013
2Q 2013
1Q 2013
4Q 2012
3Q 2012
Efficiency Ratio Reconciliation:
Efficiency ratio (1)
70.11%
72.65%
71.10%
69.54%
69.74%
73.71%
72.81%
Taxable equivalent adjustment
(1.44)
(1.62)
(1.49)
(1.39)
(1.46)
(1.57)
(1.61)
Asset gains (losses), net
0.26
(1.16)
0.58
(0.01)
0.24
(0.06)
(0.98)
Other intangible amortization
(0.42)
(0.44)
(0.44)
(0.41)
(0.42)
(0.43)
(0.43)
Efficiency ratio, fully taxable equivalent (1)
68.51%
69.43%
69.75%
67.73%
68.10%
71.65%
69.79%
(1)
Efficiency
ratio
is
defined
by
the
Federal
Reserve
guidance
as
noninterest
expense
divided
by
the
sum
of
net
interest
income
plus
noninterest
income, excluding investment securities gains / losses, net. Efficiency
ratio, fully taxable equivalent, is noninterest expense, excluding other
intangible amortization, divided by the sum of taxable equivalent net interest
income plus noninterest income, excluding investment securities gains /
losses, net and asset gains / losses, net. This efficiency ratio is presented on a taxable equivalent basis, which adjusts net interest
income for the tax-favored status of certain loans and investment
securities. Management believes this measure to be the preferred industry
measurement of net interest income as it enhances the comparability of net interest
income arising from taxable and tax-exempt sources and it excludes
certain specific revenue items (such as investment securities gains / losses, net and asset gains / losses, net).
Definition of Tier 1 Common Equity :
Tier
1
Common
Equity
(T1CE),
a
non-GAAP
financial
measure,
is
used
by
banking
regulators,
investors
and
analysts
to
assess
and
compare
the
quality and composition of our capital with the capital of other
financial services companies. Management uses Tier 1 common equity, along with
other capital measures, to assess and monitor our capital position. Tier 1
Common Equity is Tier 1 capital excluding qualifying perpetual preferred
stock and qualifying trust preferred securities. |