Attached files
| file | filename |
|---|---|
| 8-K - EXELIS INC. 8-K - Exelis Inc. | a50741711.htm |
| EX-99.1 - EXHIBIT 99.1 - Exelis Inc. | a50741711ex99_1.htm |
Exhibit 99.2
 Third Quarter 2013
Earnings Presentation David Melcher Chief Executive Officer and
President Peter Milligan Senior Vice President and Chief Financial
Officer November 1, 2013
Third Quarter 2013
Earnings Presentation David Melcher Chief Executive Officer and
President Peter Milligan Senior Vice President and Chief Financial
Officer November 1, 2013
 Safe Harbor
Statement 2 Safe Harbor Statement under the Private Securities
Litigation Reform Act of 1995 (the “Act”): Some of the information
included herein includes forward-looking statements intended to qualify
for the safe harbor from liability established by the Private Securities
Litigation Reform Act of 1995 (the “Act”). Whenever used, words such as
“anticipate,” “estimate,” “expect,” “project,” “intend,” “plan,”
“believe,” “target,” “may,” “could,” “outlook” and other terms of
similar meaning are intended to identify such forward-looking
statements. Forward-looking statements are uncertain and to some extent
unpredictable, and involve known and unknown risks, uncertainties and
other important factors that could cause actual results to differ
materially from those expressed in, or implied from, such
forward-looking statements. The company undertakes no obligation to
update any forward-looking statements, whether as a result of new
information, future events or otherwise, except as required by law. In
addition, forward-looking statements are subject to certain risks and
uncertainties that could cause actual results to differ materially from
the company’s historical experience and our present expectations or
projections. These risks and uncertainties include, but are not limited
to: The forward-looking statements in this presentation are made as of
the date hereof and the company undertakes no obligation to update any
forward-looking statements, whether as a result of new information,
future events or otherwise. In addition, forward-looking statements are
subject to certain risks and uncertainties that could cause actual
results to differ materially from the company’s historical experience
and our present expectations or projections. These risks and
uncertainties include, but are not limited to, those described in the
Exelis Inc. Form 10-K for the fiscal year ended December 31, 2012, and
those described from time to time in our future reports filed with the
Securities and Exchange Commission. Our dependence on the defense
industry and the business risks peculiar to that industry, including
changing priorities or reductions in the U.S. Government or
international defense budgets; Government regulations and compliance
therewith, including changes to the Department of Defense procurement
process; Our international operations, including sales to foreign
customers; Competition, industry capacity and production rates;
Misconduct of our employees, subcontractors, agents and business
partners; The level of returns on postretirement benefit plan assets and
potential employee benefit plan contributions and other employment and
pension matters; Changes in interest rates and other factors that affect
earnings and cash flows; The mix of our contracts and programs, our
performance, and our ability to control costs; Governmental
investigations; Our level of indebtedness and our ability to make
payments on or service our indebtedness; Subcontractor performance;
Economic and capital markets conditions; The availability and pricing of
raw materials and components; Ability to retain and recruit qualified
personnel; Protection of intellectual property rights; Changes in
technology; Contingencies related to actual or alleged environmental
contamination, claims and concerns; Security breaches and other
disruptions to our information technology and operations; Unanticipated
changes in our tax provisions or exposure to additional income tax
liabilities; and Ability to execute our internal performance plans
including restructuring, productivity improvements and cost reduction
initiatives.
Safe Harbor
Statement 2 Safe Harbor Statement under the Private Securities
Litigation Reform Act of 1995 (the “Act”): Some of the information
included herein includes forward-looking statements intended to qualify
for the safe harbor from liability established by the Private Securities
Litigation Reform Act of 1995 (the “Act”). Whenever used, words such as
“anticipate,” “estimate,” “expect,” “project,” “intend,” “plan,”
“believe,” “target,” “may,” “could,” “outlook” and other terms of
similar meaning are intended to identify such forward-looking
statements. Forward-looking statements are uncertain and to some extent
unpredictable, and involve known and unknown risks, uncertainties and
other important factors that could cause actual results to differ
materially from those expressed in, or implied from, such
forward-looking statements. The company undertakes no obligation to
update any forward-looking statements, whether as a result of new
information, future events or otherwise, except as required by law. In
addition, forward-looking statements are subject to certain risks and
uncertainties that could cause actual results to differ materially from
the company’s historical experience and our present expectations or
projections. These risks and uncertainties include, but are not limited
to: The forward-looking statements in this presentation are made as of
the date hereof and the company undertakes no obligation to update any
forward-looking statements, whether as a result of new information,
future events or otherwise. In addition, forward-looking statements are
subject to certain risks and uncertainties that could cause actual
results to differ materially from the company’s historical experience
and our present expectations or projections. These risks and
uncertainties include, but are not limited to, those described in the
Exelis Inc. Form 10-K for the fiscal year ended December 31, 2012, and
those described from time to time in our future reports filed with the
Securities and Exchange Commission. Our dependence on the defense
industry and the business risks peculiar to that industry, including
changing priorities or reductions in the U.S. Government or
international defense budgets; Government regulations and compliance
therewith, including changes to the Department of Defense procurement
process; Our international operations, including sales to foreign
customers; Competition, industry capacity and production rates;
Misconduct of our employees, subcontractors, agents and business
partners; The level of returns on postretirement benefit plan assets and
potential employee benefit plan contributions and other employment and
pension matters; Changes in interest rates and other factors that affect
earnings and cash flows; The mix of our contracts and programs, our
performance, and our ability to control costs; Governmental
investigations; Our level of indebtedness and our ability to make
payments on or service our indebtedness; Subcontractor performance;
Economic and capital markets conditions; The availability and pricing of
raw materials and components; Ability to retain and recruit qualified
personnel; Protection of intellectual property rights; Changes in
technology; Contingencies related to actual or alleged environmental
contamination, claims and concerns; Security breaches and other
disruptions to our information technology and operations; Unanticipated
changes in our tax provisions or exposure to additional income tax
liabilities; and Ability to execute our internal performance plans
including restructuring, productivity improvements and cost reduction
initiatives.
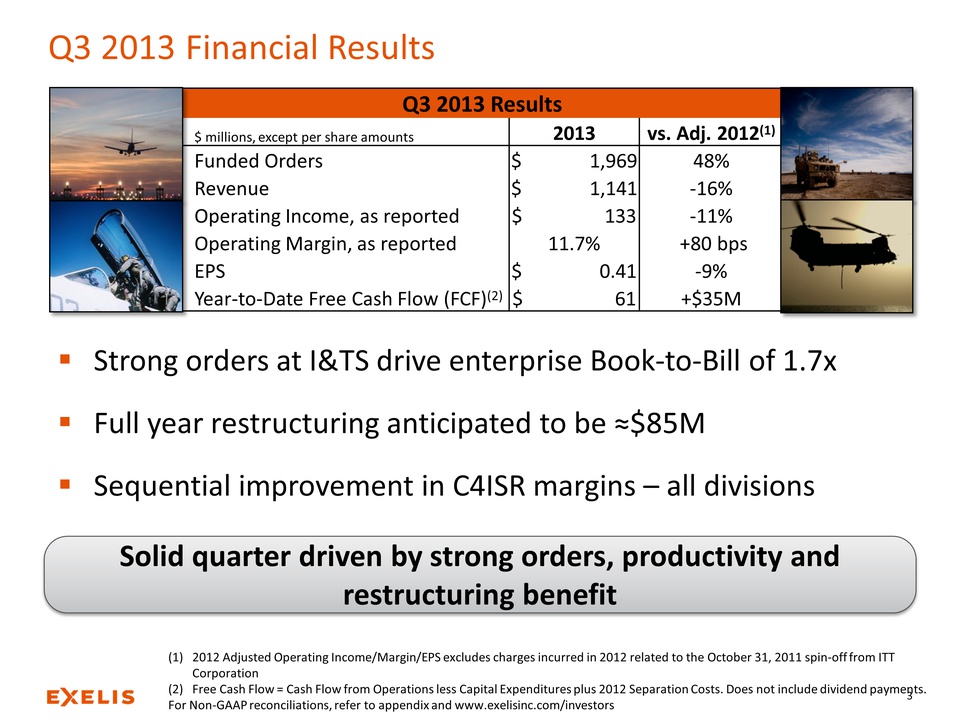 Q3 2013 Financial
Results Q3 2013 Results $ millions, except per share amounts 2013 vs.
Adj. 2012(1) Funded Orders $ 1,969 48% Revenue $ 1,141 -16% Operating
Income, as reported $ 133 -11% Operating Margin, as reported 11.7% +80
bps EPS $ 0.41 -9% Year-to-Date Free Cash Flow (FCF)(2) $ 61 +$35M
(1)2012 Adjusted Operating Income/Margin/EPS excludes charges incurred
in 2012 related to the October 31, 2011 spin-off from ITT Corporation
(2)Free Cash Flow = Cash Flow from Operations less Capital Expenditures
plus 2012 Separation Costs. Does not include dividend payments. For
Non-GAAP reconciliations, refer to appendix and
www.exelisinc.com/investors 3 Strong orders at I&TS drive enterprise
Book-to-Bill of 1.7x Full year restructuring anticipated to be ≈$85M
Sequential improvement in C4ISR margins – all divisions Solid quarter
driven by strong orders, productivity and restructuring benefit
Q3 2013 Financial
Results Q3 2013 Results $ millions, except per share amounts 2013 vs.
Adj. 2012(1) Funded Orders $ 1,969 48% Revenue $ 1,141 -16% Operating
Income, as reported $ 133 -11% Operating Margin, as reported 11.7% +80
bps EPS $ 0.41 -9% Year-to-Date Free Cash Flow (FCF)(2) $ 61 +$35M
(1)2012 Adjusted Operating Income/Margin/EPS excludes charges incurred
in 2012 related to the October 31, 2011 spin-off from ITT Corporation
(2)Free Cash Flow = Cash Flow from Operations less Capital Expenditures
plus 2012 Separation Costs. Does not include dividend payments. For
Non-GAAP reconciliations, refer to appendix and
www.exelisinc.com/investors 3 Strong orders at I&TS drive enterprise
Book-to-Bill of 1.7x Full year restructuring anticipated to be ≈$85M
Sequential improvement in C4ISR margins – all divisions Solid quarter
driven by strong orders, productivity and restructuring benefit
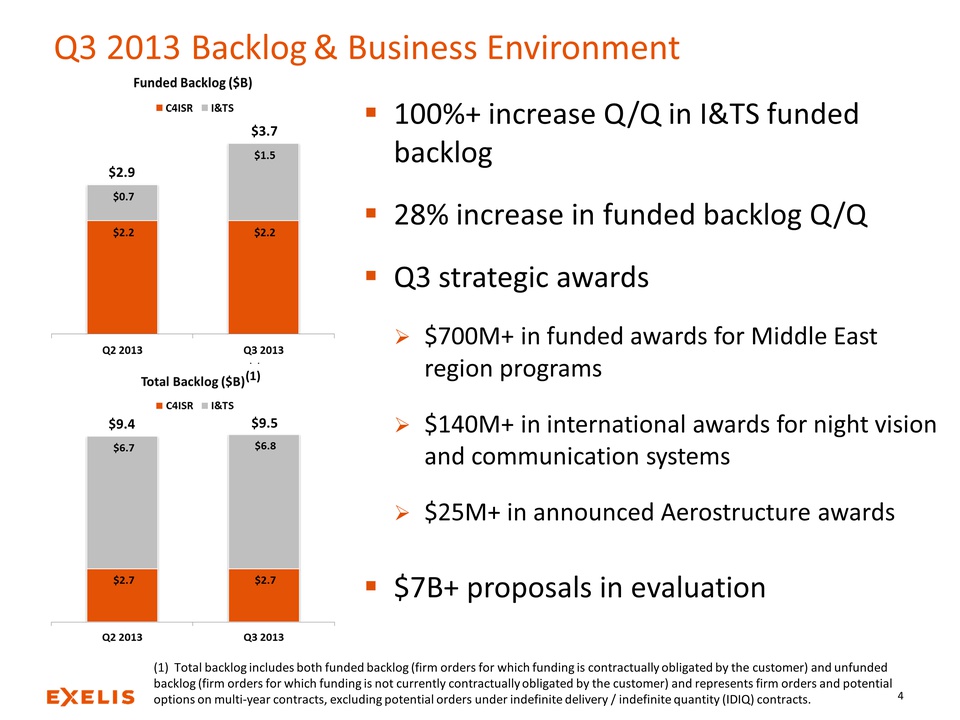 Q3 2013 Backlog &
Business Environment 4 100%+ increase Q/Q in I&TS funded backlog 28%
increase in funded backlog Q/Q Q3 strategic awards $700M+ in funded
awards for Middle East region programs $140M+ in international awards
for night vision and communication systems $25M+ in announced
Aerostructure awards $7B+ proposals in evaluation (1) Total backlog
includes both funded backlog (firm orders for which funding is
contractually obligated by the customer) and unfunded backlog (firm
orders for which funding is not currently contractually obligated by the
customer) and represents firm orders and potential options on multi-year
contracts, excluding potential orders under indefinite delivery /
indefinite quantity (IDIQ) contracts. (1) $2.9 $3.7 (1) $9.4 $9.5
Q3 2013 Backlog &
Business Environment 4 100%+ increase Q/Q in I&TS funded backlog 28%
increase in funded backlog Q/Q Q3 strategic awards $700M+ in funded
awards for Middle East region programs $140M+ in international awards
for night vision and communication systems $25M+ in announced
Aerostructure awards $7B+ proposals in evaluation (1) Total backlog
includes both funded backlog (firm orders for which funding is
contractually obligated by the customer) and unfunded backlog (firm
orders for which funding is not currently contractually obligated by the
customer) and represents firm orders and potential options on multi-year
contracts, excluding potential orders under indefinite delivery /
indefinite quantity (IDIQ) contracts. (1) $2.9 $3.7 (1) $9.4 $9.5
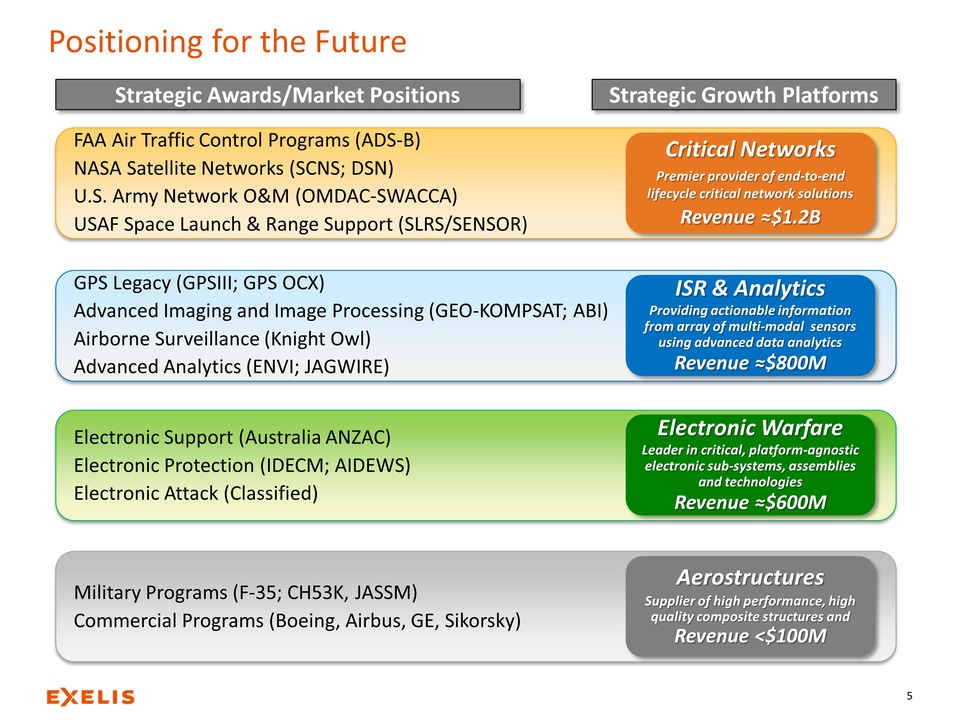 Positioning for the
Future 5 Strategic Awards/Market Positions Strategic Growth Platforms
Electronic Warfare Leader in critical, platform-agnostic electronic
sub-systems, assemblies and technologies Revenue ≈$600M Electronic
Warfare Leader in critical, platform-agnostic electronic sub-systems,
assemblies and technologies Revenue ≈$600M Critical Networks Premier
provider of end-to-end lifecycle critical network solutions 1.2B
Critical Networks Premier provider of end-to-end lifecycle critical
network solutions Revenue ≈$1.2B ISR & Analytics Providing actionable
information from array multi-modal sensors using advanced data analytics
800M ISR & Analytics Providing actionable information from array of
multi-modal sensors using advanced data analytics Revenue ≈$800M
Aerostructures Supplier high performance, quality composite structures
<$100M Aerostructures Supplier of high performance, high quality
composite structures and Revenue <$100M FAA Air Traffic Control Programs
(ADS-B) NASA Satellite Networks (SCNS; DSN) U.S. Army Network O&M
(OMDAC-SWACCA) USAF Space Launch & Range Support (SLRS/SENSOR) GPS
Legacy (GPSIII; GPS OCX) Advanced Imaging and Image Processing
(GEO-KOMPSAT; ABI) Airborne Surveillance (Knight Owl) Advanced Analytics
(ENVI; JAGWIRE) Electronic Support (Australia ANZAC) Electronic
Protection (IDECM; AIDEWS) Electronic Attack (Classified) Military
Programs (F-35; CH53K, JASSM) Commercial Programs (Boeing, Airbus, GE,
Sikorsky)
Positioning for the
Future 5 Strategic Awards/Market Positions Strategic Growth Platforms
Electronic Warfare Leader in critical, platform-agnostic electronic
sub-systems, assemblies and technologies Revenue ≈$600M Electronic
Warfare Leader in critical, platform-agnostic electronic sub-systems,
assemblies and technologies Revenue ≈$600M Critical Networks Premier
provider of end-to-end lifecycle critical network solutions 1.2B
Critical Networks Premier provider of end-to-end lifecycle critical
network solutions Revenue ≈$1.2B ISR & Analytics Providing actionable
information from array multi-modal sensors using advanced data analytics
800M ISR & Analytics Providing actionable information from array of
multi-modal sensors using advanced data analytics Revenue ≈$800M
Aerostructures Supplier high performance, quality composite structures
<$100M Aerostructures Supplier of high performance, high quality
composite structures and Revenue <$100M FAA Air Traffic Control Programs
(ADS-B) NASA Satellite Networks (SCNS; DSN) U.S. Army Network O&M
(OMDAC-SWACCA) USAF Space Launch & Range Support (SLRS/SENSOR) GPS
Legacy (GPSIII; GPS OCX) Advanced Imaging and Image Processing
(GEO-KOMPSAT; ABI) Airborne Surveillance (Knight Owl) Advanced Analytics
(ENVI; JAGWIRE) Electronic Support (Australia ANZAC) Electronic
Protection (IDECM; AIDEWS) Electronic Attack (Classified) Military
Programs (F-35; CH53K, JASSM) Commercial Programs (Boeing, Airbus, GE,
Sikorsky)
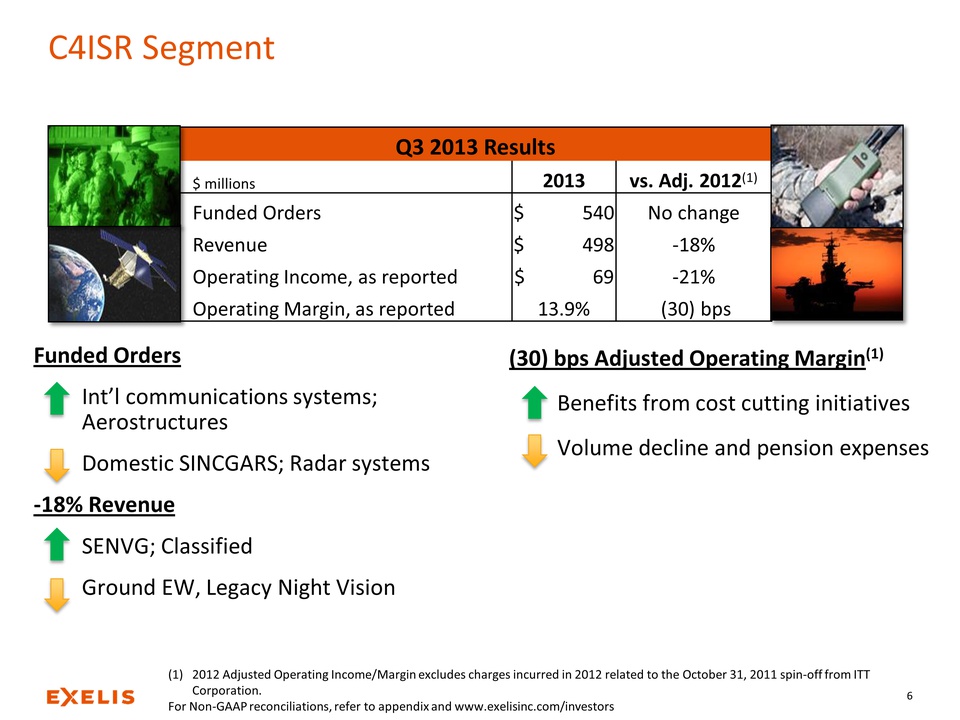 (30) bps Adjusted
Operating Margin(1) Benefits from cost cutting initiatives Volume
decline and pension expenses Funded Orders Int’l communications systems;
Aerostructures Domestic SINCGARS; Radar systems -18% Revenue SENVG;
Classified Ground EW, Legacy Night Vision C4ISR Segment (1)2012 Adjusted
Operating Income/Margin excludes charges incurred in 2012 related to the
October 31, 2011 spin-off from ITT Corporation. For Non-GAAP
reconciliations, refer to appendix and www.exelisinc.com/investors Q3
2013 Results $ millions 2013 vs. Adj. 2012(1) Funded Orders $ 540 No
change Revenue $ 498 -18% Operating Income, as reported $ 69 -21%
Operating Margin, as reported 13.9% (30) bps 6
(30) bps Adjusted
Operating Margin(1) Benefits from cost cutting initiatives Volume
decline and pension expenses Funded Orders Int’l communications systems;
Aerostructures Domestic SINCGARS; Radar systems -18% Revenue SENVG;
Classified Ground EW, Legacy Night Vision C4ISR Segment (1)2012 Adjusted
Operating Income/Margin excludes charges incurred in 2012 related to the
October 31, 2011 spin-off from ITT Corporation. For Non-GAAP
reconciliations, refer to appendix and www.exelisinc.com/investors Q3
2013 Results $ millions 2013 vs. Adj. 2012(1) Funded Orders $ 540 No
change Revenue $ 498 -18% Operating Income, as reported $ 69 -21%
Operating Margin, as reported 13.9% (30) bps 6
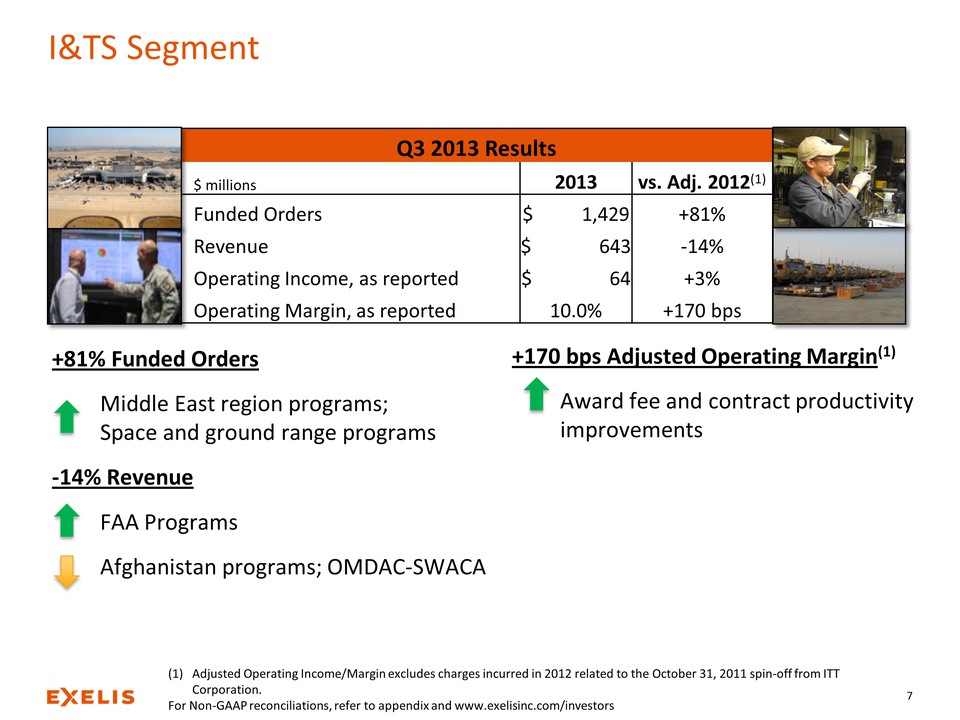 +170 bps Adjusted
Operating Margin(1) Award fee and contract productivity improvements
+81% Funded Orders Middle East region programs; Space and ground range
programs -14% Revenue FAA Programs Afghanistan programs; OMDAC-SWACA
I&TS Segment (1)Adjusted Operating Income/Margin excludes charges
incurred in 2012 related to the October 31, 2011 spin-off from ITT
Corporation. For Non-GAAP reconciliations, refer to appendix and
www.exelisinc.com/investors Q3 2013 Results $ millions 2013 vs. Adj.
2012(1) Funded Orders $ 1,429 +81% Revenue $ 643 -14% Operating Income,
as reported $ 64 +3% Operating Margin, as reported 10.0% +170 bps 7
+170 bps Adjusted
Operating Margin(1) Award fee and contract productivity improvements
+81% Funded Orders Middle East region programs; Space and ground range
programs -14% Revenue FAA Programs Afghanistan programs; OMDAC-SWACA
I&TS Segment (1)Adjusted Operating Income/Margin excludes charges
incurred in 2012 related to the October 31, 2011 spin-off from ITT
Corporation. For Non-GAAP reconciliations, refer to appendix and
www.exelisinc.com/investors Q3 2013 Results $ millions 2013 vs. Adj.
2012(1) Funded Orders $ 1,429 +81% Revenue $ 643 -14% Operating Income,
as reported $ 64 +3% Operating Margin, as reported 10.0% +170 bps 7
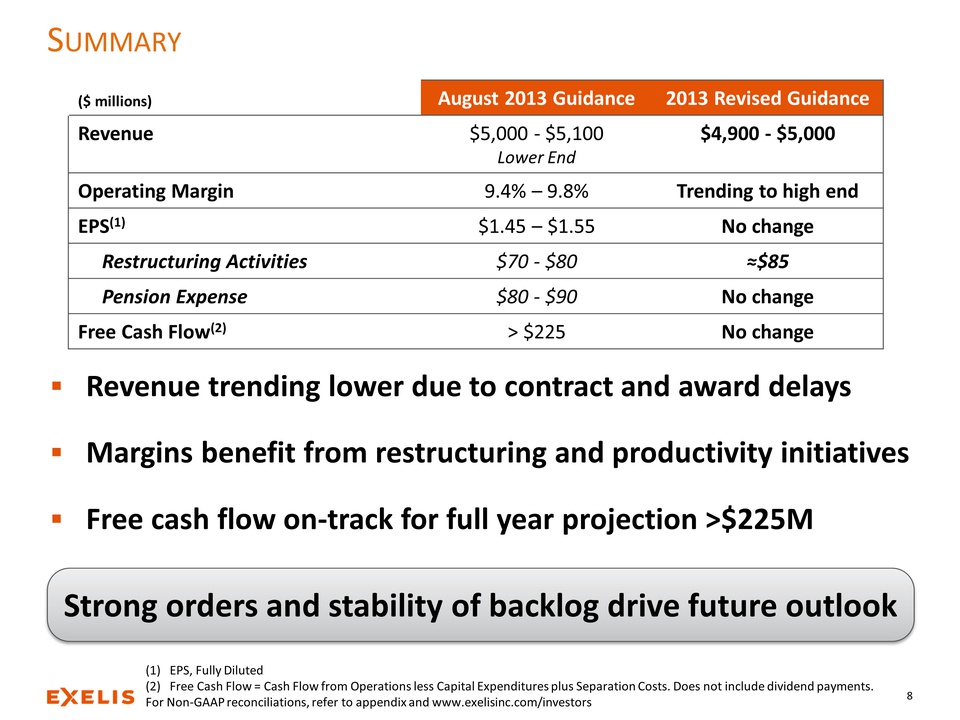 SUMMARY Revenue
trending lower due to contract and award delays Margins benefit from
restructuring and productivity initiatives Free cash flow on-track for
full year projection >$225M Strong orders and stability of backlog drive
future outlook 8 ($ millions) August 2013 Guidance 2013 Revised Guidance
Revenue $5,000 - $5,100 Lower End $4,900 - $5,000 Operating Margin 9.4%
– 9.8% Trending to high end EPS(1) $1.45 – $1.55 No change Restructuring
Activities $70 - $80 ≈$85 Pension Expense $80 - $90 No change Free Cash
Flow(2) > $225 No change (1)EPS, Fully Diluted (2)Free Cash Flow = Cash
Flow from Operations less Capital Expenditures plus Separation Costs.
Does not include dividend payments. For Non-GAAP reconciliations, refer
to appendix and www.exelisinc.com/investors
SUMMARY Revenue
trending lower due to contract and award delays Margins benefit from
restructuring and productivity initiatives Free cash flow on-track for
full year projection >$225M Strong orders and stability of backlog drive
future outlook 8 ($ millions) August 2013 Guidance 2013 Revised Guidance
Revenue $5,000 - $5,100 Lower End $4,900 - $5,000 Operating Margin 9.4%
– 9.8% Trending to high end EPS(1) $1.45 – $1.55 No change Restructuring
Activities $70 - $80 ≈$85 Pension Expense $80 - $90 No change Free Cash
Flow(2) > $225 No change (1)EPS, Fully Diluted (2)Free Cash Flow = Cash
Flow from Operations less Capital Expenditures plus Separation Costs.
Does not include dividend payments. For Non-GAAP reconciliations, refer
to appendix and www.exelisinc.com/investors
 Appendix
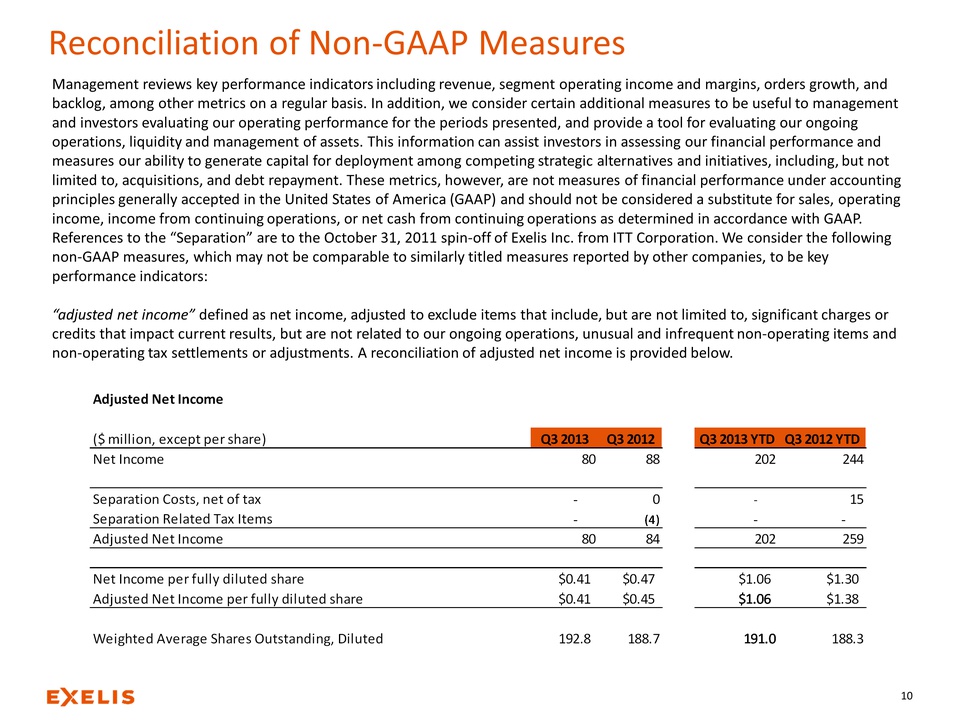
Reconciliation of Non-GAAP Measures 10 Management reviews key performance indicators including revenue, segment operating income and margins, orders growth, and backlog, among other metrics on a regular basis. In addition, we consider certain additional measures to be useful to management and investors evaluating our operating performance for the periods presented, and provide a tool for evaluating our ongoing operations, liquidity and management of assets. This information can assist investors in assessing our financial performance and measures our ability to generate capital for deployment among competing strategic alternatives and initiatives, including, but not limited to, acquisitions, and debt repayment. These metrics, however, are not measures of financial performance under accounting principles generally accepted in the United States of America (GAAP) and should not be considered a substitute for sales, operating income, income from continuing operations, or net cash from continuing operations as determined in accordance with GAAP. References to the “Separation” are to the October 31, 2011 spin-off of Exelis Inc. from ITT Corporation. We consider the following non-GAAP measures, which may not be comparable to similarly titled measures reported by other companies, to be key performance indicators: “adjusted net income” defined as net income, adjusted to exclude items that include, but are not limited to, significant charges or credits that impact current results, but are not related to our ongoing operations, unusual and infrequent non-operating items and non-operating tax settlements or adjustments. A reconciliation of adjusted net income is provided below. Adjusted Net Income($ million, except per share)Q3 2013Q3 2012Q3 2013 YTDQ3 2012 YTDNet Income8088202244Separation Costs, net of tax- 0- 15Separation Related Tax Items- (4) - - Adjusted Net Income 8084202259Net Income per fully diluted share$0.41$0.47$1.06$1.30Adjusted Net Income per fully diluted share$0.41$0.45$1.06$1.38Weighted Average Shares Outstanding, Diluted192.8 188.7191.0188.3
 Reconciliation of
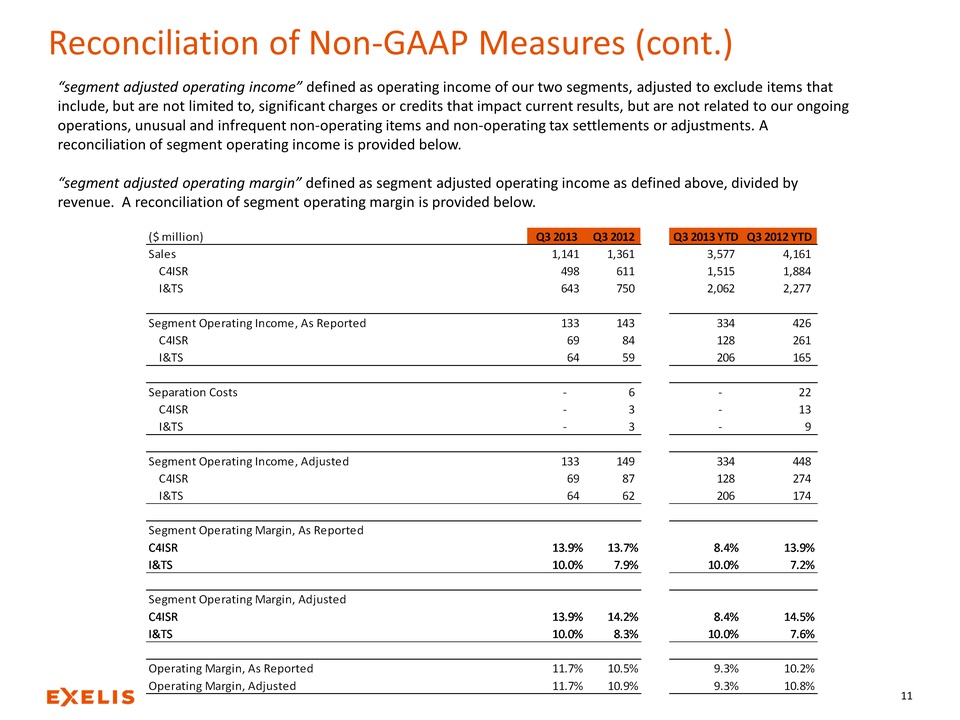
Non-GAAP Measures (cont.) 11 “segment adjusted operating income” defined
as operating income of our two segments, adjusted to exclude items that
include, but are not limited to, significant charges or credits that
impact current results, but are not related to our ongoing operations,
unusual and infrequent non-operating items and non-operating tax
settlements or adjustments. A reconciliation of segment operating income
is provided below. “segment adjusted operating margin” defined as
segment adjusted operating income as defined above, divided by revenue.
A reconciliation of segment operating margin is provided below. ($
million)Q3 2013Q3 2012Q3 2013 YTDQ3 2012 YTDSales1,141 1,361 3,577 4,161
C4ISR498 611 1,515 1,884 I&TS643 750 2,062 2,277 Segment Operating
Income, As Reported133 143 334 426 C4ISR69 84 128 261 I&TS64 59 206 165
Separation Costs- 6 - 22 C4ISR- 3 - 13 I&TS- 3 - 9 Segment Operating
Income, Adjusted133 149 334 448 C4ISR69 87 128 274 I&TS64 62 206 174
Segment Operating Margin, As
ReportedC4ISR13.9%13.7%8.4%13.9%I&TS10.0%7.9%10.0%7.2%Segment Operating
Margin, AdjustedC4ISR13.9%14.2%8.4%14.5%I&TS10.0%8.3%10.0%7.6%Operating
Margin, As Reported11.7%10.5%9.3%10.2%Operating Margin,
Adjusted11.7%10.9%9.3%10.8%
Reconciliation of
Non-GAAP Measures (cont.) 11 “segment adjusted operating income” defined
as operating income of our two segments, adjusted to exclude items that
include, but are not limited to, significant charges or credits that
impact current results, but are not related to our ongoing operations,
unusual and infrequent non-operating items and non-operating tax
settlements or adjustments. A reconciliation of segment operating income
is provided below. “segment adjusted operating margin” defined as
segment adjusted operating income as defined above, divided by revenue.
A reconciliation of segment operating margin is provided below. ($
million)Q3 2013Q3 2012Q3 2013 YTDQ3 2012 YTDSales1,141 1,361 3,577 4,161
C4ISR498 611 1,515 1,884 I&TS643 750 2,062 2,277 Segment Operating
Income, As Reported133 143 334 426 C4ISR69 84 128 261 I&TS64 59 206 165
Separation Costs- 6 - 22 C4ISR- 3 - 13 I&TS- 3 - 9 Segment Operating
Income, Adjusted133 149 334 448 C4ISR69 87 128 274 I&TS64 62 206 174
Segment Operating Margin, As
ReportedC4ISR13.9%13.7%8.4%13.9%I&TS10.0%7.9%10.0%7.2%Segment Operating
Margin, AdjustedC4ISR13.9%14.2%8.4%14.5%I&TS10.0%8.3%10.0%7.6%Operating
Margin, As Reported11.7%10.5%9.3%10.2%Operating Margin,
Adjusted11.7%10.9%9.3%10.8%
 Reconciliation of
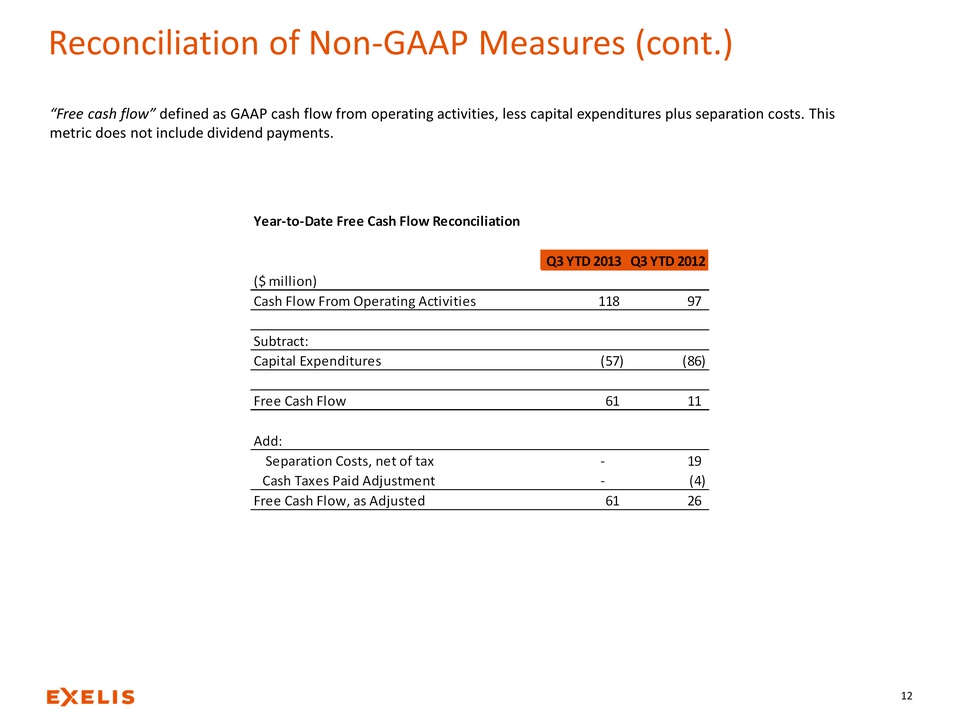
Non-GAAP Measures (cont.) 12 “Free cash flow” defined as GAAP cash flow
from operating activities, less capital expenditures plus separation
costs. This metric does not include dividend payments. Year-to-Date Free
Cash Flow ReconciliationQ3 YTD 2013Q3 YTD 2012($ million)Cash Flow From
Operating Activities118 97 Subtract:Capital Expenditures(57) (86) Free
Cash Flow61 11 Add:Separation Costs, net of tax- 19 Cash Taxes Paid
Adjustment- (4) Free Cash Flow, as Adjusted61 26
Reconciliation of
Non-GAAP Measures (cont.) 12 “Free cash flow” defined as GAAP cash flow
from operating activities, less capital expenditures plus separation
costs. This metric does not include dividend payments. Year-to-Date Free
Cash Flow ReconciliationQ3 YTD 2013Q3 YTD 2012($ million)Cash Flow From
Operating Activities118 97 Subtract:Capital Expenditures(57) (86) Free
Cash Flow61 11 Add:Separation Costs, net of tax- 19 Cash Taxes Paid
Adjustment- (4) Free Cash Flow, as Adjusted61 26
 Reconciliation of
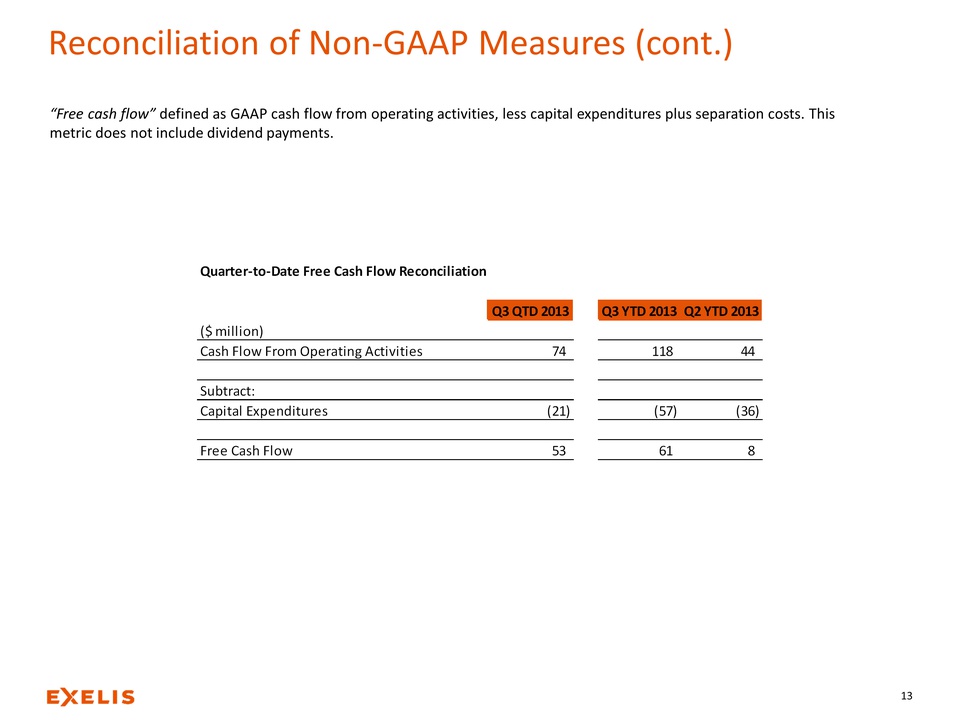
Non-GAAP Measures (cont.) 13 “Free cash flow” defined as GAAP cash flow
from operating activities, less capital expenditures plus separation
costs. This metric does not include dividend payments. Quarter-to-Date
Free Cash Flow ReconciliationQ3 QTD 2013Q3 YTD 2013Q2 YTD 2013($
million)Cash Flow From Operating Activities74 118 44 Subtract:Capital
Expenditures(21) (57) (36) Free Cash Flow53 61 8
Reconciliation of
Non-GAAP Measures (cont.) 13 “Free cash flow” defined as GAAP cash flow
from operating activities, less capital expenditures plus separation
costs. This metric does not include dividend payments. Quarter-to-Date
Free Cash Flow ReconciliationQ3 QTD 2013Q3 YTD 2013Q2 YTD 2013($
million)Cash Flow From Operating Activities74 118 44 Subtract:Capital
Expenditures(21) (57) (36) Free Cash Flow53 61 8