Attached files
| file | filename |
|---|---|
| 8-K - 8-K - VANTAGESOUTH BANCSHARES, INC. | form8-k2013q3.htm |
| EX-99.1 - PRESS RELEASE - VANTAGESOUTH BANCSHARES, INC. | q32013pressrelease.htm |

VantageSouth Bancshares, Inc. NYSE: VSB 2013 Q3 Earnings Conference Call October 30, 2013

Forward-looking statements 2 Statements in this presentation relating to plans, strategies, economic performance and trends, projections of results of specific, acquisitions, activities or investments, expectations or beliefs about future events or results, and other statements that are not descriptions of historical facts, may be forward-looking statements within the meaning of the Private Securities Litigation Reform Act of 1995, Section 27A of the Securities Act of 1933 and Section 21E of the Securities Exchange Act of 1934. Forward-looking information is inherently subject to risks and uncertainties, and actual results could differ materially from those currently anticipated due to a number of factors, which include, but are not limited to, risk factors discussed in the Company’s Annual Report on Form 10-K, and in other documents filed by the Company with the Securities and Exchange Commission from time to time. Factors that could influence the accuracy of such forward-looking statements include, but are not limited to pressures on the earnings, capital and liquidity of financial institutions in general, resulting from current and future conditions in the credit and equity markets, the financial success or changing strategies of the Company’s customers, actions of government regulators, the level of market interest rates, changes in general economic conditions and the real estate values in our banking market (particularly changes that affect our loan portfolio, the abilities of our borrowers to repay their loans, and the values of loan collateral). In addition, in connection with the Company’s completed acquisitions, the Company may (i) incur greater than expected costs or difficulties related to the integration of acquired companies, (ii) not realize the expected cost savings or synergies, and/or (iii) experience deposit attrition, customer or revenue loss with respect to an acquired company. Although the Company believes that the expectations reflected in the forward-looking statements are reasonable, it cannot guarantee future results, levels of activity, performance or achievements. The Company has no obligation to, and does not intend to, update any forward-looking statements. Important Information about this Presentation Piedmont Community Bank Holdings, Inc. owns 70% of VantageSouth Bancshares, Inc. VantageSouth Bank is a wholly-owned subsidiary of VantageSouth Bancshares. VantageSouth Bancshares conducts business under the name VantageSouth Bank. Non‐GAAP Measures Statements included in this presentation include non‐GAAP measures and should be read along with the accompanying tables to the earnings release which provide a reconciliation of non‐GAAP measures to GAAP measures. Management believes that these non‐GAAP measures provide additional useful information that allows readers to evaluate the ongoing performance of the Company without regard to transactional activities. Non‐GAAP measures should not be considered as an alternative to any measure of performance or financial condition as promulgated under GAAP, and investors should consider the company's performance and financial condition as reported under GAAP and all other relevant information when assessing the performance or financial condition of the company. Non‐GAAP measures have limitations as analytical tools, and investors should not consider them in isolation or as a substitute for analysis of the company's results or financial condition as reported under GAAP.

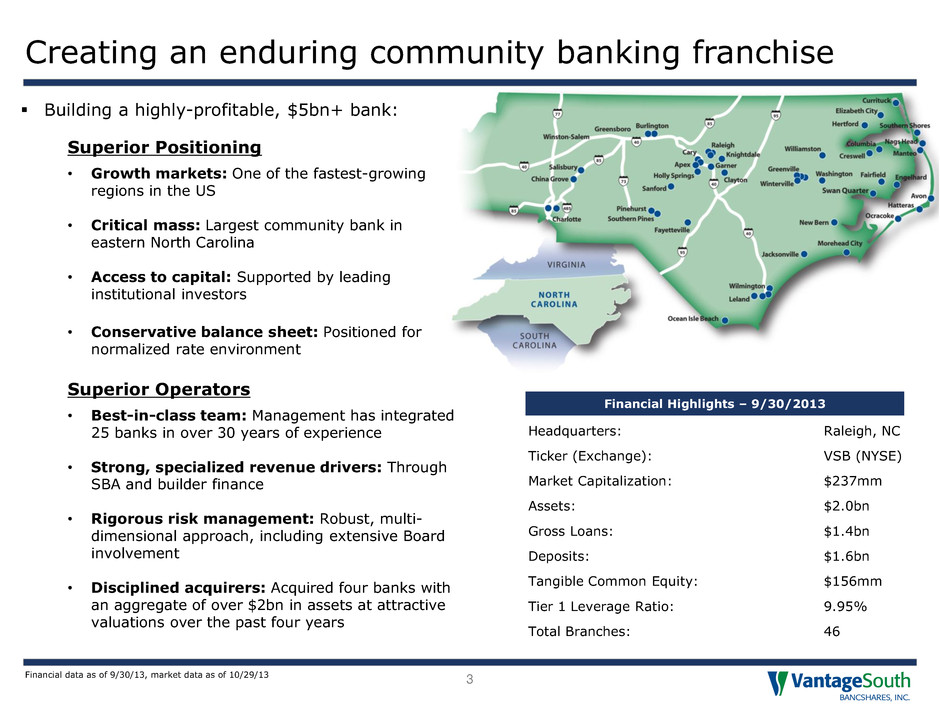
Building a highly-profitable, $5bn+ bank: Superior Positioning • Growth markets: One of the fastest-growing regions in the US • Critical mass: Largest community bank in eastern North Carolina • Access to capital: Supported by leading institutional investors • Conservative balance sheet: Positioned for normalized rate environment Superior Operators • Best-in-class team: Management has integrated 25 banks in over 30 years of experience • Strong, specialized revenue drivers: Through SBA and builder finance • Rigorous risk management: Robust, multi- dimensional approach, including extensive Board involvement • Disciplined acquirers: Acquired four banks with an aggregate of over $2bn in assets at attractive valuations over the past four years Creating an enduring community banking franchise 3 Headquarters: Raleigh, NC Ticker (Exchange): VSB (NYSE) Market Capitalization: $237mm Assets: $2.0bn Gross Loans: $1.4bn Deposits: $1.6bn Tangible Common Equity: $156mm Tier 1 Leverage Ratio: 9.95% Total Branches: 46 Financial data as of 9/30/13, market data as of 10/29/13 Financial Highlights – 9/30/2013

Q3 2013 – Overview 4 Pre-tax, pre-provision operating earnings totaled $6.2mm in Q3, an increase from $6.0mm in Q2. Drivers of the growth in operating earnings were: • Loan growth and day count contributed $1.3 mm • Expense reductions contributed $1.0 mm • SBA revenue contributed $0.5mm • Decline in loan yields driven by competitive pricing pressure cost $1.3mm • Mortgage revenue decline of $0.8mm reflecting declining refi business, higher than expected portfolio production and weak gain on sales margins • Interest cost on sub debt issuance cost $0.4mm Net income per common share was $0.02; operating earnings per common share was $0.05 after taking into account the merger and conversion cost and the one time tax charge for the reduction in NC tax rates Tangible book value per share increased to $3.39 at September 30, 2013; up from $3.35 at June 30, 2013 Organic growth trajectory continues • Q3 loan growth totaled $29mm or 9% annualized • Total loan production (excluding mortgages HFS) reflect $878mm annualized production since April 1, 2013 • Q3 deposit portfolio decline of $32.2mm as mix improves $13.1mm of decline in wholesale deposits offset by DDA growth of $11.5mm Capital levels remain strong with organic growth improving leverage • Tangible common equity to tangible assets of 7.75% • Tier 1 leverage ratio of 9.95% at VantageSouth Bank

Earnings profile 5 6th successive quarter of income before taxes and M&A costs Core, pre-tax earnings approximately $5.0mm; up from $4.6mm in Q2 2013 • Revenue of $24.4mm with $0.4mm in sub- debt interest and lower mortgage income • NIM declined by 28bps reflecting Sub-debt Loan pricing pressure • Credit costs continued downward trend since Q1 2013 • SBA production strong at $34.5mm, setting up a solid Q4 in fee revenue • Expense reductions taking hold with $1.0mm reduction driven by 26 lower FTE Tax expense includes a $1.2mm income tax charge in connection with recently enacted decreases in North Carolina corporate income tax rate. ($ in thousands) 2012Q3 2012Q4 2013Q1 2013Q2 2013Q3 Net interest income 10,265$ 10,175$ 9,944$ 20,428$ 19,906$ Provision for loan losses 1,077 1,167 1,940 1,492 1,280 Net interest income after provision 9,188 9,008 8,004 18,936 18,626 Noninterest income 3,332 4,133 3,462 4,855 4,537 Merger and conversion costs Noninterest expense 10,593 12,240 11,066 19,179 18,205 Income before taxes & M&A costs 1,927$ 901$ 400$ 4,612$ 4,958$ Gain on ECB acquisition - - - 7,809 - Merger & conversion costs 547 2,114 1,601 11,961 477 Income before taxes 1,380 (1,213) (1,201) 460 4,481 Tax expense (benefit) 95 (3,326) (395) (2,808) 2,997 Net Income (loss) 1,285$ 2,113$ (806)$ 3,268$ 1,484$ Dividends & accretion on preferred stock 367 368 369 705 708 Net income (loss ) to cmn. shareholders 918$ 1,745$ (1,175)$ 2,563$ 776$ Net income (loss) to cmn. per share 0.03$ 0.05$ (0.03)$ 0.06$ 0.02$ Weighted average diluted shares 35,725,915 35,728,359 35,758,033 45,916,707 46,021,308 Core pre-tax, pre-provision earnings 2,521$ 1,465$ 1,248$ 5,981$ 6,238$

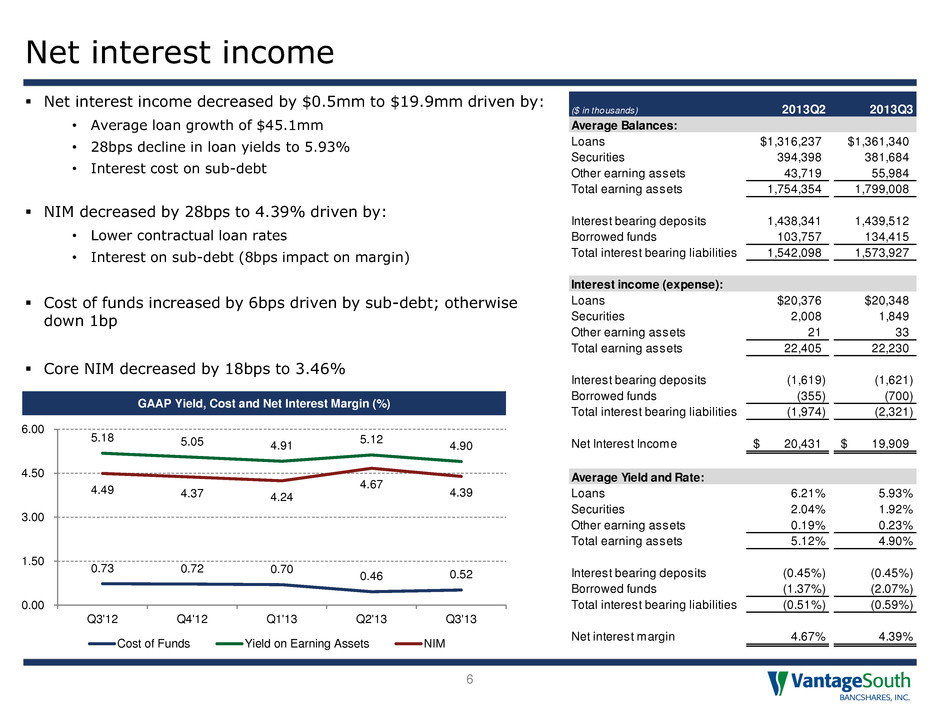
Net interest income 6 GAAP Yield, Cost and Net Interest Margin (%) 0.73 0.72 0.70 0.46 0.52 5.18 5.05 4.91 5.12 4.90 4.49 4.37 4.24 4.67 4.39 0.00 1.50 3.00 4.50 6.00 Q3'12 Q4'12 Q1'13 Q2'13 Q3'13 Cost of Funds Yield on Earning Assets NIM Net interest income decreased by $0.5mm to $19.9mm driven by: • Average loan growth of $45.1mm • 28bps decline in loan yields to 5.93% • Interest cost on sub-debt NIM decreased by 28bps to 4.39% driven by: • Lower contractual loan rates • Interest on sub-debt (8bps impact on margin) Cost of funds increased by 6bps driven by sub-debt; otherwise down 1bp Core NIM decreased by 18bps to 3.46% ($ in thousands) 2013Q2 2013Q3 Average Balances: Loans $1,316,237 $1,361,340 Securities 394,398 381,684 Other earning assets 43,719 55,984 Total earning assets 1,754,354 1,799,008 Interest bearing deposits 1,438,341 1,439,512 Borrowed funds 103,757 134,415 Total interest bearing liabilities 1,542,098 1,573,927 Interest income (expense): Loans $20,376 $20,348 Securities 2,008 1,849 Other earning assets 21 33 Total earning assets 22,405 22,230 Interest bearing deposits (1,619) (1,621) Borrowed funds (355) (700) Total interest bearing liabilities (1,974) (2,321) Net Interest Income 20,431$ 19,909$ Average Yield and Rate: Loans 6.21% 5.93% Securities 2.04% 1.92% Other earning assets 0.19% 0.23% Total earning assets 5.12% 4.90% Interest bearing deposits (0.45%) (0.45%) Borrowed funds (1.37%) (2.07%) Total interest bearing liabilities (0.51%) (0.59%) Net interest margin 4.67% 4.39%

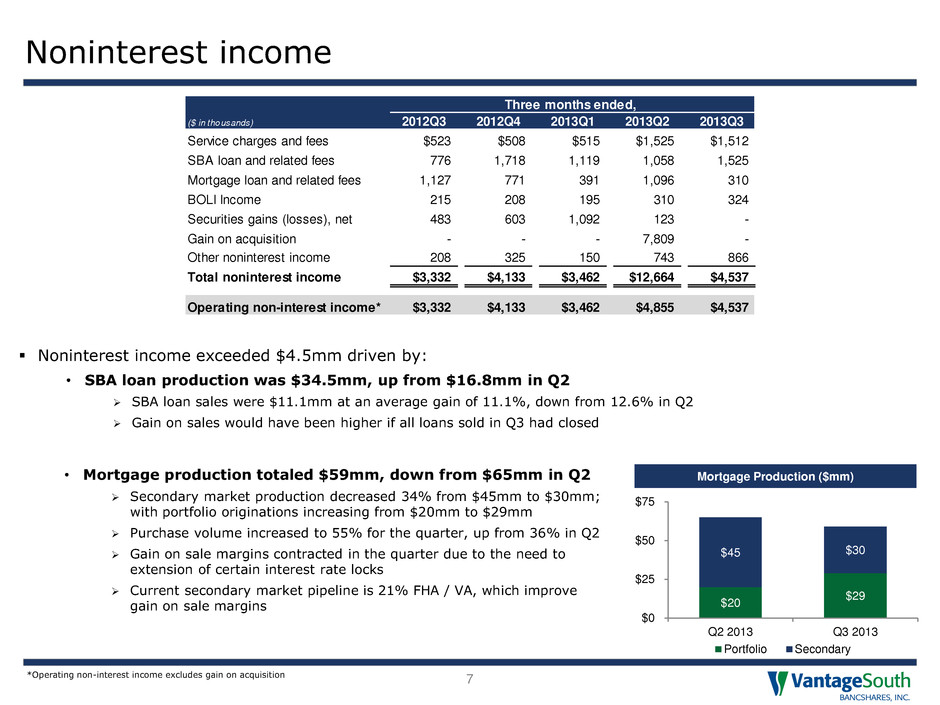
Noninterest income 7 Noninterest income exceeded $4.5mm driven by: • SBA loan production was $34.5mm, up from $16.8mm in Q2 SBA loan sales were $11.1mm at an average gain of 11.1%, down from 12.6% in Q2 Gain on sales would have been higher if all loans sold in Q3 had closed $20 $29 $45 $30 $0 $25 $50 $75 Q2 2013 Q3 2013 Portfolio Secondary Mortgage Production ($mm) • Mortgage production totaled $59mm, down from $65mm in Q2 Secondary market production decreased 34% from $45mm to $30mm; with portfolio originations increasing from $20mm to $29mm Purchase volume increased to 55% for the quarter, up from 36% in Q2 Gain on sale margins contracted in the quarter due to the need to extension of certain interest rate locks Current secondary market pipeline is 21% FHA / VA, which improve gain on sale margins *Operating non-interest income excludes gain on acquisition Three months ended, ($ in thousands) 2012Q3 2012Q4 2013Q1 2013Q2 2013Q3 Service charges and fees $523 $508 $515 $1,525 $1,512 SBA loan and related fees 776 1,718 1,119 1,058 1,525 Mortgage loan and related fees 1,127 771 391 1,096 310 BOLI Income 215 208 195 310 324 Securities gains (losses), net 483 603 1,092 123 - Gain on acquisition - - - 7,809 - Other noninterest income 208 325 150 743 866 Total noninterest income $3,332 $4,133 $3,462 $12,664 $4,537 Operating non-interest income* $3,332 $4,133 $3,462 $4,855 $4,537

Noninterest expense 8 Operating noninterest expense decreased $1.0mm to $18.2mm as a result of the cost reduction effort implemented after the ECB conversion • Salaries and employee benefits decreased as a result of reducing FTEs by 26 or ~$1.4mm in annual salaries • Occupancy and equipment increase due to additional space leased for SBA, de novo expansion and branch sale leaseback • Remaining NIE decrease is largely due to lower professional fees, marketing and other losses offset by higher OREO costs and loan related expenses Additional saves from key salary reductions implemented in late Q3 will be realized in Q4 Three months ended, ($ in thousands) 2012Q3 2012Q4 2013Q1 2013Q2 2013Q3 Salaries and employee benefits $5,648 $6,588 $5,991 $11,009 $10,034 Occupancy and equipment 1,385 1,321 1,547 2,408 2,497 Data processing 644 698 644 1,075 1,105 FDIC insurance premiums 205 216 227 400 423 Professional services 800 684 497 914 598 Foreclosed asset expenses 251 662 183 79 201 Other loan-related expense 419 352 461 792 909 Merger and conversion costs 547 2,114 1,601 11,961 477 Other 1,241 1,719 1,516 2,502 2,438 Total non-interest expense $11,140 $14,354 $12,667 $31,140 $18,682 Operating non-interest expense* $10,593 $12,240 $11,066 $19,179 $18,205 *Operating non-interest expense excludes merger and conversion costs

Balance Sheet 9 Total assets increased $37mm during Q3 to $2.05bn driven by: • Loan growth of $29mm or 9% annualized, net of $11.1mm in SBA loan sales • Investment securities increased $27.4mm (floating rate securities); to mitigate impact on earnings of sub-debt • Deposits declined $32.2mm during Q3 with mix improving DDA growth of $11.5mm offset by declines in MMIA and wholesale time deposits • Added $25mm in FHLB advances • Added $38mm 10-year, non-callable sub-debt at 7.625% $32mm was down-streamed into the bank to support future growth • Tangible book value per share increased $0.04 to $3.39 QTD Change ($ in thousands) 2013Q2 2013Q3 $ % Assets: Cash and due from banks 29,264 37,681 8,417 Fed funds & interest bearing deposits 58,544 47,954 (10,590) Investment securities 376,736 404,108 27,372 Loans held for sale 21,142 7,349 (13,793) Loans, net of unearned income 1,323,981 1,353,360 29,379 8.9% Less: Allowance for loan losses (6,425) (7,034) (567) Premises and equipment, net 43,052 42,306 (745) Accrued interest receivable 5,365 4,972 (394) Other real estate 11,632 11,806 174 Other assets 145,697 143,567 (2,130) Total Assets 2,008,988 2,046,071 37,083 Non-interest bearing deposits 197,229 208,736 11,506 23.3% Interest bearing demand deposits 344,515 339,973 (4,542) (5.3%) Savings & money market deposits 482,672 458,214 (24,458) (20.3%) Time deposits 630,283 615,616 (14,667) (9.3%) Total deposits 1,654,699 1,622,539 (32,160) (7.8%) Accrued expenses & other liabilities 11,506 16,143 4,637 FHLB advances 100,902 125,850 24,947 Other borrowings 6,913 44,987 38,074 Trust preferred securities 5,528 5,544 16 Total Liabilities 1,779,547 1,815,062 35,514 Preferred stock 42,437 42,609 172 Common stock 187,004 188,400 1,397 Total Equity 229,441 231,009 1,569 Total Liabilities & Equity 2,008,988 2,046,071 37,083 Tangible book value / share 3.35$ 3.39$ 0.04$

$0 $50 $100 $150 $200 $250 Q3 '12 Q4 '12 Q1 '13 Q2 '13 Q3 '13 SBA Builder Other C&I CRE Loan portfolio transformation 10 New Loan Production ($mm) Average Yield (%) New Loan Production – Fixed vs. Floating Rate ($mm) Gross loan originations have totaled over $200mm per quarter since close of ECB acquisition Interest rates on loan originations have been steady in spite of competitive pressure for volume Floating rate originations exceeds 65% of total originations as current yield is sacrificed for asset sensitivity and less volatile earnings in a higher rate environment Targeting balanced loan portfolio between C&I, CRE, and consumer/other • Running off non-strategic CRE • Growing C&I 5.95% 5.79% 5.54% 6.21% 5.93% 4.69% 4.67% 4.42% 4.62% 4.59% 4.00% 4.50% 5.00% 5.50% 6.00% 6.50% Q3 '12 Q4 '12 Q1 '13 Q2 '13 Q3 '13 2 1 $54 $52 $54 $160 $139 $45 $57 $50 $71 $69 $0 $40 $80 $120 $160 $200 Q3 '12 Q4 '12 Q1 '13 Q2 '13 Q3 '13 Floating Fixed Total Portfolio New Originations Loan Portfolio Composition (Q3 2013) (ex. Builder) Note: New loan production represent total loan commitments originated in each respective period *Investor CRE is comprised of non-owner occupied CRE, multifamily and C&D $99 $108 $103 $231 $208 Other 29% C&I 15% Owner Occ. CRE 17% Investor CRE* 39%

Allowance for loan losses 11 Provision for loan losses totaled $1.3mm and primarily driven by clean up of legacy ECB loan portfolio Purchased impaired portfolio impacts remain lumpy as negative pool level cash flows totaling $2.4mm are realized immediately, while positive pool level cash flows of approximately $5.0 are realized over the remaining life of the pool, thereby increasing the pool yield Effective reserve, including ALLL and loan marks, is 3.05% of total loans Trailing 12 month, net charge off rates have totaled 1 bp and 32 bps in the non-acquired and purchased non-impaired portfolios, respectively ($ in thousands) Non-Acquired Purchased Non- Impaired (FAS 91) Purchased Impaired (SOP 03-3) Total Balance at 6/30/13 4,339$ -$ 2,086$ 6,425$ Net charge-offs (1) (670) - (671) Provision for loan losses 253 670 357 1,280 ALLL balance at 9/30/13 4,591$ -$ 2,443$ 7,034$ Remaining purchase acccounting mark - 18,084 16,180 34,264 Total effective reserve 4,591$ 18,084$ 18,623$ 41,298$ Loan balances 583,678$ 578,371$ 191,311$ 1,353,360$ Effective reserve percentage 0.79% 3.13% 9.73% 3.05%

Key financial targets 12 Metric Target Q3 2013 Capital & Asset Quality: Tier 1 Leverage Ratio > 8.50% 9.95% Classified Assets / Tier 1 + ALLL < 40.0% 36.0% Financial Performance: ROAA > 1.00% 0.29% Net Interest Margin > 4.00% 4.39% Efficiency Ratio < 65.0% 74% Noninterest Income / Revenue > 25.0% 18.6% Balance Sheet Positioning: Loan / Deposit Ratio 80% - 90% 83.4% Loan Portfolio Mix (% of total portfolio) C&I - 33.3% CRE - 33.3% Consumer - 33.3% 31.5% 39.2% 29.3% (1) C&I includes owner-occupied CRE; CRE is comprised of non-owner occupied CRE, multifamily and C&D; other is comprised of 1-4 family mortgage, 2nd mortgage, HELOCS, consumer, farmland, agriculture production and other (1)

75% 100% 125% 150% 175% 200% Dec-11 Mar-12 Jun-12 Sep-12 Dec-12 Mar-13 Jun-13 Sep-13 Pric e C han ge VSB KBW Regional Bank S&P 500 NASDAQ Bank Remain attractively priced compared to peers 13 Price / Tangible Book* Source: SNL Financial; market data as of 10/29/13 *Represents the average price / tangible book for the group. High performing peer group parameters: Assets between $2.0bn and $4.0bn, TCE / TA > 7.00%, Core ROAA > 0.90% and NPA / Assets < 3.00%; includes AROW, BHRB, BMTC, BUSE, COBZ, EFSC, FLIC, FMCB, GABC, HAFC, HBIA, LKFN, MSFG, NBCB, SYBT, and WASH. Price Performance Since December 30, 2011 49.7% 40.1% 52.1% 50.3% April 1, 2013 Closed ECB acquisition; free float increased to 30% June 25, 2012 Added to Russell 3000 Index March 21, 2012 Announcement of inclusion in Russell 3000 Index 1.53x 1.78x 2.08x 1.25x 1.50x 1.75x 2.00x 2.25x VSB High Performing Peers KBW Regional Bank Index July 30, 2013 Announced second quarter results

VantageSouth Bancshares, Inc. NYSE: VSB 2013 Q3 Earnings Conference Call October 30, 2013
