Attached files
| file | filename |
|---|---|
| 8-K - FORM 8-K - EXELON CORP | d617626d8k.htm |
| EX-99.1 - EX-99.1 - EXELON CORP | d617626dex991.htm |
 Earnings Conference Call
3
rd
Quarter 2013
October 30
th
, 2013
*
*
*
*
Exhibit 99.2 |
 Cautionary Statements Regarding Forward-Looking Information
1
2013 3Q Earnings Release Slides
This presentation contains certain forward-looking statements within the
meaning of the Private Securities Litigation Reform Act of 1995, that
are subject to risks and uncertainties. The factors that could cause
actual results to differ materially from the forward-looking
statements made by Exelon Corporation, Commonwealth Edison Company, PECO
Energy Company, Baltimore Gas and Electric Company and Exelon
Generation Company, LLC (Registrants) include those factors discussed herein,
as well as the items discussed in (1) Exelon’s 2012 Annual
Report on Form 10-K in (a) ITEM 1A. Risk Factors, (b) ITEM 7.
Management’s Discussion and Analysis of Financial Condition and
Results of Operations and (c) ITEM 8. Financial Statements and
Supplementary Data: Note 19; (2) Exelon’s Second Quarter 2013 Quarterly
Report on Form 10-Q in (a) Part II, Other Information, ITEM 1A. Risk
Factors; (b) Part 1, Financial Information, ITEM 2. Management’s
Discussion and Analysis of Financial Condition and Results of Operations
and (c) Part I, Financial Information, ITEM 1. Financial Statements:
Note 18; and (3) other factors discussed in filings with the SEC by the
Registrants. Readers are cautioned not to place undue reliance on these
forward-looking statements, which apply only as of the date of this
presentation. None of the Registrants undertakes any obligation to publicly
release any revision to its forward-looking statements to reflect
events or circumstances after the date of this presentation.
|
 2013 3Q Earnings Release Slides
2
3Q13 In Review
3Q Highlights
Narrowing 2013 Full-Year Guidance
•
Strong quarter with results higher
than expected 3Q earnings of
$0.78/share
•
Strong fleet operations
94.8% nuclear capacity factor
99.1% fossil and hydro dispatch
match
•
Continental Wind financing
Regulatory Update
•
Rate cases for BGE and ComEd
•
PJM stakeholder process on capacity
markets
•
LCAPP decision in New Jersey
$0.35 -
$0.45
$0.35 -
$0.45
$0.15 -
$0.25
HoldCo
ExGen
ComEd
PECO
BGE
ExGen
ComEd
PECO
BGE
2013 Revised
Guidance
$2.40 -
$2.60
(1)
$1.40 -
$1.50
$0.45 -
$0.50
$0.40 -
$0.45
$0.20 -
$0.25
2013 Initial
Guidance
$2.35 -
$2.65
(1)
$1.40 -
$1.60
LCAPP = Long-Term Capacity Pilot Project
(1)
Refer to Earnings Release Attachments for additional details and to the Appendix for a
reconciliation of adjusted (non GAAP) operating EPS to GAAP EPS. |
 Exelon Generation: Gross Margin Update
September 30, 2013
Change from June 30, 2013
Gross Margin Category ($M)
(1) (2)
2013
2014
2015
2013
2014
2015
Open Gross Margin
(3)
(including South, West, Canada hedged gross margin)
5,600
5,650
5,800
(150)
(50)
(100)
Mark-to-Market of Hedges
(3,4)
1,700
900
450
250
50
50
Power New Business / To Go
50
500
750
(150)
(50)
-
Non-Power Margins Executed
400
200
100
50
50
50
Non-Power New Business / To Go
(5)
200
400
500
(50)
(50)
(50)
Total Gross Margin
7,950
7,650
7,600
(50)
(50)
(50)
Key Changes in 3Q 2013
•
Continue
to
execute
behind
ratable
and
utilize
cross-commodity
hedges
as
our
fundamental
view
shows
upside
in
2015.
•
2013:
Reduction
of
$50M
due
to
lower
expected
margin
from
our
Commercial
group;
offsets
below
gross
margin
make
this
a
negligible
impact
to
EPS
•
2014
&
2015:
$50M
reduction
due
to
prices
and
a
reduction
in
expected
output
from
our
wind
assets.
2013 3Q Earnings Release Slides
3
1)
Gross margin rounded to nearest $50M.
2)
Gross margin does not include revenue related to decommissioning, gross
receipts tax, Exelon Nuclear Partners and entities consolidated solely as a
result of the application of FIN 46R.
3)
Includes CENG Joint Venture.
4)
Mark to Market of Hedges assumes mid-point of hedge percentages.
5)
Any changes to new business estimates for our non-power business are
presented as revenue less costs of sales.
|
 •
Our hedging profile in PJM East has tracked at or
ahead of ratable, limiting the impact of the basis
move on our portfolio
•
We continue to stay behind ratable in our PJM
Midwest power portfolio due to our view that heat
rates will expand
•
Increases in Mid-Atlantic natural gas production and
weak spot prices pressuring forward Mid-Atlantic
basis prices
•
We expect Mid-Atlantic basis prices will stabilize as
infrastructure is put in place to export natural gas
from the Mid-Atlantic production area
•
Although Chicago city gate basis has also seen
recent declines, PJM power price impact is smaller.
We expect basis in the Midwest will not reach
discounts seen in the East
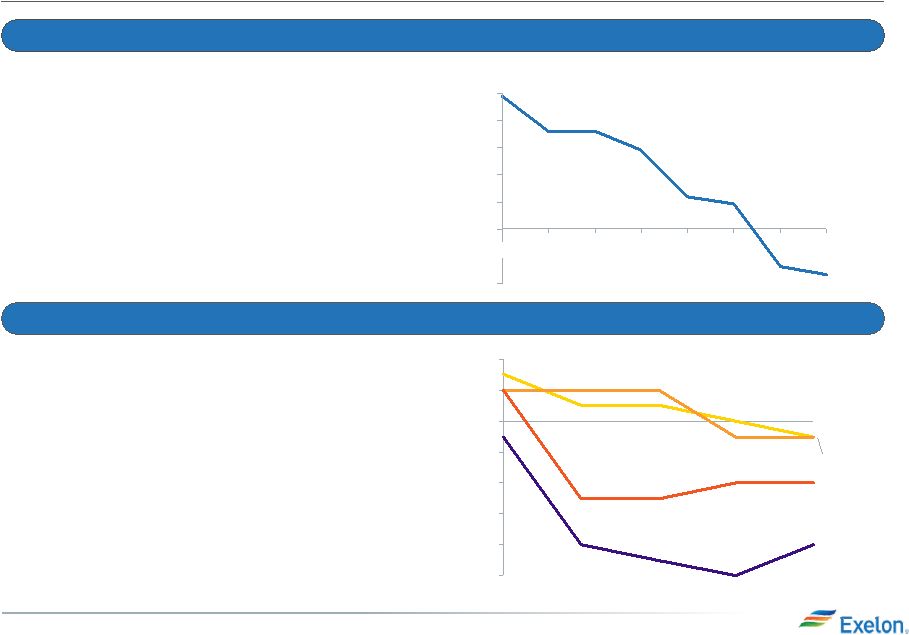
Natural Gas Basis Impact on Portfolio Management
4
2013 3Q Earnings Release Slides
Structural Change That Has Developed Over Years; Should Stabilize Over the
Coming Years Dynamic Hedging to Address Natural Gas Basis Concerns
-10%
-8%
-6%
-4%
-2%
0%
2%
4%
NiHub 2015
NiHub 2014
PJM-W -
2015
PJM-W -
2014
Q3-2013
Q2-2013
Q1-2013
Q4-2012
Q3-2012
-0.4
-0.2
0.0
0.2
0.4
0.6
0.8
1.0
2008
2009
2010
2011
2012
2013
2014
2015
Hedging Deviations to Ratable
Realized and Forward Basis Prices (M3)
$/Mmbtu |
 Key Financial Messages
5
2013 3Q Earnings Release Slides
•
Delivered non-GAAP operating earnings
(1)
in 3Q
of $0.78/share; higher than guidance range
provided of $0.60 -
$0.70/share
3Q 2013 vs. Guidance
•
Higher earnings at utilities primarily driven by
lower storm costs
•
Higher ExGen earnings primarily driven by
lower O&M
Full-Year 2013 Guidance
•
Strong YTD performance reflected in raising
the bottom of guidance range
•
Gross margin reduction at ExGen
•
Delay in AVSR tax credits
$0.78
($0.02)
$0.48
$0.15
$0.11
$0.06
HoldCo
ExGen
ComEd
PECO
BGE
2013 3Q Results
(1)
Refer to Earnings Release Attachments for additional details and to the Appendix for a
reconciliation of adjusted (non-GAAP) operating EPS to GAAP EPS. |
 ExGen Operating EPS Contribution
6
2013 3Q Earnings Release Slides
$0.53
$0.48
3Q
2013
2012
RNF
=
Revenue
Net
Fuel.
(1)
Refer
to
the
Earnings
Release
Attachments
for
additional
details
and
to
the
Appendix
for
a
reconciliation
of
adjusted
(non-GAAP)
operating
EPS
to
GAAP
EPS.
(excludes Salem and CENG)
3Q12 Actual
3Q13 Actual
Planned Refueling Outage Days
43
43
Non-refueling Outage Days
40
5
Nuclear Capacity Factor
90.7%
94.8%
Key Drivers –
3Q13 vs. 3Q12
(1)
•
Lower RNF, primarily due to lower realized
energy prices, partially offset by higher capacity
pricing and increased nuclear volumes: $(0.18)
•
Increased depreciation expense: $(0.02)
•
Higher Nuclear Decommissioning Trust (NDT)
fund gains: $0.02
•
Lower O&M costs, primarily due to merger
synergies:
$0.05
•
Lower income tax, primarily driven by AVSR
investment tax credit benefits: $0.06 |
 Exelon Utilities Operating EPS Contribution
7
2013 3Q Earnings Release Slides
3Q 2013
3Q 2012
$0.10
$0.15
$0.11
$0.24
$0.14
$0.00
$0.06
$0.32
BGE
PECO
ComEd
Numbers
may
not
add
due
to
rounding.
(1)
Refer
to
the
Earnings
Release
Attachments
for
additional
details
and
to
the
Appendix
for
a
reconciliation
of
adjusted
(non-GAAP)
operating
EPS
to
GAAP
EPS.
(2)
Due
to
the
distribution
formula
rate,
changes
in
ComEd’s
earnings
are
driven
primarily
by
changes
in
30-year
U.S.
Treasury
rates
(allowed
ROE),
rate
base
and
capital
structure
in
addition
to
weather,
load
and
changes
in
customer
mix.
Key Drivers –
3Q13 vs. 3Q12
(1):
BGE
(+$0.06):
•
Electric and gas distribution rates: $0.02
•
Decreased storm costs: $0.03
PECO
(-$0.03):
•
Weather: $(0.02)
•
Higher income tax, primarily due to gas distribution tax
repairs deduction: $(0.02)
ComEd
(+$0.05):
•
Weather
(2)
: $(0.02)
•
Customer mix
(2)
: $0.01
•
Higher distribution revenue due to increased recovery
of costs and capital investments and higher allowed
ROE
(2)
: $0.05 |
 2013 Cash Flow Summary and Key Drivers
Cash from operations of $5,775M
less capex of ($5,450M)
and financing of ($475M)
•
$75M lower projected Capex than 2Q13 Update
$50M AVSR construction delays
$25M Lower investment at the utilities
($25M) Wind and Solar projects increased spend
(2)
Includes
cash
flow
activity
from
Holding
Company,
eliminations,
and
other
corporate
entities.
•
$225M higher than 2Q13 Update
$200M Primarily working capital changes at ExGen
Projected Sources and Uses Summary
1
(1) A more detailed view of the Sources and Uses table can be found on slide
22 2013 3Q Earnings Release Slides
8
•
($150M)
lower
than
2Q13
Update
($150M) Related to reduced AVSR DoE loan
draw due to milestone delays
($25M) Reduced sizing of Continental Wind
debt
$50M Increase in projected year-end
commercial paper at ComEd
($ in millions)
BGE
ComEd
PECO
ExGen
Exelon
(2)
As of
2Q13
Delta
1,575
1,575
–
Cash Flow from
Operations
575
1,075
650
3,550
5,775
5,550
225
Capital Expenditures
(625)
(1,450)
(550)
(2,725)
(5,450)
(5,525)
75
Net Financing
(excluding items below):
(100)
100
50
(450)
(400)
(400)
–
Dividend
(1,250)
(1,250)
–
Project Finance
n/a
n/a
n/a
850
850
1,025
(175)
Other
75
350
(75)
(125)
325
300
25
1,425
1,275
150
Beginning Year Cash Balance:
Ending Year Cash Balance: |
 Continental Wind Financing
9
2013 3Q Earnings Release Slides
•
Issued $613M of 20-year project
finance debt with coupon of 6%
Non-recourse to parent
Financing based on long-term
contracted cash flows of wind
portfolio
•
Largest ever domestic wind project
finance transaction
•
Debt rated as investment-grade by all
three rating agencies
•
Rating agencies treat debt as “non-
recourse”
Project financing is an attractive vehicle to grow the business in a credit
supportive manner
OR
1 project
20.0 MW
NM
1 project
27.3 MW
TX
1 project
91.2 MW
KS
2 projects
116.5 MW
MI
4 projects
283.8 MW
ID
4 projects
128.1 MW
Financing backed by 667 MW wind portfolio across
six states |
 10
Exelon Generation Disclosures
September 30, 2013
2013 3Q Earnings Release Slides |
 11
Portfolio Management Strategy
Protect Balance Sheet
Ensure Earnings Stability
Create Value
2013 3Q Earnings Release Slides |
 12
Components of Gross Margin Categories
Margins move from new business to MtM of hedges over
the course of the year as sales are executed
Margins move from “Non power new business”
to
“Non power executed”
over the course of the year
Gross margin linked to power production and sales
Gross margin from
other business activities
(1)
Hedged
gross
margins
for
South,
West
and
Canada
region
will
be
included
with
Open
Gross
Margin,
and
no
expected
generation,
hedge
%,
EREP
or
reference
prices
provided
for
this
region.
(2)
MtM
of
hedges
provided
directly
for
the
five
larger
regions.
MtM
of
hedges
is
not
provided
directly
at
the
regional
level
but
can
be
easily
estimated
using
EREP,
reference
price
and
hedged
MWh.
(3)
Proprietary
trading
gross
margins
will
remain
within
“Non
Power”
New
Business
category
and
not
move
to
“Non
Power”
Executed
category.
2013 3Q Earnings Release Slides |
 13
ExGen Disclosures
Gross Margin Category ($M)
(1,2)
2013
2014
2015
Open Gross Margin
(including South, West & Canada hedged GM)
(3)
5,600
5,650
5,800
Mark to Market of Hedges
(3,4)
1,700
900
450
Power New Business / To Go
50
500
750
Non-Power Margins Executed
400
200
100
Non-Power New Business / To Go
(5)
200
400
500
Total Gross Margin
7,950
7,650
7,600
Reference Prices
(6)
2013
2014
2015
Henry Hub Natural Gas ($/MMbtu)
$3.65
$3.86
$4.06
Midwest: NiHub ATC prices ($/MWh)
$31.18
$30.25
$30.47
Mid-Atlantic: PJM-W ATC prices ($/MWh)
$37.58
$37.19
$37.53
ERCOT-N ATC Spark Spread ($/MWh)
HSC Gas, 7.2HR, $2.50 VOM
$1.09
$6.30
$8.18
New York: NY Zone A ($/MWh)
$37.07
$35.54
$35.70
New England: Mass Hub ATC Spark Spread($/MWh)
ALQN Gas, 7.5HR, $0.50 VOM
$3.70
$4.88
$3.69
2013 3Q Earnings Release Slides
(1)
Gross margin rounded to nearest $50M.
(2)
Gross margin does not include revenue related to decommissioning, gross
receipts tax, Exelon Nuclear Partners and entities consolidated solely as a
result of the application of FIN 46R.
(3)
Includes CENG Joint Venture.
(4)
Mark to Market of Hedges assumes mid-point of hedge percentages.
(5)
Any changes to new business estimates for our non-power business are
presented as revenue less costs of sales.
(6)
Based on September 30, 2013 market conditions.
|
 14
ExGen Disclosures
Generation and Hedges
2013
2014
2015
Exp. Gen (GWh)
(1)
214,700
215,500
209,400
Midwest
97,200
96,900
96,400
Mid-Atlantic
(2)
74,500
73,600
70,100
ERCOT
13,200
17,800
19,600
New York
(2)
14,000
12,500
9,300
New England
15,800
14,700
14,000
% of Expected Generation Hedged
(3)
97-100%
84-87%
48-51%
Midwest
97-100%
85-88%
47-50%
Mid-Atlantic
(2)
97-100%
90-93%
56-59%
ERCOT
92-95%
81-84%
38-41%
New York
(2)
99-101%
87-90%
54-57%
New England
94-97%
49-52%
22-25%
Effective Realized Energy Price ($/MWh)
(4)
Midwest
$37.00
$33.50
$33.00
Mid-Atlantic
(2)
$49.00
$45.00
$45.00
ERCOT
(5)
$24.00
$11.00
$9.50
New York
(2)
$32.00
$37.00
$42.50
New England
(5)
$6.00
$3.50
$2.00
(1) Expected generation represents the amount of energy
estimated to be generated or purchased through owned or contracted for capacity. Expected generation is based upon a simulated
dispatch model that makes assumptions regarding future market conditions,
which are calibrated to market quotes for power, fuel, load following products, and options. Expected generation
assumes 12 refueling outages in 2013 and 14 refueling outages in
2014 and 2015 at Exelon-operated nuclear plants, Salem and CENG.
Expected generation assumes capacity factors of 94.1%, 93.7%, and
93.3% in 2013, 2014 and 2015 at Exelon-operated nuclear plants excluding Salem and CENG. These estimates of expected generation in 2014 and 2015 do not represent
guidance or a forecast of future results as Exelon has not completed its
planning or optimization processes for those years. (2) Includes CENG Joint Venture. (3) Percent of expected
generation hedged is the amount of equivalent sales divided by expected
generation. Includes all hedging products, such as wholesale and retail sales of power, options and swaps. Uses
expected value on options. (4) Effective realized energy price is
representative of an all-in hedged price, on a per MWh basis, at which expected generation has been hedged. It is developed by
considering the energy revenues and costs associated with our hedges and by
considering the fossil fuel that has been purchased to lock in margin. It excludes uranium costs and RPM
capacity
revenue,
but
includes
the
mark-to
market
value
of
capacity
contracted
at
prices
other
than
RPM
clearing
prices
including
our
load
obligations.
It
can
be
compared
with
the
reference
prices used to calculate open gross margin in order to determine
the mark-to-market value of Exelon Generation's energy hedges. (5)
Spark spreads shown for ERCOT and New England. 2013 3Q Earnings Release
Slides |
 15
ExGen Hedged Gross Margin Sensitivities
(1) Based on September 30, 2013 market conditions and hedged position. Gas
price sensitivities are based on an assumed gas-power relationship derived from an internal model that is
updated periodically. Power prices sensitivities are derived by adjusting the
power price assumption while keeping all other prices inputs constant. Due to correlation of the various assumptions,
the hedged gross margin impact calculated by aggregating individual
sensitivities may not be equal to the hedged gross margin impact calculated when correlations between the various
assumptions
are
also
considered.
(2)
Sensitivities
based
on
commodity
exposure
which
includes
open
generation
and
all
committed
transactions.
(3)
Includes
CENG
Joint
Venture.
Gross Margin Sensitivities (With Existing Hedges)
(1, 2)
2013
2014
2015
Henry Hub Natural Gas ($/Mmbtu)
+ $1/Mmbtu
$10
$110
$370
-
$1/Mmbtu
$0
$(45)
$(305)
NiHub ATC Energy Price
+ $5/MWh
$0
$65
$325
-
$5/MWh
$0
$(60)
$(325)
PJM-W ATC Energy Price
+ $5/MWh
$0
$35
$175
-
$5/MWh
$0
$(35)
$(170)
NYPP Zone A ATC Energy Price
+ $5/MWh
$0
$5
$20
-
$5/MWh
$0
$(10)
$(20)
Nuclear Capacity Factor
(3)
+/-
1%
+/-
$10
+/-
$40
+/-
$45
2013 3Q Earnings Release Slides |
 16
Exelon Generation Hedged Gross Margin Upside/Risk
(1) Represents an approximate range of expected gross margin, taking into
account hedges in place, between the 5th and 95th percent confidence levels assuming all unhedged supply is sold
into
the
spot
market.
Approximate
gross
margin
ranges
are
based
upon
an
internal
simulation
model
and
are
subject
to
change
based
upon
market
inputs,
future
transactions
and
potential
modeling changes. These ranges of approximate gross margin in 2014 and 2015 do
not represent earnings guidance or a forecast of future results as Exelon has not completed its planning or
optimization processes for those years. The price distributions that generate
this range are calibrated to market quotes for power, fuel, load following products, and options as of September 30,
2013 (2) Gross Margin Upside/Risk based on commodity exposure which includes
open generation and all committed transactions. $6,000
$6,500
$7,000
$7,500
$8,000
$8,500
$9,000
2015
$8,400
2014
$7,950
2013
$8,000
$7,900
$7,300
$6,900
2013 3Q Earnings Release Slides |
 17
Illustrative Example of Modeling Exelon
Generation
2014 Gross Margin
Row
Item
Midwest
Mid-
Atlantic
ERCOT
New York
New
England
South,
West &
Canada
(A)
Start with fleet-wide open gross margin
$5.65 billion
(B)
Expected Generation (TWh)
96.9
73.6
17.8
12.5
14.7
(C)
Hedge % (assuming mid-point of range)
85.5%
91.5%
82.5%
88.5%
50.5%
(D=B*C)
Hedged Volume (TWh)
82.8
67.3
14.7
11.1
7.4
(E)
Effective Realized Energy Price ($/MWh)
$33.50
$45.00
$11.00
$37.00
$3.50
(F)
Reference Price ($/MWh)
$30.25
$37.19
$6.30
$35.54
$4.88
(G=E-F)
Difference ($/MWh)
$3.25
$7.81
$4.70
$1.46
$(1.38)
(H=D*G)
Mark-to-market value of hedges ($ million)
(1)
$270 million
$525 million
$70 million
$15 million
$(10) million
(I=A+H)
Hedged Gross Margin ($ million)
$6,550 million
(J)
Power New Business / To Go ($ million)
$500 million
(K)
Non-Power Margins Executed ($ million)
$200 million
(L)
Non-
Power New Business / To Go ($ million)
$400 million
(N=I+J+K+L)
Total Gross Margin
$7,650 million
(1) Mark-to-market rounded to the nearest $5 million.
2013 3Q Earnings Release Slides |
 18
Additional Disclosures
2013 3Q Earnings Release Slides |
 19
Exelon Utilities Weather-Normalized Load
2013 3Q Earnings Release Slides
Notes: Data is not adjusted for leap year. Source of 2013 economic
outlook data is Global Insight (August 2013). Assumes 2013 GDP of 1.5% and U.S unemployment of 7.3%.
ComEd has the ROE collar as part of the distribution formula rate and BGE is
decoupled which mitigates the load risk. QTD and YTD actual data can be found in earnings release tables.
BGE amounts have been adjusted for unbilled / true-up load from prior
quarters. |
 2013 3Q Earnings Release Slides
20
ComEd April 2013 Distribution Formula Rate Updated Filing
Note: Disallowance of any items in the 2013 distribution formula rate
filing could impact 2013 earnings in the form of a regulatory asset adjustment. Amounts above as of surrebuttal testimony.
The 2013 distribution formula rate filing establishes the net revenue
requirement used to set the rates that will take effect in January 2014 after the
ICC’s
review. The filing was updated to reflect the impact of Senate Bill 9. There are two components to the annual distribution formula rate filing:
•
Filing Year: Based on prior year costs (2012) and current year (2013)
projected plant additions. •
Annual Reconciliation: For the prior calendar year (2012), this amount
reconciles the revenue requirement reflected in rates during the prior year
(2012) in effect to the actual costs for that year. The annual reconciliation
impacts cash flow in the following year (2014) but the earnings impact has
been recorded in the prior year (2012) as a regulatory asset. |
 21
BGE Rate Case
2013 3Q Earnings Release Slides
Rate Case Request
Electric
Gas
Docket #
9326
Test Year
August 2012 –
July 2013
Common Equity Ratio
51.1%
Requested Returns
ROE: 10.5%; ROR: 7.87%
ROE: 10.35%; ROR: 7.79%
Rate Base
$2.8B
$1.0B
Revenue Requirement Increase
$82.6M
$24.4M
Proposed Distribution Price
Increase as % of overall bill
2%
3%
Timeline
•5/17/13: BGE filed application with the MDPSC seeking increases in gas
& electric distribution base rates •8/5/13: Staff/Intervenors
file direct testimony •8/23/13: Update 8 months actual/4 month
estimated test period data with actuals for last 4 months (March
- July 2013)
•9/17/13: BGE and staff/intervenors file rebuttal testimony
•10/3/13: Staff/Intervenors and BGE file surrebuttal testimony
•10/18/13 –
11/1/13: Hearings
•11/12/13: Initial Briefs
•11/22/13: Reply Briefs
•12/13/13: Final Order
•New rates are in effect shortly after the final order
|
 2013 Projected Sources and Uses of Cash
2013 3Q Earnings Release Slides
22
($ in millions)
BGE
ComEd
PECO
ExGen
Exelon
(6)
As of 2Q13
Delta
1,575
1,575
--
Cash Flow from Operations
(2)
575
1,075
650
3,550
5,775
5,550
225
CapEx (excluding other items
below):
(500)
(1,300)
(375)
(1,000)
(3,275)
(3,300)
25
Nuclear Fuel
n/a
n/a
n/a
(1,000)
(1,000)
(1,000)
--
Dividend
(3)
(1,250)
(1,250)
--
Nuclear Uprates
n/a
n/a
n/a
(150)
(150)
(150)
--
Wind
n/a
n/a
n/a
(25)
(25)
(25)
--
Solar
n/a
n/a
n/a
(500)
(500)
(550)
50
Upstream
n/a
n/a
n/a
(50)
(50)
(50)
--
Utility Smart Grid/Smart Meter
(125)
(150)
(175)
n/a
(450)
(450)
--
Net Financing (excluding
Dividend):
Debt Issuances
300
350
550
--
1,200
1,200
--
Debt Retirements
(4)
(400)
(250)
(500)
(450)
(1,600)
(1,600)
--
Project Finance/Federal Financing
Bank Loan
n/a
n/a
n/a
850
850
1,025
(175)
Other
(5)
75
350
(75)
(125)
325
300
25
1,425
1,275
150
(1) Exelon beginning cash balance as of 1/1/13. Excludes counterparty
collateral activity. (2)
Cash Flow from Operations primarily includes net cash flows provided by
operating activities and net cash flows used in investing activities other than
capital expenditures.
(3) Dividends are subject to declaration by the Board of Directors.
(4) Includes PECO’s $210 million Accounts Receivable (A/R) Agreement with
Bank of Tokyo and excludes BGE’s current portion of its rate stabilization bonds
(5) “Other”
includes proceeds from options, redemption of PECO preferred stock and expected
changes in short-term debt, including money pool activity. (6)
Includes cash flow activity from Holding Company, eliminations, and other corporate entities.
Beginning Cash Balance
(1)
Ending Cash Balance
(1) |
 3Q GAAP EPS Reconciliation
Three Months Ended September 30, 2013
ExGen
ComEd
PECO
BGE
Other
Exelon
2013 Adjusted (non-GAAP) Operating Earnings (Loss) Per Share
$0.47
$0.15
$0.11
$0.06
$(0.02)
$0.78
Mark-to-market impact of economic hedging activities
0.18
-
-
-
-
0.17
Unrealized gains related to NDT fund investments
0.03
-
-
-
-
0.03
Asset retirement obligation
(0.01)
-
-
-
-
(0.01)
Constellation merger and integration costs
(0.02)
-
(0.00)
-
-
(0.03)
Amortization of commodity contract intangibles
(0.05)
-
-
-
-
(0.05)
Long-lived asset impairment
(0.03)
-
-
-
-
(0.03)
3Q 2013 GAAP Earnings (Loss) Per Share
$0.57
$0.15
$0.11
$0.06
$(0.02)
$0.86
NOTE: All amounts shown are per Exelon share and represent contributions
to Exelon's EPS. Amounts may not add due to rounding. Three Months
Ended September 30, 2012 ExGen
ComEd
PECO
BGE
Other
Exelon
2012 Adjusted (non-GAAP) Operating Earnings (Loss) Per Share
$0.54
$0.11
$0.14
$0.00
$(0.01)
$0.77
Mark-to-market impact of economic hedging activities
0.01
-
-
-
0.01
0.02
Unrealized losses related to NDT fund investments
0.04
-
-
-
-
0.04
Plant retirements and divestitures
(0.22)
-
-
-
-
(0.22)
Asset retirement obligation
(0.01)
-
-
-
-
(0.01)
Constellation merger and integration costs
(0.04)
-
-
-
-
(0.04)
Amortization of commodity contract intangibles
(0.21)
-
-
-
-
(0.21)
3Q 2012 GAAP Earnings (Loss) Per Share
$0.11
$0.11
$0.14
$0.00
$0.00
$0.35
2013 3Q Earnings Release Slides
23 |
 Nine Months Ended September 30, 2013
ExGen
ComEd
PECO
BGE
Other
Exelon
2013 Adjusted (non-GAAP) Operating Earnings (Loss) Per Share
$1.18
$0.36
$0.34
$0.16
$(0.06)
$2.00
Mark-to-market impact of economic hedging activities
0.20
-
-
-
(0.00)
0.21
Unrealized gains related to NDT fund investments
0.04
-
-
-
-
0.04
Plant retirements and divestitures
0.02
-
-
-
-
0.01
Asset retirement obligation
(0.01)
-
-
-
-
(0.01)
Constellation merger and integration costs
(0.07)
-
(0.01)
0.00
(0.00)
(0.08)
Amortization of commodity contract intangibles
(0.32)
-
-
-
-
(0.32)
Amortization of the fair value of certain debt
0.01
-
-
-
-
0.01
Remeasurement of like kind exchange tax position
-
(0.20)
-
-
(0.11)
(0.31)
Long-lived asset impairment
(0.12)
-
-
-
(0.01)
(0.13)
YTD 2013 GAAP Earnings (Loss) Per Share
$0.93
$0.16
$0.33
$0.17
$(0.18)
$1.42
Nine Months Ended September 30, 2012
ExGen
ComEd
PECO
BGE
Other
Exelon
2012 Adjusted (non-GAAP) Operating Earnings (Loss) Per Share
$1.57
$0.27
$0.38
$0.03
$(0.05)
$2.21
Mark-to-market impact of economic hedging activities
0.21
-
-
-
0.02
0.23
Unrealized gains related to NDT fund investments
0.07
-
-
-
-
0.07
Plant retirements and divestitures
(0.25)
-
-
-
-
(0.25)
Asset retirement obligation
(0.01)
-
-
-
-
(0.01)
Constellation merger and integration costs
(0.16)
-
(0.01)
-
(0.08)
(0.26)
Maryland commitments
(0.03)
-
(0.10)
(0.15)
(0.28)
Amortization of commodity contract intangibles
(0.68)
-
-
-
-
(0.68)
Amortization of the fair value of certain debt
0.01
-
-
-
-
0.01
FERC Settlement
(0.22)
-
-
-
-
(0.22)
Reassessment of state deferred income taxes
0.02
-
-
-
0.13
0.15
YTD 2012 GAAP Earnings (Loss) Per Share
$0.53
$0.27
$0.37
(0.07)
$(0.13)
$0.97
NOTE: All amounts shown are per Exelon share and represent contributions
to Exelon's EPS. Amounts may not add due to rounding. 2013 3Q
Earnings Release Slides 24
3Q YTD GAAP EPS Reconciliation |
 GAAP to Operating Adjustments
2013 3Q Earnings Release Slides
•
Exelon’s 2013 adjusted (non-GAAP) operating earnings excludes the
earnings effects of the following: Mark-to-market adjustments from
economic hedging activities Unrealized gains and losses from NDT fund
investments to the extent not offset by contractual accounting as
described in the notes to the consolidated financial statements
Financial impacts associated with the sale or retirement of generating
stations Financial impacts associated with the increase in certain
decommissioning obligations for retired fossil power plants
Certain costs incurred associated with the Constellation merger and integration
initiatives Non-cash amortization of intangible assets, net, related
to commodity contracts recorded at fair value at the merger date
Non-cash amortization of certain debt recorded at fair value at the merger
date, which was retired in the second quarter of 2013
Non-cash charge to earnings resulting from the remeasurement of
Exelon’s like-kind exchange tax position
Non-cash charge to earnings related to the cancellation of previously
capitalized nuclear uprate projects and the impairment of certain wind
generating assets Other unusual items
25 |