Attached files
| file | filename |
|---|---|
| EX-99.1 - EX-99.1 - Cooper-Standard Holdings Inc. | d620680dex991.htm |
| 8-K - 8-K - Cooper-Standard Holdings Inc. | d620680d8k.htm |
 |
 DRIVE
FOR PROFITABLE
GROWTH
Investor Day
October 30, 2013 |
 TOP 30 / TOP 5
Today’s Presentation
-
Glenn Dong, Vice President and Treasurer
-
Jeff Edwards, Chairman and Chief Executive Officer
-
Keith Stephenson, Executive Vice President and Chief Operating Officer
-
Allen Campbell, Executive Vice President and Chief Financial Officer
•
Welcome and Introductions
•
Cooper Standard Overview and Strategic Direction
•
Avenues for Growth
•
Financial Overview and Guidance
3 |
 TOP 30 / TOP 5
Forward-Looking Statements
This presentation includes “forward-looking statements” within the meaning of U.S.
federal securities laws, and we intend that such forward-looking statements be subject to
the safe harbor created thereby. We make forward-looking statements in this presentation and may make such statements
in future filings with the SEC. We may also make forward-looking statements in our press releases
or other public or stockholder communications. These forward-looking statements include
statements concerning our plans, objectives, goals, strategies, future events, future revenue or
performance, capital expenditures, financing needs, plans or intentions relating to acquisitions,
business trends, and other information that is not historical information. When used in this
presentation, the words “estimates,” “expects,” “anticipates,” “projects,” “plans,” “intends,” “believes,”
“forecasts,” or future or conditional verbs, such as “will,” “should,”
“could,” or “may,” and variations of such words or similar expressions are intended
to identify forward-looking statements. All forward-looking statements, including, without
limitation, management’s examination of historical operating trends and data are based
upon our current expectations and various assumptions. Our expectations, beliefs, and projections are expressed in good
faith and we believe there is a reasonable basis for them. However, no assurances can be made that
these expectations, beliefs and projections will be achieved. Forward-looking statements
are not guarantees of future performance and are subject to significant risks and uncertainties that may
cause actual results or achievements to be materially different from the future results or
achievements expressed or implied by the forward-looking statements. There are a number of
risks and uncertainties that could cause our actual results to differ materially from the forward-looking statements contained in
this presentation. Important factors that could cause our actual results to differ materially
from the forward-looking statements we make herein include, but are not limited to:
cyclicality of the automotive industry with the possibility of further material contractions in automotive sales and
production effecting the viability of our customers and financial condition of our customers; global
economic uncertainty, particularly in Europe; loss of large customers or significant platforms;
supply shortages; escalating pricing pressures and decline of volume requirements from our customers; our
ability to meet significant increases in demand; availability and increasing volatility in cost of raw
materials or manufactured components; our ability to continue to compete successfully in the
highly competitive automotive parts industry; risks associated with our non-U.S. operations; foreign currency
exchange rate fluctuations; our ability to control the operations of joint ventures for our benefit;
the effectiveness of our lean manufacturing and other cost savings plans; product liability and
warranty and recall claims that may be brought against us; work stoppages or other labor conditions; natural
disasters; our ability attract and retain key personnel; our ability to meet our customers’ needs
for new and improved products in a timely manner or cost-effective basis; the possibility
that our acquisition strategy may not be successful; our legal rights to our intellectual property portfolio;
environmental and other regulations; legal proceedings or commercial and contractual disputes that we
may be involved in; the possible volatility of our annual effective tax rate; our ability to
generate sufficient cash to service our indebtedness, and obtain future financing; our underfunded pension
plans; significant changes in discount rates and the actual return on pension assets; the possibility
of future impairment charges to our goodwill and long-lived assets; and operating and
financial restrictions imposed on us by our bond indentures and credit agreement.
There may be other factors that may cause our actual results to differ materially from the
forward-looking statements. All forward-looking statements attributable to us or
persons acting on our behalf apply only as of the date of this presentation and are expressly qualified in their entirety by the
cautionary statements included herein. We undertake no obligation to update or revise
forward-looking statements to reflect events or circumstances that arise after the date
made or to reflect the occurrence of unanticipated events.
4 |
 Jeff
Edwards Chairman and Chief
Executive Officer
5 |
 Allen Campbell
Executive Vice President
& CFO
Presenting Team and Regional Presidents
Keith Stephenson
Executive Vice President
& COO
Song Min Lee
President, Asia Pacific
Fernando de Miguel
President, Europe
Bill Pumphrey
President, North America
Jeff Edwards
Chairman and CEO
TOP 30 / TOP 5
6 |
 TOP 30 / TOP 5
Corporate Vice Presidents in Attendance
Helen T Yantz
Vice President &
Corporate Controller
Glenn Dong
Vice President & Treasurer
Sharon Wenzl
Vice President, Corporate
Communications
Tim Hefferon
Vice President & General
Counsel
7 |
 8
Company Snapshot
1
Automotive News
2
Does not include approximately $400 M in unconsolidated JV
revenue Product Business Units:
Sealing & Trim
Fuel & Brake Delivery
Fluid Transfer
Thermal & Emissions
Anti-Vibration
8
TOP 30 / TOP 5
Headquarters:
Novi, MI
Established:
1960
Employees:
22,000
Global Suppliers:
Rank 69
1
Global Footprint:
75+ in 19 Countries
7 Design / Engineering Centers
Equity Ticker:
NYSE: CPS
Financial:
2012 revenue: $2.88B
2
2013 E revenue: $3,050 -
$3,075M
Customers:
81% Direct OEM
19% Tiers / Other |
 9
Cooper Standard’s Journey
2004
Divestment
2005 –
2008
Expansion
2008 –
2011
Survival
2011 -
2013
Recovery
2014 and Beyond
Growth
Divested from Cooper Tire & Rubber Company
SEC Registrant
TOP 30 / TOP 5
9 |
 TOP 30 / TOP 5
Cooper Standard’s Journey
2004
Divestment
2005 –
2008
Expansion
2008 –
2011
Survival
2011 -
2013
Recovery
2014 and Beyond
Growth
Strategic Acquisitions:
•
Metzeler
Automotive
Profiles
-
Sealing
•
ITT
-
Fluid
Handling
•
ACH -
Fuel Rail
•
Gates
Corp.
Automotive
-
Fluid
Transfer
Systems
10 |
 TOP 30 / TOP 5
Cooper Standard’s Journey
Global economic / auto industry downturn
Managed for near-term
Downsized engineering & overhead
Tempered capital spending
Restructured debt
2004
Divestment
2005 –
2008
Expansion
2008 –
2011
Survival
2011 -
2013
Recovery
2014 and Beyond
Growth
11 |
 TOP 30 / TOP 5
Cooper Standard’s Journey
2004
Divestment
2005 –
2008
Expansion
2008 –
2011
Survival
2011 -
2013
Recovery
2014 and Beyond
Growth
Rebuilding capabilities and adding management talent
Expanding in Romania, Brazil, India and Thailand
Entering Serbia and Restructuring European Footprint
Rebuilding and re-staffing plants and functions
Investing in IT infrastructure
12 |
 Cooper
Standard’s Journey 2004
Divestment
2005
–
2008
Expansion
2008
–
2011
Survival
2011
-
2013
Recovery
2014 and Beyond
Growth
Focusing business for profitable growth
Tripling our investment in innovation
Creating world-class manufacturing operations
Growing Asia and other expanding markets
Doubling the size of the Company by 2020
TOP 30 / TOP 5
13 |
 Extensive Product Portfolio
*Global Market Share Booz & Company
Static Systems
Glass Run
Channels
Waist belts
Encapsulation
Day Light Systems
Dynamic Systems
On Body Seals
On Door Seals
Convertible
Occupant
Detection
Systems (ODS)
Trim Systems
Appliqués
Bright trim
Garnish moldings
Decorative
interior trim
Specialty Elastomer
#1
Globally
Fuel Lines
Brake Lines
Bundles
Fuel Rails
Tank Lines
#2
Globally
North
American
Leader
Fluid Delivery
Hoses
Sensors
Connectors
Quick-Connects
Engine Tubes
Transmission Oil
Cooler (TOC)
TOC Lines
TOC Modules
AC Lines / Bundles
Power Management
Power Steering
Lines
Convertible Lines
Cabin Tilt Lines
Sealing & Trim
Systems
17%*
Fuel & Brake Delivery
Systems
11%*
Fluid Transfer
Systems
5%*
TOP 30 / TOP 5
14 |
 Revenue is
Growing $1,945.3
Global Sales
15
TOP 30 / TOP 5
$2,414.1
$2,853.5
$2,880.9
$3,050 –
$3,075
$98.3
$282.3
$312.2
$409.7
$435 –
$450
Non-Consolidated JVs
CS Sales
2009
2010
2011
2012
2013
E
$0
$500
$1,000
$1,500
$2,000
$2,500
$3,000
$3,500
$4,000 |
 16
TOP 30 / TOP 5
Sales are Diversifying
includes non-consolidated JV sales
2004
Sales
2012
Sales
Ford
GM
Chrysler
37%
22%
16%
5%
3%
10%
24%
18%
12%
4%
7%
6%
13%
0%
10%
20%
30%
40%
50%
60%
70%
80%
90%
100% |
 17
TOP 30 / TOP 5
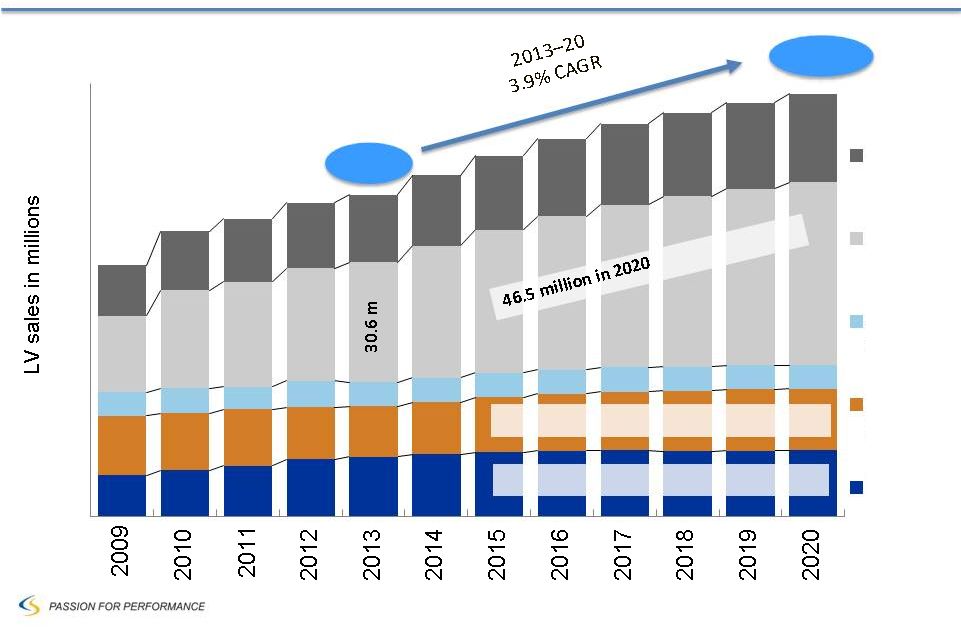
Global Automotive Industry Growth
Source: IHS
Global volume
to exceed
105 million
vehicles by
2020
•
China: greatest global growth from 2015 –
2020; positioned to
be #1 light vehicle market +30 million vehicles
•
India: poised to produce more than 5 million vehicles by 2020
•
Continued strong growth of other developing countries:
Indonesia, Thailand, Mexico, Turkey and Argentina
•
Europe:
to
recover
in
2015
–
2017
•
North America: modest growth aided by global vehicle platforms
•
Top 10 global platforms expected to account for about 20% of
world volume |
 18
TOP 30 / TOP 5
Cooper Standard Products Well Represented
on Global Platforms 2013
#6 GM
Tahoe/Yukon/
Escalade
#2 Ford
Explorer
#19 Ford
Fusion/Mondeo/MKZ
#1 Ford
F-150
#5 GM
LaCrosse / Malibu
#8 Chrysler
200 Mid -
Size CUV
#16 Chrysler
Dodge
Challenger/Charger
#7 PSA
Picasso/C3
#15 Fiat
Giulietta / Dart
#3 Ford
Fiesta / Fusion
#4 Ford
Focus/Escape
#11 GM
Cruze/Volt/Astra
#9 Chrysler
Ram
#13 Volvo
S60/V70
#10 PSA
408 / C4
#20 Chrysler
Jeep Wrangler
#17 VW
Jetta
#18 Chrysler
Town &Country/
Dodge Caravan
#14 Ford
F-Series Super Duty
#12 GM
Silverado/Sierra
Denotes Global Platform
Cooper Standard Products are Consistently on the Top Selling Global Platforms
*While the Volvo models on this platform are not global, the platform
when viewed in total is (includes Ford, Mazda, Tata, and Geely models)
|
 19
TOP 30 / TOP 5
Sealing & Trim Systems
Fluid Transfer Systems
Fuel & Brake Systems
2020E
2012
2020E
2012
2020E
2012
% represents compound annual growth rate
The Cooper Standard Vision
Growth platforms 2012-2020:
Drive for Profitable Growth
Top 30 -
Top 5 *
*Non-consolidated sales
$1.8B
$0.4B
$0.6B
>10% |
 20
TOP 30 / TOP 5
Cooper Standard is Aligned with and
Well-Positioned to Capitalize on Industry Trends
2. Long-term Growth in Emerging Markets
4. Trend Toward Global Platforms
3. North America and Europe Market Recovery
1. Capture China Growth
5. Innovation
Avenues for Profitable Growth
6. Capture Strategic M&A Opportunities |
 21
Keith Stephenson
Executive Vice President and
Chief Operating Officer |
 22
TOP 30 / TOP 5
Avenues for Profitable Growth:
Long-term Growth in Emerging Markets
Brazil
India
China
Production (million)
Source: September 2013 IHS volumes
3.2
3.9
4.6
CAGR: 4.0%
3.2
4.5
6.7
CAGR: 7.7%
30.0
14.7
24.2
CAGR: 7.4% |
 23
TOP 30 / TOP 5
Avenues for Profitable Growth:
North America and Europe Market Recovery
North America
Production (million)
Source: September 2013 IHS volumes
11.9
17.4
18.2
CAGR: 4.3%
19.0
20.4
23.2
CAGR: 1.9%
Europe |
 24
TOP 30 / TOP 5
Global
Footprint Evolution
2008 |
 25
TOP 30 / TOP 5
Global
Footprint Evolution
2013
Expansion
•
Opened two new plants in Brazil
•
Added two plants in NA via
acquisition
•
Launching new JV plant in Mexico
Consolidation
•
Closed Bowling Green, OH plant
Expansion
•
Established plant in Romania
•
Expanded Poland facilities
•
Opening Serbia plant 1Q 2014
Consolidation
•
Closed plants in France, Spain and
Belgium
Expansion
•
Added plant in China via acquisition
•
Added plant in Thailand via JV
•
Opening two facilities in India
•
Expanding two plants in China
Consolidation
•
Downsizing in Korea
Asia
Europe
Americas |
 26
TOP 30 / TOP 5
•
Industry leading line-up of sealing products
–
Alternative materials for weight reduction and
recyclability
•
Value added trim, encapsulation and SafeSeal™
technology
–
Enhanced appearance, safety and increased
content per vehicle
•
Complete range of fluid transfer systems
Introduction of alternative materials
New generation of coatings and connectors
to improve product life
Development of smart systems
Avenues for Profitable Growth:
New Technology and Product Development |
 27
TOP 30 / TOP 5
Innovation is a Core Capability:
–
Internal and external idea generation
–
Detailed gate review designed for “Fast-to-Fail /
Fast-to-Win” –
Formal go-to-market plans
Cooper Standard’s Unique Innovation Process is a Key Differentiator
Avenues for Profitable Growth:
New Technology and Product Development
Established separate organization dedicated to “skip-generation”
technologies/products; radical change
Global team of product / materials / process innovators
Structured process designed for deep and quick investigation,
development & commercialization |
 28
Avenues for Profitable Growth:
Disciplined M&A Strategy Drives In-Organic Growth
•
Demonstrated competency with integrating into Cooper Standard and
realizing synergies
M&A Process Tied to Company Strategy
•
Constantly identifying and evaluating opportunities to accelerate
strategy |
 29
TOP 30 / TOP 5
Building Worldwide Capabilities
Program Management
Global launch process
Product Engineering
Standardizing product specifications / launching low cost engineering center
Innovation Management
Developing
“skip
generation”
technology
Purchasing
Effectively leveraging scale
IT Systems
IT / business systems (SAP, PLM and HRIS)
Best Business Practices
Global operating system and standardization |
 30
Allen Campbell
Executive Vice President and
Chief Financial Officer |
 31
TOP 30 / TOP 5
Source: IHS AutoInsight
Global Light Vehicle Sales Outlook
By Region
0
20
40
60
80
100
Others
BRIC
Japan/
Korea
Western
Europe
US
81.9
15.6 million in 2020
16.7 million in 2020
106.7 |
 TOP 30 / TOP 5
32
Market Dynamics
Prospects for North American Output
Source: IHS Automotive Light Vehicle Production Forecast
11 years
15.8
17.2
15.1
8.6
15.4
5 years
0
4
8
12
16
20
2004
2005
2006
2007
2008
2009
2010
2011
2012
2013
2014
2015
Others
German 3
Asian 4
Fiat
Ford
GM |
 33
TOP 30 / TOP 5
Year-to-Date 2013 Performance
Note: Numbers subject to rounding
$ USD Millions, except EPS / %
Year-to-Date
2012
2013
Sales
$2,183.8
$2,296.3
Gross Profit
339.2
367.6
% Margin
15.5%
16.0%
SGA
206.4
220.8
Operating Profit
105.4
127.5
% Margin
4.8%
5.6%
Net Income
$ 110.3
$ 66.3
Adjusted EBITDA
227.1
228.7
% Margin
10.4%
10.0% |
 34
TOP 30 / TOP 5
Year-to-Date 2013 Revenue Up 5.2 %
$ USD Millions
Note: Numbers
subject to rounding
$302
$335
$132
$146
$170
$189
Unconsolidated JV Revenue
$2,184
$1,139
$781
$107
$156
$2,296
$1,192
$806
$139
$160
$0
$500
$1,000
$1,500
$2,000
$2,500
$3,000
Consolidated
North America
Europe
South America
Asia Pacific
2012 YTD Cooper Standard Revenue
2013 YTD Cooper Standard Revenue |
 35
TOP 30 / TOP 5
Cash Flow and Liquidity as of September 30, 2013
Liquidity
Cash Balance as of Sep 30, 2013
ABL Revolver
Letters of Credit
Total Liquidity
Note: Numbers subject to rounding
$ 119.2
150.0
(26.4)
$ 242.8
($ USD Millions) |
 36
TOP 30 / TOP 5
Capital Structure
as of September 30, 2013
(1) Before OID and underwriting fees
Cash & equivalents
$119.2
Total Debt
Capital leases & other
33.0
Revolving Credit Facility
-
Total Secured Debt
33.0
Senior Unsecured Notes
450.0
Holdco PIK Toggle Notes
(1)
200.0
Total Debt
683.0
Convertible Preferred Stock
103.6
Equity
496.7
Total Capitalization
$ 1,402.5 |
 37
TOP 30 / TOP 5
2013 Guidance
Key Assumptions:
North American production
16.2 million
Europe (including Russia) production
19.0 million
Average full year exchange rate
$1.32/Euro
$3,050 -
$3,075
$ USD Millions
$ USD Millions
$ USD Millions
$ USD Millions
*Guidance
Capital Expenditures
Cash Restructuring
Cash Taxes
Revenues
2009A
2010A
2011A
2012A
2013*
2009A
2010A
2011A
2012A
2013*
2009A
2010A
2011A
2012A
2013*
2009A
2010A
2011A
2012A
2013*
$1,945
$2,414
$2,854
$2,881
$46
$77
$108
$131
$180-$190
$43
$19
$27
$43
$20-$25
($1)
$11
$21
$18
$5-$10 |
 38
TOP 30 / TOP 5
Investment Highlights
NYSE: CPS
Advantaged global footprint and
strong track record of
operating performance
Free
cash
flow
supports
investment in
expansion,
innovation,
M&A
Long-standing customer
relationships
Significant growth available by
product, customer, geography
Superior innovation and
engineering capabilities
Management team focused on
profitable growth
Drive for Profitable Growth
Top 30 -
Top 5 |
 39
Appendix |
 40
TOP 30 / TOP 5
EBITDA
and
Adjusted
EBITDA
Reconciliation
–
2009
2009
Net Loss
$(356.1)
Income tax benefit
(55.7)
EBITDA
$(233.7)
Restructuring
32.4
Adjusted EBITDA
$ 176.5
Interest expense, net of interest income
64.3
Depreciation and amortization
113.8
Bond repurchase
(9.1)
Foreign exchange gains
(4.0)
Reorganization / Fresh Start/ Impairment
EBITDA excl. Reorg & Impairment
147.2
380.9
Reorganization related fees
7.7
Other
0.9
Stock based compensation
1.4
($ USD Millions) |
 41
TOP 30 / TOP 5
EBITDA
and
Adjusted
EBITDA
Reconciliation
–
2010
and
2011
2010
2011
Net income
$ 320.3
$ 102.8
Income tax expense
45.0
EBITDA
$ 537.2
$ 288.2
Restructuring
6.4
32.3
Adjusted EBITDA
$ 276.5
$ 324.1
20.8
Interest expense, net of interest income
69.5
40.5
Depreciation and amortization
102.4
124.1
Stock based compensation
6.6
Other / foreign exchange
21.6
10.8
(7.9)
Reorganization / Fresh Start
--
Inventory write-up
8.1
0.7
EBITDA excl. Reorganization
288.2
233.8
(303.4)
($ USD Millions) |
 42
TOP 30 / TOP 5
EBITDA and Adjusted EBITDA Reconciliation –
2012
($ USD Millions)
(1)
Includes cash and non-cash restructuring.
(2)
(3)
Non-cash stock amortization expense and non-cash stock option expense for grants issued at
emergence from bankruptcy. (4)
Impairment charges related to goodwill ($2.8 million) and fixed assets ($7.3 million)
(5)
Executive compensation for retired CEO and recruiting costs related to search for new CEO
(6)
Noncontrolling interest deferred tax valuation reversal
Note: Numbers subject to rounding
Three Months Ended
Twelve
Months
Ended
Mar 31,
2012
Jun 30,
2012
Sep 30,
2012
Dec 31,
2012
Dec 31,
2012
Net income (loss)
$ 23.8
$ 77.3
$ 11.6
$ (9.9)
$ 102.8
Income tax expense (benefit)
8.1
(46.2)
5.4
1.2
(31.5)
Interest expense, net of interest income
11.2
10.8
11.3
11.5
44.8
Depreciation and amortization
31.6
30.5
29.1
31.5
122.7
EBITDA
$ 74.7
$ 72.4
$ 57.4
$ 34.3
$ 238.8
Restructuring
(1)
6.1
(0.5)
10.2
13.0
28.8
Noncontrolling interest restructuring
(2)
(0.3)
-
(0.2)
(2.5)
(3.0)
Stock-based compensation
(3)
2.7
2.2
2.4
2.5
9.8
Impairment charges
(4)
-
-
-
10.1
10.1
Payment to former CEO and transition cost
(5)
-
-
-
11.5
11.5
Noncontrolling deferred tax valuation reversal
(6)
-
-
-
2.0
2.0
Adjusted EBITDA
$ 83.2
$ 74.1
$ 69.8
$ 70.9
$ 298.0
Sales
765.3
734.5
684.0
697.1
2,880.9
Adjusted EBITDA as a percent of Sales
10.9%
10.1%
10.2%
10.2%
10.3%
Proportionate share of restructuring costs related to FMEA joint venture.
|
 43
TOP 30 / TOP 5
Net Leverage Ratio and Adj. EBITDA % Margin
as of September 30, 2013
($ USD Millions)
(1)
Includes noncash restructuring.
(2)
Proportionate share of restructuring costs related to Cooper Standard France joint
venture. (3)
Non-cash stock amortization expense and non-cash stock option expense for grants
issued at time of the Company's 2010 reorganization. (4)
Impairment charges related to goodwill ($2.8 million) and fixed assets ($7.3 million)
(5)
Executive compensation for retired CEO and costs related to search for new CEO
(6)
Noncontrolling interest deferred tax valuation reversal
(7)
Write-up of inventory to fair value for the Jyco acquisition
(8)
Costs incurred in relation to the Jyco acquisition
Three Months Ended
Twelve Months
Ended
Dec 31, 2012
Mar 31, 2013
Jun 30, 2013
Sep 30, 2013
Sep 30, 2013
Net income (loss)
$ (9.9)
$ 20.7
$ 27.4
$ 20.6
$ 58.8
Income tax expense
1.2
7.9
12.2
4.5
25.8
Interest expense, net of interest income
11.5
11.2
13.6
15.2
51.5
Depreciation and amortization
31.5
29.8
28.2
25.2
114.7
EBITDA
$ 34.3
$ 69.6
$ 81.4
$ 65.5
$ 250.8
Restructuring
13.0
4.8
1.0
1.9
20.7
Noncontrolling interest restructuring
(2.5)
(0.7)
(0.1)
-
(3.3)
Stock-based compensation
2.5
2.7
0.5
1.1
6.8
Impairment charges
10.1
-
-
-
10.1
Payment to former CEO and transition cost
11.5
-
-
-
11.5
2.0
-
-
-
2.0
Inventory write-up
-
-
-
0.3
0.3
Acquisition costs
-
-
-
0.7
0.7
Other
-
0.3
(0.3)
-
-
Adjusted EBITDA
$ 70.9
$ 76.7
$ 82.5
$ 69.5
$ 299.6
Net Leverage
Debt payable within one year
30.3
Long-term debt
649.0
Less: cash and cash equivalents
(119.2)
Net Leverage
$ 560.1
Net Leverage Ratio
1.9
Sales
$ 697.1
$ 747.6
$ 784.7
$ 764.1
$ 2,993.5
Adjusted EBITDA as a percent of Sales
10.2%
10.3%
10.5%
9.1%
10.0%
Note: Numbers subject to rounding
(1)
(2)
(3)
(4)
(5)
(7)
(8)
Noncontrolling deferred tax valuation reversal
(6) |
 44
TOP 30 / TOP 5
LTM EBITDA and Adjusted EBITDA Reconciliation
as of September 30, 2012
Note: Numbers subject to rounding
(1)
Includes cash and noncash restructuring.
(2)
Proportionate share of restructuring costs related to Cooper Standard France joint
venture. (3)
Non-cash stock amortization expense and non-cash stock option expense for
grants issued at time of the Company’s 2010 reorganization. (4)
Costs related to corporate development activities.
($ USD Millions)
Three Months Ended
Twelve
Months
Ended
Dec 31,
2011
Mar 31,
2012
Jun 30,
2012
Sep 30,
2012
Sep 30,
2012
Net income
$ 23.2
$ 23.8
$ 77.3
$ 11.6
$ 135.9
Income tax expense (benefit)
(6.0)
8.1
(46.2)
5.4
(38.7)
Interest expense, net of interest income
10.3
11.2
10.8
11.3
43.6
Depreciation and amortization
32.1
31.6
30.5
29.1
123.3
EBITDA
$ 59.6
$ 74.7
$ 72.4
$ 57.4
$ 264.1
Restructuring
(1)
4.1
6.1
(0.5)
10.2
19.9
Noncontrolling interest restructuring
(2)
(0.9)
(0.3)
-
(0.2)
(1.4)
Stock-based compensation
(3)
2.5
2.7
2.2
2.4
9.8
Other
(4)
1.3
-
-
-
1.3
Adjusted EBITDA
$ 66.6
$ 83.2
$ 74.1
$ 69.8
$ 293.7
Sales
$ 695.7
$ 765.3
$ 734.5
$ 684.0
$ 2,879.5
Adjusted EBITDA as a percent of Sales
10.2% |
 45
TOP 30 / TOP 5
EBITDA and Adjusted EBITDA –
Nine Months Ended September 30, 2013
Note: Numbers subject to rounding
(1)
Includes noncash restructuring.
(2)
Proportionate share of restructuring costs related to Cooper Standard France joint
venture. (3)
Non-cash stock amortization expense and non-cash stock option expense for grants
issued at time of the Company’s 2010 reorganization. (4)
Write-up of inventory to fair value for the Jyco acquisition
(5)
Costs incurred in relation to the Jyco acquisition
($ USD Millions)
Three Months Ended
Nine Months
Ended
Mar 31,
Jun 31,
Sep 30,
Sep 30,
2013
2013
2013
2013
Net income
$ 20.7
$ 27.4
$ 20.6
$ 68.7
Income tax expense
7.9
12.2
4.5
24.6
Interest expense, net of interest income
11.2
13.6
15.2
40.0
Depreciation and amortization
29.8
28.2
25.2
83.2
EBITDA
$ 69.6
$ 65.5
$ 216.5
Restructuring
(1)
4.8
1.0
1.9
7.7
Noncontrolling
interest restructuring
(2)
(0.7)
(0.1)
-
(0.8)
Stock-based compensation
(3)
2.7
0.5
1.1
4.3
Inventory write-
up
(4)
-
-
0.3
0.3
Acquisition costs
(5)
-
-
0.7
0.7
Others
0.3
(0.3)
-
-
Adjusted EBITDA
$ 76.7
$ 82.5
$ 69.5
$ 228.7
Sales
747.6
784.7
764.1
2,296.3
Adjusted EBITDA as a percent of Sales
10.3%
10.5%
9.1%
10.0%
$ 81.4 |
 46
TOP 30 / TOP 5
EBITDA and Adjusted EBITDA –
Nine Months Ended September 30, 2012
Note: Numbers subject to rounding
(1)
Includes cash and noncash restructuring.
(2)
Proportionate share of restructuring costs related to Cooper Standard France joint
venture. (3)
Non-cash stock amortization expense and non-cash stock option expense for grants
issued at time of the Company’s 2010 reorganization. ($ USD Millions)
Three Months Ended
Nine Months
Ended
Mar 31,
Jun 31,
Sep 30,
Sep 30,
2012
2012
2012
2012
Net income
$ 23.8
$ 77.3
$ 11.6
$ 112.7
Income tax expense (benefit)
8.1
(46.2)
5.4
(32.8)
Interest expense, net of interest income
11.2
10.8
11.3
33.3
Depreciation and amortization
31.6
30.5
29.1
91.2
EBITDA
74.7
72.4
57.4
204.4
Restructuring
(1)
6.1
(0.5)
10.2
15.8
Noncontrolling
interest restructuring
(2)
(0.3)
-
(0.2)
(0.5)
Stock-based compensation
(3)
2.7
2.2
2.4
7.4
Adjusted EBITDA
$ 83.2
$ 74.1
$ 69.8
$ 227.1
Sales
$ 765.3
$ 734.5
$ 684.0
$ 2,183.8
Adjusted EBITDA as a percent of Sales
10.9%
10.1%
10.2%
10.4% |