Attached files
| file | filename |
|---|---|
| 8-K - FORM 8-K - BlueLinx Holdings Inc. | t77695_8k.htm |
| EX-99.1 - EXHIBIT 99.1 - BlueLinx Holdings Inc. | ex99-1.htm |
BlueLinx Quarterly Review 3rd Quarter 2013
Slide 2 BlueLinx Holdings Inc. Forward - Looking Statement Safe Harbor - This presentation includes "forward - looking statements" within the meaning of the Private Securities Litigation Reform Act of 1995 . All of these forward - looking statements are based on estimates and assumptions made by our management that, although believed by us to be reasonable, are inherently uncertain . Forward - looking statements involve risks and uncertainties, including, but not limited to, economic, competitive, governmental and technological factors outside of our control, that may cause our business, strategy or actual results to differ materially from the forward - looking statements . These risks and uncertainties may include, among other things : changes in the supply and/or demand for products which we distribute, especially as a result of conditions in the residential housing market ; general economic and business conditions in the United States ; the activities of competitors ; changes in significant operating expenses ; changes in the availability of capital ; the ability to identify acquisition opportunities and effectively and cost - efficiently integrate acquisitions ; adverse weather patterns or conditions ; acts of war or terrorist activities ; variations in the performance of the financial markets ; and other factors described in the "Risk Factors" section in our Annual Report on Form 10 - K for the fiscal year ended December 29 , 2012 , and in our other periodic reports filed with the SEC . In addition, the statements in this presentation are made as of October 30 , 2013 . We undertake no obligation to update any of the forward - looking statements made herein, whether as a result of new information, future events, changes in expectation or otherwise . These forward - looking statements should not be relied upon as representing our views as of any date subsequent to October 30 , 2013 . Use of Non - GAAP and Adjusted Financial Information - To supplement GAAP financial information, we use adjusted measures of operating results which are non - GAAP measures . This non - GAAP adjusted financial information is provided as additional information for investors . These adjusted results exclude certain costs, expenses, gains and losses, and we believe their exclusion can enhance an overall understanding of our past financial performance and also our prospects for the future . These adjustments to our GAAP results are made with the intent of providing both management and investors a more complete understanding of our operating performance by excluding non - recurring, infrequent or other non - cash charges that are not believed to be material to the ongoing performance of our business . The presentation of this additional information is not meant to be considered in isolation or as a substitute for GAAP measures of net earnings, diluted earnings per share or net cash provided by (used in) operating activities prepared in accordance with generally accepted accounting principles in the United States .
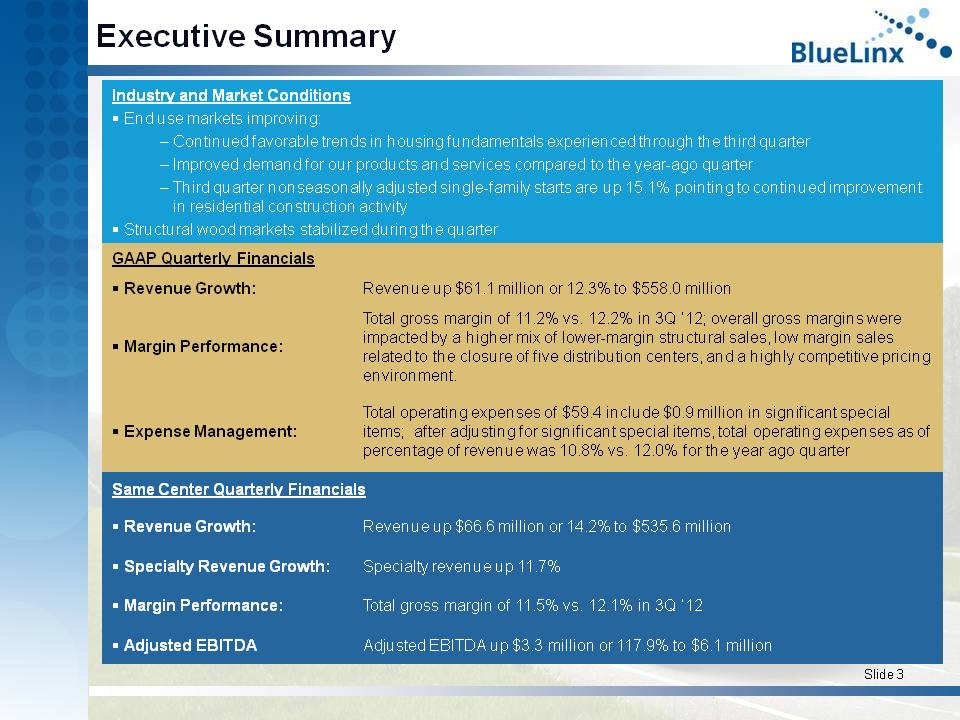
Slide 3 Executive Summary Industry and Market Conditions ▪ End use markets improving: – Continued favorable trends in housing fundamentals experienced through the third quarter – Improved demand for our products and services compared to the year - ago quarter – Third quarter nonseasonally adjusted single - family starts are up 15.1% pointing to continued improvement in residential construction activity ▪ Structural wood markets stabilized during the quarter GAAP Quarterly Financials ▪ Revenue Growth: Revenue up $61.1 million or 12.3% to $558.0 million ▪ Margin Performance: Total gross margin of 11.2% vs. 12.2% in 3Q ’12; overall gross margins were impacted by a higher mix of lower - margin structural sales, low margin sales related to the closure of five distribution centers, and a highly competitive pricing environment. ▪ Expense Management: Total operating expenses of $59.4 include $0.9 million in significant special items; after adjusting for significant special items, total operating expenses as of percentage of revenue was 10.8% vs. 12.0% for the year ago quarter Same Center Quarterly Financials ▪ Revenue Growth: Revenue up $66.6 million or 14.2% to $535.6 million ▪ Specialty Revenue Growth: Specialty revenue up 11.7% ▪ Margin Performance: Total gross margin of 11.5% vs. 12.1% in 3Q ’12 ▪ Adjusted EBITDA Adjusted EBITDA up $3.3 million or 117.9% to $6.1 million

Slide 4 Doug Goforth Chief Financial Officer and Treasurer Quarterly Review
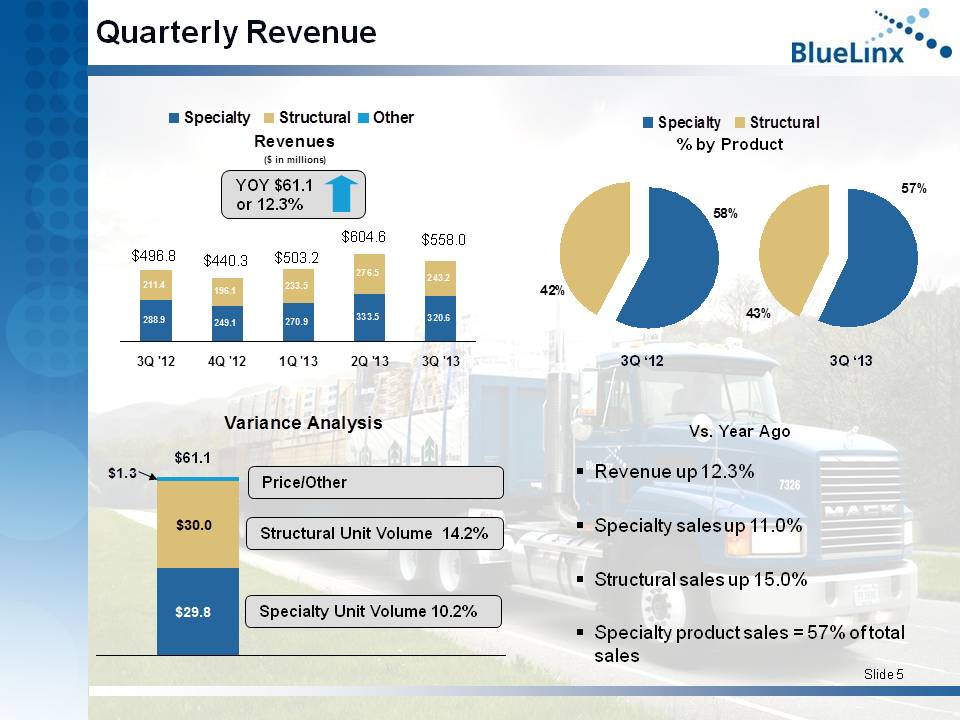
Slide 5 Quarterly Revenue Revenues ($ in millions) 249.1 270.9 333.5 211.4 196.1 233.5 276.5 243.2 288.9 320.6 3Q '12 4Q '12 1Q '13 2Q '13 3Q '13 Variance Analysis $29.8 $30.0 $1.3 Specialty Unit Volume 10.2% YOY $61.1 or 12.3% Structural Unit Volume 14.2% Price/Other $61.1 43% 57% 3Q ‘12 3Q ‘13 58% 42% Vs. Year Ago ▪ Revenue up 12.3% ▪ Specialty sales up 11.0% ▪ Structural sales up 15.0% ▪ Specialty product sales = 57% of total sales % by Product Revenues ($ in millions) 233.1 286.0 264.3 171.0 203.7 265.4 213.9 154.8 206.2 221.4 4Q '09 1Q '10 2Q '10 3Q '10 4Q '10 Specialty Structural Other $367 $366. $431 $540. $464. Revenues ($ in millions) 233.1 286.0 264.3 171.0 203.7 265.4 213.9 154.8 206.2 221.4 4Q '09 1Q '10 2Q '10 3Q '10 4Q '10 Specialty Structural Other $367 $366. $431 $540. $464. $604.6 $558.0 $496.8 $440.3 $503.2
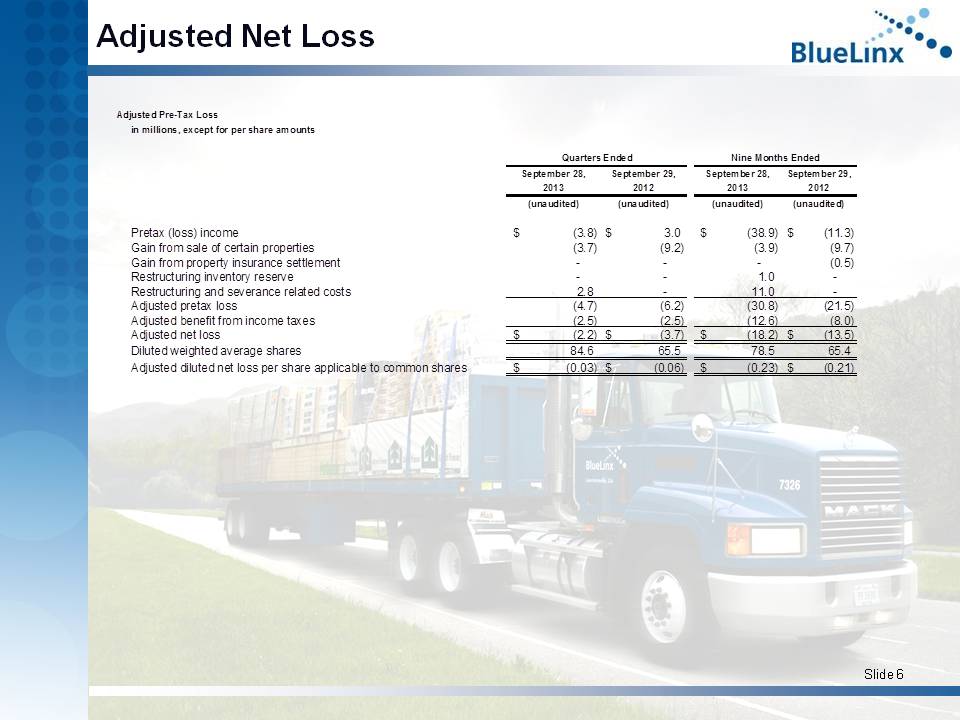
Slide 6 Adjusted Net Loss Adjusted Pre-Tax Loss in millions, except for per share amounts September 28, September 29, September 28, September 29, 2013 2012 2013 2012 (unaudited) (unaudited) (unaudited) (unaudited) Pretax (loss) income (3.8)$ 3.0$ (38.9)$ (11.3)$ Gain from sale of certain properties (3.7) (9.2) (3.9) (9.7) Gain from property insurance settlement - - - (0.5) Restructuring inventory reserve - - 1.0 - Restructuring and severance related costs 2.8 - 11.0 - Adjusted pretax loss (4.7) (6.2) (30.8) (21.5) Adjusted benefit from income taxes (2.5) (2.5) (12.6) (8.0) Adjusted net loss (2.2)$ (3.7)$ (18.2)$ (13.5)$ Diluted weighted average shares 84.6 65.5 78.5 65.4 Adjusted diluted net loss per share applicable to common shares (0.03)$ (0.06)$ (0.23)$ (0.21)$ Quarters Ended Nine Months Ended
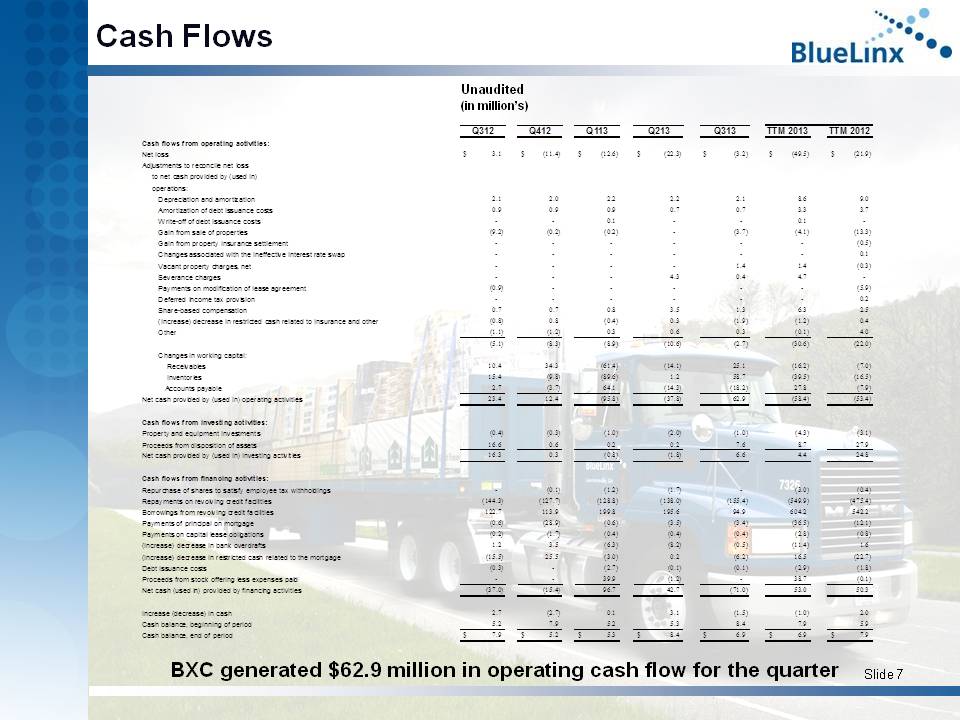
Slide 7 Cash Flows BXC generated $64.7 million in operating cash flow for the quarter Unaudited (in million’s) Q312 Q412 Q113 Q213 Q313 TTM 2013 TTM 2012 Cash flows from operating activities: Net loss 3.1$ (11.4)$ (12.6)$ (22.3)$ (3.2)$ (49.5)$ (21.9)$ Adjustments to reconcile net loss to net cash provided by (used in) operations: Depreciation and amortization 2.1 2.0 2.2 2.2 2.1 8.6 9.0 Amortization of debt issuance costs 0.9 0.9 0.9 0.7 0.7 3.3 3.7 Write-off of debt issuance costs - - 0.1 - - 0.1 - Gain from sale of properties (9.2) (0.2) (0.2) - (3.7) (4.1) (13.3) Gain from property insurance settlement - - - - - - (0.5) Changes associated with the ineffective interest rate swap - - - - - - 0.1 Vacant property charges, net - - - - 1.4 1.4 (0.3) Severance charges - - - 4.3 0.4 4.7 - Payments on modification of lease agreement (0.9) - - - - - (5.9) Deferred income tax provision - - - - - - 0.2 Share-based compensation 0.7 0.7 0.8 3.5 1.3 6.3 2.5 (Increase) decrease in restricted cash related to insurance and other (0.8) 0.8 (0.4) 0.3 (0.1) 0.6 0.4 Other (1.1) (1.2) 0.3 0.6 0.3 (0.1) 4.0 (5.1) (8.3) (8.9) (10.6) (0.9) (28.8) (22.0) Changes in working capital: Receivables 10.4 34.3 (61.4) (14.1) 25.1 (16.2) (7.0) Inventories 15.4 (9.8) (89.6) 1.2 58.7 (39.5) (16.5) Accounts payable 2.7 (3.7) 64.1 (14.3) (18.2) 27.8 (7.9) Net cash provided by (used in) operating activities 23.4 12.4 (95.8) (37.8) 64.7 (56.6) (53.4) Cash flows from investing activities: Property and equipment investments (0.4) (0.3) (1.0) (2.0) (1.0) (4.3) (3.1) Proceeds from disposition of assets 16.6 0.6 0.2 0.2 7.6 8.7 27.9 Net cash provided by (used in) investing activities 16.3 0.3 (0.8) (1.8) 6.6 4.4 24.8 Cash flows from financing activities: Repurchase of shares to satisfy employee tax withholdings - (0.1) (1.2) (1.7) - (3.0) (0.4) Repayments on revolving credit facilities (144.3) (127.7) (128.8) (138.0) (155.4) (549.9) (475.4) Borrowings from revolving credit facilities 122.7 113.9 199.8 195.6 94.9 604.2 542.2 Payments of principal on mortgage (0.6) (28.9) (0.6) (3.5) (3.4) (36.5) (12.1) Payments on capital lease obligations (0.2) (1.7) (0.4) (0.4) (0.4) (2.8) (0.8) (Increase) decrease in bank overdrafts 1.2 3.5 (6.3) (8.2) (0.5) (11.4) 1.6 (Increase) decrease in restricted cash related to the mortgage (15.5) 25.5 (3.0) 0.2 (8.0) 14.7 (22.7) Debt issuance costs (0.3) - (2.7) (0.1) (0.1) (2.9) (1.8) Proceeds from stock offering less expenses paid - - 39.9 (1.2) - 38.7 (0.1) Net cash (used in) provided by financing activities (37.0) (15.4) 96.7 42.7 (72.8) 51.2 50.3 Increase (decrease) in cash 2.7 (2.7) 0.1 3.1 (1.5) (1.0) 2.0 Cash balance, beginning of period 5.2 7.9 5.2 5.3 8.4 7.9 5.9 Cash balance, end of period 7.9$ 5.2$ 5.3$ 8.4$ 6.9$ 6.9$ 7.9$
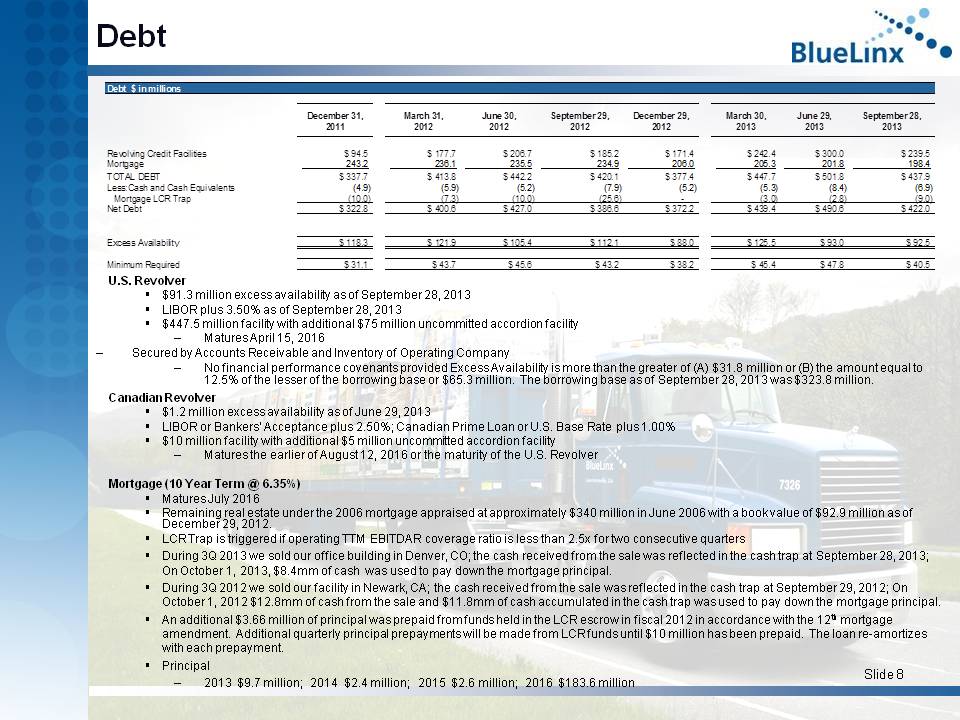
Slide 8 Debt U.S. Revolver ▪ $91.3 million excess availability as of September 28, 2013 ▪ LIBOR plus 3.50% as of September 28, 2013 ▪ $447.5 million facility with additional $75 million uncommitted accordion facility – Matures April 15, 2016 – Secured by Accounts Receivable and Inventory of Operating Company – No financial performance covenants provided Excess Availability is more than the greater of (A) $31.8 million or (B) the amou nt equal to 12.5% of the lesser of the borrowing base or $65.3 million. The borrowing base as of September 28, 2013 was $323.8 million. Canadian Revolver ▪ $1.2 million excess availability as of June 29, 2013 ▪ LIBOR or Bankers’ Acceptance plus 2.50%; Canadian Prime Loan or U.S. Base Rate plus 1.00% ▪ $10 million facility with additional $5 million uncommitted accordion facility – Matures the earlier of August 12, 2016 or the maturity of the U.S. Revolver Mortgage (10 Year Term @ 6.35%) ▪ Matures July 2016 ▪ Remaining real estate under the 2006 mortgage appraised at approximately $340 million in June 2006 with a book value of $92.9 mi llion as of December 29, 2012. ▪ LCR Trap is triggered if operating TTM EBITDAR coverage ratio is less than 2.5x for two consecutive quarters ▪ During 3Q 2013 we sold our office building in Denver, CO; the cash received from the sale was reflected in the cash trap at S ept ember 28, 2013; On October 1, 2013, $8.4mm of cash was used to pay down the mortgage principal. ▪ During 3Q 2012 we sold our facility in Newark, CA; the cash received from the sale was reflected in the cash trap at Septembe r 2 9, 2012; On October 1, 2012 $12.8mm of cash from the sale and $11.8mm of cash accumulated in the cash trap was used to pay down the mortg age principal. ▪ An additional $3.66 million of principal was prepaid from funds held in the LCR escrow in fiscal 2012 in accordance with the 12 th mortgage amendment. Additional quarterly principal prepayments will be made from LCR funds until $10 million has been prepaid. The l oan re - amortizes with each prepayment. ▪ Principal – 2013 $9.7 million; 2014 $2.4 million; 2015 $2.6 million; 2016 $183.6 million Debt $ in millions December 31, 2011 March 31, 2012 June 30, 2012 September 29, 2012 December 29, 2012 March 30, 2013 June 29, 2013 September 28, 2013 Revolving Credit Facilities $ 94.5 $ 177.7 $ 206.7 $ 185.2 $ 171.4 $ 242.4 $ 300.0 $ 239.5 Mortgage 243.2 236.1 235.5 234.9 206.0 205.3 201.8 198.4 TOTAL DEBT $ 337.7 $ 413.8 $ 442.2 $ 420.1 $ 377.4 $ 447.7 $ 501.8 $ 437.9 Less:Cash and Cash Equivalents (4.9) (5.9) (5.2) (7.9) (5.2) (5.3) (8.4) (6.9) Mortgage LCR Trap (10.0) (7.3) (10.0) (25.6) - (3.0) (2.8) (10.8) Net Debt $ 322.8 $ 400.6 $ 427.0 $ 386.6 $ 372.2 $ 439.4 $ 490.6 $ 420.2 Excess Availability $ 118.3 $ 121.9 $ 105.4 $ 112.1 $ 88.0 $ 125.5 $ 93.0 $ 92.5 Minimum Required $ 31.1 $ 43.7 $ 45.6 $ 43.2 $ 38.2 $ 45.4 $ 47.8 $ 40.5
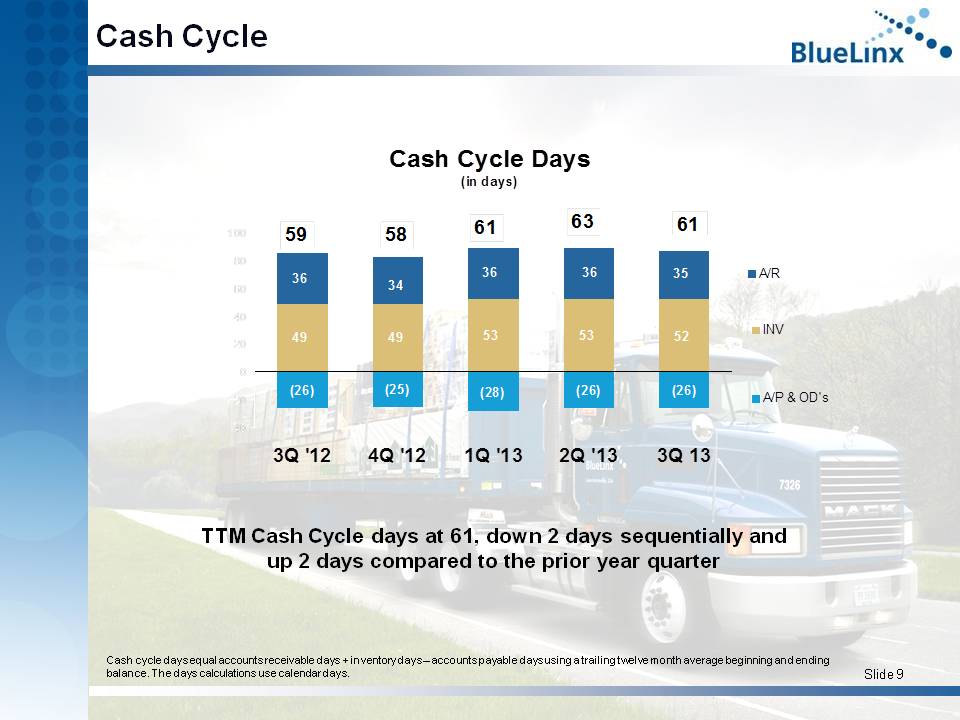
Slide 9 Cash Cycle TTM Cash Cycle days at 61, down 2 days sequentially and up 2 days compared to the prior year quarter Cash Cycle Days (in days) 49 49 53 53 52 (26) (25) (28) (26) (26) 36 34 36 36 35 -40 -20 0 20 40 60 80 100 3Q '12 4Q '12 1Q '13 2Q '13 3Q 13 58 59 63 61 61 Cash cycle days equal accounts receivable days + inventory days – accounts payable days using a trailing twelve month average be ginning and ending balance. The days calculations use calendar days. Cash Cycle Days (in days) 48 50 49 48 49 (28) (28) (27) (26) (28) 35 36 36 34 36 -40 -20 0 20 40 60 80 100 A/P & OD's A/R INV 58 5 8 5 7 55 5 6 Cash Cycle Days (in days) 48 50 49 48 49 (28) (28) (27) (26) (28) 35 36 36 34 36 -40 -20 0 20 40 60 80 100 A/P & OD's A/R INV 58 5 8 5 7 55 5 6 Cash Cycle Days (in days) 48 50 49 48 49 (28) (28) (27) (26) (28) 35 36 36 34 36 -40 -20 0 20 40 60 80 100 A/P & OD's A/R INV 58 5 8 5 7 55 5 6

Slide 10 Howard Cohen Executive Chairman
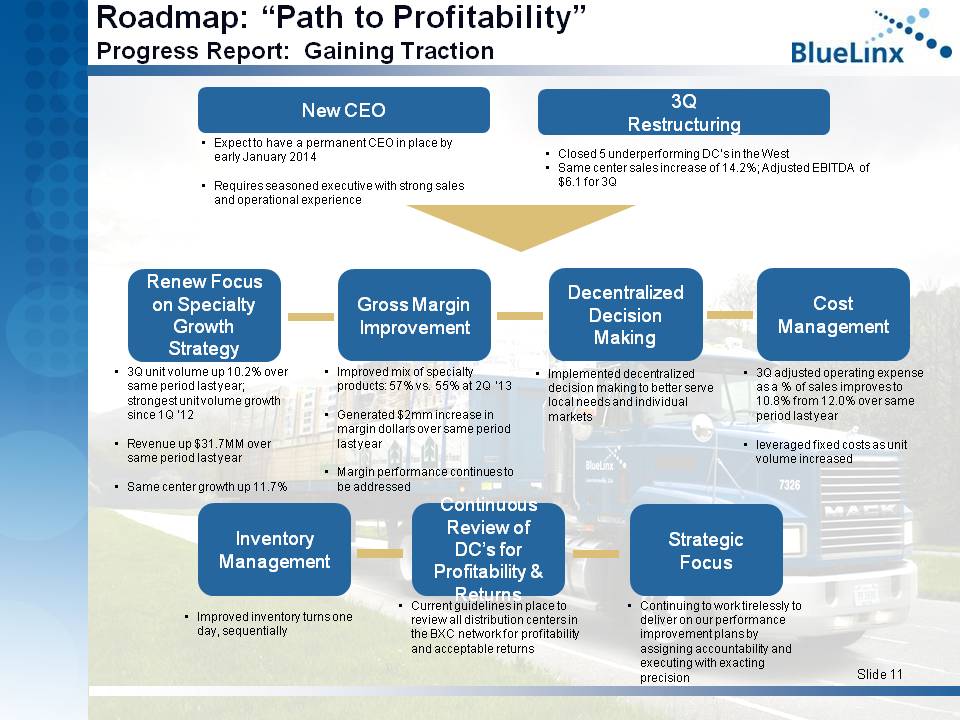
Slide 11 Roadmap: “Path to Profitability” Progress Report: Gaining Traction New CEO • Expect to have a permanent CEO in place by early January 2014 • Requires seasoned executive with strong sales and operational experience 3Q Restructuring • Closed 5 underperforming DC’s in the West • Same center sales increase of 14.2%; Adjusted EBITDA of $6.1 for 3Q Renew Focus on Specialty Growth Strategy • 3Q unit volume up 10.2% over same period last year; strongest unit volume growth since 1Q ’12 • Revenue up $31.7MM over same period last year • Same center growth up 11.7% Gross Margin Improvement • Improved mix of specialty products: 57% vs. 55% at 2Q ‘13 • Generated $2mm increase in margin dollars over same period last year • Margin performance continues to be addressed Decentralized Decision Making • Implemented decentralized decision making to better serve local needs and individual markets Cost Management • 3Q adjusted operating expense as a % of sales improves to 10.8% from 12.0% over same period last year • leveraged fixed costs as unit volume increased Inventory Management • Improved inventory turns one day, sequentially Continuous Review of DC’s for Profitability & Returns • Current guidelines in place to review all distribution centers in the BXC network for profitability and acceptable returns Strategic Focus • Continuing to work tirelessly to deliver on our performance improvement plans by assigning accountability and executing with exacting precision
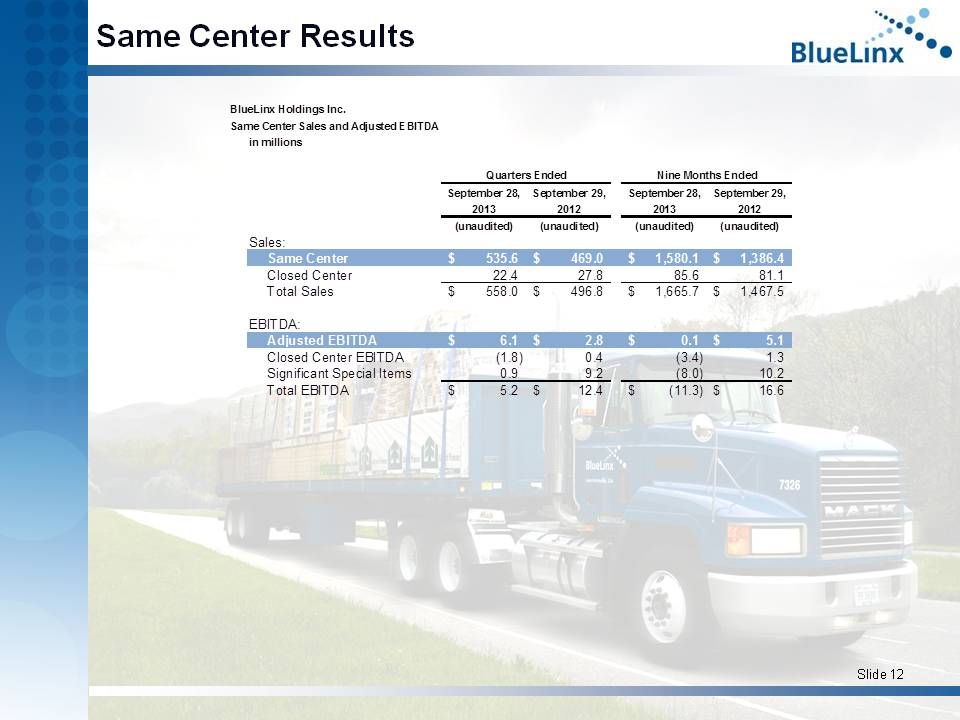
Slide 12 Same Center Results BlueLinx Holdings Inc. Same Center Sales and Adjusted EBITDA in millions September 28, September 29, September 28, September 29, 2013 2012 2013 2012 (unaudited) (unaudited) (unaudited) (unaudited) Sales: Same Center 535.6$ 469.0$ 1,580.1$ 1,386.4$ Closed Center 22.4 27.8 85.6 81.1 Total Sales 558.0$ 496.8$ 1,665.7$ 1,467.5$ EBITDA: Adjusted EBITDA 6.1$ 2.8$ 0.1$ 5.1$ Closed Center EBITDA (1.8) 0.4 (3.4) 1.3 Significant Special Items 0.9 9.2 (8.0) 10.2 Total EBITDA 5.2$ 12.4$ (11.3)$ 16.6$ Quarters Ended Nine Months Ended
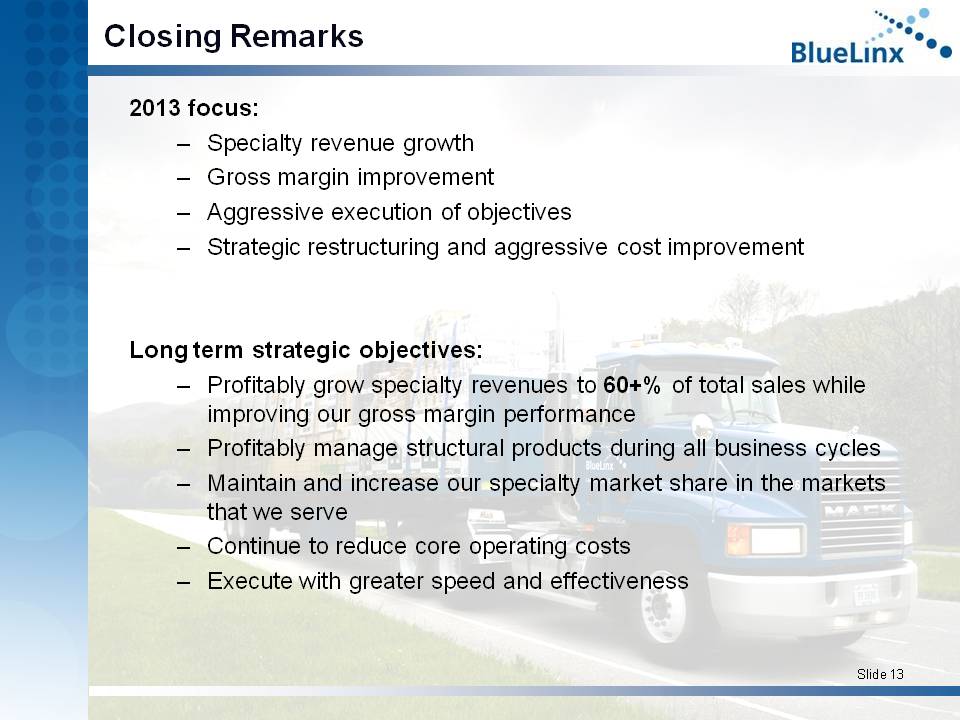
Slide 13 Closing Remarks 2013 focus: – Specialty revenue growth – Gross margin improvement – Aggressive execution of objectives – Strategic restructuring and aggressive cost improvement Long term strategic objectives: – Profitably grow specialty revenues to 60+% of total sales while improving our gross margin performance – Profitably manage structural products during all business cycles – Maintain and increase our specialty market share in the markets that we serve – Continue to reduce core operating costs – Execute with greater speed and effectiveness
Slide 14 Appendix TOPIC PAGE Profit and Loss Statement by Quarter 15 Revenues by Quarter 16 Channel Mix Analysis 17 Unit Volume by Quarter 18 Gross Margin by Quarter 19 Operating Expense by Quarter 20 Structural Product Price Trends 21 Reconciliation of GAAP Debt to Non - GAAP Net Debt 22 Reconciliation of GAAP Net cash used in operating activities to Non - GAAP EBITDA 23 Reconciliation of GAAP Net Loss to Adjusted Net Loss 24
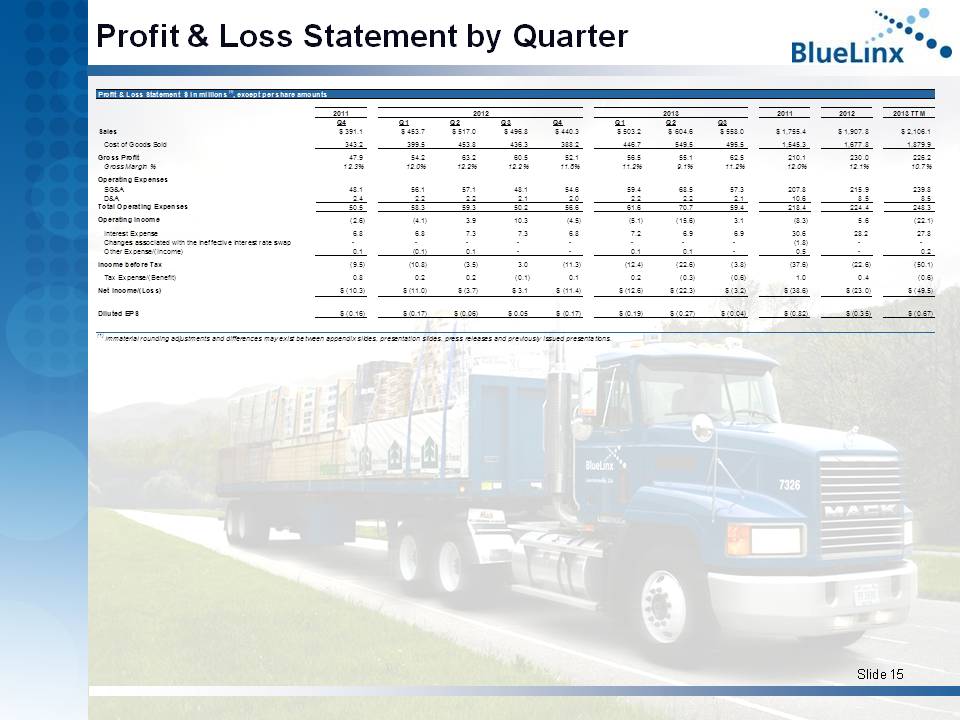
Slide 15 Profit & Loss Statement by Quarter Profit & Loss Statement $ in millions (1) , except per share amounts 2011 2012 2013 TTM Q4 Q1 Q2 Q3 Q4 Q1 Q2 Q3 Sales $ 391.1 $ 453.7 $ 517.0 $ 496.8 $ 440.3 $ 503.2 $ 604.6 $ 558.0 $ 1,755.4 $ 1,907.8 $ 2,106.1 Cost of Goods Sold 343.2 399.5 453.8 436.3 388.2 446.7 549.5 495.5 1,545.3 1,677.8 1,879.9 Gross Profit 47.9 54.2 63.2 60.5 52.1 56.5 55.1 62.5 210.1 230.0 226.2 Gross Margin % 12.3% 12.0% 12.2% 12.2% 11.8% 11.2% 9.1% 11.2% 12.0% 12.1% 10.7% Operating Expenses SG&A 48.1 56.1 57.1 48.1 54.6 59.4 68.5 57.3 207.8 215.9 239.8 D&A 2.4 2.2 2.2 2.1 2.0 2.2 2.2 2.1 10.6 8.5 8.5 Total Operating Expenses 50.5 58.3 59.3 50.2 56.6 61.6 70.7 59.4 218.4 224.4 248.3 Operating Income (2.6) (4.1) 3.9 10.3 (4.5) (5.1) (15.6) 3.1 (8.3) 5.6 (22.1) Interest Expense 6.8 6.8 7.3 7.3 6.8 7.2 6.9 6.9 30.6 28.2 27.8 Changes associated with the ineffective interest rate swap - - - - - - - - (1.8) - - Other Expense/(Income) 0.1 (0.1) 0.1 - - 0.1 0.1 - 0.5 - 0.2 Income before Tax (9.5) (10.8) (3.5) 3.0 (11.3) (12.4) (22.6) (3.8) (37.6) (22.6) (50.1) Tax Expense/(Benefit) 0.8 0.2 0.2 (0.1) 0.1 0.2 (0.3) (0.6) 1.0 0.4 (0.6) Net Income/(Loss) $ (10.3) $ (11.0) $ (3.7) $ 3.1 $ (11.4) $ (12.6) $ (22.3) $ (3.2) $ (38.6) $ (23.0) $ (49.5) Diluted EPS $ (0.16) $ (0.17) $ (0.06) $ 0.05 $ (0.17) $ (0.19) $ (0.27) $ (0.04) $ (0.82) $ (0.35) $ (0.67) (1) Immaterial rounding adjustments and differences may exist between appendix slides, presentation slides, press releases and previously issued presentations. 201320122011
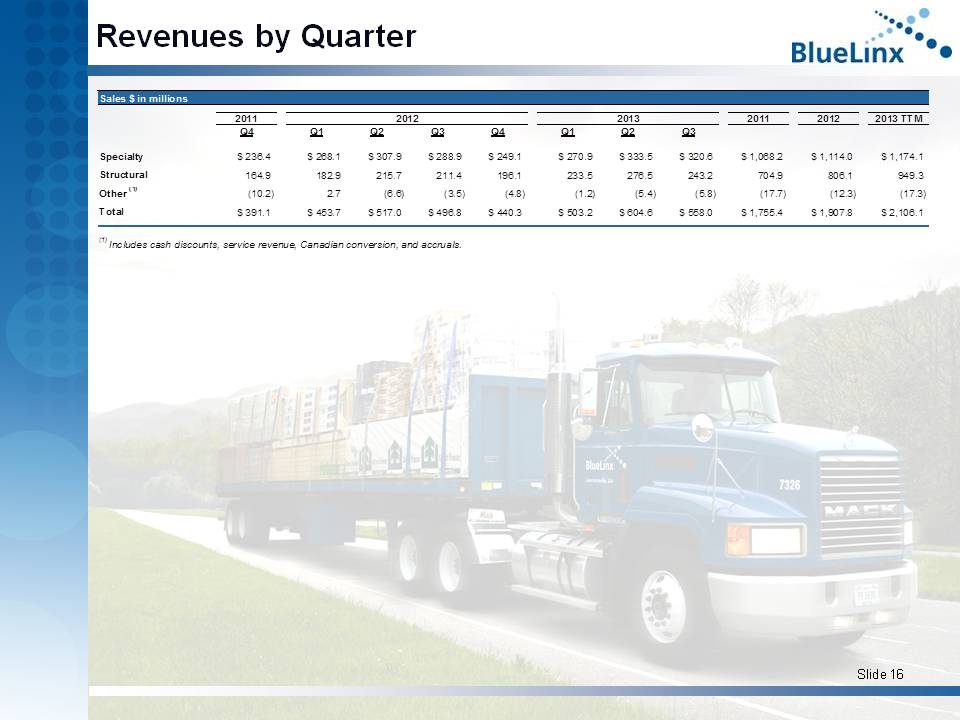
Slide 16 Revenues by Quarter Sales $ in millions 2011 2012 2013 TTM Q4 Q1 Q2 Q3 Q4 Q1 Q2 Q3 Specialty $ 236.4 $ 268.1 $ 307.9 $ 288.9 $ 249.1 $ 270.9 $ 333.5 $ 320.6 $ 1,068.2 $ 1,114.0 $ 1,174.1 Structural 164.9 182.9 215.7 211.4 196.1 233.5 276.5 243.2 704.9 806.1 949.3 Other (1) (10.2) 2.7 (6.6) (3.5) (4.8) (1.2) (5.4) (5.8) (17.7) (12.3) (17.3) Total $ 391.1 $ 453.7 $ 517.0 $ 496.8 $ 440.3 $ 503.2 $ 604.6 $ 558.0 $ 1,755.4 $ 1,907.8 $ 2,106.1 (1) Includes cash discounts, service revenue, Canadian conversion, and accruals. 201320122011
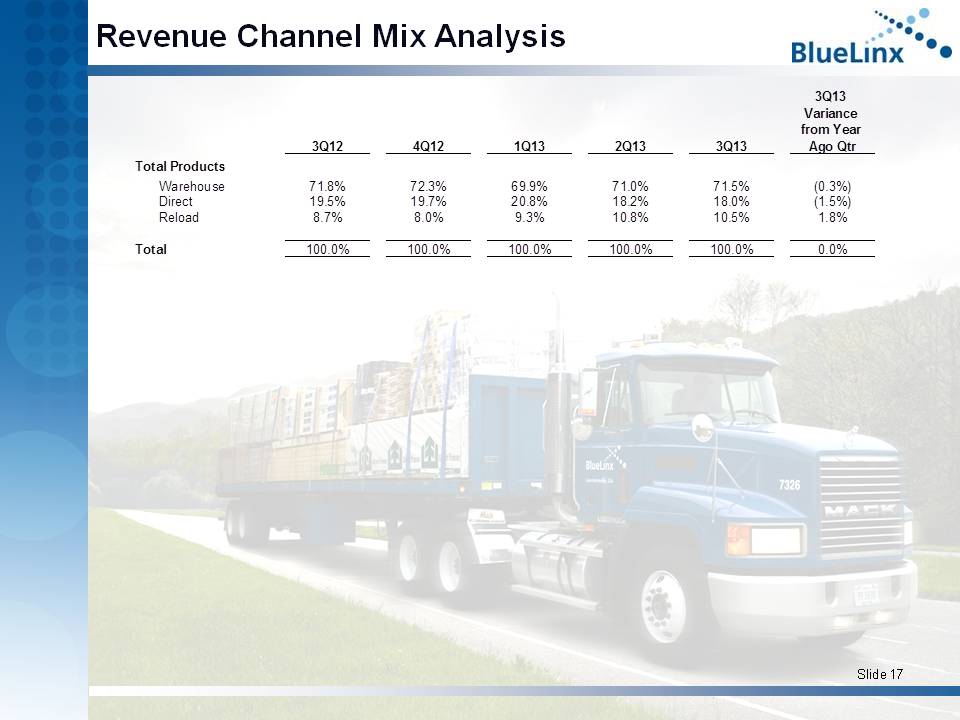
Slide 17 Revenue Channel Mix Analysis 3Q12 4Q12 1Q13 2Q13 3Q13 3Q13 Variance from Year Ago Qtr Total Products Warehouse 71.8% 72.3% 69.9% 71.0% 71.5% (0.3%) Direct 19.5% 19.7% 20.8% 18.2% 18.0% (1.5%) Reload 8.7% 8.0% 9.3% 10.8% 10.5% 1.8% Total 100.0% 100.0% 100.0% 100.0% 100.0% 0.0%
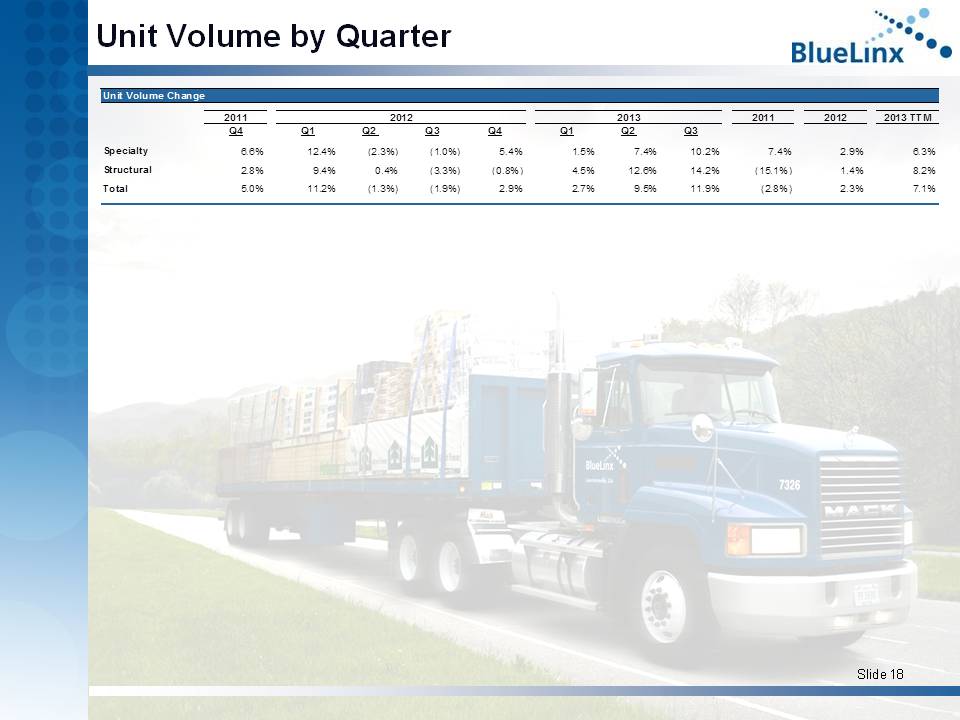
Slide 18 Unit Volume by Quarter 2011 2012 2013 TTM Q4 Q1 Q2 Q3 Q4 Q1 Q2 Q3 Specialty 6.6% 12.4% (2.3%) (1.0%) 5.4% 1.5% 7.4% 10.2% 7.4% 2.9% 6.3% Structural 2.8% 9.4% 0.4% (3.3%) (0.8%) 4.5% 12.6% 14.2% (15.1%) 1.4% 8.2% Total 5.0% 11.2% (1.3%) (1.9%) 2.9% 2.7% 9.5% 11.9% (2.8%) 2.3% 7.1% 2011 Unit Volume Change 2012 2013
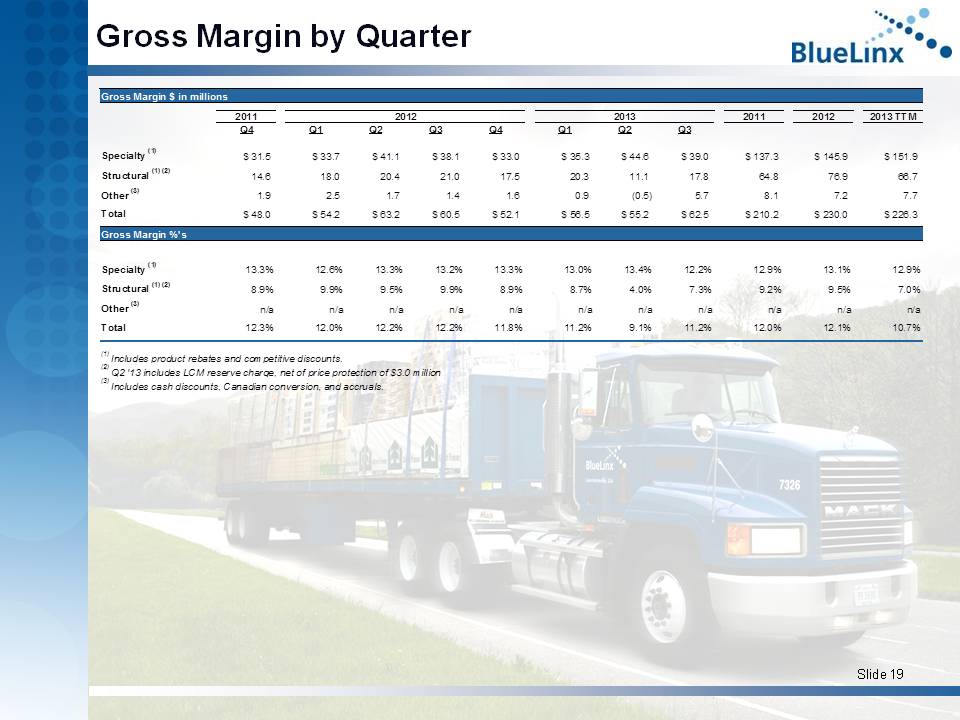
Slide 19 Gross Margin by Quarter Gross Margin $ in millions 2011 2012 2013 TTM Q4 Q1 Q2 Q3 Q4 Q1 Q2 Q3 Specialty (1) $ 31.5 $ 33.7 $ 41.1 $ 38.1 $ 33.0 $ 35.3 $ 44.6 $ 39.0 $ 137.3 $ 145.9 $ 151.9 Structural (1) (2) 14.6 18.0 20.4 21.0 17.5 20.3 11.1 17.8 64.8 76.9 66.7 Other (3) 1.9 2.5 1.7 1.4 1.6 0.9 (0.5) 5.7 8.1 7.2 7.7 Total $ 48.0 $ 54.2 $ 63.2 $ 60.5 $ 52.1 $ 56.5 $ 55.2 $ 62.5 $ 210.2 $ 230.0 $ 226.3 Gross Margin %'s Specialty (1) 13.3% 12.6% 13.3% 13.2% 13.3% 13.0% 13.4% 12.2% 12.9% 13.1% 12.9% Structural (1) (2) 8.9% 9.9% 9.5% 9.9% 8.9% 8.7% 4.0% 7.3% 9.2% 9.5% 7.0% Other (3) n/a n/a n/a n/a n/a n/a n/a n/a n/a n/a n/a Total 12.3% 12.0% 12.2% 12.2% 11.8% 11.2% 9.1% 11.2% 12.0% 12.1% 10.7% (1) Includes product rebates and competitive discounts. (2) Q2 '13 includes LCM reserve charge, net of price protection of $3.0 million (3) Includes cash discounts, Canadian conversion, and accruals. 2011 2012 2013
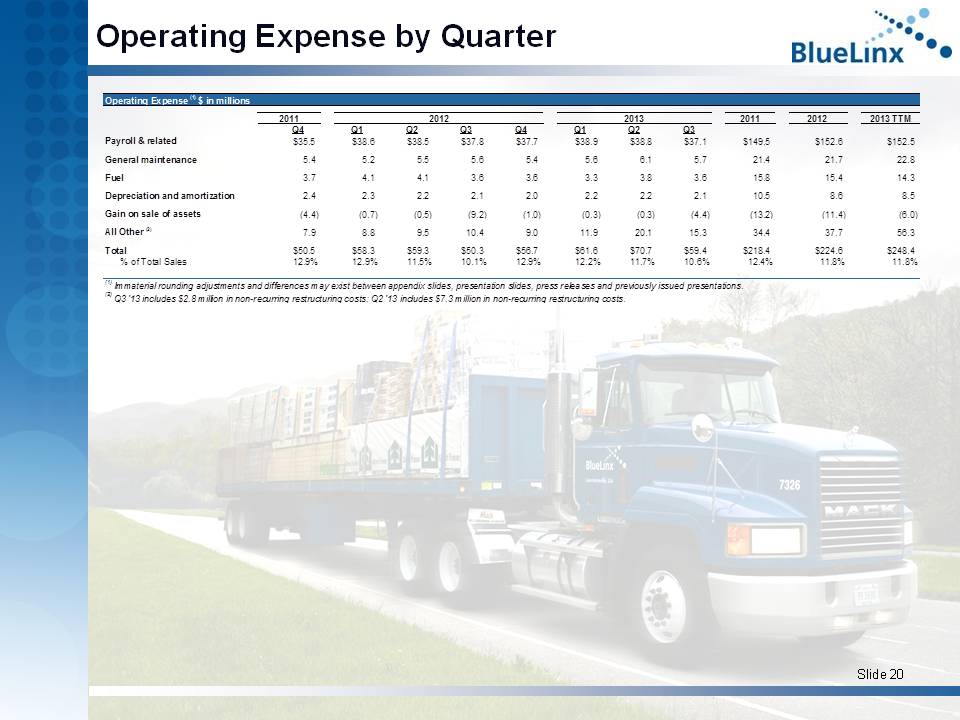
Slide 20 Operating Expense by Quarter Operating Expense (1) $ in millions 2011 2012 2013 TTM Q4 Q1 Q2 Q3 Q4 Q1 Q2 Q3 Payroll & related $35.5 $38.6 $38.5 $37.8 $37.7 $38.9 $38.8 $37.1 $149.5 $152.6 $152.5 General maintenance 5.4 5.2 5.5 5.6 5.4 5.6 6.1 5.7 21.4 21.7 22.8 Fuel 3.7 4.1 4.1 3.6 3.6 3.3 3.8 3.6 15.8 15.4 14.3 Depreciation and amortization 2.4 2.3 2.2 2.1 2.0 2.2 2.2 2.1 10.5 8.6 8.5 Gain on sale of assets (4.4) (0.7) (0.5) (9.2) (1.0) (0.3) (0.3) (4.4) (13.2) (11.4) (6.0) All Other (2) 7.9 8.8 9.5 10.4 9.0 11.9 20.1 15.3 34.4 37.7 56.3 Total $50.5 $58.3 $59.3 $50.3 $56.7 $61.6 $70.7 $59.4 $218.4 $224.6 $248.4 % of Total Sales 12.9% 12.9% 11.5% 10.1% 12.9% 12.2% 11.7% 10.6% 12.4% 11.8% 11.8% (1) Immaterial rounding adjustments and differences may exist between appendix slides, presentation slides, press releases and previously issued presentations. (2) Q3 '13 includes $2.8 million in non-recurring restructuring costs; Q2 '13 includes $7.3 million in non-recurring restructuring costs. 20132011 2012
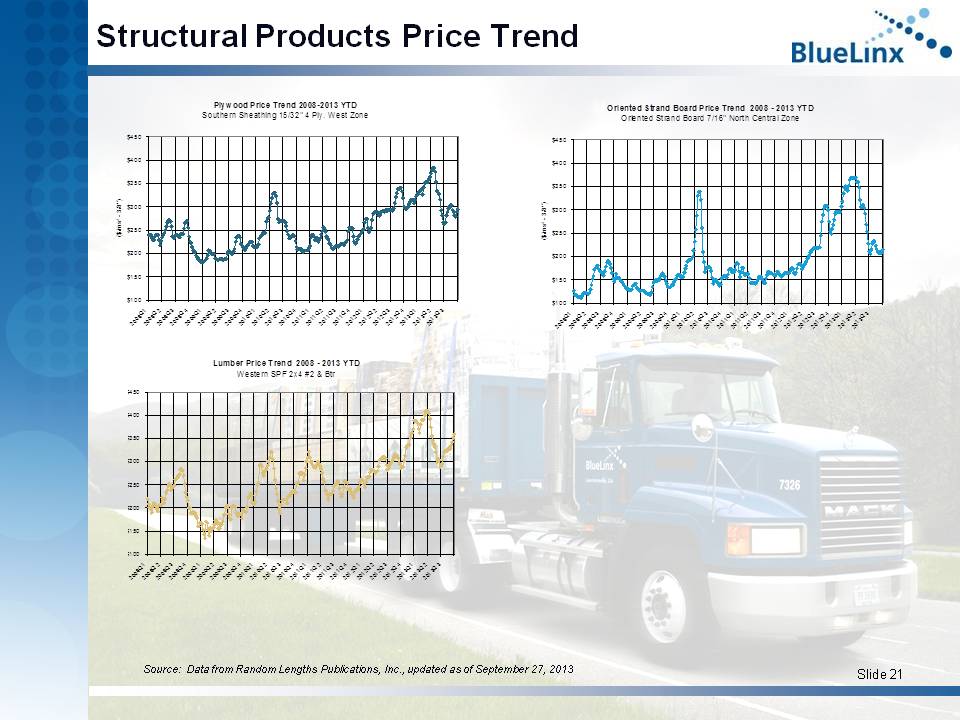
Slide 21 Structural Products Price Trend Source: Data from Random Lengths Publications, Inc., updated as of September 27, 2013 Plywood Price Trend 2008-2013 YTD Southern Sheathing 15/32" 4 Ply. West Zone $100 $150 $200 $250 $300 $350 $400 $450 2008Q12008Q22008Q32008Q42009Q12009Q22009Q32009Q42010Q12010Q22010Q32010Q42011Q12011Q22011Q32011Q42012Q12012Q22012Q32012Q42013Q12013Q22013Q3 ($/msf - 3/8") Oriented Strand Board Price Trend 2008 - 2013 YTD Oriented Strand Board 7/16" North Central Zone $100 $150 $200 $250 $300 $350 $400 $450 2008Q12008Q22008Q32008Q42009Q12009Q22009Q32009Q42010Q12010Q22010Q32010Q42011Q12011Q22011Q32011Q42012Q12012Q22012Q32012Q42013Q12013Q22013Q3 ($/msf - 3/8") Lumber Price Trend 2008 - 2013 YTD Western SPF 2x4 #2 & Btr $100 $150 $200 $250 $300 $350 $400 $450 2008Q12008Q22008Q32008Q42009Q12009Q22009Q32009Q42010Q12010Q22010Q32010Q42011Q12011Q22011Q32011Q42012Q12012Q22012Q32012Q42013Q12013Q22013Q3 ($/mbf)
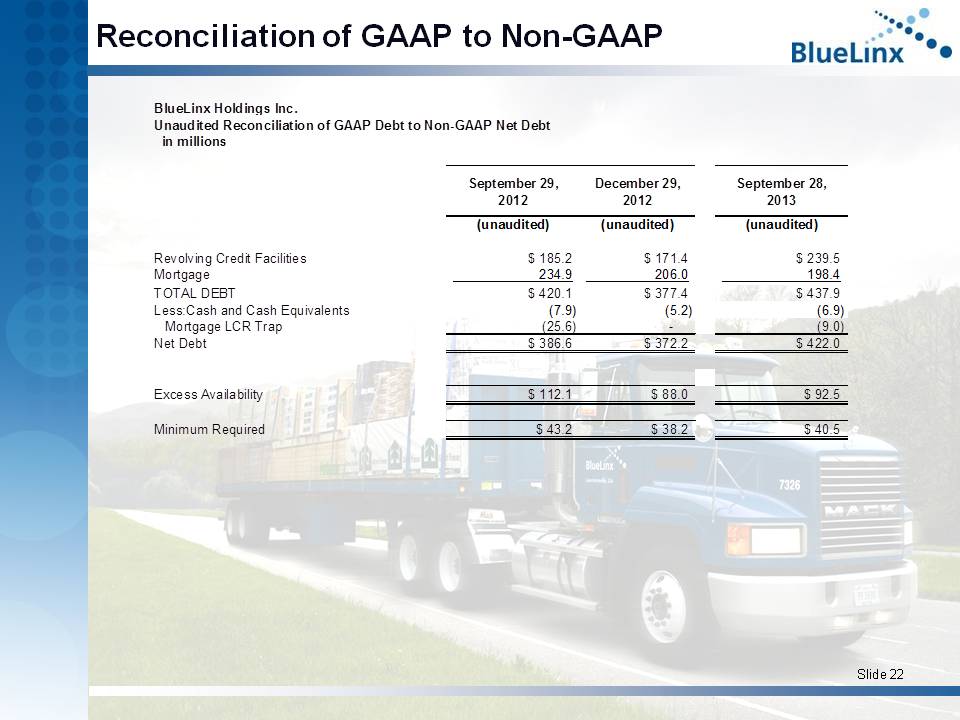
Slide 22 Reconciliation of GAAP to Non - GAAP BlueLinx Holdings Inc. Unaudited Reconciliation of GAAP Debt to Non-GAAP Net Debt in millions September 29, 2012 December 29, 2012 September 28, 2013 (unaudited) (unaudited) (unaudited) Revolving Credit Facilities $ 185.2 $ 171.4 $ 239.5 Mortgage 234.9 206.0 198.4 TOTAL DEBT $ 420.1 $ 377.4 $ 437.9 Less:Cash and Cash Equivalents (7.9) (5.2) (6.9) Mortgage LCR Trap (25.6) - (10.8) Net Debt $ 386.6 $ 372.2 $ 420.2 Excess Availability $ 112.1 $ 88.0 $ 92.5 Minimum Required $ 43.2 $ 38.2 $ 40.5
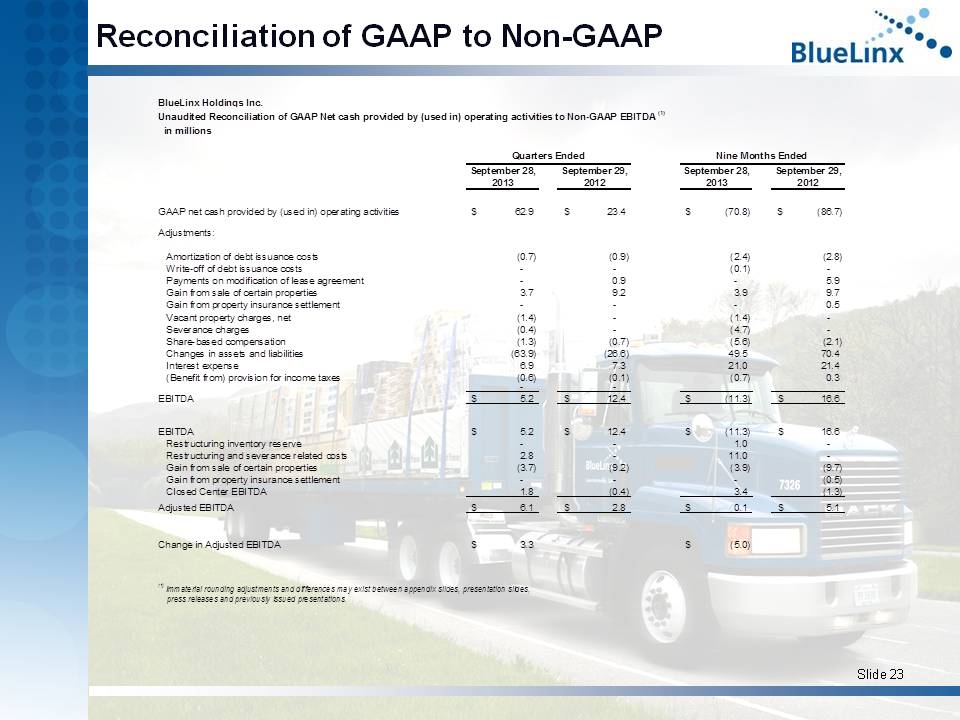
Slide 23 Reconciliation of GAAP to Non - GAAP BlueLinx Holdings Inc. Unaudited Reconciliation of GAAP Net cash provided by (used in) operating activities to Non-GAAP EBITDA (1) in millions Quarters Ended Nine Months Ended September 28, September 29, September 28, September 29, 2013 2012 2013 2012 GAAP net cash provided by (used in) operating activities 64.7$ 23.4$ (69.0)$ (86.7)$ Adjustments: Amortization of debt issuance costs (0.7) (0.9) (2.4) (2.8) Write-off of debt issuance costs 0.0 0.0 (0.1) 0.0 Payments on modification of lease agreement 0.0 0.9 0.0 5.9 Gain from sale of certain properties 3.7 9.2 3.9 9.7 Gain from property insurance settlement 0.0 0.0 0.0 0.5 Vacant property charges, net (1.4) 0.0 (1.4) 0.0 Severance charges (0.4) 0.0 (4.7) 0.0 Share-based compensation (1.3) (0.7) (5.6) (2.1) Changes in assets and liabilities (65.7) (26.6) 47.7 70.4 Interest expense 6.9 7.3 21.0 21.4 (Benefit from) provision for income taxes (0.6) (0.1) (0.7) 0.3 0.0 0.0 EBITDA 5.2$ 12.4$ (11.3)$ 16.6$ EBITDA 5.2$ 12.4$ (11.3)$ 16.6$ Restructuring inventory reserve 0.0 0.0 1.0 0.0 Restructuring and severance related costs 2.8 0.0 11.0 0.0 Gain from sale of certain properties (3.7) (9.2) (3.9) (9.7) Gain from property insurance settlement 0.0 0.0 0.0 (0.5) Closed Center EBITDA 1.8 (0.4) 3.4 (1.3) Adjusted EBITDA 6.1$ 2.8$ 0.1$ 5.1$ Change in Adjusted EBITDA 3.3$ (5.0)$ (1) Immaterial rounding adjustments and differences may exist between appendix slides, presentation slides, press releases and previously issued presentations.
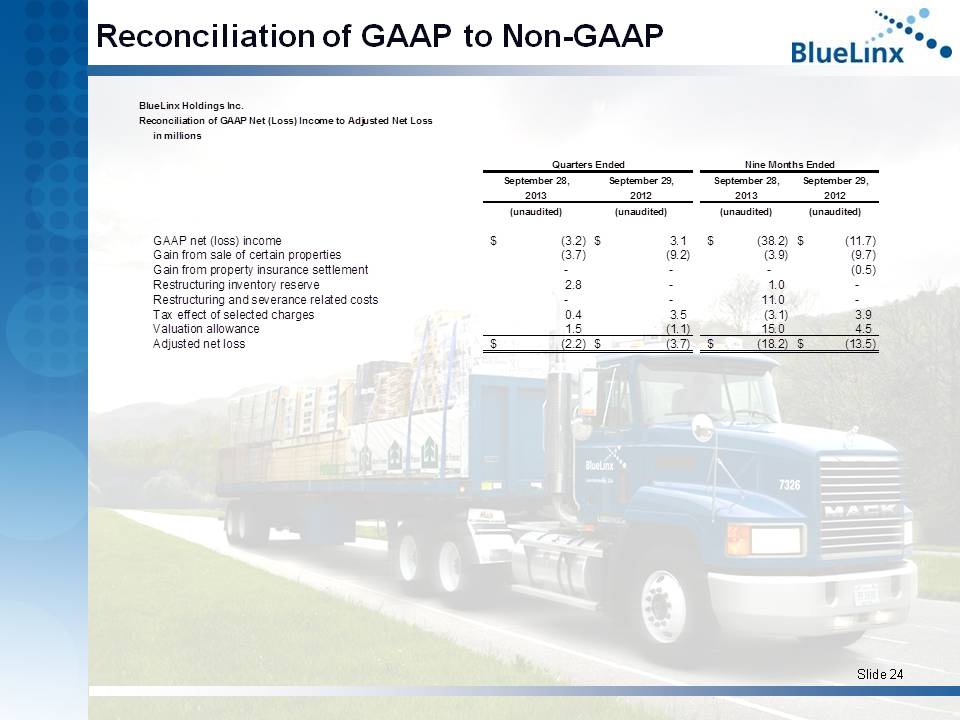
Slide 24 Reconciliation of GAAP to Non - GAAP BlueLinx Holdings Inc. Reconciliation of GAAP Net (Loss) Income to Adjusted Net Loss in millions September 28, September 29, September 28, September 29, 2013 2012 2013 2012 (unaudited) (unaudited) (unaudited) (unaudited) GAAP net (loss) income (3.2)$ 3.1$ (38.2)$ (11.7)$ Gain from sale of certain properties (3.7) (9.2) (3.9) (9.7) Gain from property insurance settlement - - - (0.5) Restructuring inventory reserve 2.8 - 1.0 - Restructuring and severance related costs - - 11.0 - Tax effect of selected charges 0.4 3.5 (3.1) 3.9 Valuation allowance 1.5 (1.1) 15.0 4.5 Adjusted net loss (2.2)$ (3.7)$ (18.2)$ (13.5)$ Quarters Ended Nine Months Ended

Slide 25 www.BlueLinxco.com