Attached files
| file | filename |
|---|---|
| 8-K - ARROW ELECTRONICS, INC. 8-K - ARROW ELECTRONICS INC | a50739895.htm |
| EX-99.1 - EXHIBIT 99.1 - ARROW ELECTRONICS INC | a50739895ex99-1.htm |
Exhibit 99.2
Third-Quarter 2013 CFO Commentary
As reflected in our earnings release, there are a number of items that impact the comparability of our results with those in the trailing quarter and the third quarter of last year. Any discussion of our results will exclude these items to give you a better sense of our operating results. As always, the operating information we provide to you should be used as a complement to GAAP numbers. For a complete reconciliation between our GAAP and Non-GAAP results, please refer to our earnings release or the earnings reconciliation found at the end of this document.
The following third quarter as reported and adjusted information included in this CFO commentary is unaudited and should be read in conjunction with the Form 10-Q for the quarterly periods ended March 30, 2013, June 29, 2013, and September 28, 2013, as well as the company's consolidated financial statements and related notes appearing in the company's 2012 Annual Report on Form 10-K as filed with the Securities and Exchange Commission.
Third-Quarter Summary
Arrow, once again, had a strong quarter, with year-over-year sales and diluted earnings per share up 2 percent and 8 percent, respectively. Revenue of $5.0 billion and diluted earnings per share of $1.18 were both in line with guidance. Our businesses executed well. Operating margins were up quarter over quarter, and year over year, with good returns on invested capital and cash flow generation. While executing well in the short-term, we continue to advance our long-term strategy. We continue to deploy capital to both organic sales-related investments and acquisitions. We have made excellent progress on our annualized $75 million productivity initiatives, and expect to exceed the targeted savings by the end of 2013. As you saw, we closed the Computerlinks acquisition just two days ago. This acquisition advances our matrix strategy in Europe, giving us a stronger presence in the large German market, and access to fast-growing products. We believe we provide the most comprehensive solution to our customers in both Europe and North America. These sales initiatives and the accretive acquisition are examples of our efforts to deploy capital to accelerate our strategy of providing full-service, value-added services to our customers.
1
In global components, we view the overall market as stable. Our sales of $3.5 billion were in line with seasonality and expectations. Book-to-bill, which was at the highest third-quarter level in the last three years, was near parity. Sales advanced year over year in the Americas and Europe and were flat in Asia. Sales in Asia were somewhat negatively affected by the decision to exit a customer engagement that did not meet our financial metrics. Our core gross margins expanded quarter over quarter. Operating income also improved year over year.
In enterprise computing solutions we also see a stable market. Our North American business saw growth in storage, services and software. In Europe, results were modestly lower due to a push out of activity in the U.K. As expected, both regions were also somewhat affected by our quarter end cut off, which was earlier than several of our suppliers. ECS margins were 4 percent, up year over year. Our strategic transformation toward selling a comprehensive solution, with focus on high-growth, high-margin products, continues to produce results.
Looking out to the fourth quarter, we are not expecting to see a meaningful change in the macro environment. Currently our view is that we would expect to see normal seasonality in the fourth quarter. We continue to have the right balance in maximizing our performance in the short term without sacrificing our long term goals.
2
Consolidated Overview – Third Quarter
|
P&L Highlights*
|
Q3 2013
|
Y/Y
Change
|
Y/Y Change
Adjusted for
Acquisitions
|
Q/Q
Change
|
|
Sales
|
$5,048
|
+2%
|
+1%
|
-5%
|
|
Gross Profit Margin
|
13.3%
|
-10bps
|
-10bps
|
+30bps
|
|
Operating Expense/Sales
|
9.5%
|
-10bps
|
-20 bps
|
+10bps
|
|
Operating Income
|
$194
|
+4%
|
+3%
|
flat
|
|
Operating Margin
|
3.8%
|
+10bps
|
+10bps
|
+20bps
|
|
Net Income
|
$120
|
flat
|
flat
|
-3%
|
|
Diluted EPS
|
$1.18
|
+8%
|
+7%
|
-1%
|
* $ in millions, except per share data, may reflect rounding
|
●
|
Third-quarter sales of $5.0 billion were in line with our guidance
|
|
|
o
|
Increased 2% year over year and decreased 5% sequentially
|
|
|
o
|
Adjusted for the impact of acquisitions and changes in foreign currencies, sales were flat year over year
|
|
●
|
Consolidated gross profit margin was 13.3%
|
|
|
o
|
Increased 30 basis points sequentially as core gross margins advanced in global components and ECS
|
|
|
§
|
Decreased 10 basis points year over year
|
|
●
|
Operating expenses as a percentage of sales were 9.5%
|
|
|
o
|
Declined 10 basis points year over year and increased 10 basis points sequentially
|
|
|
§
|
On an absolute dollar basis, operating expenses were flat year over year
|
|
|
§
|
Adjusted for the impact of acquisitions and changes in foreign currencies, operating expense dollars declined 2 percent year over year and were 20 basis points lower as a percentage of sales, as our efficiency initiatives more than offset our investments
|
|
●
|
Operating income was $194 million
|
|
|
o
|
Increased 4% year over year as reported and 3% as adjusted for the impact of acquisitions
|
|
|
o
|
Operating income was flat sequentially
|
3
|
●
|
Operating income as a percentage of sales was 3.8%
|
|
|
o
|
Increased 20 basis points sequentially
|
|
|
o
|
Increased 10 basis points year over year and as adjusted for the impact of acquisitions
|
|
●
|
Effective tax rate for the quarter was 29.4%
|
|
|
o
|
The tax rate was higher than our typical range of 27%-29%; we expect to move back into that range in the fourth quarter
|
|
●
|
Net income was $120 million
|
|
|
o
|
Increased $1 million year over year
|
|
|
o
|
Decreased $4 million sequentially
|
|
●
|
Earnings per share were $1.19 and $1.18 on a basic and diluted basis, respectively
|
|
|
o
|
Diluted EPS increased 8% year over year and decreased 1% sequentially
|
4
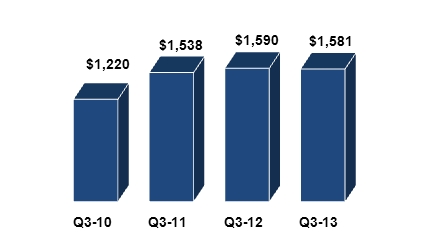
Global Components
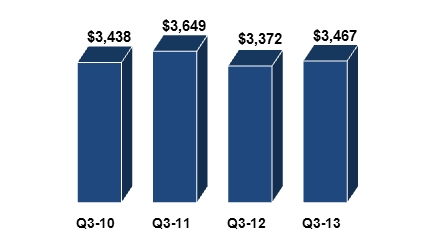
Sales ($ in millions)
|
●
|
Sales increased 3% year over year and 2% sequentially
|
|
●
|
Gross margin remained flat year over year and sequentially
|
|
|
o
|
Sequentially core gross margins advanced, offset by declines in the specialty businesses
|
|
●
|
Book-to-bill was near parity at 0.99
|
|
|
o
|
Highest third-quarter level in the last three years
|
|
●
|
Leading indicators, including lead times and cancellation rates, are in line with historical norms
|
|
●
|
Operating margin of 4.9%
|
|
|
o
|
Increased 10 basis points year over year and 20 basis points as adjusted for the impact of acquisitions, as revenue growth and our efficiency initiatives contributed to the increase
|
|
|
o
|
Highest operating income percent since the second quarter of 2012
|
|
●
|
Return on working capital increased 230 basis points sequentially and declined 50 basis points year over year; third consecutive quarter of improvement
|
5
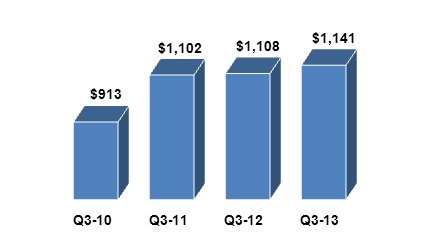
Americas Components Region
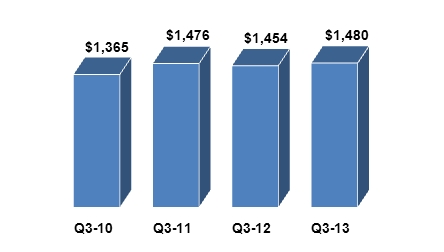
Sales ($ in millions)
|
●
|
Sales increased 2% year over year and 3% sequentially
|
|
|
o
|
In line with normal seasonality on a sequential basis
|
|
|
o
|
Increased sequentially across several of our vertical markets (aerospace, medical, lighting and alternative energy)
|
|
●
|
Operating income decreased 2% year over year
|
|
|
o
|
Operating margin declined 30 basis points year over year due to modest competitive gross margin pressure in several of our specialty businesses
|
|
●
|
Looking ahead to the fourth quarter, we expect sales in our core Americas components business to be in line with traditional seasonality
|
6
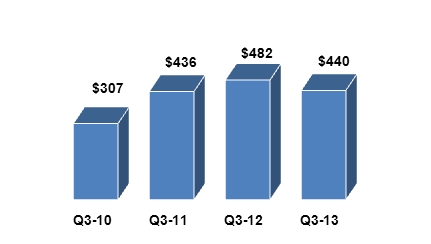
Europe Components Region
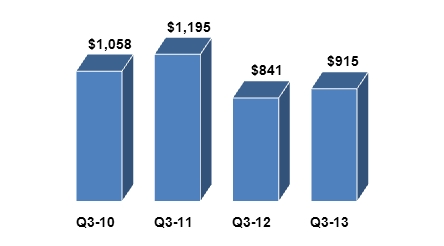
Sales ($ in millions)
|
●
|
Sales increased 9% year over year and 1% sequentially
|
|
|
o
|
Adjusted for the impact of changes in foreign currencies, sales increased 4% year over year and 3% sequentially
|
|
|
o
|
All regions at or above prior year sales levels
|
|
|
o
|
Double digit growth in medical
|
|
●
|
Operating income increased 9% year over year
|
|
|
o
|
Driven by the increase in sales and a modest uplift in gross margins
|
|
|
o
|
Operating margins remain flat year over year
|
|
●
|
Looking ahead to the fourth quarter, we expect sales in our core European components business to be at the high end of normal seasonality
|
7
Asia Pacific Components Region
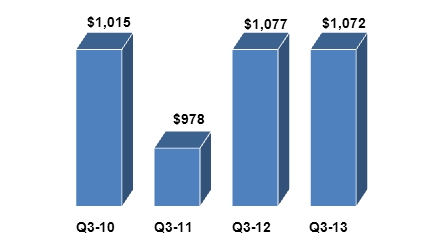
Sales ($ in millions)
|
●
|
Sales increased 2% sequentially and were flat year over year
|
|
|
o
|
Core sales grew 7% year over year
|
|
|
o
|
Core sales were flat sequentially as we exited a customer engagement that did not meet our financial metrics
|
|
|
o
|
Both transportation and lighting saw growth sequentially
|
|
●
|
Operating profit increased 20% year over year primarily due to improved mix within the customer base
|
|
|
o
|
Operating margin increased 50 basis points year over year
|
|
●
|
Looking ahead to the fourth quarter, we expect sales in our core Asia Pacific components business to be in line with traditional seasonality
|
8
Global Enterprise Computing Solutions
Sales ($ in millions)
|
●
|
Sales decreased 1% year over year and 17% sequentially
|
|
|
o
|
The sequential decline was higher than traditional seasonality due to our quarter end cut off, which was earlier than several of our suppliers; these sales were recorded in October
|
|
|
o
|
Double digit growth year over year in services and storage as well as growth in software
|
|
|
§
|
Network and infrastructure increased 23% and 5% year over year, respectively
|
|
●
|
Gross margin increased 50 basis points sequentially and decreased 20 basis points year over year
|
|
●
|
Operating margin 4.0%
|
|
|
o
|
Up 30 basis points year over year
|
|
|
o
|
Income increased 7% year over year
|
|
●
|
Return on working capital continues to excel
|
9
ECS America
Sales ($ in millions)
|
●
|
Sales increased 3% year over year and decreased 14% sequentially
|
|
|
o
|
Sales in our core value-added distribution business was below traditional seasonality primarily due to our quarter-end cut off
|
|
|
o
|
Year over year growth in storage (+13%), services (+12%) and software (+6%)
|
|
|
§
|
Networking and security grew 31% and 9% year over year, respectively
|
|
●
|
Operating income increased 11% year over year
|
|
|
o
|
Operating income grew more than 3.5x faster than sales year over year
|
|
|
o
|
Operating margin increased 40 basis points year over year
|
|
●
|
Looking ahead to the fourth quarter, we expect sales in our core Americas value-added computing solutions business to be in line with normal seasonality
|
10
ECS Europe
Sales ($ in millions)
|
●
|
Sales decreased 9% year over year and 25% sequentially
|
|
|
o
|
Adjusted for the impact of changes in foreign currencies, sales decreased 26% sequentially
|
|
|
o
|
Below traditional seasonality primarily due to our quarter end cut off and some push out of activity in the U.K.
|
|
|
o
|
Year over year growth in services (+15%) and storage (+4%)
|
|
●
|
Operating profit decreased 40% year over year due to the aforementioned sales decline
|
|
|
o
|
Operating margin decreased 30 basis points year over year
|
|
●
|
Looking ahead to the fourth quarter, we expect sales in our core European value-added computing solutions business to be near the high end of traditional seasonality
|
11
Cash Flow and Balance Sheet Highlights
|
●
|
Cash Flow from Operations
|
Cash generated from operating activities in the third quarter was $81 million and $423 million on a trailing 12-month basis. We converted more than 96% of GAAP net income to cash over the last 12-months, well in excess of our targeted level.
|
●
|
Working Capital
|
We continue to effectively manage all levers of our working capital throughout the third quarter with working capital to sales of $.16. Return on working capital is 23.5%.
|
●
|
Return on Invested Capital
|
Return on invested capital of 9.6% in the third quarter was well ahead of our weighted average cost of capital.
|
●
|
Share Buyback
|
We did not repurchase any shares in the third quarter as capital was directed toward acquisitions. This is aligned with our capital structure strategy of investing in the business to accelerate growth, profitability, and returns, and to then return excess cash to investors.
|
●
|
Debt and Liquidity
|
Our balance sheet and capital structure remain very strong with conservative debt levels, and a net debt to EBITDA ratio of approximately 1.9x. Our total liquidity is $2.2 billion when including our cash of $252 million. Thus, we have the flexibility to continue to take advantage of opportunities in the marketplace.
|
Fourth-Quarter 2013 Guidance
|
|
|
Consolidated Sales
|
$5.6 billion to $6.0 billion
|
|
Global Components
|
$3.2 billion to $3.4 billion
|
|
Global ECS
|
$2.4 billion to $2.6 billion
|
|
Diluted Earnings per Share*
|
$1.56 to $1.68
|
* Fourth-quarter guidance assumes average diluted shares outstanding of 102.5 million.
12
Arrow Electronics Revenue Seasonality*
|
Global
Components
|
NAC
|
EMEA ex FX
|
AAP
|
|
Q1
|
-2% to +4%
|
+13% to +19%
|
-1% to +5%
|
|
Q2
|
-3% to +3%
|
-5% to -11%
|
+4% to +10%
|
|
Q3
|
-2% to +4%
|
-5% to +1%
|
+3% to +9%
|
|
Q4
|
-4% to +2%
|
-3% to -9%
|
-1% to -7%
|
|
Global ECS
|
NA
|
EMEA ex FX
|
|
|
Q1
|
-28% to -34%
|
-21% to -27%
|
|
|
Q2
|
+20% to +26%
|
+1% to +7%
|
|
|
Q3
|
-2% to -8%
|
-12% to -18%
|
|
|
Q4
|
+28% to +34%
|
+59% to +65%
|
* Revenue seasonality based on historical sequential sales growth for 2007-2011 for our traditional components and ECS businesses excluding acquisitions
13
Risk Factors
The discussion of the company’s business and operations should be read together with the risk factors contained in Item 1A of its 2012 Annual Report on Form 10-K, filed with the Securities and Exchange Commission, which describe various risks and uncertainties to which the company is or may become subject. If any of the described events occur, the company’s business, results of operations, financial condition, liquidity, or access to the capital markets could be materially adversely affected.
Certain Non-GAAP Financial Information
In addition to disclosing results that are determined in accordance with Generally Accepted Accounting Principles ("GAAP"), the company provides certain non-GAAP financial information relating to operating income, net income attributable to shareholders, and net income per basic and diluted share, each as adjusted for certain charges, credits, gains, and losses that the company believes impact the comparability of its results of operations. These charges, credits, gains, and losses arise out of the company's efficiency enhancement initiatives, acquisitions (including intangible assets amortization expense), prepayment of debt, and adjustments related to certain tax matters. A reconciliation of the company's non-GAAP financial information to GAAP is set forth in the table below.
The company believes that such non-GAAP financial information is useful to investors to assist in assessing and understanding the company's operating performance and underlying trends in the company's business because management considers the charges, credits, gains and losses referred to above to be outside the company's core operating results. This non-GAAP financial information is among the primary indicators management uses as a basis for evaluating the company's financial and operating performance. In addition, the company's Board of Directors may use this non-GAAP financial information in evaluating management performance and setting management compensation.
The presentation of this additional non-GAAP financial information is not meant to be considered in isolation or as a substitute for, or alternative to, operating income, net income attributable to shareholders and net income per basic and diluted share determined in accordance with GAAP. Analysis of results and outlook on a non-GAAP basis should be used as a complement to, and in conjunction with, data presented in accordance with GAAP.
14
Earnings Reconciliation
($ in thousands, except per share data)
| Q3 2013 | Q2 2013 | Q3 2012 | ||||||||||
|
Operating income, as Reported
|
$ | 162,736 | $ | 155,875 | $ | 163,817 | ||||||
|
Intangible assets amortization expense
|
8,936 | 8,869 | 8,742 | |||||||||
|
Restructuring, integration, and other charges
|
22,568 | 30,224 | 14,562 | |||||||||
|
Operating income, as Adjusted
|
$ | 194,240 | $ | 194,968 | $ | 187,121 | ||||||
|
Net income attributable to shareholders, as Reported
|
$ | 96,779 | $ | 89,935 | $ | 103,617 | ||||||
|
Intangible assets amortization expense
|
7,074 | 7,029 | 7,145 | |||||||||
|
Restructuring, integration, and other charges
|
16,077 | 20,688 | 8,576 | |||||||||
|
Adjustments to tax reserves
|
||||||||||||
|
Income taxes
|
-- | 5,362 | -- | |||||||||
|
Interest (net of taxes)
|
-- | 939 | -- | |||||||||
|
Net income attributable to shareholders, as Adjusted
|
$ | 119,930 | $ | 123,953 | $ | 119,338 | ||||||
|
Diluted EPS, as Reported
|
$ | .95 | $ | .86 | $ | .94 | ||||||
|
Intangible assets amortization expense
|
.07 | .07 | .07 | |||||||||
|
Restructuring, integration, and other charges
|
.16 | .20 | .08 | |||||||||
|
Adjustments to tax reserves
|
||||||||||||
|
Income taxes
|
-- | .05 | -- | |||||||||
|
Interest (net of taxes)
|
-- | .01 | -- | |||||||||
|
Diluted EPS, as Adjusted
|
$ | 1.18 | $ | 1.19 | $ | 1.09 |
The sum of the components for diluted EPS, as Adjusted, may not agree to totals, as presented, due to rounding.
Earnings Reconciliation
References to restructuring and other charges refer to the following incremental charges taken in the periods indicated:
Q3-13 Intangible Assets Amortization Expense: During the third quarter of 2013, the company recorded intangible assets amortization expense of $8.9 million ($7.1 million net of related taxes or $.07 per share on both a basic and diluted basis).
Q3-13 Restructuring, Integration, and Other Charges: During the third quarter of 2013, the company recorded restructuring, integration, and other charges of $22.6 million ($16.1 million net of related taxes or $.16 per share on both a basic and diluted basis).
Q2-13 Intangible Assets Amortization Expense: During the second quarter of 2013, the company recorded intangible assets amortization expense of $8.9 million ($7.0 million net of related taxes or $.07 per share on both a basic and diluted basis).
Q2-13 Restructuring, Integration, and Other Charges: During the second quarter of 2013, the company recorded restructuring, integration, and other charges of $30.2 million ($20.7 million net of related taxes or $.20 per share on both a basic and diluted basis).
15
Q2-13 Adjustments to Tax Reserves: During the second quarter of 2013, the company recorded an increase in the provision for income taxes of $5.4 million ($.05 per share on both a basic and diluted basis) and an increase in interest expense of $1.5 million ($.9 million net of related taxes or $.01 per share on both a basic and diluted basis) relating to adjustments to tax reserves for ongoing international tax audits.
Q3-12 Intangible Assets Amortization Expense: During the third quarter of 2012, the company recorded intangible assets amortization expense of $8.7 million ($7.1 million net of related taxes or $.07 per share on both a basic and diluted basis).
Q3-12 Restructuring, Integration, and Other Charges: During the third quarter of 2012, the company recorded restructuring, integration, and other charges of $14.6 million ($8.6 million net of related taxes or $.08 per share on both a basic and diluted basis).
16