Attached files
| file | filename |
|---|---|
| EX-99.1 - EX-99.1 - Xylem Inc. | d616973dex991.htm |
| 8-K - FORM 8-K - Xylem Inc. | d616973d8k.htm |
 XYLEM
INC. Q3 2013 EARNINGS RELEASE
OCTOBER 29, 2013
Exhibit 99.2 |
 XYLEM PROPRIETARY / CONFIDENTIAL
FORWARD-LOOKING STATEMENTS
This
document
contains
information
that
may
constitute
“forward-looking
statements.”
Forward-looking
statements
by
their
nature
address
matters
that
are,
to
different
degrees,
uncertain.
Generally,
the
words
“anticipate,”
“estimate,”
“expect,”
“project,”
“intend,”
“plan,”
“believe,”
“target”
and
similar
expressions
identify
forward-looking
statements,
which
generally
are
not
historical
in
nature.
However,
the
absence
of
these
words
or
similar
expressions
does
not
mean
that
a
statement
is
not
forward-looking.
These
forward-looking
statements
include,
but
are
not
limited
to,
statements
about
the
separation
of
Xylem
Inc.
(the
“Company”)
from
ITT
Corporation
in
2011,
capitalization
of
the
Company,
future
strategic
plans
and
other
statements
that
describe
the
Company’s
business
strategy,
outlook,
objectives,
plans,
intentions
or
goals,
and
any
discussion
of
future
operating
or
financial
performance.
All
statements
that
address
operating
performance,
events
or
developments
that
we
expect
or
anticipate
will
occur
in
the
future
—
including
statements
relating
to
orders,
revenues,
operating
margins
and
earnings
per
share
growth,
and
statements
expressing
general
views
about
future
operating
results
—
are
forward-looking
statements.
Caution
should
be
taken
not
to
place
undue
reliance
on
any
such
forward-looking
statements
because
they
involve
risks,
uncertainties
and
other
factors
that
could
cause
actual
results
to
differ
materially
from
those
expressed
or
implied
in,
or
reasonably
inferred
from,
such
statements.
The
Company
undertakes
no
obligation
to
publicly
update
or
revise
any
forward-
looking
statements,
whether
as
a
result
of
new
information,
future
events
or
otherwise,
except
as
required
by
law.
In
addition,
forward-looking
statements
are
subject
to
certain
risks
and
uncertainties
that
could
cause
actual
results
to
differ
materially
from
the
Company’s
historical
experience
and
our
present
expectations
or
projections.
These
risks
and
uncertainties
include,
but
are
not
limited
to,
those
set
forth
in
Item
1A
of
our
Annual
Report
on
Form
10-K,
and
those
described
from
time
to
time
in
subsequent
reports
filed
with
the
Securities
and
Exchange
Commission.
2
Q3 2013 EARNINGS RELEASE |
 XYLEM PROPRIETARY / CONFIDENTIAL
3
Q3’13 BUSINESS UPDATE
Q3 2013 EARNINGS RELEASE
GAINING TRACTION & BUILDING MOMENTUM
Strong 3rd Quarter Performance
Return
to
Organic
Revenue*
Growth
(+1%);
Organic
Orders*
(+6%)
…
Solid Backlog
Operating
Margin
*
of
13.5%
(Up
60
Bps),
With
Strong
Incremental
Performance
EPS*
$0.49
Up
11%
…
Raising
Full
Year
Guidance
Enhancing
Shareholder
Returns
…
Deploying
Capital
into
Share
Repurchases
Looking Ahead –
Next Steps
Improving
Emerging
Markets
Conditions,
U.S.
Stable
&
Europe
Better
Than
Expected
Prioritizing
Initiatives
&
Driving
Productivity
Focused
on
Execution
&
Accountability
to
Provide
for
Better
Visibility
Identifying
Actions
to
Drive
Stronger
2014
Performance
Committed
to
Long-Term
Strategy
&
Financial
Targets
* See appendix for non-GAAP reconciliations |
 XYLEM PROPRIETARY / CONFIDENTIAL
4
Q3’13 XYLEM PERFORMANCE
+4%
(Dollars, In Millions)
(Dollars, In Millions)
* See appendix for non-GAAP reconciliations
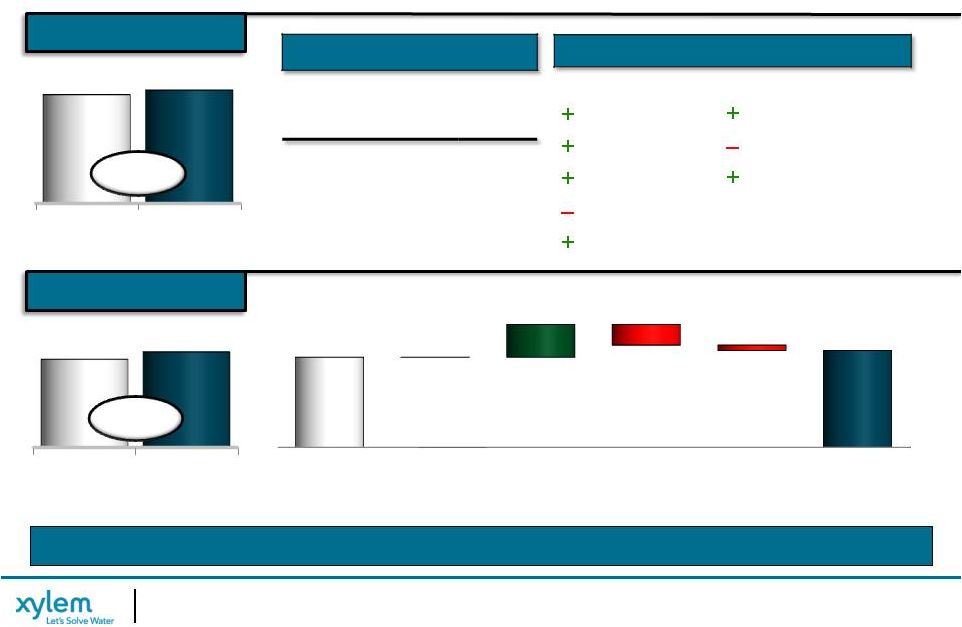
STRONG OPERATING PERFORMANCE
STRONG OPERATING PERFORMANCE
Q3 GROWTH
Q3 GROWTH
Organic
+1%
Acquisitions
+2%
Constant
Currency
+4%
+
Double-Digit Growth
in Eastern Europe &
Asia Pac (China Up
Over 40%)
Q3'12
Op Margin*
Volume,
Mix, & Other
Cost
Reductions &
Price
Material,
Labor,
& OH
Inflation
FX/Acq
Q3'13
Op Margin*
12.9%
13.5%
0.0%
2.1%
0.5%
3.2%
Q3'12
Q3'13
931
965
Q3'12
Q3'13
120
130
+8%
Q3 2013 EARNINGS RELEASE
OPERATING INCOME*
OPERATING INCOME*
REVENUE
REVENUE
ORGANIC PERFORMANCE
By End Market
By Geography
Industrial
Europe
Public Utility
U.S.
Commercial
Emerging Markets
Residential
Agriculture
Price -
0.3%
FX
-0.1%
Vol/Other
+0.4%
Euro HQ
-0.2%
Pension
-0.2%
(Note Rounding Impacts Sum Total) |
 XYLEM PROPRIETARY / CONFIDENTIAL
5
Q3’13 XYLEM PERFORMANCE
Q3 2013 EARNINGS RELEASE
EPS*
* See appendix for non-GAAP reconciliations
STRONG PERFORMANCE ON MODEST REVENUE GROWTH
+
Organic Revenue Growth
+
Strong Incremental Margins
Driven by Productivity & Strict
Cost Management
+
Restructuring Savings $0.03
+
European Realignment $0.01
–
Unfavorable Mix/Price $0.02
–
Pension/1x Separation
Headwind $0.01
+11%
Adjusted
Q3'12 EPS
Adjusted
Q3'13 EPS
$0.44
$0.49 |
 XYLEM PROPRIETARY / CONFIDENTIAL
6
Q3’13 WATER INFRASTRUCTURE PERFORMANCE
Q3 2013 EARNINGS RELEASE
OPERATING INCOME*
+4%
(Dollars, In Millions)
(Dollars, In Millions)
REVENUE
* See appendix for non-GAAP reconciliations
ORGANIC GROWTH & COST ACTIONS DRIVING IMPROVED PERFORMANCE
(Organic Performance)
Transport
+2%;
Treatment
-2%;
Test
Flat
+
Europe
Up
Low
Single
Digits
+
Transport
North/Central
Strength
…
South
Weak
–
Treatment
…
PY
Biogas
&
UK
Projects
Compare
–
U.S.
Down
1%
–
Treatment
…
Project
Delays,
Funding
Constraints
=
Transport
Flat
…
Dewatering
Up
MSD
(Sandy,
Fracking),
Offset
by
Capex
Decline
+
Emerging
Markets
Up
High
Single
Digits
+
Asia
Pac
(China
Up
Over
30%)
+
Eastern
Europe
(Capex
Projects,
Russia
Share
Gains)
Q3 GROWTH
Organic
+1%
Acquisitions
+4%
Constant
Currency
+5%
Q3'12
Q3'13
595
619
Q3'12
Q3'13
89
96
+8% |
 XYLEM PROPRIETARY / CONFIDENTIAL
7
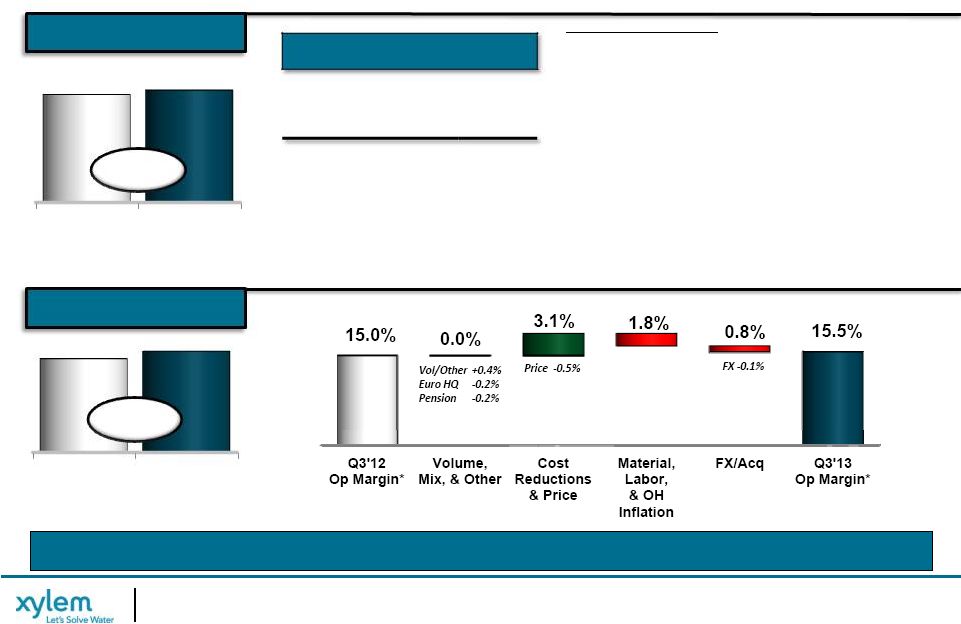
Q3’13 APPLIED WATER PERFORMANCE
Q3 2013 EARNINGS RELEASE
OPERATING INCOME*
+3%
(Dollars, In Millions)
(Dollars, In Millions)
REVENUE
* See appendix for non-GAAP reconciliations
STRONG
EMERGING
MARKETS
PERFORMANCE
…
MIX
DRIVES
MARGIN
DECLINE
(Organic Performance)
Building Svcs +1%; Ind’l Water +2%; Irrigation +2%
+
Emerging Markets Up Double-Digits
+
China Exceptionally Strong …
Industrial Water
Projects (Offshore O&G Fire Pump Projects) &
Commercial Building Market Share Gains
+
U.S. Commercial (Timing/Promotions) & Agriculture
(Favorable Weather Conditions)
–
U.S. Residential Slowing …
Southern Europe Weak
–
Continued U.S Industrial Weakness
Q3 GROWTH
Organic
+2%
Acquisition
0%
Constant
Currency
+2%
Q3'12
Q3'13
350
Q3'12
Q3'13
44
44
Flat
360
Vol/Other
-0.8%
Euro HQ
-0.3%
Pension
-0.3% |
 XYLEM PROPRIETARY / CONFIDENTIAL
8
Q3 2013 EARNINGS RELEASE
XYLEM FINANCIAL POSITION
* See Appendix for Non-GAAP Reconciliations
September 30, 2013
Cash
394
Debt
1,202
Net Debt
808
Shareholders’
Equity
2,158
Net Capital
2,966
Net Debt to Net Capital
27%
CAPITAL SUMMARY
•
Strong Cash Position
•
Enhancing Shareholder Returns …
Deployed $107M in Dividends &
Repurchases vs. $58M in YTD‘12
•
Free Cash Flow Decline Driven by
Lower Income, Higher
Restructuring Payments, &
Unfavorable Working Capital
(Dollars, In Millions)
Cash
Dec. 2012
Operating
Activities
& Other
Dividends
& Share
Repurchases
Acquisitions
& Capex
Cash
Sept. 2013
504
394
107
172
169
69
325
SEPT.
2013
U.S.
International
Q3'12
YTD
Q3'13
YTD
171
72
CASH DRIVERS
CASH DRIVERS
FREE CASH FLOW *
FREE CASH FLOW *
CASH BALANCE
CASH BALANCE
(GEOGRAPHIC)
(GEOGRAPHIC)
(Dollars, In Millions)
(Dollars, In Millions)
(Dollars, In Millions)
FCF%
73%
45% |
 XYLEM PROPRIETARY / CONFIDENTIAL
9
Q3 2013 EARNINGS RELEASE
XYLEM GUIDANCE UPDATE
FOCUSED EXECUTION DRIVING PERFORMANCE …
RAISING FULL YEAR EXPECTATIONS
* See appendix for non-GAAP reconciliations
FY REVENUE
FY EPS*
3.7B
3.8B
3.8B
$1.45
$1.63
$1.63
•
Internal Growth Initiatives & Improved Market Conditions
Drive Top Line Revision
-
Europe Stabilizing, U.S. Stable, Emerging Markets
Continue to Grow
-
Solid Backlog of $752M …
$470M Shippable Up 2%
•
Focused Execution & Disciplined Cost Management Drives
Solid Operating Performance
-
On Track to Deliver Full Year Restructuring Savings;
Incremental Actions Identified
Mid -
Point
Mid -
Point
Previous
Guidance
Current
Outlook
Previous
Guidance
Current
Outlook
Implied 4Q Revenue $965M; EPS* $0.51
•
European Realignment Delivers Benefits As
Previously Expected
• |
 XYLEM PROPRIETARY / CONFIDENTIAL
10
Q3 2013 EARNINGS RELEASE
2013 Full Year
Financial Outlook
Growth
2013E vs. 2012
Xylem Consolidated
~$3,770
~ -1%
~ -2%
2%
-1%
Water Infrastructure
~$2,405
~ -1%
~ -3%
3%
-1%
Applied Water
~$1,430
Flat
Flat
Flat
Flat
Segment Margin *
13.1% to 13.3%
-120 bps to -100 bps
Operating Margin *
11.5% to 11.8%
-140 bps to -110 bps
EPS *
$1.60 to $1.65
$1.63 Mid-Point
Free Cash Flow
Conversion
~90%
Restructuring Pmts, Realignment Capex, & 1x Spin
Capex
Guidance Assumptions:
Operating Tax Rate
~21%
4Q Tax Rate of 21%
Share Count
~186.0
4Q Assumption ~185.0
Restructuring &
Realignment Costs *
~$65 to $80
‘13 Net Cost Savings $14 to $15; Realignment Cost
$25-$30
2013 FINANCIAL GUIDANCE SUMMARY
* See appendix for non-GAAP reconciliations
(Dollars In Millions, Except per Share Data)
Organic
Acquisition
FX
Total Growth
(Mid-Point)
Revenue |
 XYLEM PROPRIETARY / CONFIDENTIAL
11
Q3 2013 EARNINGS RELEASE
XYLEM 3Q EARNINGS SUMMARY
Strong 3 Quarter Performance …
Raising 2013 Guidance
Enhancing Shareholder Returns …
Deploying Capital into Share
Repurchases
Prioritizing Initiatives & Driving Productivity
Focused on Execution & Accountability to Provide for Better Visibility
Identifying Actions to Drive Stronger 2014 Performance
Committed to Long-Term Strategy & Financial Targets
rd |
 XYLEM PROPRIETARY / CONFIDENTIAL
12
Q3 2013 EARNINGS RELEASE
NON-GAAP MEASURES
Management
views
key
performance
indicators
including
revenue,
gross
margins,
segment
operating
income
and
margins,
orders
growth,
free cash
flow,
working
capital,
and
backlog,
among
others.
In
addition,
we
consider
certain
measures
to
be
useful
to
management
and
investors
evaluating
our
operating
performance
for
the
periods
presented,
and
provide
a
tool
for
evaluating
our
ongoing
operations,
liquidity
and
management
of
assets.
This
information
can
assist
investors
in
assessing
our
financial
performance
and
measures
our
ability
to
generate
capital
for
deployment
among
competing
strategic
alternatives
and
initiatives.
These
metrics,
however,
are
not
measures
of
financial
performance
under
GAAP
and
should
not
be
considered
a
substitute
for
revenue,
operating
income,
net
income,
earnings
per
share
(basic
and
diluted)
or
net
cash
from
operations
as
determined
in
accordance
with
GAAP.
We
consider
the
following
non-GAAP
measures,
which
may
not
be
comparable
to
similarly
titled
measures
reported
by
other
companies,
to
be
key
performance
indicators:
“Organic
revenue”
and
“Organic
orders”
defined
as
revenue
and
orders,
respectively,
excluding
the
impact
of
foreign
currency
fluctuations,
intercompany
transactions,
and
contributions
from
acquisitions
and
divestitures.
Divestitures
include
sales
of
portions
of
our
business
that
did
not
meet
the
criteria
for
classification
as
a
discontinued
operation
or
insignificant
portions
of
our
business
that
we
did
not
classify
as
a
discontinued
operation.
The
period-over-period
change
resulting
from
foreign
currency
fluctuations
assumes
no
change
in
exchange
rates
from
the
prior
period.
“Constant
currency”
defined
as
financial
results
adjusted
for
currency
translation
impacts
by
translating
current
period
and
prior
period
activity
using
the
same
currency
conversion
rate.
This
approach
is
used
for
countries
whose
functional
currency
is
not
the
U.S.
dollar.
“EBITDA”
defined
as
earnings
before
interest,
taxes,
depreciation,
amortization
expense,
and
share-based
compensation.
“Adjusted
EBITDA”
reflects
the
adjustment
to
EBITDA
to
exclude
for
non-recurring
separation
costs
associated
with
the
Xylem
spin-off
from
ITT
Corporation
as
well
as
non-recurring
restructuring
and
realignment
costs.
“Adjusted
Operating
Income,”
“
Adjusted
Segment
Operating
Income,”
and
“Adjusted EPS”
defined
as
operating
income
and
earnings
per
share,
adjusted
to
exclude
non-recurring
separation
costs
associated
with
the
Xylem
spin-off
from
ITT Corporation,
non-recurring
restructuring
and
realignment
costs
and
tax-related
special
items.
“Normalized
EPS”
defined
as
adjusted
earnings
per
share,
as
well
as
adjustments
to
reflect
the
incremental
current
period
amount
of
interest
expense
and
stand
alone
costs
in
the
prior
comparable
period.
“Free
Cash
Flow”
defined
as
net
cash
from
operating
activities,
as
reported
in
the
Statement
of
Cash
Flow,
less
capital
expenditures
as
well
as
adjustments
for
other
significant
items
that
impact
current
results
which
management
believes
are
not
related
to
our
ongoing
operations
and
performance.
Our
definition
of
free
cash
flows
does
not
consider
non-discretionary
cash
payments,
such
as
debt.
“Realignment
costs”
defined
as
non-recurring
costs
not
included
in
restructuring
costs
that
are
incurred
as
part
of
actions
taken
to
reposition
our
business,
including
items
such
as
professional
fees,
relocation,
travel
and
other
costs.
“Special
charges”
defined
as
costs
incurred
by
the
Company
associated
with
the
settlement
of
legal
proceedings
with
Xylem
Group
LLC,
as
well
as
certain
costs
incurred
for
the
change
in
chief
executive
officer
made
during
the
third
quarter
of
2013. |
 XYLEM PROPRIETARY / CONFIDENTIAL
13
Q3 2013 EARNINGS RELEASE
NON-GAAP RECONCILIATION:
ORGANIC & CONSTANT CURRENCY REVENUE GROWTH
Constant Currency
(A)
(B)
(C)
(D)
(E)
(F) = B+C+D+E
(G) = F/A
(H) = (F -
C) / A
Change
% Change
Change
% Change
Revenue
Revenue
2013 v. 2012
2013 v. 2012
FX Contribution
Eliminations
Adj. 2013 v. 2012
Adj. 2013 v. 2012
2013
2012
Nine Months Ended September 30
Xylem Inc.
2,804
2,822
(18)
-1%
(67)
(2)
-
(87)
-3%
-1%
Water Infrastructure
1,766
1,788
(22)
-1%
(67)
2
1
(86)
-5%
-1%
Applied Water
1,086
1,078
8
1%
-
(5)
(4)
(1)
0%
0%
Quarter Ended September 30
Xylem Inc.
965
931
34
4%
(21)
-
-
13
1%
4%
Water Infrastructure
619
595
24
4%
(21)
3
1
7
1%
5%
Applied Water
360
350
10
3%
-
(4)
-
6
2%
2%
Quarter Ended June 30
Xylem Inc.
960
966
(6)
-1%
(23)
(4)
-
(33)
-3%
-1%
Water Infrastructure
596
609
(13)
-2%
(23)
(2)
-
(38)
-6%
-2%
Applied Water
381
373
8
2%
-
(1)
(2)
5
1%
1%
Quarter Ended March 31
Xylem Inc.
879
925
(46)
-5%
(23)
2
-
(67)
-7%
-5%
Water Infrastructure
551
584
(33)
-6%
(23)
1
-
(55)
-9%
-5%
Applied Water
345
355
(10)
-3%
-
-
(2)
(12)
-3%
-3%
Note: Due to rounding the sum of segment amounts may not agree to Xylem totals.
Acquisitions /
Divestitures
Reported vs. Organic & Constant Currency Revenue
($ Millions)
(As Reported -
GAAP)
(As Adjusted -
Organic) |
 XYLEM PROPRIETARY / CONFIDENTIAL
14
Q3 2013 EARNINGS RELEASE
NON-GAAP RECONCILIATION:
ORGANIC & CONSTANT CURRENCY ORDER GROWTH
Constant Currency
(A)
(B)
(C)
(D)
(E)
(F) = B+C+D+E
(G) = F/A
(H) = (F -
C) / A
Change
% Change
Change
% Change
Orders
Orders
2013 v. 2012
2013 v. 2012
FX Contribution
Eliminations
Adj. 2013 v. 2012
Adj. 2013 v. 2012
2013
2012
Nine Months Ended September 30
Xylem Inc.
2,926
2,856
70
2%
(71)
1
-
-
0%
2%
Water Infrastructure
1,865
1,819
46
3%
(71)
4
-
(21)
-1%
3%
Applied Water
1,111
1,086
25
2%
-
(4)
1
22
2%
2%
Quarter Ended September 30
Xylem Inc.
955
882
73
8%
(20)
1
-
54
6%
8%
Water Infrastructure
617
564
53
9%
(20)
3
-
36
6%
10%
Applied Water
355
334
21
6%
-
(3)
1
19
6%
6%
Quarter Ended June 30
Xylem Inc.
1,009
970
39
4%
(25)
(2)
-
12
1%
4%
Water Infrastructure
647
617
30
5%
(25)
(1)
-
4
1%
5%
Applied Water
378
370
8
2%
-
(1)
1
8
2%
2%
Quarter Ended March 31
Xylem Inc.
962
1,004
(42)
-4%
(26)
2
-
(66)
-7%
-4%
Water Infrastructure
601
638
(37)
-6%
(26)
2
-
(61)
-10%
-5%
Applied Water
378
382
(4)
-1%
-
-
(1)
(5)
-1%
-1%
Note: Due to rounding the sum of segment amounts may not agree to Xylem totals.
Acquisitions /
Divestitures
Reported vs. Organic & Constant Currency Order Growth
($ Millions)
(As Reported -
GAAP)
(As Adjusted -
Organic) |
 XYLEM PROPRIETARY / CONFIDENTIAL
15
Q3 2013 EARNINGS RELEASE
NON-GAAP RECONCILIATION:
ADJUSTED DILUTED EPS
Q3 2012
Q3 2013
As Reported
Adjustments
Adjusted
As Reported
Adjustments
Adjusted
Total Revenue
931
931
965
965
Operating Income
111
9
a
120
98
32
c
130
Operating Margin
11.9%
12.9%
10.2%
13.5%
Interest Expense
(14)
(14)
(14)
(14)
Other Non-Operating Income (Expense)
3
3
(1)
(1)
Income before Taxes
100
9
109
83
32
115
Provision for Income Taxes
(28)
2
b
(26)
(10)
(13)
d
(23)
Net Income
72
11
83
73
19
92
Diluted Shares
186.3
186.3
186.0
186.0
Diluted EPS
0.38
$
0.06
$
0.44
$
0.39
$
0.10
$
0.49
$
Q3 YTD 2012
Q3 YTD 2013
As Reported
Adjustments
Adjusted
As Reported
Adjustments
Adjusted
Total Revenue
2,822
2,822
2,804
2,804
Operating Income
339
20
a
359
234
72
c
306
Operating Margin
12.0%
12.7%
8.3%
10.9%
Interest Expense
(41)
(41)
(41)
(41)
Other Non-Operating Income (Expense)
1
1
(2)
(2)
Income before Taxes
299
20
319
191
72
263
Provision for Income Taxes
(75)
(2)
b
(77)
(31)
(24)
d
(55)
Net Income
224
18
242
160
48
208
Diluted Shares
186.2
186.2
186.2
186.2
Diluted EPS
1.20
$
0.09
$
1.29
$
0.86
$
0.26
$
1.12
$
a
One-time separation costs and restructuring & realignment costs
b
Net tax impact of separation costs, restructuring & realignment costs and special tax
items c
Restructuring & realignment costs and special charges
d
Net tax impact of restructuring & realignment costs, special charges and special tax
items ($ Millions, except per share amounts) |
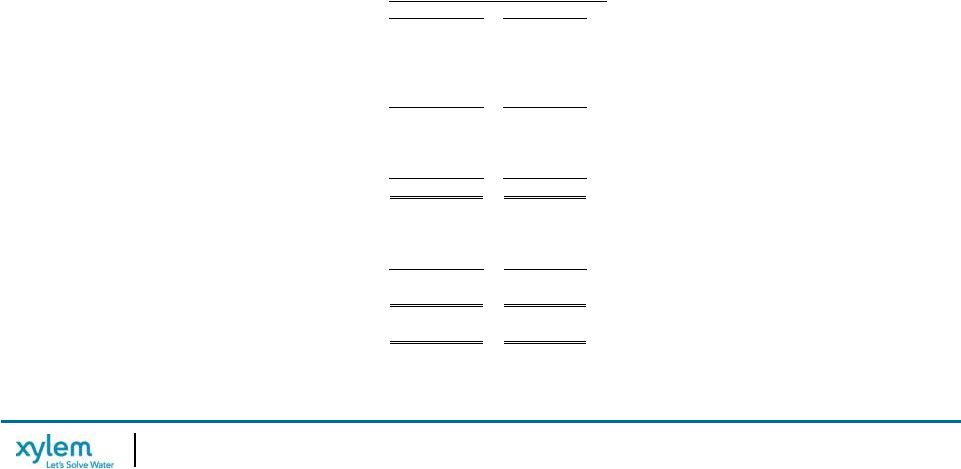
 XYLEM PROPRIETARY / CONFIDENTIAL
16
Q3 2013 EARNINGS RELEASE
NON-GAAP RECONCILIATION:
ADJ. OPERATING INCOME AND MARGIN
Q3
Q3 YTD
'13
'12
'13
'12
Total Revenue
• Total Xylem
965
931
2,804
2,822
• Water Infrastructure
619
595
1,766
1,788
• Applied Water
360
350
1,086
1,078
Operating Income
• Total Xylem
98
111
234
339
• Water Infrastructure
88
85
171
253
• Applied Water
40
43
125
135
Operating Margin
• Total Xylem
10.2%
11.9%
8.3%
12.0%
• Water Infrastructure
14.2%
14.3%
9.7%
14.1%
• Applied Water
11.1%
12.3%
11.5%
12.5%
Separation Costs
• Total Xylem
-
4
-
15
• Water Infrastructure
-
-
-
3
• Applied Water
-
1
-
2
Special Charges
• Total Xylem
20
-
20
-
• Water Infrastructure
-
-
-
-
• Applied Water
-
-
-
-
Restructuring & Realignment Costs
• Total Xylem
12
5
52
5
• Water Infrastructure
8
4
40
4
• Applied Water
4
-
12
-
Adjusted Operating Income*
• Total Xylem
130
120
306
359
• Water Infrastructure
96
89
211
260
• Applied Water
44
44
137
137
Adjusted Operating Margin*
• Total Xylem
13.5%
12.9%
10.9%
12.7%
• Water Infrastructure
15.5%
15.0%
11.9%
14.5%
• Applied Water
12.2%
12.6%
12.6%
12.7%
($ Millions)
*Adjusted Operating Income excludes restructuring & realignment costs and special charges
in 2013 and excludes restructuring & realignment costs and non-recurring
separation costs in 2012. |
 XYLEM PROPRIETARY / CONFIDENTIAL
17
Q3 2013 EARNINGS RELEASE
NON-GAAP RECONCILIATION:
FREE CASH FLOW
2013
2012
Net Cash - Operating Activities
163
$
230
$
Capital Expenditures
(91)
(81)
Free Cash Flow, including separation costs
72
149
Cash Paid for Separation Costs (incl. Capex)
-
22
Free Cash Flow, excluding separation costs*
72
$
171
$
Net Income
160
224
Separation Costs, net of tax (incl. tax friction)
-
11
Net Income, excluding separation costs*
160
$
235
$
Free Cash Flow Conversion
45%
73%
* Separation costs are not excluded in 2013
Net Cash - Operating Activities vs. Free Cash Flow
($ Millions)
Nine Months Ended |
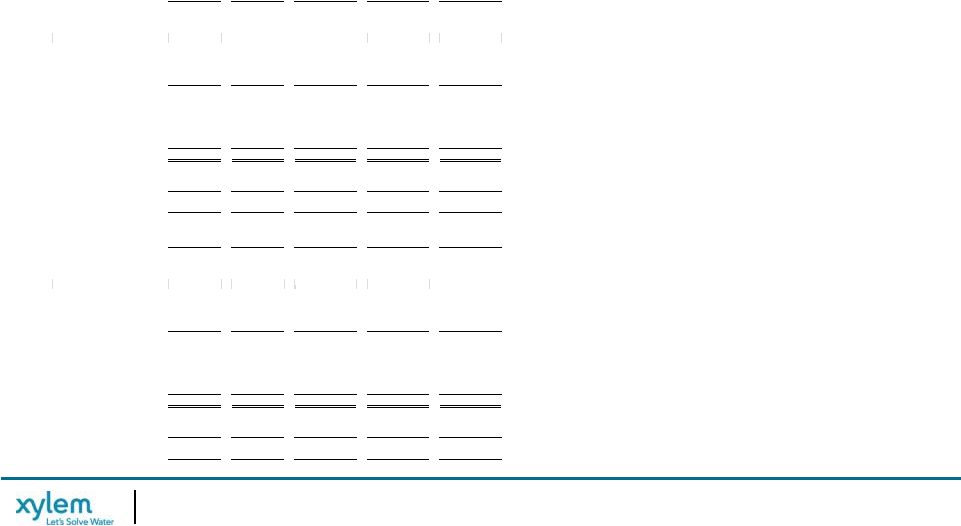 XYLEM PROPRIETARY / CONFIDENTIAL
18
Q3 2013 EARNINGS RELEASE
NON-GAAP RECONCILIATION:
XYLEM EBITDA & ADJ. EBITDA
Q1
Q2
Q3
Q4
Total
Pre-Tax Income
51
57
83
191
Interest Expense (Income), net
12
13
14
39
Depreciation
25
24
23
72
Amortization
12
13
13
38
Stock Compensation
6
6
9
21
EBITDA
106
113
142
361
Restructuring & Realignment
12
28
12
52
Special Charges
-
-
20
20
Adjusted EBITDA
118
141
174
433
Revenue
879
960
965
2,804
Adjusted EBITDA Margin
13.4%
14.7%
18.0%
15.4%
Q1
Q2
Q3
Q4
Total
Pre-Tax Income
84
115
100
89
388
Interest Expense (Income), net
13
13
12
13
51
Depreciation
23
21
24
26
94
Amortization
11
12
12
13
48
Stock Compensation
5
5
6
6
22
EBITDA
136
166
154
147
603
Separation Costs
5
6
4
7
22
Restructuring & Realignment
-
-
5
19
24
Adjusted EBITDA
141
172
163
173
649
Revenue
925
966
931
969
3,791
Adjusted EBITDA Margin
15.2%
17.8%
17.5%
17.9%
17.1%
2012
EBITDA and Adjusted EBITDA by Quarter
($ Millions)
2013 |
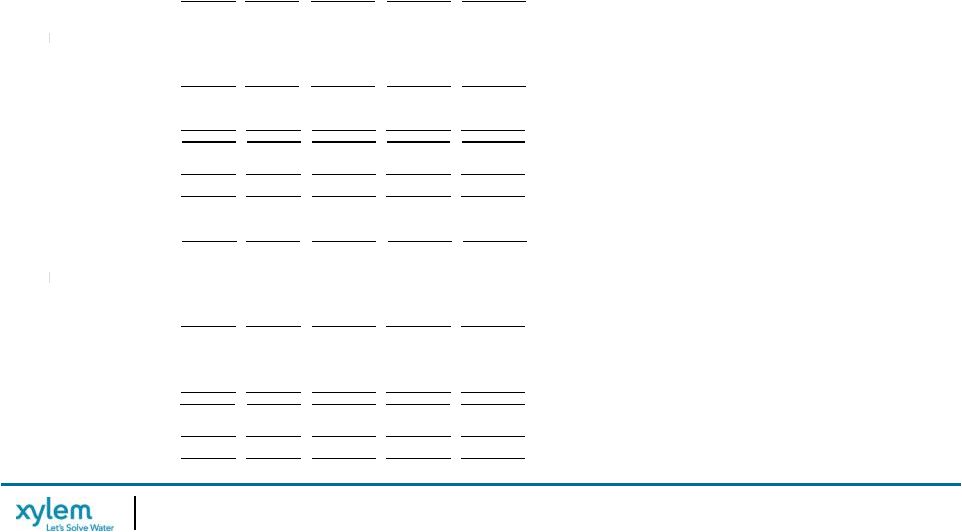 XYLEM PROPRIETARY / CONFIDENTIAL
19
Q3 2013 EARNINGS RELEASE
NON-GAAP RECONCILIATION:
WATER INFRASTRUCTURE EBITDA & ADJ. EBITDA
Q1
Q2
Q3
Q4
Total
Pre-Tax Income
42
43
87
172
Interest Expense (Income), net
-
(1)
-
(1)
Depreciation
19
17
16
52
Amortization
9
11
11
31
Stock Compensation
1
1
1
3
EBITDA
71
71
115
257
Restructuring & Realignment
10
22
8
40
Adjusted EBITDA
81
93
123
297
Revenue
551
596
619
1,766
Adjusted EBITDA Margin
14.7%
15.6%
19.9%
16.8%
Q1
Q2
Q3
Q4
Total
Pre-Tax Income
75
93
86
88
342
Interest Expense (Income), net
-
-
(1)
-
(1)
Depreciation
16
15
17
20
68
Amortization
10
9
10
10
39
Stock Compensation
1
1
3
-
5
EBITDA
102
118
115
118
453
Separation Costs
2
1
-
1
4
Restructuring & Realignment
-
-
4
15
19
Adjusted EBITDA
104
119
119
134
476
Revenue
584
609
595
637
2,425
Adjusted EBITDA Margin
17.8%
19.5%
20.0%
21.0%
19.6%
2012
2013
($ Millions) |
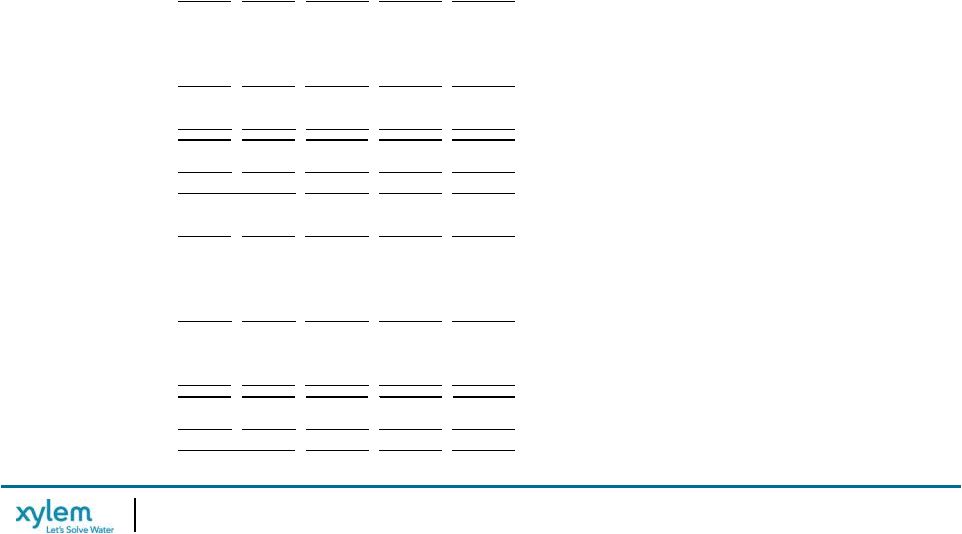 XYLEM PROPRIETARY / CONFIDENTIAL
20
Q3 2013 EARNINGS RELEASE
NON-GAAP RECONCILIATION:
APPLIED WATER EBITDA & ADJ. EBITDA
Q1
Q2
Q3
Q4
Total
Pre-Tax Income
40
45
40
125
Interest, net
-
-
-
-
Depreciation
6
5
6
17
Amortization
2
1
1
4
Stock
Compensation 1
-
1
2
EBITDA
49
51
48
148
Restructuring &
Realignment 2
6
4
12
Adjusted EBITDA
51
57
52
160
Revenue
345
381
360
1,086
Adjusted EBITDA Margin
14.8%
15.0%
14.4%
14.7%
Q1
Q2
Q3
Q4
Total
Pre-Tax Income
40
52
43
35
170
Interest, net
-
-
-
-
-
Depreciation
6
6
6
5
23
Amortization
1
1
1
2
5
Stock
Compensation 1
-
2
(1)
2
EBITDA
48
59
52
41
200
Separation Costs
1
-
1
-
2
Restructuring & Realignment
-
-
-
5
5
Adjusted
EBITDA 49
59
53
46
207
Revenue
355
373
350
346
1,424
Adjusted EBITDA Margin
13.8%
15.8%
15.1%
13.3%
14.5%
2012
2013
($ Millions) |
 XYLEM PROPRIETARY / CONFIDENTIAL
21
Q3 2013 EARNINGS RELEASE
NON-GAAP RECONCILIATION:
GUIDANCE
Illustration of Mid Point Guidance
2013 Guidance
FY '12
FY '13
As Reported
Adjustments
Adjusted
As Projected
Adjustments
Adjusted
Total Revenue
3,791
3,791
3,770
3,770
Segment Operating Income
512
30
a
542
425
73
c
498
Segment Operating Margin
13.5%
14.3%
11.3%
13.2%
Corporate Expense
69
(16)
b
53
78
(20)
d
58
Operating Income
443
46
489
347
93
440
Operating Margin
11.7%
12.9%
9.2%
11.7%
Interest Expense
(55)
(55)
(55)
(55)
Other Non-Operating Income (Expense)
-
-
(3)
(3)
Income before Taxes
388
46
434
289
93
382
Provision for Income Taxes
(91)
(13)
e
(104)
(48)
(32)
e
(80)
Net Income
297
33
330
241
61
302
Diluted Shares
186.2
186.2
186.0
186.0
Diluted EPS
1.59
$
0.18
$
1.77
$
1.30
$
0.33
$
1.63
$
Guidance
($ Millions, except per share amounts)
a
b
c
d
e
Restructuring and realignment costs incurred at the segment level
Special charges incurred at the corporate level
Net tax impact of above items, plus the addition of special tax items
One-time separation, restructuring and realignment costs incurred at the segment
level One-time separation, restructuring and realignment costs incurred at the corporate
level |
 XYLEM PROPRIETARY / CONFIDENTIAL
22
Q3 2013 EARNINGS RELEASE
NON-GAAP RECONCILIATION:
ADJUSTED OPERATING INCOME
Mid Point Guidance
2008
2009
2010
2011
2012
2013E
Revenue
3,291
2,849
3,202
3,803
3,791
3,770
Operating Income
315
276
388
395
443
347
Operating Margin
9.6%
9.7%
12.1%
10.4%
11.7%
9.2%
Restructuring, Realignment & Special Charges
41
31
15
-
24
93
Separation Costs*
-
-
-
87
22
-
Adjusted Operating Income
356
307
403
482
489
440
Adjusted Operating Margin
10.8%
10.8%
12.6%
12.7%
12.9%
11.7%
Standalone Costs
-
-
-
5
28
-
Adj. Operating Income, excl. Standalone
Costs 356
307
403
487
517
440
Adjusted Operating Margin, excl.
Standalone Costs 10.8%
10.8%
12.6%
12.8%
13.6%
11.7%
* 2013 separation costs are not excluded from adjusted operating income.
($ Millions) |