Attached files
| file | filename |
|---|---|
| 8-K - FORM 8-K - ARMSTRONG WORLD INDUSTRIES INC | d616058d8k.htm |
| EX-99.1 - EX-99.1 - ARMSTRONG WORLD INDUSTRIES INC | d616058dex991.htm |
Exhibit 99.2

| Earnings Call Presentation 3rd Quarter 2013 October 28, 2013 |

| Safe Harbor Statement Our disclosures in this presentation, including without limitation, those relating to future financial results guidance, and in our other public documents and comments contain forward-looking statements within the meaning of the Private Securities Litigation Reform Act. Those statements provide our future expectations or forecasts and can be identified by our use of words such as "anticipate," "estimate," "expect," "project," "intend," "plan," "believe," "outlook," "target," "predict," "may," "will," "would," "could," "should," "seek," and other words or phrases of similar meaning in connection with any discussion of future operating or financial performance. Forward-looking statements, by their nature, address matters that are uncertain and involve risks because they relate to events and depend on circumstances that may or may not occur in the future. As a result, our actual results may differ materially from our expected results and from those expressed in our forward-looking statements. A more detailed discussion of the risks and uncertainties that may affect our ability to achieve the projected performance is included in the "Risk Factors" and "Management's Discussion and Analysis" sections of our reports on Forms 10-K and 10-Q filed with the SEC. Forward-looking statements speak only as of the date they are made. We undertake no obligation to update any forward-looking statements beyond what is required under applicable securities law.In addition, we will be referring to non-GAAP financial measures within the meaning of SEC Regulation G. A reconciliation of the differences between these measures with the most directly comparable financial measures calculated in accordance with GAAP are included within this presentation and available on the Investor Relations page of our website at www.armstrong.com.The guidance in this presentation is only effective as of the date given, October 28, 2013, and will not be updated or affirmed unless and until we publicly announce updated or affirmed guidance. 2 |
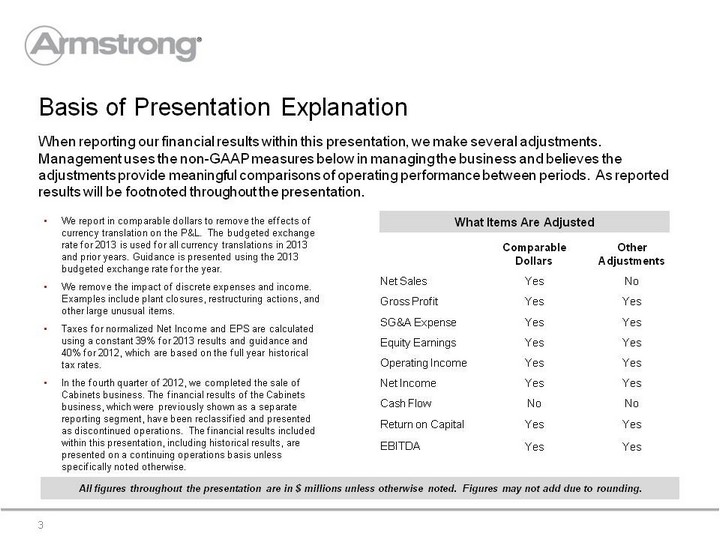
| All figures throughout the presentation are in $ millions unless otherwise noted. Figures may not add due to rounding. Basis of Presentation Explanation When reporting our financial results within this presentation, we make several adjustments. Management uses the non-GAAP measures below in managing the business and believes the adjustments provide meaningful comparisons of operating performance between periods. As reported results will be footnoted throughout the presentation. 3 We report in comparable dollars to remove the effects of currency translation on the P&L. The budgeted exchange rate for 2013 is used for all currency translations in 2013 and prior years. Guidance is presented using the 2013 budgeted exchange rate for the year. We remove the impact of discrete expenses and income. Examples include plant closures, restructuring actions, and other large unusual items. Taxes for normalized Net Income and EPS are calculated using a constant 39% for 2013 results and guidance and 40% for 2012, which are based on the full year historical tax rates.In the fourth quarter of 2012, we completed the sale of Cabinets business. The financial results of the Cabinets business, which were previously shown as a separate reporting segment, have been reclassified and presented as discontinued operations. The financial results included within this presentation, including historical results, are presented on a continuing operations basis unless specifically noted otherwise. Comparable Dollars Other Adjustments Net Sales Yes No Gross Profit Yes Yes SG&A Expense Yes Yes Equity Earnings Yes Yes Operating Income Yes Yes Net Income Yes Yes Cash Flow No No Return on Capital Yes Yes EBITDA Yes Yes What Items Are Adjusted |

| As reported Net Sales: $730 million in 2013 and $695 million in 2012As reported Operating Income: $94 million in 2013 and $109 million in 2012As reported EPS: $0.94 in 2013 and $1.24 in 2012Cash flow information includes cash flows attributable to CabinetsUnadjusted Key Metrics - Third Quarter 2013 2013 2012 Variance Net Sales (1) $735 $701 4.8% Operating Income (2) 96 111 (13.3)% % of Sales 13.0% 15.7% (270 bps) EBITDA 124 135 (8.6)% % of Sales 16.8% 19.3% (250 bps) Earnings Per Share (3) $0.87 $0.98 (10.9)% Free Cash Flow (4) 95 78 21.9% Net Debt 930 784 146 ROIC(5) 8.3% 9.2% (90 bps) 4 |

| 2013 2012 V EBITDA- Adjusted $124 $135 ($11) Depreciation and Amortization (28) (24) (4) Operating Income - Adjusted $96 $111 ($15) Foreign Exchange Movements (1) (1) - Cost Reduction Initiatives (1) (1) - Operating Income - As Reported $94 $109 ($15) Interest (Expense) (12) (14) 2 EBT $82 $95 ($13) Tax (Expense) (26) (21) (5) Net Income $56 $74 ($18) Third Quarter 2013 vs. PY- Adjusted EBITDA to Reported Net Income 5 |

| Third Quarter Sales and EBITDA by Segment - 2013 vs. PY 6 (CHART) |

| (CHART) $6 EBITDA Bridge - Third Quarter 2013 vs. Prior Year 7 ($8) ($0) $1 $11 |

| Free Cash Flow - Third Quarter 2013 vs. Prior Year 8 Cash flow information includes cash flows attributable to Cabinets ($5) $2 ($5) $26 $2 ($3) |

| As reported Net Sales: $2,059 million in 2013 and $2,006 million in 2012.As reported Operating Income: $208 million in 2013 and $229 million in 2012As reported EPS: $1.50 in 2013 and $ 2.26 in 2012.Cash flow information includes cash flows attributable to CabinetsUnadjusted 2013 Actual 2012 Actual Variance Net Sales (1) $2,064 $2,012 2.6% Operating Income (2) 221 255 (13.4)% % of Sales 10.7% 12.7% (200 bps) EBITDA 301 329 (8.7)% % of Sales 14.6% 16.4% (180 bps) Earnings Per Share (3) $1.71 $2.19 (22.0)% Free Cash Flow (4) 75 63 18.6% Net Debt 930 784 146 ROIC(5) 8.3% 9.2% (90 bps) Key Metrics - September YTD 2013 9 |

| (CHART) September YTD Sales and EBITDA by Segment - 2013 vs. 2012 10 |

| (CHART) $3 EBITDA Bridge - September YTD 2013 vs. Prior Year 11 ($12) ($5) $13 $4 |

| (CHART) Free Cash Flow - September YTD 2013 vs. Prior Year 12 ($22) ($19) ($2) ($6) |

| 2013 Estimate Range (1) 2013 Estimate Range (1) 2013 Estimate Range (1) 2012 (1) Variance Variance Variance Net Sales(2) 2,700 to 2,740 2,623 3% to 4% Operating Income(3) 260 to 280 302 (14)% to (7)% EBITDA 370 to 390 402 (8)% to (3)% Earnings Per Share(4) $2.00 to $2.20 $2.53 (21)% to (13)% Free Cash Flow 80 to 110 89 (10)% to 24% Guidance and 2012 results are presented using 2013 budgeted foreign exchange rates2012 and 2013 net sales include the impact of foreign exchangeAs reported Operating Income: $250- $270 million in 2013 and $271 million 2012As reported earnings per share: $1.80 - $2.00 in 2013 and $2.41 in 2012 Key Metrics - Guidance 2013 13 |

| 2013 Financial Outlook $55 - $65 million vs. 2012Adjusted Gross Margin (100) to (150) bps vs. 201216.0% to 16.25% of salesDown $10 million; 60% manufacturing, 40% SG&A $0 - $5 million vs. 2012 $10 - $20 million; Adjusted long-term ETR of ~39%(2) Sales(1) $645- $685 million; EBITDA $70 - $90 million $180 - $200 million $10 million Raw Material & Energy Inflation* Manufacturing Productivity U.S. Pension Credit Earnings from WAVE Cash Taxes/ETR Q4 Capital Spending Exclusions from EBITDA* 14 Net sales include foreign exchange impactAs reported ETR of 42% for 2013 * Changed from July Outlook SG&A* |

| Growth Engine Financial Performance 15 Profit growth lags sales as plants start up, but catch up when utilization increases Market growth plus AS acquisition and JV drives historic growthPlant openings, priority sales and marketing investments, and tactical acquisitions drive future growth 12% CAGR 19% CAGR |
| Appendix 16 |

| CabinetsAnnounced sale in Q3 2012 and finalized sale in Q4 2012Treated as discontinued operation starting with Q3 2012PatriotCompleted sale in Q3 2012Results included in the Wood Flooring segment 17 Divested Businesses Patriot impact on Y-o-Y Comparisons Q3 2012 Q4 2012 2012 1H 2013 Q3 2013 2013 Net Sales $3-$4M $7 - $8M $10 - $12M $18 - $20M $6 -$7M $24-$27M EBITDA -- Minimal -- -- Minimal -- -- Minimal -- -- Minimal -- -- Minimal -- -- Minimal -- |
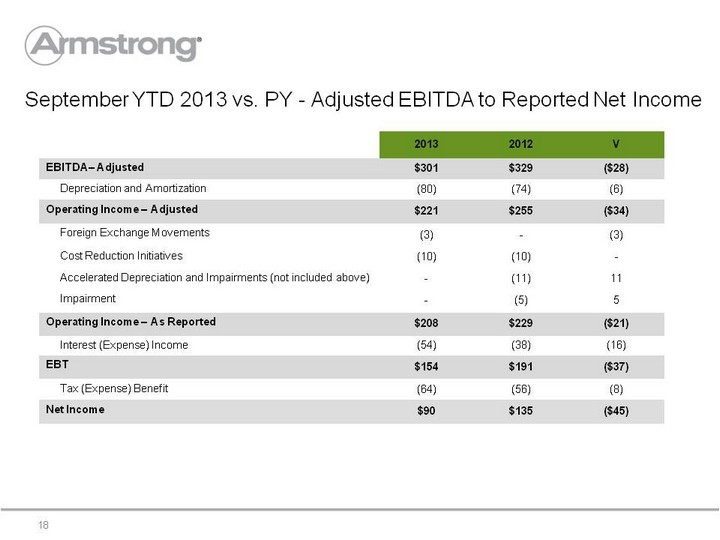
| 2013 2012 V EBITDA- Adjusted $301 $329 ($28) Depreciation and Amortization (80) (74) (6) Operating Income - Adjusted $221 $255 ($34) Foreign Exchange Movements (3) - (3) Cost Reduction Initiatives (10) (10) - Accelerated Depreciation and Impairments (not included above) - (11) 11 Impairment - (5) 5 Operating Income - As Reported $208 $229 ($21) Interest (Expense) Income (54) (38) (16) EBT $154 $191 ($37) Tax (Expense) Benefit (64) (56) (8) Net Income $90 $135 ($45) September YTD 2013 vs. PY - Adjusted EBITDA to Reported Net Income 18 |

| 2013 Estimate Range 2013 Estimate Range 2013 Estimate Range Adjusted Operating Income 260 to 280 D&A 110 110 110 Adjusted EBITDA 370 to 390 Changes in Working Capital (10) to (20) Capex (180) to (200) Interest Expense (65) to (70) Cash Taxes (10) to (20) Other, including cash payments for restructuring and one-time items (10) (10) (10) Free Cash Flow 80 to 110 Adjusted Operating Income to Free Cash Flow 19 |

| Third Quarter Third Quarter Third Quarter Third Quarter Third Quarter Third Quarter Third Quarter Third Quarter Third Quarter Third Quarter 2013 Reported Comparability(1) Adjustments FX(2) Adj 2013 Adjusted 2012 Reported Comparability(1) Adjustments FX(2) Adj 2012 Adjusted 2012 Adjusted Net Sales 730 - 5 735 695 - 6 701 701 Operating Income 94 1 1 96 109 1 1 111 111 EPS $0.94 ($0.08) $0.01 $0.87 $1.24 ($0.27) $0.01 $0.98 $0.98 September YTD September YTD September YTD September YTD September YTD September YTD September YTD September YTD September YTD September YTD 2013 Reported Comparability(1) Adjustments FX(2) Adj 2013 Adjusted 2012 Reported Comparability(1) Adjustments FX(2) Adj FX(2) Adj 2012 Adjusted Net Sales 2,059 - 5 2,064 2,006 - 6 6 2,012 Operating Income 208 10 3 221 229 26 - - 255 EPS $1.50 $0.18 $0.03 $1.71 $2.26 ($0.07) $- $- $2.19 See earnings press release and 10-Q for additional detail on comparability adjustmentsEliminates impact of foreign exchange movements Consolidated Results 20 |

| Third Quarter Third Quarter Third Quarter Third Quarter Third Quarter Third Quarter Third Quarter 2013 Reported Comparability(1) Adjustments 2013 Adjusted 2012 Reported Comparability(1) Adjustments 2012 Adjusted Building Products 87 (2) 85 81 1 82 Resilient Flooring 22 2 24 25 1 26 Wood Flooring 3 - 3 14 - 14 Unallocated Corporate (Expense) Income (18) 2 (16) (11) - (11) September YTD September YTD September YTD September YTD September YTD September YTD September YTD 2013 Reported Comparability(1) Adjustments 2013 Adjusted 2012 Reported Comparability(1) Adjustments 2012 Adjusted Building Products 211 1 212 178 23 201 Resilient Flooring 46 9 55 58 2 60 Wood Flooring 6 - 6 30 - 30 Unallocated Corporate (Expense) Income (55) 3 (52) (37) 1 (36) Segment Operating Income (Loss) 21 Eliminates impact of foreign exchange movements and non-recurring items; see earnings press release and 10-Q for additional detail. |

| Third Quarter Third Quarter September YTD September YTD ($ millions) 2013 2012 2013 2012 Net cash from operations $119 $111 $162 $141 Net cash (used for) investing (24) (19) (87) (62) Add back (subtract) adjustments to reconcile to free cash flow Restricted cash - - - (2) Divestiture - (14) - (14) Free Cash Flow $95 $78 $75 $63 Cash Flow 22 Cash flow information includes cash flows attributable to Cabinets |