Attached files
| file | filename |
|---|---|
| 8-K - FORM 8-K - OUTERWALL INC | d616822d8k.htm |
| EX-99.1 - EX-99.1 - OUTERWALL INC | d616822dex991.htm |
Exhibit 99.2
Outerwall Inc. 2013 Third Quarter Earnings
Prepared Remarks from CEO J. Scott Di Valerio and CFO Galen C. Smith
October 24, 2013
Outerwall Inc. issued a press release today, October 24, 2013, announcing financial results for the 2013 third quarter ended September 30, 2013. These prepared remarks provide additional information related to the company’s 2013 third quarter operating and financial performance and 2013 fourth quarter and full year guidance. The prepared remarks also include supplementary slides in Appendix B.
CEO J. Scott Di Valerio and CFO Galen C. Smith will host a conference call today at 2:00 p.m. PDT to answer questions related to the company’s business performance, financial results and guidance.
The Q3 press release, prepared remarks and conference call webcast are available on the Investor Relations section of Outerwall’s website at ir.outerwall.com.
Safe Harbor for Forward-Looking Statements
Certain statements in these prepared remarks are “forward-looking statements” within the meaning of the Private Securities Litigation Reform Act of 1995. The words “believe,” “estimate,” “expect,” “intend,” “anticipate,” “goals,” variations of such words, and similar expressions identify forward-looking statements, but their absence does not mean that the statement is not forward-looking. The forward-looking statements in this release include statements regarding Outerwall Inc.’s anticipated growth and future operating results, including 2013 fourth quarter and full year results, its net leverage target and debt and credit relationships, as well as stock repurchases and review of new ventures. Forward-looking statements are not guarantees of future performance and actual results may vary materially from the results expressed or implied in such statements. Differences may result from actions taken by Outerwall Inc. or Redbox, as well as from risks and uncertainties beyond Outerwall Inc.’s control. Such risks and uncertainties include, but are not limited to:
| • | competition from other digital entertainment providers, |
| • | the ability to achieve the strategic and financial objectives for our entry into new businesses, including ecoATM and Redbox Instant™ by Verizon, |
| • | failure to receive the expected benefits of the NCR relationship, |
| • | our ability to obtain future financings and refinancing, repurchase stock and the availability of an open trading window, |
| • | the termination, non-renewal or renegotiation on materially adverse terms of our contracts with our significant retailers and suppliers, |
| • | payment of increased fees to retailers, suppliers and other third-party providers, including financial service providers, |
| • | the timing of new DVD releases and the inability to receive delivery of DVDs on the date of their initial release to the general public, or shortly thereafter, or in sufficient quantity, for home entertainment viewing, |
| • | noteholders electing to convert our convertible notes, |
| • | the effective management of our content library, |
| • | the ability to attract new retailers, penetrate new markets and distribution channels and react to changing consumer demands, |
| • | the ability to adequately protect our intellectual property, and |
| • | the application of substantial federal, state, local and foreign laws and regulations specific to our business. |
The foregoing list of risks and uncertainties is illustrative, but by no means exhaustive. For more information on factors that may affect future performance, please review “Risk Factors” described in our most recent Annual Report on Form 10-K and any subsequent Quarterly Reports on Form 10-Q filed with the Securities and Exchange Commission. These forward-looking statements reflect Outerwall Inc.’s expectations as of the date of these prepared remarks. Outerwall Inc. undertakes no obligation to update the information provided herein.
©2013 Outerwall Inc. All Rights Reserved. These materials may not be reproduced, altered or distributed without the express written consent of Outerwall Inc.
Outerwall Inc. 2013 Third Quarter Earnings
Prepared Remarks from CEO J. Scott Di Valerio and CFO Galen C. Smith
October 24, 2013
Use of Non-GAAP Financial Measures
Non-GAAP measures may be provided as a complement to results provided in accordance with United States generally accepted accounting principles (“GAAP”).
We use the following non-GAAP financial measures to evaluate our financial results:
| • | Core adjusted EBITDA; |
| • | Core diluted earnings per share (“EPS”); and |
| • | Free cash flow. |
These measures, the definitions of which are presented in Appendix A, are non-GAAP because they exclude certain amounts which are included in the most directly comparable measure calculated and presented in accordance with GAAP. Our non-GAAP financial measures are not meant to be considered in isolation or as a substitute for our GAAP financial measures and may not be comparable with similarly titled measures of other companies.
Core and Non-Core Results
We distinguish our core activities, those associated with our primary operations which we directly control, from non-core activities. Non-core activities are primarily nonrecurring events or events we do not directly control. Our non-core adjustments include i) acquisition costs primarily related to the NCR Asset Acquisition and acquisition of ecoATM, Inc., ii) a gain on the grant of a license to use certain Redbox trademarks to Redbox Instant™ by Verizon, iii) income or loss from equity method investments, which represents our share of income or loss from entities we do not consolidate or control and includes the impacts of the gain on re-measurement of our previously held equity interest in ecoATM upon acquisition and iv) compensation expense for rights to receive cash issued in conjunction with our acquisition of ecoATM and attributable to post-combination services as they are fixed amount acquisition related awards and not indicative of the directly controllable future business results (“Non-Core Adjustments”).
We believe investors should consider our core results because they are more indicative of our ongoing performance and trends, are more consistent with how management evaluates our operational results and trends, provide meaningful supplemental information to investors through the exclusion of certain expenses which are either non-recurring or may not be indicative of our directly controllable business operating results, allow for greater transparency in assessing our performance, help investors better analyze the results of our business and assist in forecasting future periods.
Additional information and reconciliations of the non-GAAP financial measures are included in Appendix A.
Page 2
©2013 Outerwall Inc. All Rights Reserved. These materials may not be reproduced, altered or distributed without the express written consent of Outerwall Inc.
Outerwall Inc. 2013 Third Quarter Earnings
Prepared Remarks from CEO J. Scott Di Valerio and CFO Galen C. Smith
October 24, 2013
Outerwall: Compelling Opportunities to Create Value
Q3 Quarterly Overview1
| • | Rentals and revenue per kiosk increased year over year for the first time since Q1 2012 |
| • | Rented record 199.5 million movies and video games, up 13.1% year over year |
| • | Repurchased approximately 408,000 shares of common stock for $23.6 million, for a total of $95.0 million of original $100.0 million share repurchase target for 2013 |
| • | Closed acquisition of ecoATM and began integrating the business |
| • | Announced commitment to return 75%–100% of annual free cash flow to shareholders, including plans to repurchase $150 million of additional shares by early Q1 2014, with $100 million occurring in Q4 |
| • | Refined target leverage ratio to 1.75x–2.25x net debt to core adjusted EBITDA2 and expects to establish that level in Q4 2013 |
A summary of Outerwall Inc.’s consolidated results for the third quarter ended September 30, 2013, follows:
| Consolidated revenue |
$ | 587.4 million | ||
| Net income |
$ | 82.7 million | ||
| Core adjusted EBITDA2 |
$ | 110.5 million | ||
| Diluted EPS |
$ | 2.95 | ||
| Core diluted EPS2 |
$ | 0.97 | ||
| Net cash provided by operating activities |
$ | 61.7 million | ||
| Free cash flow2 |
$ | 21.8 million |
Consolidated revenue for the third quarter rose 9.3% to $587.4 million from $537.6 million in the prior year, driven by revenue growth in our Redbox segment of 7.0%, steady growth of 2.6% in our Coinstar segment and incremental revenue generated by ecoATM, which is now included in our New Ventures segment. The year over year changes in the Redbox segment were volume driven, while the Coinstar business exhibited higher revenue per transaction.
| 1 | In discussing financial results, the comparisons we make will be Q3 of 2013 versus Q3 of 2012, unless we state otherwise |
| 2 | Refer to Appendix A for a discussion of non-GAAP financial measures |
Page 3
©2013 Outerwall Inc. All Rights Reserved. These materials may not be reproduced, altered or distributed without the express written consent of Outerwall Inc.
Outerwall Inc. 2013 Third Quarter Earnings
Prepared Remarks from CEO J. Scott Di Valerio and CFO Galen C. Smith
October 24, 2013
Core adjusted EBITDA for the same period was lower as higher direct operating expenses offset revenue gains. Direct operating expenses rose 16.3% year over year, primarily driven by a 13.2% increase in direct operating expenses in the Redbox segment. As we previously announced, heightened promotional activity impacted Redbox gross margins in the quarter. However, as we will discuss further, we expect Redbox margins to be back in line with our segment margin targets of 20%–25%. In the Coinstar segment, direct operating expenses were up 3.5% as a result of increased revenue share and processing costs. In our New Ventures segment, the inclusion of ecoATM acquisition costs in the quarter impacted our segment operating loss by $4.0 million.
Net income of $82.7 million resulted in GAAP diluted EPS for the quarter of $2.95 per share versus $36.8 million and $1.14 per share, respectively, in the third quarter of 2012. In addition to items influencing core adjusted EBITDA, in Q3 we recognized a $68.4 million pre-tax gain on the re-measurement of our previously held 23% equity interest in ecoATM and approximately $4.0 million of pre-tax costs associated with the acquisition of ecoATM.
Core diluted EPS from continuing operations was $0.97 compared with $1.26 last year.
Additional Q3 consolidated metrics
| • | Total net interest expense was $8.4 million including $1.1 million of non-cash interest expense |
| • | Effective tax rate for Q3 was 13.5%. The lower effective tax rate was primarily due to the reported $68.4 million non-taxable gain related to the re-measurement of our previously held equity interest in ecoATM |
| • | Cash and cash equivalents of $215.2 million, including $85.1 million which is cash owed to our retail partners in relation to our Coinstar coin-counting kiosks |
| • | Total outstanding debt of $677.2 million including capital leases |
| • | Net debt to core adjusted EBITDA ratio of 1.4x |
Cost Structure and Capital Allocation Overview
Both Coinstar and Redbox are maturing to single digit revenue growth, with growth at Coinstar primarily being driven by price increases, and growth at Redbox coming from improved CRM efforts, organic rental growth, the benefit of additional slots from the Vertical Merchandising Zone (VMZ) initiative, continued mix shift to Blu-ray and video games, and adjustments to content purchases. As these businesses continue to mature, we are managing them for profitability and cash flow by better leveraging resources and shared services within the businesses and by reducing direct operating and general and administrative expenses. As an example, we reduced expected content and G&A expenses by $21 million in Q4 and we
Page 4
©2013 Outerwall Inc. All Rights Reserved. These materials may not be reproduced, altered or distributed without the express written consent of Outerwall Inc.
Outerwall Inc. 2013 Third Quarter Earnings
Prepared Remarks from CEO J. Scott Di Valerio and CFO Galen C. Smith
October 24, 2013
expect to drive additional savings in future periods. For our New Ventures segment, we are focused on scaling ecoATM, which we believe will drive both revenue and earnings growth, and we continue to conduct a strategic review of the other ventures in the segment.
In 2014, excluding the capital expenditures (CAPEX) necessary to scale ecoATM, we expect to meaningfully reduce CAPEX related to corporate infrastructure, and the Redbox and New Ventures segments, as we have made investments in our infrastructure over the past few years to support the size and growth of the company.
We will continue to take a disciplined approach to capital allocation, investing at appropriate levels to support our businesses while supporting growth initiatives, like ecoATM, where the expected risk adjusted returns increase value for our shareholders. All investments—whether internal, external or capital returns to shareholders—are thoroughly reviewed to ensure capital is allocated to the highest return opportunities and that we are maximizing value for our shareholders.
Capital Returns
Consistent with our focus on delivering enhanced shareholder value and allocating capital to the highest return opportunities, we announced today plans to return 75% to 100% of our annual free cash flow to shareholders. Given current valuations, we believe share repurchases deliver the most compelling capital return. However, we are continuing to analyze the proper time to introduce a dividend as part of the mix.
We have also announced a repurchase plan totaling $150 million of common stock, $100 million of which we plan to execute before the end of the fourth quarter with the balance of the repurchases likely to occur in early Q1 2014. Based on this plan, we will have returned a total of $195 million to shareholders in 2013, which represents a return of more than 100% of free cash flow generated in 2013.
Capital Structure
In February at our Analyst Day, we indicated that we would not exceed net debt to EBITDA of 2.5x. Today we are further refining that to a target net leverage ratio of 1.75x to 2.25x net debt to core adjusted EBITDA. We believe this is an appropriate target, particularly given the strength of our cash flows and the investments we have made in our infrastructure over the past few years, which provide the foundation we need moving forward. We finished Q3 2013 at 1.4x net leverage. To get within the target leverage range, we expect to refinance existing debt and raise additional revolver capacity in Q4. The intended use of proceeds will be general corporate purposes and share repurchases. We believe that this leverage ratio enables us to drive further growth and value creation in the business and return capital to our shareholders within our covenant restrictions.
Page 5
©2013 Outerwall Inc. All Rights Reserved. These materials may not be reproduced, altered or distributed without the express written consent of Outerwall Inc.
Outerwall Inc. 2013 Third Quarter Earnings
Prepared Remarks from CEO J. Scott Di Valerio and CFO Galen C. Smith
October 24, 2013
Redbox
Redbox Q3 Results Summary
| • Revenue |
$ | 491.7 million | ||
| • Rentals |
199.5 million | |||
| • Net revenue per rental |
$ | 2.46 | ||
| • Segment operating income |
$ | 91.0 million | ||
| • Segment operating margin |
18.5 | % | ||
| • Gross margin |
57.1 | % | ||
| • Unique credit cards renting in quarter |
42 million |
Redbox Strategy
As Redbox matures, it is moving from years of significant install growth to a focus on driving customer behavior and incremental rental increases in our existing network. Example initiatives include more targeted, personalized marketing and promotions, changes in content offerings, and encouraging mix shift to Blu-ray. We are making progress on these initiatives, as demonstrated by the record 199.5 million rentals in the quarter and the record nearly 42 million unique credit and debit cards used in the quarter. Further, we grew our customer base by 7.9% while the kiosk base was up 2.8% year over year. While discounting promotions did contribute to margin pressure at Redbox during the quarter, it also drove traffic and creates an opportunity for us to convert new users to the coveted high frequency renters going forward. As stated, we are also keenly focused on driving bottom-line performance and maximizing the cash flow in this business. To that end, we are actively working to reduce costs across the business and in our support services to be in line with our expected growth levels.
Redbox Segment Operating Results
In Q3 Redbox revenue was $491.7 million, an increase of 7.0% versus Q3 2012. During the quarter, we generated 199.5 million rentals, the highest number of rentals in a quarter and up 13.1% year over year. The growth in rentals benefited from an improved content slate and a lack of competition from the Summer Olympics as we had experienced in 2012. Rental performance was also supported by continued strong performance in Blu-ray and video games, which posted year over year rental growth of 71.5% and 48.2%, respectively.
Rental growth also benefited from increased discounting activity in July. The longer-term business strategy is to move toward personalized communication of title recommendations and offers to maximize revenue per customer. However, in July, these customer programs were still in development, and historical promotional tools were leveraged in an attempt to drive incremental revenue.
Page 6
©2013 Outerwall Inc. All Rights Reserved. These materials may not be reproduced, altered or distributed without the express written consent of Outerwall Inc.
Outerwall Inc. 2013 Third Quarter Earnings
Prepared Remarks from CEO J. Scott Di Valerio and CFO Galen C. Smith
October 24, 2013
The programs did lead to increased traffic, higher rentals and higher revenue per kiosk. However, these gains were more than offset by the lower average check of $2.39 in July and an increase in single night rentals, which totaled 59.3% for the quarter, a 1.2 percentage point increase versus Q3 2012 and a 2.1 percentage point increase versus Q2 2013.
As we adjusted promotional levels throughout the quarter, we saw a recovery in the Redbox business. In particular, average check improved to $2.57 in September and the percentage of single night rentals decreased from 59.6% in July to 59.0% in September.
We continue to adapt and adjust our marketing programs based on results. As we scale our CRM programs, we are improving and aligning the level of discounts with product strength and seasonal demand, with a focus on personalizing promotions to drive optimal performance as well as grow our customer base as shown this quarter.
Gross margin for Q3 was 57.1%, down 6.4 percentage points from Q3 2012. We expected some margin percentage compression compared to last year as 2013 had a higher percentage of theatrical product, which carries a higher cost than direct to video product. Additional factors that reduced gross margin relative to expectations included the effect of the discounting promotion, as previously discussed, and the increase in Blu-ray spend as the format continues to gain popularity. Blu-ray content typically has a negative impact on gross margin percentage but a positive impact on gross margin dollars. We have adjusted our purchases in Q4 to better align with our current revenue expectations and both the mix of studio content and timing of releases is favorable to a year ago.
Same store sales were up 2.1% for the quarter, an improvement of 8.9 percentage points from Q2 2013, driven by September performance, which came in at 5.7%. The growth was driven by content strength, promotional activity, and the continued revenue growth of Blu-ray and video games, as well as the continued ramping of the kiosks installed last year.
We have regularly reported on market share data and total physical rental volume utilizing NPD’s Video Watch database. On September 30, 2013, NPD restated their data for 2013 and their data no longer reflects our reported actual performance. In fact, despite the information being readily available, we have determined their data is 10% to 20% lower than our actual reported rentals. As a result, we are evaluating new syndicated data sources to augment our proprietary research to track changes in the home entertainment industry and hope to provide a market share metric again in future periods.
Page 7
©2013 Outerwall Inc. All Rights Reserved. These materials may not be reproduced, altered or distributed without the express written consent of Outerwall Inc.
Outerwall Inc. 2013 Third Quarter Earnings
Prepared Remarks from CEO J. Scott Di Valerio and CFO Galen C. Smith
October 24, 2013
Continued Strong Blu-ray and Video Games Performance
Blu-ray performance continues to be strong, with revenue growing 61% year over year, representing 15.3% of revenue in Q3. Blu-ray was 13.0% of rental volume in the quarter, up from 8.6% in the prior year. Top performing titles in the quarter included Olympus Has Fallen, Identity Thief, G.I. Joe: Retaliation, and World War Z, all of which achieved over 1 million rentals during the quarter. In fact, World War Z became the first Blu-ray title to reach 1 million rentals in its first two weeks. We have also seen continued performance from late Q2 releases including The Call, Oz the Great and Powerful, and Snitch. This format continues to provide a great opportunity for the business due to its ability to drive incremental margin dollars.
Video games performed well in Q3 accounting for 4.4% of revenue, reflecting strong revenue growth of 48.7% versus last year driven by an improved product allocation and purchasing strategy. Video games represented 1.9% of rentals, up from 1.4% in the prior year.
Redbox Key Initiatives
Customer strategy: In Q3, Redbox had its highest number of unique cards used with nearly 42 million cards renting at least once in the quarter. This was an increase of 3 million cards or 8% year over year and serves as a good base for continued rental growth.
While customer growth has been an important goal for Redbox, we are also very focused on growing customer frequency or rental visits per customer. Q3 frequency was up slightly year over year and sequentially from Q2 2013 after being down slightly in the first half of 2013. We attribute the improvement in customer frequency to the personalization of our offers and title recommendations from our CRM strategies.
In previous quarters, we have described the strategic importance of our high frequency renters, our most frequent customers who make up approximately 25% of our customer base and approximately 60% of our total revenue. The high frequency segment drives the overall growth of our business and many of our customer-facing strategies are geared towards this segment. We experienced strong growth in our high frequency segment in Q3, adding 1.4 million new customers.
Redbox Instant™ by Verizon: Redbox Instant by Verizon continues to see increased customer acquisition levels and service engagement, with month over month increases in time spent and frequency renting at the kiosks and viewing content through streaming. Redbox Instant has expanded service availability and in Q3 launched on Roku, reaching millions of additional customers. Redbox Instant is launching on PS3 in October and will be available on PS4 when it launches in November. Redbox Instant is working with its parent companies and partners to promote the service via web, CRM, in-store, and kiosk programs.
Page 8
©2013 Outerwall Inc. All Rights Reserved. These materials may not be reproduced, altered or distributed without the express written consent of Outerwall Inc.
Outerwall Inc. 2013 Third Quarter Earnings
Prepared Remarks from CEO J. Scott Di Valerio and CFO Galen C. Smith
October 24, 2013
Canada: We remain on track to hit our target of up to 1,000 installs in Canada this year. During Q3 2013 we executed contracts with Sobeys, Tim Horton’s and 7-Eleven, and installed approximately 240 kiosks. Aided awareness of the Redbox brand in Canada reached 58% in August 2013, up from 33% in June 2012. For the remainder of 2013, the strategic priorities for the Canadian business will be focused on building out the network with the appropriate number of kiosks in the right geographies, ensuring the appropriate content and inventory in the kiosks, providing better utilization of our field operations, and deploying marketing programs that drive trial and customer acquisition.
Vertical Merchandising Zone Enhancement (VMZ): The VMZ enhancement increases our capacity per kiosk by more than 80 slots, enabling us to provide a greater selection of titles to our customers. At the end of the third quarter, approximately 34,000 VMZ retrofits were complete and we are on track to complete all retrofits by the end of October. Upon completion, approximately 40,000 kiosks or 90% of the network will be operating with VMZs. We continue to experience positive momentum in rentals from the increased capacity, allowing us to get additional turns on existing inventory.
Coinstar
Coinstar Q3 Results Summary
| • | Revenue was $79.6 million |
| • | Average transaction was $41.92 |
| • | Same store sales growth was 0.4% |
| • | Segment operating income was $27.6 million |
| • | Segment operating margin was 34.7% |
Coinstar Segment Operating Results
Coinstar reported segment revenue of $79.6 million, an increase of $2.0 million, or 2.6%. The results were driven by a 5.5% increase in average transaction size to $41.25. Same store sales were up slightly at 0.4%, driven by an increase in U.S. same store sales partially offset by a decline in Canada. The lower same store sales in Canada are the result of the Royal Canadian Mint’s penny reclamation efforts, resulting in less frequent but higher value customer engagement in this market. The installed base of kiosks ended the quarter at 20,800, compared with 20,300 in the previous year, with the increase primarily due to the rollout of kiosks under our agreement with TD Canada Trust and Loblaws.
Page 9
©2013 Outerwall Inc. All Rights Reserved. These materials may not be reproduced, altered or distributed without the express written consent of Outerwall Inc.
Outerwall Inc. 2013 Third Quarter Earnings
Prepared Remarks from CEO J. Scott Di Valerio and CFO Galen C. Smith
October 24, 2013
Coinstar segment operating income was $27.6 million, compared with $27.9 million a year ago, and segment operating margin was 34.7%, down from 36.0% a year ago. The decrease in segment operating margin reflects increased direct operating expenses, primarily the result of higher revenue share expense attributable to both revenue growth and increased revenue share rates resulting from certain contract renewals. The price increase announced several weeks ago will help offset the revenue share rate increases beginning in Q4.
Price Increase
Effective October 1, 2013, we increased the coin voucher product rate to 10.9% for all U.S. grocery retail locations. Starting in June 2012, we conducted extensive consumer survey research around price sensitivity. Results showed that prices were inelastic and thus was followed with a six-market test employing a variety of price points. Upon successful completion of the test, which did not demonstrate a meaningful impact to volume, we made the decision to move forward with the price increase, which was implemented to offset increased operating costs—such as revenue share payments to retailers, transportation and processing expenses. The last price increase was in February 2010.
New Ventures
As we announced on September 16, we have accelerated our review of our New Ventures portfolio to ensure that the cost structure is best aligned with our value creation objectives. While overall we believe that automated retail offers great business opportunities as new technologies and business models disrupt traditional industries, we remain keenly focused on prudently allocating capital to maximize value. We expect to complete this review by the end of 2013, and anticipate a significantly reduced investment in New Ventures, with the exception of ecoATM, which the team will focus on scaling.
As we have previously discussed, we have already refined the development process used for a new venture, which will reduce the investment for existing and future concepts and shorten the timeframe for expected returns. The expected return on a risk-adjusted basis for any new venture must exceed other opportunities, such as a return of capital to shareholders, for us to consider making the investment.
During the quarter, we closed the acquisition of the remaining stake of ecoATM and continued to expand the business through approximately 100 kiosk installs in additional mall locations as well as test locations in mass and large format grocery. We remain on track for upwards of 900 total installs before the end of the year. As noted in September, kiosks are performing slightly ahead of expectations as consumers continue to respond favorably to receiving instant cash for recycling their used electronics. We are focused on integrating and scaling the business in the coming months. During the quarter, we completed our process to determine the purchase price accounting and recorded $41.4 million to intangibles that will amortize over the next 5 years and $264.2 million to goodwill.
Page 10
©2013 Outerwall Inc. All Rights Reserved. These materials may not be reproduced, altered or distributed without the express written consent of Outerwall Inc.
Outerwall Inc. 2013 Third Quarter Earnings
Prepared Remarks from CEO J. Scott Di Valerio and CFO Galen C. Smith
October 24, 2013
New Ventures Segment Operating Results
Our New Ventures segment reported revenue of $16.0 million in Q3, compared with $0.4 million last year. The higher revenue primarily reflects the inclusion and expansion of the ecoATM business during the quarter. Segment operating loss was $9.1 million in Q3, compared with $6.5 million in Q3 2012, driven by $4.0 million in acquisition costs related to the ecoATM business. During the quarter we also made the decision to write-off the remaining assets of the Orango business, which increased depreciation in the quarter by $2.6 million. We have no remaining assets attributed to Orango on the balance sheet.
Capital Expenditures
We discuss our CAPEX on an accrual basis rather than a cash basis; we believe this better aligns the reported CAPEX to activities during the quarter driving the expenditures. In Q3, our total investment in CAPEX was $31.4 million.
In Q3, Redbox continued to focus on maximizing productivity in the U.S. through optimizing the kiosk network and our expansion in Canada. Redbox installed approximately 170 gross new kiosks and removed approximately 370 kiosks in the U.S. We also expanded our VMZ retrofits to 34,000 kiosks by the end of the quarter, which made available an additional 2.7 million slots, enabling us to provide a greater selection of titles to our customers. We added approximately 240 new installations in Canada in Q3, bringing the total to approximately 700. The net result was 45 net new kiosk installations. Redbox “New” CAPEX includes kiosks purchased during the quarter that will be installed in Q4 and beyond.
The Coinstar line of business added approximately 50 net new installations in Q3, including 40 related to our kiosk installs in Canada, and 75 gift card exchange kiosks.
New Ventures “New” CAPEX is comprised primarily of kiosks and related parts, which we purchase in advance of manufacturing to support growth in our newly acquired ecoATM business and other new ventures. Since the acquisition of ecoATM closed, we have installed approximately 100 new ecoATM kiosks in the market.
Corporate CAPEX totaled $2.0 million for the quarter and relates primarily to investments in software and hardware to support our businesses.
Page 11
©2013 Outerwall Inc. All Rights Reserved. These materials may not be reproduced, altered or distributed without the express written consent of Outerwall Inc.
Outerwall Inc. 2013 Third Quarter Earnings
Prepared Remarks from CEO J. Scott Di Valerio and CFO Galen C. Smith
October 24, 2013
Share Repurchase
In Q3, we repurchased $23.6 million of Outerwall common stock on the open market, representing approximately 407,800 shares at an average price of $57.91. At the end of Q3, there was $300.4 million remaining under the Board’s aggregate stock repurchase authorization following $95 million of share repurchases year to date.
As mentioned earlier, we expect to repurchase an additional $150 million of common stock, with $100 million expected to be repurchased before the end of Q4 and the balance occurring early in Q1 of 2014.
Non-Core Results
During Q3, pre-tax earnings non-core results totaled $51.6 million, compared with a loss of $6.0 million in the prior year. We made a capital contribution of $14 million to Redbox Instant by Verizon. Our share of the total start-up losses for the joint venture was $8.5 million for the quarter. Our other equity method investment resulted in a loss of $1.3 million. We recognized a gain of $68.4 million related to the re-valuation of our prior interest in ecoATM.
2013 Q4 Consolidated Guidance
At Redbox, we remain focused on growing rentals system-wide as the majority of our network has reached maturity. As in Q3, we expect rentals and revenue to be up year over year in Q4, as we benefit from the strategies we have employed to drive the business. This includes expectations for higher single night rentals year over year as well as a reduced amount of promotional discounts as compared with Q3 2013, based on the adjustments we have made to our marketing programs.
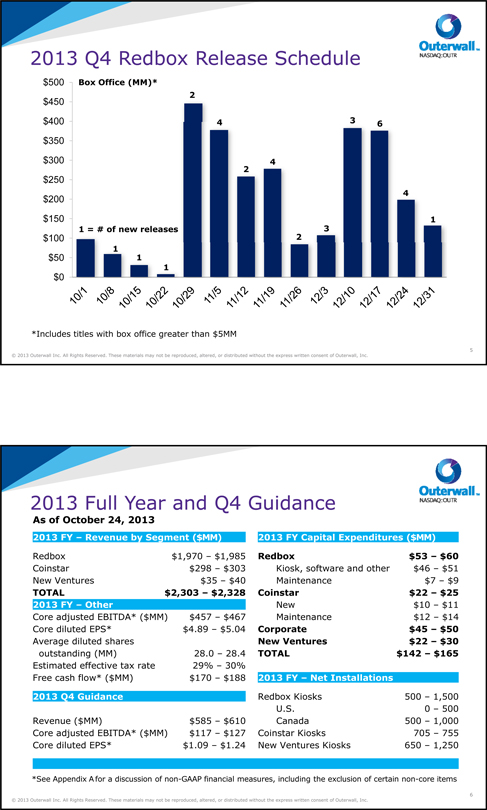
Q4 2013 has an estimated total box office of $2.8 billion, including 35 titles with a box office greater than or equal to $5 million. Though total box office for the quarter is down 21% compared with last year, due in large part to our success releasing Iron Man 3, a workaround title, at the end of September (compared with last year’s release of The Avengers in the first week of October), driving October to have 54% less box office than 2012. Expected box office for November and December is up 2% versus last year. The Q4 2013 schedule includes 10 titles over $100 million, one more than in 2012.
Page 12
©2013 Outerwall Inc. All Rights Reserved. These materials may not be reproduced, altered or distributed without the express written consent of Outerwall Inc.
Outerwall Inc. 2013 Third Quarter Earnings
Prepared Remarks from CEO J. Scott Di Valerio and CFO Galen C. Smith
October 24, 2013
The breakdown for Redbox releases3 by month is:
| • | 6 theatrical titles in October with total box office of approximately $643 million, including two titles with box office over $100 million – The Croods and Monsters University. |
| • | 12 theatrical titles in November with total box office of approximately $997 million, and three of four weeks with more than $200 million of box office. November will have five titles with box office more than $100 million and is heavy on rental-friendly comedy and action titles. |
| • | 17 theatrical titles in December with total box office of approximately $1.2 billion, including three titles with box office more than $100 million – Man of Steel, We’re the Millers, and The Wolverine. Each week in December is expected to have at least $100 million combined box office and two weeks are expected to have more than $300 million combined box office. |
We are experiencing the typical fall seasonal dip, as the new school year begins and movies compete with the new TV schedule and the start of football season. As we move into November and through the end of the year, we expect the steady flow of strong releases, in combination with improving seasonality, to drive an increase in rental activity. We also expect our strong December release slate to help drive Q1 2014 rentals, particularly titles releasing near the end of the month, such as The Wolverine.
We expect Blu-ray rentals to represent approximately 13.0% to 15.0% of Redbox revenue in Q4, with continued growth driven by a strong slate of Action and other Blu-ray friendly titles, including White House Down, Man of Steel and Elysium, as well as improved marketing tactics and expected strong holiday sales of Blu-ray playing devices.
We are expecting 16 new video game releases in Q4 compared with 21 in Q4 2012. We expect video game rentals will represent approximately 5% to 6% of Redbox revenue in Q4.
Guidance also includes the impact of the price increase taken in our Coinstar business on October 1, as well as the continued growth of ecoATM in our New Ventures segment.
2013 Q4 consolidated guidance is as follows:
| • | Consolidated revenue between $585 and $610 million |
| • | Core adjusted EBITDA between $117 and $127 million |
| • | Core diluted EPS between $1.09 and $1.24 |
| 3 | A chart illustrating the Q4 Redbox release schedule is included in Appendix B |
Page 13
©2013 Outerwall Inc. All Rights Reserved. These materials may not be reproduced, altered or distributed without the express written consent of Outerwall Inc.
Outerwall Inc. 2013 Third Quarter Earnings
Prepared Remarks from CEO J. Scott Di Valerio and CFO Galen C. Smith
October 24, 2013
2013 Q4 Non-Core Guidance
For Q4, we expect our share of the start-up losses of Redbox Instant by Verizon along with our other equity method investment to be in the range of approximately $13 million to $14 million. We do not expect to make any additional capital contributions to Redbox Instant by Verizon in Q4.
2013 Full Year Consolidated Guidance
2013 full year consolidated guidance has been updated for Q3 results and our expectations for Q4; we expect:
| • | Consolidated revenue between $2.303 and $2.328 billion, which was narrowed from our last guidance range; |
| • | Core adjusted EBITDA of $457 to $467 million; and |
| • | Core diluted EPS between $4.89 and $5.04, which includes the impact of the purchase price accounting from the ecoATM transaction. |
For 2013, we now expect capital expenditures of $142 million to $165 million, in line with the guidance we provided in September:
| • | Redbox – $53 to $60 million |
| • | Kiosk, Other – $46 to $51 million for planned installs in the U.S. and Canada as well as software |
| • | Maintenance – $7 to $9 million |
| • | Coinstar – $22 to $25 million |
| • | New – $10 to $11 million for planned installs and software |
| • | Maintenance – $12 to $14 million |
| • | New Ventures – $22 to $30 million, primarily for new ecoATM installs |
| • | Corporate – $45 to $50 million |
| • | LOB/Corporate growth – $10 to $11 million |
| • | Infrastructure – $23 to $25 million |
| • | Maintenance – $12 to $14 million |
We continue to expect free cash flow for the year in the range of $170 million to $188 million. Much of this is coming in the fourth quarter due to expected changes in working capital items.
Page 14
©2013 Outerwall Inc. All Rights Reserved. These materials may not be reproduced, altered or distributed without the express written consent of Outerwall Inc.
Outerwall Inc. 2013 Third Quarter Earnings
Prepared Remarks from CEO J. Scott Di Valerio and CFO Galen C. Smith
October 24, 2013
Our current estimate for 2013 cash taxes remains in the range of $55 million to $70 million, including federal, state and foreign.
For the year, we continue to expect average diluted shares in the range of 28.0 million to 28.4 million, which does not include the impact of the expected share repurchases in Q4.
2013 Non-Core Guidance
For 2013, non-core adjustments, including our share of the start-up losses of Redbox Instant by Verizon along with our other equity method investments as well as the costs related to the ecoATM acquisition, are expected to be favorable in the range of approximately $19 million to $20 million. The majority of this is driven by the $68.4 million gain recorded in Q3 on our previously owned shares of ecoATM.
We have provided a summary of 2013 full year and Q4 guidance in Appendix B.
Summary
There is great value within Outerwall today and clear opportunities to continue to increase this value in the future. The brands we have created and the installed base of kiosks we have built within our Redbox and Coinstar segments, as well as the opportunity we see with ecoATM, deliver compelling value to our shareholders as well as to our retail partners and consumers. We continue to refine our operating and financial strategies under the singular guiding principal of enhancing value for all our shareholders.
While Q3 presented some challenges, we have taken action to adjust our promotional strategies, reduce our costs, and realign our capital allocation. We remain enthusiastic about the prospects for our company. In Redbox, we continue to grow our base of customers and the frequency at which they rent. Within Coinstar, we have a similarly stable and productive business, and it, together with Redbox, produces strong cash flows to both support our growth and reward our shareholders. While we are reviewing New Ventures, we believe that the positive start of ecoATM shows that it can be a strong cornerstone to future growth. Overall, we believe in the prospects for and value creation of Outerwall.
Page 15
©2013 Outerwall Inc. All Rights Reserved. These materials may not be reproduced, altered or distributed without the express written consent of Outerwall Inc.
Outerwall Inc. 2013 Third Quarter Earnings
Prepared Remarks from CEO J. Scott Di Valerio and CFO Galen C. Smith
October 24, 2013
APPENDIX A
Use of Non-GAAP Financial Measures
Non-GAAP measures may be provided as a complement to results provided in accordance with United States generally accepted accounting principles (“GAAP”).
We use the following non-GAAP financial measures to evaluate our financial results:
| • | Core adjusted EBITDA; |
| • | Core diluted earnings per share (“EPS”); and |
| • | Free cash flow. |
These measures, the definitions of which are presented below, are non-GAAP because they exclude certain amounts which are included in the most directly comparable measure calculated and presented in accordance with GAAP. Our non-GAAP financial measures are not meant to be considered in isolation or as a substitute for our GAAP financial measures and may not be comparable with similarly titled measures of other companies.
Core and Non-Core Results
We distinguish our core activities, those associated with our primary operations which we directly control, from non-core activities. Non-core activities are primarily nonrecurring events or events we do not directly control. Our non-core adjustments include i) acquisition costs primarily related to the NCR Asset Acquisition and acquisition of ecoATM, Inc., ii) a gain on the grant of a license to use certain Redbox trademarks to Redbox Instant™ by Verizon, iii) income or loss from equity method investments, which represents our share of income or loss from entities we do not consolidate or control and includes the impacts of the gain on re-measurement of our previously held equity interest in ecoATM upon acquisition and iv) compensation expense for rights to receive cash issued in conjunction with our acquisition of ecoATM and attributable to fixed amount acquisition related awards and not indicative of the directly controllable future business results (“Non-Core Adjustments”).
We believe investors should consider our core results because they are more indicative of our ongoing performance and trends, are more consistent with how management evaluates our operational results and trends, provide meaningful supplemental information to investors through the exclusion of certain expenses which are either non-recurring or may not be indicative of our directly controllable business operating results, allow for greater transparency in assessing our performance, help investors better analyze the results of our business and assist in forecasting future periods.
Page 16
©2013 Outerwall Inc. All Rights Reserved. These materials may not be reproduced, altered or distributed without the express written consent of Outerwall Inc.
Outerwall Inc. 2013 Third Quarter Earnings
Prepared Remarks from CEO J. Scott Di Valerio and CFO Galen C. Smith
October 24, 2013
Core Adjusted EBITDA
Our non-GAAP financial measure core adjusted EBITDA is defined as earnings before depreciation, amortization and other; interest expense, net; income taxes; share-based payments expense; and Non-Core Adjustments.
A reconciliation of core adjusted EBITDA to net income, the most comparable GAAP financial measure, is presented in the following table:
| Three Months Ended | Nine Months Ended | |||||||||||||||
| September 30, | September 30, | |||||||||||||||
| Dollars in thousands | 2013 | 2012 | 2013 | 2012 | ||||||||||||
| Net income |
$ | 82,656 | $ | 36,774 | $ | 152,117 | $ | 127,345 | ||||||||
| Depreciation, amortization and other |
55,441 | 52,489 | 156,520 | 136,909 | ||||||||||||
| Interest expense, net |
8,402 | 3,892 | 25,953 | 11,033 | ||||||||||||
| Income taxes |
12,893 | 20,161 | 26,499 | 80,608 | ||||||||||||
| Share-based payments expense(1) |
2,774 | (1,586 | ) | 11,454 | 13,144 | |||||||||||
|
|
|
|
|
|
|
|
|
|||||||||
| Adjusted EBITDA |
162,166 | 111,730 | 372,543 | 369,039 | ||||||||||||
| Non-core adjustments: |
||||||||||||||||
| Acquisition costs |
4,003 | 20 | 5,669 | 3,235 | ||||||||||||
| Rights to receive cash issued in connection with the acquisition of ecoATM |
2,300 | — | 2,300 | — | ||||||||||||
| Loss from equity method investments |
10,442 | 6,021 | 27,096 | 15,406 | ||||||||||||
| Gain on previously held equity interest on ecoATM |
(68,376 | ) | — | (68,376 | ) | — | ||||||||||
| Gain on formation of Redbox Instant by Verizon |
— | — | — | (19,500 | ) | |||||||||||
|
|
|
|
|
|
|
|
|
|||||||||
| Core adjusted EBITDA |
$ | 110,535 | $ | 117,771 | $ | 339,232 | $ | 368,180 | ||||||||
|
|
|
|
|
|
|
|
|
|||||||||
| (1) | Includes both non-cash share-based compensation for executives, non-employee directors and employees as well as share-based payments for content arrangements. |
Core Diluted EPS
Our non-GAAP financial measure core diluted EPS is defined as diluted earnings per share excluding Non-Core Adjustments, net of applicable taxes.
A reconciliation of core diluted EPS to diluted EPS, the most comparable GAAP financial measure, is presented in the following table:
| Three Months Ended | Nine Months Ended | |||||||||||||||
| September 30, | September 30, | |||||||||||||||
| 2013 | 2012 | 2013 | 2012 | |||||||||||||
| Diluted EPS |
$ | 2.95 | $ | 1.14 | $ | 5.32 | $ | 3.90 | ||||||||
| Non-core adjustments, net of tax:(1) |
||||||||||||||||
| Acquisition costs |
0.09 | — | 0.14 | 0.06 | ||||||||||||
| Rights to receive cash issued in connection with the acquisition of ecoATM |
0.06 | — | 0.06 | — | ||||||||||||
| Loss from equity method investments |
0.23 | 0.12 | 0.58 | 0.29 | ||||||||||||
| Gain on previously held equity interest on ecoATM |
(2.36 | ) | — | (2.32 | ) | — | ||||||||||
| Gain on formation of Redbox Instant by Verizon |
— | — | — | (0.37 | ) | |||||||||||
|
|
|
|
|
|
|
|
|
|||||||||
| Core diluted EPS |
$ | 0.97 | $ | 1.26 | $ | 3.78 | $ | 3.88 | ||||||||
|
|
|
|
|
|
|
|
|
|||||||||
| (1) | Non-Core Adjustments are presented after-tax using the applicable effective tax rate for the respective periods. |
Page 17
©2013 Outerwall Inc. All Rights Reserved. These materials may not be reproduced, altered or distributed without the express written consent of Outerwall Inc.
Outerwall Inc. 2013 Third Quarter Earnings
Prepared Remarks from CEO J. Scott Di Valerio and CFO Galen C. Smith
October 24, 2013
Free Cash Flow
Our non-GAAP financial measure free cash flow is defined as net cash provided by operating activities after capital expenditures. We believe free cash flow is an important non-GAAP measure as it provides additional information to users of the financial statements regarding our ability to service, incur or pay down indebtedness and repurchase our securities.
A reconciliation of free cash flow to net cash provided by operating activities, the most comparable GAAP financial measure, is presented in the following table:
| Three Months Ended | Nine Months Ended | |||||||||||||||
| September 30, | September 30, | |||||||||||||||
| Dollars in thousands | 2013 | 2012 | 2013 | 2012 | ||||||||||||
| Net cash provided by operating activities |
$ | 61,727 | $ | 117,473 | $ | 132,391 | $ | 311,694 | ||||||||
| Purchase of property and equipment |
(39,886 | ) | (56,480 | ) | (108,616 | ) | (133,181 | ) | ||||||||
|
|
|
|
|
|
|
|
|
|||||||||
| Free cash flow |
$ | 21,841 | $ | 60,993 | $ | 23,775 | $ | 178,513 | ||||||||
|
|
|
|
|
|
|
|
|
|||||||||
Page 18
©2013 Outerwall Inc. All Rights Reserved. These materials may not be reproduced, altered or distributed without the express written consent of Outerwall Inc.
Outerwall Inc. 2013 Third Quarter Earnings
Prepared Remarks from CEO J. Scott Di Valerio and CFO Galen C. Smith
October 24, 2013
Page 19
©2013 Outerwall Inc. All Rights Reserved. These materials may not be reproduced, altered or distributed without the express written consent of Outerwall Inc.
Outerwall Inc. 2013 Third Quarter Earnings
Prepared Remarks from CEO J. Scott Di Valerio and CFO Galen C. Smith
October 24, 2013
Appendix B
2013 Q3 Prepared Remarks
October 24, 2013
Safe Harbor for Forward-Looking Statements
Various remarks that we may make about future expectations, plans and prospects for the company constitute forward-looking statements for purposes of the safe harbor provisions under the Private Securities Litigation Reform Act of 1995. Actual results may differ materially from those indicated by these forward-looking statements as a result of various factors, including those discussed in our most recent Annual Report on Form 10-K and subsequent Quarterly Reports on Form 10-Q filed with the Securities and Exchange Commission. Outerwall Inc. assumes no obligation and does not intend to update these forward-looking statements.
Reconciliation of GAAP and Non-GAAP Financial Measures
This presentation contains references to both GAAP and non-GAAP financial measures. Reconciliations between GAAP and non-GAAP financial measures and definitions of non-GAAP financial measures are available in Appendix A to the 2013 Q3 prepared remarks and in the third quarter earnings press release dated October 24, 2013, which is posted on the Investor Relations section of Outerwall’s website at ir.outerwall.com.
2
© 2013 Outerwall Inc. All Rights Reserved. These materials may not be reproduced, altered, or distributed without the express written consent of Outerwall, Inc.
Page 19
©2013 Outerwall Inc. All Rights Reserved. These materials may not be reproduced, altered or distributed without the express written consent of Outerwall Inc.
Outerwall Inc. 2013 Third Quarter Earnings
Prepared Remarks from CEO J. Scott Di Valerio and CFO Galen C. Smith
October 24, 2013
Page 20
©2013 Outerwall Inc. All Rights Reserved. These materials may not be reproduced, altered or distributed without the express written consent of Outerwall Inc.
Outerwall Inc. 2013 Third Quarter Earnings
Prepared Remarks from CEO J. Scott Di Valerio and CFO Galen C. Smith
October 24, 2013
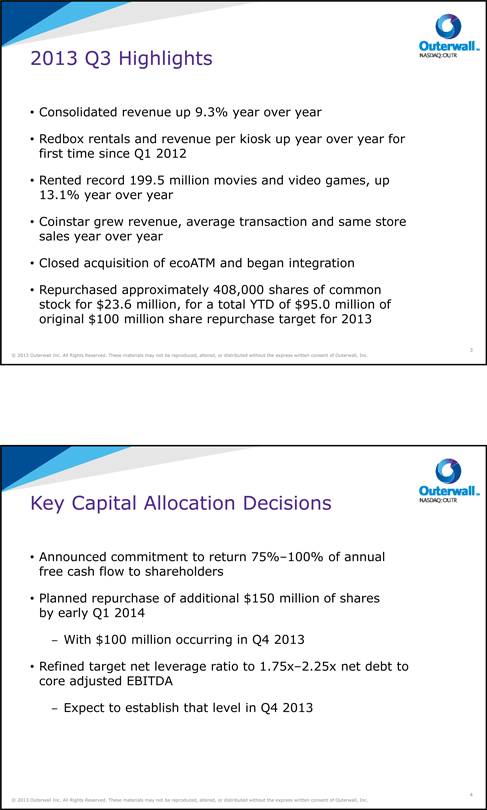
2013 Q3 Highlights
Consolidated revenue up 9.3% year over year
Redbox rentals and revenue per kiosk up year over year for first time since Q1 2012
Rented record 199.5 million movies and video games, up 13.1% year over year
Coinstar grew revenue, average transaction and same store sales year over year
Closed acquisition of ecoATM and began integration
Repurchased approximately 408,000 shares of common stock for $23.6 million, for a total YTD of $95.0 million of original $100 million share repurchase target for 2013
3
© 2013 Outerwall Inc. All Rights Reserved. These materials may not be reproduced, altered, or distributed without the express written consent of Outerwall, Inc.
Key Capital Allocation Decisions
Announced commitment to return 75%–100% of annual free cash flow to shareholders
Planned repurchase of additional $150 million of shares by early Q1 2014
– With $100 million occurring in Q4 2013
Refined target net leverage ratio to 1.75x–2.25x net debt to core adjusted EBITDA
– Expect to establish that level in Q4 2013
4
© 2013 Outerwall Inc. All Rights Reserved. These materials may not be reproduced, altered, or distributed without the express written consent of Outerwall, Inc.
Page 20
©2013 Outerwall Inc. All Rights Reserved. These materials may not be reproduced, altered, or distributed without the express written consent of Outerwall, Inc.
Outerwall Inc. 2013 Third Quarter Earnings
Prepared Remarks from CEO J. Scott Di Valerio and CFO Galen C. Smith
October 24, 2013
Page 21
©2013 Outerwall Inc. All Rights Reserved. These materials may not be reproduced, altered or distributed without the express written consent of Outerwall Inc.
Outerwall Inc. 2013 Third Quarter Earnings
Prepared Remarks from CEO J. Scott Di Valerio and CFO Galen C. Smith
October 24, 2013
2013 Q4 Redbox Release Schedule
$500 Box Office (MM)*
2
$450
$400 3 6
$350
$300 4
2
$250
$200 4
$150 1
1 = # of new releases 3
$100 2
1
$50 1
1
$0
10/1 10/8 10/15 10/22 10/29 11/5 11/12 11/19 11/26 12/3 12/10 12/17 12/24 12/31
*Includes titles with box office greater than $5MM
5
© 2013 Outerwall Inc. All Rights Reserved. These materials may not be reproduced, altered, or distributed without the express written consent of Outerwall, Inc.
2013 Full Year and Q4 Guidance
As of October 24, 2013
2013 FY – Revenue by Segment ($MM) 2013 FY Capital Expenditures ($MM)
Redbox $1,970 – $1,985 Redbox $53 – $60
Coinstar $298 – $303 Kiosk, software and other $46 – $51
New Ventures $35 – $40 Maintenance $7 – $9
TOTAL $2,303 – $2,328 Coinstar $22 – $25
2013 FY – Other New $10 – $11
Core adjusted EBITDA* ($MM) $457 – $467 Maintenance $12 – $14
Core diluted EPS* $4.89 – $5.04 Corporate $45 – $50
Average diluted shares New Ventures $22 – $30
outstanding (MM) 28.0 – 28.4 TOTAL $142 – $165
Estimated effective tax rate 29% – 30%
Free cash flow* ($MM) $170 – $188 2013 FY – Net Installations
2013 Q4 Guidance Redbox Kiosks 500 – 1,500
U.S. 0 – 500
Revenue ($MM) $585 – $610 Canada 500 – 1,000
Core adjusted EBITDA* ($MM) $117 – $127 Coinstar Kiosks 705 – 755
Core diluted EPS* $1.09 – $1.24 New Ventures Kiosks 650 – 1,250
*See Appendix A for a discussion of non-GAAP financial measures, including the exclusion of certain non-core items
6
© 2013 Outerwall Inc. All Rights Reserved. These materials may not be reproduced, altered, or distributed without the express written consent of Outerwall, Inc.
Page 21
©2013 Outerwall Inc. All Rights Reserved. These materials may not be reproduced, altered or distributed without the express written consent of Outerwall Inc.
Outerwall Inc. 2013 Third Quarter Earnings
Prepared Remarks from CEO J. Scott Di Valerio and CFO Galen C. Smith
October 24, 2013

Page 22
©2013 Outerwall Inc. All Rights Reserved. These materials may not be reproduced, altered or distributed without the express written consent of Outerwall Inc.
Outerwall Inc. 2013 Third Quarter Earnings
Prepared Remarks from CEO J. Scott Di Valerio and CFO Galen C. Smith
October 24, 2013
NASDAQ: OUTR
Page 22
©2013 Outerwall Inc. All Rights Reserved. These materials may not be reproduced, altered or distributed without the express written consent of Outerwall Inc.