Attached files
| file | filename |
|---|---|
| 8-K - FORM 8-K - MOSAIC CO | d615341d8k.htm |
Exhibit 99.1


Market Mosaic is a newsletter published for our customers, suppliers and stakeholders by the Market and Strategic Analysis group of The Mosaic Company. Some issues assess the near term outlook for agricultural and plant nutrient markets while others take an in-depth look at a topic of special interest to our readers. This issue examines the long term outlook for agricultural commodity and plant nutrient markets.
Michael R. Rahm
Vice President, Market and Strategic Analysis
Andy J. Jung
Director, Market and Strategic Analysis
Luis F. Dowling
Sr. Market Analyst
Josh Paula
Sr. Market Analyst
Mathew Philippi
Market Analyst
John Maynard Keynes, the famous British economist, advocated for active government intervention in the economy and, in particular, the use of discretionary fiscal policies such as running large budget deficits to pull a country out of recession. When probed about the long run consequences of such policies, he wrote that “in the long run we are all dead.”
This quote seems to capture the sentiment of many analysts following recent developments in agricultural commodity and plant nutrient markets. Well, we are not “Keynesians” and we are not about to write epitaphs for these markets. In fact, this issue of Market Mosaic takes a fresh look at the long run outlook and recaps the takeaways and key features of our analysis. The bottom line is that, despite headwinds in the short run, plant nutrient markets and industries look very much alive in the long run.
The ABCs of the Food Story
Robust demand prospects remain the showcase feature of the long term outlook for plant nutrient markets. A key takeaway of our analysis is that farmers will have to plant record area and reap record yields, year after year, in order to meet the projected demand for agricultural commodities. And more planted area and steady yield increases will require more plant nutrients.
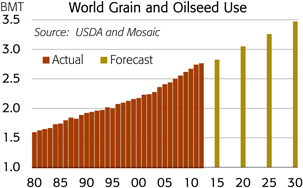
Everyone knows the food story, but we like to tell it with some remarkable numbers. For example, the recent update of our long run demand model indicates that the global grain and oilseed harvest will need to increase by about 380 million tonnes this decade in order to meet projected demand. That is greater than the current combined harvests of Argentina, Brazil and Canada (the ABCs of the food story). Furthermore, global grain and oilseed demand is projected to increase another 420 million tonnes during the next decade — so world production again will need to increase by the current output of the ABC countries, plus Australia!
Steady increases in population and continued gains in per capita income drive very predictable increases in the demand for food and agricultural commodities. Based on long term population and GDP forecasts from IHS Global Insight, grain and oilseed demand is projected to increase from 2.76 billion tonnes in 2012 to 3.05 billion tonnes in 2020 and to 3.47 billion tonnes in 2030.
– continued inside
Global population currently increases more than 75 million people each year – or the equivalent of adding another Egypt to the world year after year after year. Our model indicates that current population growth causes grain and oilseed use to increase about 22 million tonnes per year (or roughly 275 kg per additional person).
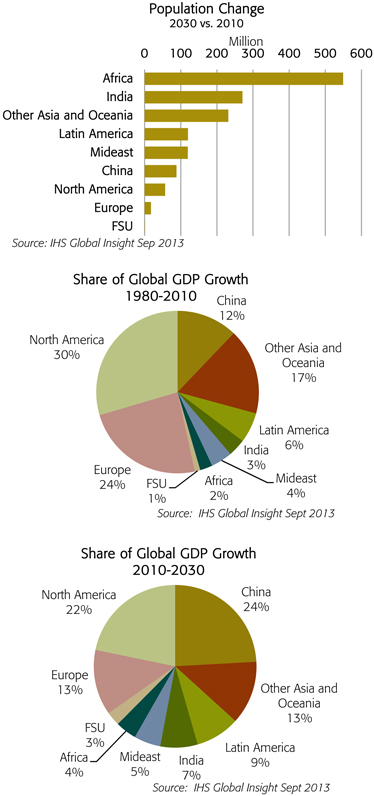
World population is forecast to increase from 7.12 billion today to 7.66 billion in 2020 and to 8.34 billion by 2030. Africa and India are projected to account for 38% and 19% of the projected increase, respectively. Countries in Asia other than China and India are expected to account for another 16% of the increase.
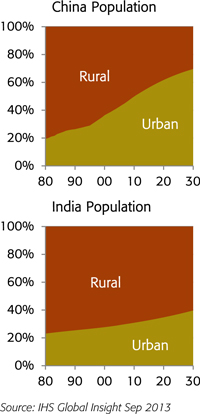
Significant demographic changes also are taking place in several large and rapidly developing economies. For example, less than one in five people in China lived in urban areas in 1980. Today, more than one-half reside in cities and by 2030 70% of the Chinese population is expected to live in urban areas. India and Indonesia, the second and third most populous countries in Asia, are expected to experience similar but less rapid transitions.
Rising household incomes, particularly among these new urban wage earners, are creating larger and more affluent middle classes, especially in Asia, Latin America and parts of Africa. The charts show that these regions are projected to account for an increasing share of global GDP growth during the next 20 years.
Our model indicates that per capita income growth of 2.5% causes grain and oilseed use to increase another 19 million tonnes per year. So, a little more than one-half of the increase in grain and oilseed use each year is the result of more mouths to feed while the remainder is a consequence of people upgrading diets to more grain intensive foods.


Production Increases from Yield Growth
The lion’s share of the projected increase in crop production is expected to come from higher yields. That is no shocker. Yields have trended steadily upward over time and have accounted for about 90% of the increase in global grain and oilseed output since 1980. Further gains are expected by: 1) closing the gap between actual and potential yields from current production technologies and 2) expanding the yield frontier through the development of next generation technologies.
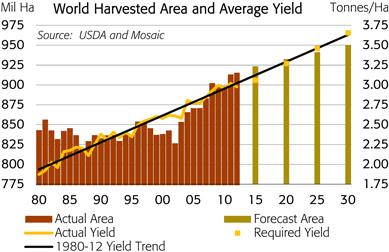
Harvested area for the leading grain and oilseed crops climbed to a record 915 million hectares in 2012. Our analysis assumes that harvested area will trend upward to more than 930 million hectares in 2020 and to 950 million by 2030. This implies that farmers will bring more land into production in regions such as South America, the former Soviet Union and Africa than is lost to urbanization and other uses elsewhere.
If our harvested area assumptions are on target, then the average global yield for grain and oilseed crops will need to increase from just less than 3.00 tonnes per hectare (mt ha) today to 3.27 mt ha in 2020 and to 3.65 mt ha in 2030 in order to meet projected demand. This required pace of productivity growth is in line with the 30-year trend.
Application Rates Needed to Achieve Yield Growth
We estimate that the average plant nutrient application rate (N+P2O5 +K2O) on grain and oilseed crops has increased nearly 40% from 105 kilograms per hectare (kg ha) in 1980 to 146 kg ha in 2012. The average yield has increased almost 60% from 1.87 to 2.98 mt ha during the same period.
Based on the relationship between yields and application rates from 1980 to 2012, this analysis indicates that the average application rate on grain and oilseed crops will need to climb from 146 kg ha in 2012 to 172 kg ha in 2020 in order to achieve the required average yield of about 3.27 mt ha at the end of this decade. The average rate would need to increase to 202 kg ha in 2030 in order to reach an average yield of 3.65 mt ha in 2030.
Several factors such as further improvements in the efficacy of plant nutrient use, breakthroughs in plant genetics or an even greater intensification of cropping practices could cause negative or positive deviations from these forecasts that were derived from historical relationships. Nevertheless, this analysis provides a fact-based methodology to develop a plausible set of plant nutrient demand forecasts.
Plant Nutrient Demand Forecasts
The need to harvest record area and achieve ever increasing yields underpins our positive long term nutrient demand forecasts. Simply put, farmers will need to feed more plants on more hectares a more balanced diet of plant nutrients in order to meet projected grain and oilseed demand.
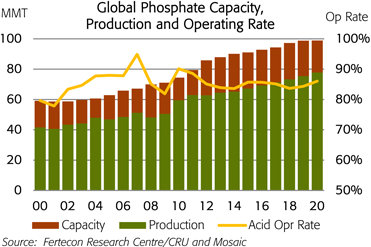
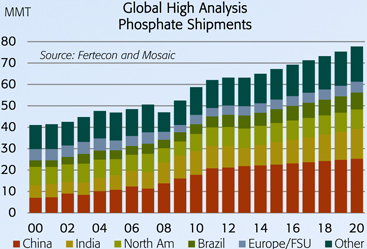
In the case of phosphate, overall nutrient demand (P2O5) is projected to grow 2.0% to 2.5% per year during this decade. However, shipments of high analysis solid products (DAP/MAP/TSP) are forecast to increase at a brisker pace of 2.5% to 3.0% per year. These products are expected to garner a larger slice of the global phosphate pie by capturing most of the projected growth as well as displacing some of the large volumes of lower analysis products still used in several countries.
Global Phosphate Shipments Forecast
| Mosaic | CRU/FRS | |||||||||||||||||||||||
| MMT DAP/MAP/TSP |
Low | Likely | High | P2O5 | D/M/T | P2O5 | ||||||||||||||||||
| 2010 Shipments |
58.7 | 40.6 | 60.5 | 42.9 | ||||||||||||||||||||
| 2020 Forecast |
76.0 | 77.6 | 79.1 | 50.8 | 72.9 | 52.1 | ||||||||||||||||||
| Change |
17.3 | 18.8 | 20.4 | 10.1 | 14.2 | 9.2 | ||||||||||||||||||
| CAGR 2010-20 |
2.6 | % | 2.8 | % | 3.0 | % | 2.3 | % | 1.9 | % | 2.0 | % | ||||||||||||
Source: CRU/Fertecon Research Centre Data File August 2013
Shipments are forecast to increase 2.8% per year or 18.8 million tonnes from 58.7 million in 2010 to 77.6 million in 2020 under our likely scenario. Shipments increased 3.6% per year or 17.7 million tonnes during the last decade.
In the case of potash, overall nutrient demand (K2O) is forecast to grow 3.5% to 4.0% per year during this decade. Muriate of potash (MOP) shipments, however, are projected to increase 2.7% to 3.2% per year. The lower rate is due to the development mainly in China of significant supplies of non-MOP products such as primary potassium sulphate and potassium magnesium sulphate.
Global Potash Shipments Forecast
| Mosaic | Fertecon | |||||||||||||||||||||||
| MMT MOP |
Low | Likely | High | K2O | MOP | K2O | ||||||||||||||||||
| 2010 Shipments |
52.6 | 27.5 | 54.8 | 28.0 | ||||||||||||||||||||
| 2020 Forecast |
68.5 | 70.3 | 71.7 | 38.6 | 74.9 | 41.8 | ||||||||||||||||||
| Change |
15.9 | 17.6 | 19.1 | 11.1 | 20.1 | 13.8 | ||||||||||||||||||
| CAGR 2010-20 |
2.7 | % | 2.9 | % | 3.1 | % | 3.4 | % | 3.2 | % | 4.1 | % | ||||||||||||
Source: Fertecon Data File October 2013. Fertecon K2O forecasts include non-agricultural uses.
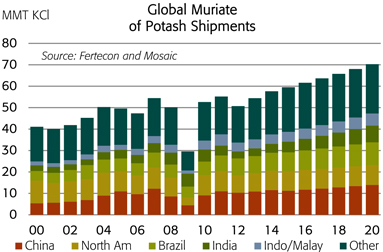
MOP shipments are projected to increase 2.9% per year or 17.6 million tonnes from 52.6 million in 2010 to 70.3 million in 2020 under our likely scenario. Shipments increased 2.5% per year or 11.5 million tonnes during the last decade, but demand growth is forecast to pick up during the rest of this decade due to the combination of more moderate and less volatile prices, expanded global supply capabilities and expected changes in subsidy and other policies that promote more balanced and sustainable nutrient use – especially in India and China where nutrient ratios are out of whack.


Potash Supply and Demand
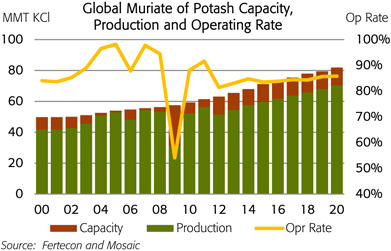
Based on our likely demand scenario and capacity estimates, we project that global MOP operating rates will remain relatively stable at about 85% of capacity from 2014 through 2020. Projected rates do not spike to the extraordinary peaks of the last decade, but they also do not show a deep or prolonged cyclical downturn as some analysts forecast.
On the demand side of the ledger, Asia and Latin America are expected to account for roughly 55% and 30% of the projected 17.6 million tonne increase in global MOP shipments this decade. The big five importing countries – Brazil, China, India, Indonesia and Malaysia – are expected to account for almost three-fourths of the projected increase in Asia and Latin America. MOP demand in North America and Europe, the two other large consuming regions, is expected to remain about flat.
In China, shipments are forecast to increase 4.4% per year or 4.9 million tonnes from 9.0 million in 2010 to 13.9 million in 2020. Imports are projected to grow from 5.2 million tonnes in 2010 to 8.0 million in 2020 and account for roughly 60% of the projected increase in shipments. Increases in domestic MOP production make up the rest.
In India, shipments and imports are projected to increase 3.3% per year or 2.2 million tonnes from 5.6 million in 2010 to 7.8 million in 2020. However, the 2020 forecast is up more than 140% from the low of just 3.2 million tonnes in 2012. In Indonesia and Malaysia, MOP use and imports are projected to increase 3.0% per year or 1.4 million tonnes from 4.2 million in 2010 to 5.6 million in 2020.
In Latin America, it is no surprise that Brazil is expected to account for more than 80% of the projected increase in this region. Shipments are forecast to climb 5.3% per year or 4.3 million tonnes from 6.3 million in 2010 to 10.6 million in 2020. Brazil is projected to import 9.9 million tonnes of MOP in 2020, so imports are expected to account for more than 90% of total shipments.
On the supply side of the ledger, we estimate that global MOP capacity this decade will increase 22.6 million tonnes from 59.3 million in 2010 to 81.9 million in 2020. We have broken our capacity estimate into three components. First, we defined a 2010
baseline for each mine as the maximum output it achieved when the global industry was running as hard as it could to meet the surge in demand during the last decade. Second, for each existing mine we layered on top of its baseline capacity any brownfield expansions that are expected to come on line this decade. Finally, we added greenfield projects that we expect to begin operations this decade. We estimated realistic start-up dates and ramp-up schedules based on our operating experience.
Our estimate of 2010 baseline capacity is 57.8 million tonnes MOP. This baseline is projected to decline more than 4.0 million tonnes to 53.7 million tonnes in 2020 due to the closure of a handful of mines in Brazil, Canada, Germany and the former Soviet Union after mineral resources are exhausted later this decade.
Virtually all of the projected net increase in global MOP capacity this decade is expected to come from brownfield expansions. We estimate that brownfield expansions will add 22.7 million tonnes of new capacity by the end of the decade. Canada and the former Soviet Union (FSU) are expected to account for about one-half and one-third of the projected increase, respectively.
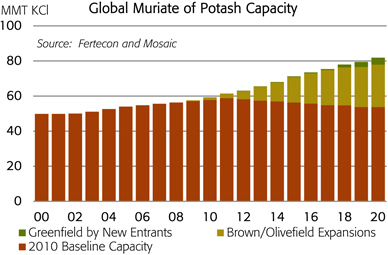
We estimate that greenfield projects by EuroChem in Russia, K+S in Saskatchewan and Chinese-backed ventures in Laos will add about 4.0 million tonnes of new capacity by 2020. However, these projects are projected to continue to ramp up and deliver more tonnage during the next decade.
Phosphate Supply and Demand
Based on our likely demand scenario and capacity estimates, global phosphoric acid operating rates are projected to remain relatively stable at about 85% of capacity from 2014 through 2020. This is in line with the average since 2000 but projected rates do not exhibit as much volatility as during the last decade.
On the demand side of the ledger, high analysis solid products (DAP/MAP/TSP) are forecast to increase 2.8% per year or 19.0 million tonnes under our likely scenario. Asia is expected to account for about two-thirds and Latin America is expected to account for nearly one-quarter of the projected increase. Small gains are forecast for Africa, North America and Europe.
In Asia, shipments are projected to climb 3.1% per year or 12.5 million tonnes from 35.2 million in 2010 to 47.7 million in 2020. China still is expected to account for 60% of this growth with shipments forecast to grow 3.6% per year or 7.5 million tonnes from 17.8 million in 2010 to 25.3 million in 2020. Gains result from both capturing most of the expected growth in overall phosphate demand as well as displacing significant quantities of lower analysis products such as fused magnesium phosphate and single superphosphate.
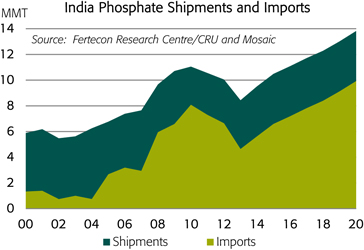
In India, subsidy changes are expected to put phosphate demand back on a strong growth trajectory during the last half of the decade. Shipments are projected to grow 2.3% per year or 3.0 million tonnes from 11.1 million in 2010 to 13.8 million in 2020. However, shipments have plummeted to less than 9.0 million tonnes today due to reductions in the phosphate subsidy and corresponding jumps in retail prices. Domestic DAP fabrication is expected to remain at about 4.0 million tonnes, so imports of high analysis solid products are forecast to increase to around 10.0 million tonnes by the end of the decade. Imports peaked at 8.1 million tonnes in 2010.
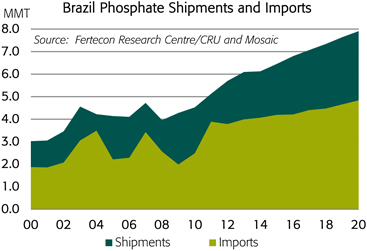
In Latin America, shipments of high analysis solid products are forecast to increase at the robust rate of 4.8% per year or 4.3 million tonnes from 8.3 million in 2010 to 11.5 million in 2020. Brazil is expected to account for nearly 80% of the projected gain, with shipments forecast to climb 5.7% per year or 3.4 million tonnes from 4.5 million in 2010 to 7.9 million in 2020. Increases in domestic production are projected to meet roughly one-third of this growth with imports capturing the remaining two-thirds. Brazil’s imports are forecast to climb from 2.5 million tonnes in 2010 to 4.8 million in 2020.
On the supply side of the ledger, significant changes are expected during the last half of this decade. A key feature of our analysis is the expectation that the massive 15-year expansion program in China will come to an end and that new low cost capacity planned or under construction mostly in Morocco and Saudi Arabia will supply the bulk of projected demand growth during the last half of this decade and beyond.
China has accounted for all of the net increase in global phosphate supplies since 1995. In fact, phosphate production by the rest of the world in 2012 was roughly the same as in 1995! China’s production of high analysis solid products has climbed from less than 1.3 million tonnes in 1995 to our estimate of just more than 25.0 million in 2013. Output is estimated level off at around 27 million tonnes during the rest of the decade.

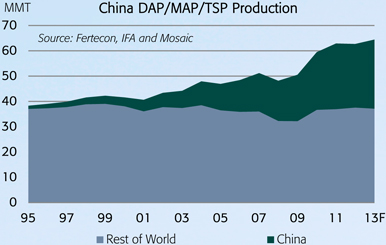
The restructuring of the Chinese phosphate sector is expected to continue, with high analysis solid products produced at world-scale integrated facilities displacing low analysis products produced at small-scale, non-integrated and environmentally unfriendly facilities. As a result and assuming no policy changes to either encourage or discourage phosphate exports, China is projected to export 4.0 to 6.0 million tonnes of DAP/MAP/TSP per year during the forecast period.
In North Africa, this analysis assumes that OCP will build four hubs at the Jorf Lasfar complex in Morocco during the forecast period, with the first two on line as early as 2014 followed by the next two a few years later. In the Mideast, Phase I of the Ma’aden project in Saudi Arabia began commercial production during the first half of 2011 and continues to ramp up. Phase II is under development and will double capacity and diversify the product mix. We expect Phase II will start up in late 2016.