Attached files
| file | filename |
|---|---|
| 8-K - FORM 8-K - ASSOCIATED BANC-CORP | d613907d8k.htm |
| EX-99.1 - EX-99.1 - ASSOCIATED BANC-CORP | d613907dex991.htm |
 ASSOCIATED BANC-CORP
3Q 2013 EARNINGS PRESENTATION
OCTOBER 17, 2013
Exhibit 99.2 |
 FORWARD-LOOKING STATEMENTS
Important note regarding forward-looking statements:
Statements
made
in
this
presentation
which
are
not
purely
historical
are
forward-looking
statements,
as
defined
in
the
Private
Securities
Litigation
Reform
Act
of
1995.
This
includes
any
statements
regarding
management’s
plans,
objectives,
or
goals
for
future
operations,
products
or
services,
and
forecasts
of
its
revenues,
earnings,
or
other
measures
of
performance.
Such forward-
looking
statements
may
be
identified
by
the
use
of
words
such
as
“believe”,
“expect”,
“anticipate”,
“plan”,
“estimate”,
“should”,
“will”,
“intend”,
“outlook”,
or
similar
expressions.
Forward-
looking
statements
are
based
on
current
management
expectations
and,
by
their
nature,
are
subject
to
risks
and
uncertainties.
Actual
results
may
differ
materially
from
those
contained
in
the
forward-looking
statements.
Factors
which
may
cause
actual
results
to
differ
materially
from
those
contained
in
such
forward-looking
statements
include
those
identified
in
the
Company’s
most
recent
Form
10-K
and
subsequent
SEC
filings.
Such
factors
are
incorporated
herein
by
reference.
1 |
 HIGHLIGHTS
2
Solid Earnings Despite Mortgage Banking Income Headwinds
Net Income
&
ROT1CE
Balance Sheet
Net Interest Income
&
Net Interest Margin
•
Average
loans
of
$15.7
billion
were
flat
to
the
second
quarter
–
Commercial
and
Residential
Mortgage
loans
up
1%
from
the
second
quarter
–
Home
Equity
and
Installment
loans
continued
to
shrink
QoQ
•
Net interest income of $161 million was up slightly from the second quarter
–
Net interest margin of 3.13% compared to 3.16% in the prior quarter
Capital
•
Quarterly dividend of $0.08/share
•
Repurchased 1.8 million shares of stock during the third quarter
–
October
4
th
–
repurchased
additional
1.8
million
shares
in
accelerated
program
•
Capital
ratios
remain
very
strong
with
a
Tier
1
common
equity
ratio
of
11.64%
Noninterest Income
& Expense
•
Noninterest income of $71 million was down $13 million from the second
quarter –
Mortgage banking income of $4 million, down $16 million from second quarter
–
Core fee based income up $3 million from prior quarter
•
Noninterest expense of $164 million was down $6 million from prior quarter
•
Net
income
available
to
common
shareholders
of
$44
million
or
$0.27
per
share
•
YTD
Return
on
Tier
1
Common
Equity
of
9.8%,
compared
to
9.4%
for
YTD
2012
•
Average
deposits
of
$17.6
billion
were
up
3%
from
the
second
quarter |
 LOAN
PORTFOLIO COMPOSITION 3
Average Loans of $15.7 billion for Third Quarter 2013
3Q 2013 Average Net Loan Change
Loan Mix –
3Q 2013 (Average)
Average Quarterly Loans ($ in billions)
Peak Average Loans (1Q 2009) $16.4 billion |
 GROWING
NET INTEREST INCOME WHILE MARGIN COMPRESSES
4
Yield on Interest-earning Assets
Cost of Interest-bearing Liabilities
Net Interest Income & Net Interest Margin
($ in millions) |
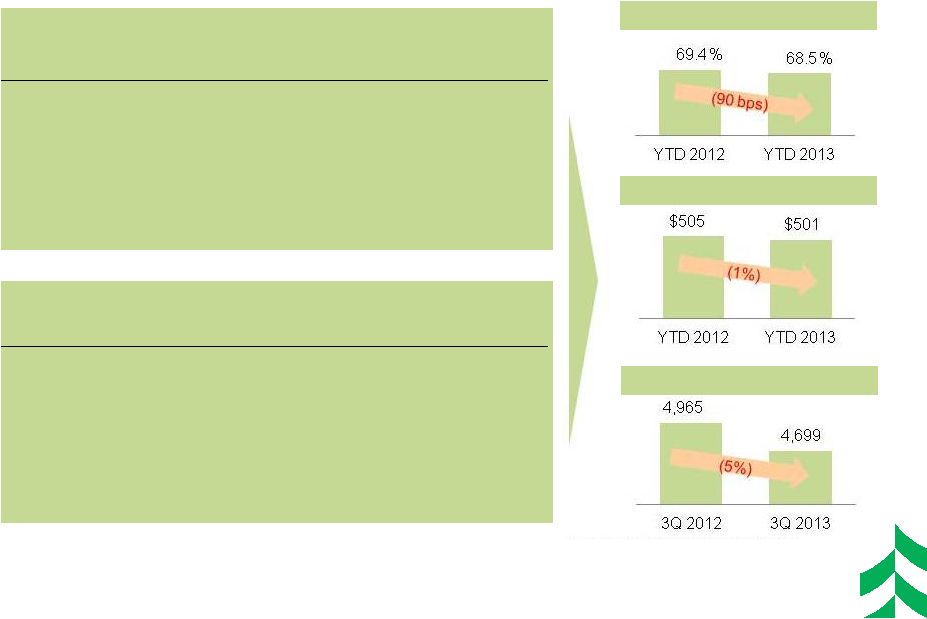 NONINTEREST INCOME AND EXPENSE
5
FTE
2
Trend
1
–
Efficiency ratio =
Noninterest
expense,
excluding
amortization
of
intangibles,
divided
by
sum
of
taxable
equivalent
net
interest
income
plus
noninterest
income,
excluding
investment
securities
gains,
net,
and
asset
gains,
net.
This
is
a
non-GAAP
financial
measure. Please refer to the appendix and our press release tables for a
reconciliation of this and other non-GAAP items. 2
–
FTE
= Full Time Equivalent Employees
Noninterest Income -
$71 mm in 3Q, down $13 mm from 2Q
Mortgage
Banking
•
Lower gains and volumes
Insurance
Revenue
•
Normalized revenue
compared to prior quarter
Asset Gain/Loss
•
Sale of real estate
Noninterest Expense -
$164 mm in 3Q, down $6 mm from 2Q
Personnel
Expense
Losses other
than Loans
•
Favorable resolution of
legal matter
Legal & Prof.
Fees
•
BSA consultant expense
ending
•
FTE reductions
Efficiency Ratio
1
Trend
3Q Var
Key Driver(s)
3Q Var
Key Driver(s)
($16 mm)
$2 mm
$2 mm
$2 mm
$2 mm
$3 mm
Expense Trend ($ in mm) |
 IMPROVEMENT IN CREDIT QUALITY INDICATORS
($ IN MILLIONS)
6 |
 STRONG
CAPITAL PROFILE & SUSTAINED EARNINGS
•
Current capital levels are well in excess
of “well-capitalized”
regulatory
benchmarks
–
Existing capital levels are already
above Basel III capital levels
7
Tier 1 Common Equity Ratio
Net Income Available to Common & ROT1CE
Net Income Available
to Common
($ in millions)
Return on Tier 1
Common Equity |
 FOCUS ON
EFFICIENCY INITIATIVES 8
Support Service
Consolidation
Branch
Optimization
•
Consolidating several support functions from La Crosse into
more central locations
•
Streamlining consumer and mortgage loan processing operations
in reaction to current and anticipated loan demand slowdown
•
Consolidating 8 additional branches in Wisconsin and Illinois
•
Distribution optimization based on branch locations, transaction
trends, strategic fit, and branch profitability and RAROC analysis
•
Customer usage patterns and preferences are evolving
On October 10, we announced actions to refine our presence within our footprint,
gain efficiencies, and position ourselves for the future.
|
 RECONCILIATION AND DEFINITIONS OF
NON-GAAP ITEMS
9
YTD 2013
YTD 2012
3Q 2013
2Q 2013
1Q 2013
4Q 2012
3Q 2012
Efficiency Ratio Reconciliation:
Efficiency ratio (1)
70.11%
72.65%
71.10%
69.54%
69.74%
73.71%
72.81%
Taxable equivalent adjustment
(1.44)
(1.62)
(1.49)
(1.39)
(1.46)
(1.57)
(1.61)
Asset gains (losses), net
0.26
(1.16)
0.58
(0.01)
0.24
(0.06)
(0.98)
Other intangible amortization
(0.42)
(0.44)
(0.44)
(0.41)
(0.42)
(0.43)
(0.43)
Efficiency ratio, fully taxable equivalent (1)
68.51%
69.43%
69.75%
67.73%
68.10%
71.65%
69.79%
(1)
Efficiency
ratio
is
defined
by
the
Federal
Reserve
guidance
as
noninterest
expense
divided
by
the
sum
of
net
interest
income
plus
noninterest
income,
excluding
investment
securities
gains
/
losses,
net.
Efficiency
ratio,
fully
taxable
equivalent,
is
noninterest
expense,
excluding
other
intangible
amortization,
divided
by
the
sum
of
taxable
equivalent
net
interest
income
plus
noninterest
income,
excluding
investment
securities
gains
/
losses,
net
and
asset
gains
/
losses,
net.
This
efficiency
ratio
is
presented
on
a
taxable
equivalent
basis,
which
adjusts
net
interest
income
for
the
tax-favored
status
of
certain
loans
and
investment
securities.
Management
believes
this
measure
to
be
the
preferred
industry
measurement
of
net
interest
income
as
it
enhances
the
comparability
of
net
interest
income
arising
from
taxable
and
tax-exempt
sources
and it
excludes
certain
specific
revenue
items
(such
as
investment
securities
gains
/
losses,
net
and
asset
gains
/
losses,
net).
Definition
of
Tier
1
Common
Equity:
Common
Equity
Tier
1
(CET1),
a
non-GAAP
financial
measure,
is
used
by
banking
regulators,
investors
and
analysts
to
assess
and
compare
the
quality
and
composition
of
our
capital
with
the
capital
of
other
financial
services
companies.
Management
uses
Tier
1
common
equity,
along
with
other
capital
measures,
to
assess
and
monitor
our
capital
position.
Common
Equity
Tier
1
is
Tier
1
capital
excluding
qualifying
perpetual
preferred
stock
and
qualifying
trust
preferred
securities. |