Attached files
| file | filename |
|---|---|
| 8-K - FORM 8-K - PNC FINANCIAL SERVICES GROUP, INC. | d605302d8k.htm |
| EX-99.1 - EX-99.1 - PNC FINANCIAL SERVICES GROUP, INC. | d605302dex991.htm |
 The PNC
Financial Services Group, Inc. Third Quarter 2013
Earnings Conference Call
October 16, 2013
Exhibit 99.2 |
 2
Cautionary Statement Regarding Forward-Looking
Information and Adjusted Information
This
presentation
includes
“snapshot”
information
about
PNC
used
by
way
of
illustration.
It
is
not
intended
as
a
full
business
or
financial
review
and
should
be
viewed
in
the
context
of
all
of
the
information
made
available
by
PNC
in
its
SEC
filings.
The
presentation
also
contains
forward-looking
statements
regarding
our
outlook
for
earnings,
revenues,
expenses,
capital
levels
and
ratios,
liquidity
levels,
asset
levels,
asset
quality,
financial
position,
and
other
matters
regarding
or
affecting
PNC
and
its
future
business
and
operations.
Forward-looking
statements
are
necessarily
subject
to
numerous
assumptions,
risks
and
uncertainties,
which
change
over
time.
The
forward-looking
statements
in
this
presentation
are
qualified
by
the
factors
affecting
forward-looking
statements
identified
in
the
more
detailed
Cautionary
Statement
included
in
the
Appendix,
which
is
included
in
the
version
of
the
presentation
materials
posted
on
our
corporate
website
at
www.pnc.com/investorevents,
and
in
our
SEC
filings.
We
provide
greater
detail
regarding
these
as
well
as
other
factors
in
our
2012
Form
10-K
and
our
2013
Form
10-Qs,
including
in
the
Risk
Factors
and
Risk
Management
sections
and
in
the
Legal
Proceedings
and
Commitments
and
Guarantees
Notes
of
the
Notes
To
Consolidated
Financial
Statements
in
those
reports,
and
in
our
subsequent
SEC
filings.
Our
forward-looking
statements
may
also
be
subject
to
other
risks
and
uncertainties,
including
those
we
may
discuss
in
this
presentation
or
in
SEC
filings,
accessible
on
the
SEC’s
website
at
www.sec.gov
and
on
PNC’s
corporate
website
at
www.pnc.com/secfilings.
We
have
included
web
addresses
in
this
presentation
as
inactive
textual
references
only.
Information
on
those
websites
is
not
part
of
this
presentation.
Future
events
or
circumstances
may
change
our
outlook
and
may
also
affect
the
nature
of
the
assumptions,
risks
and
uncertainties
to
which
our
forward-looking
statements
are
subject.
Forward-looking
statements
in
this
presentation
speak
only
as
of
the
date
of
this
presentation.
We
do
not
assume
any
duty
and
do
not
undertake
to
update
those
statements.
Actual
results
or
future
events
could
differ,
possibly
materially,
from
those
anticipated
in
forward-looking
statements,
as
well
as
from
historical
performance.
In
this
presentation,
we
may
sometimes
refer
to
adjusted
results
to
help
illustrate
the
impact
of
certain
types
of
items,
such
as
provisions
for
residential
mortgage
repurchase
obligations,
gains
on
sales
of
a
portion
of
our
VISA
shares,
non-cash
charges
related
to
redemptions
of
trust
preferred
securities,
expenses
for
residential
mortgage
foreclosure-related
matters,
and
integration
costs.
This
information
supplements
our
results
as
reported
in
accordance
with
GAAP
and
should
not
be
viewed
in
isolation
from,
or
as
a
substitute
for,
our
GAAP
results.
We
believe
that
this
additional
information
and
the
reconciliations
we
provide
may
be
useful
to
investors,
analysts,
regulators
and
others
to
help
evaluate
the
impact
of
these
respective
items
on
our
operations.
We
may
also
provide
information
on
the
components
of
net
interest
income
(purchase
accounting
accretion
and
the
core
remainder),
on
the
impact
of
purchase
accounting
accretion
on
net
interest
margin,
core
net
interest
margin
(net
interest
margin
less
(annualized
purchase
accounting
accretion
divided
by
average
interest-earning
assets)),
on
pretax
pre-provision
earnings
(total
revenue
less
noninterest
expense),
and
on
tangible
book
value
per
share
(calculated
as
book
value
per
share
less
total
intangible
assets,
other
than
servicing
rights,
per
share).
Where
applicable,
we
provide
GAAP
reconciliations
for
such
additional
information,
including
in
the
slides,
the
Appendix
and/or
other
slides
and
materials
on
our
corporate
website
at
www.pnc.com/investorevents
and
in
our
SEC
filings.
In
certain
discussions,
we
may
also
provide
information
on
yields
and
margins
for
all
interest-earning
assets
calculated
using
net
interest
income
on
a
taxable-equivalent
basis
by
increasing
the
interest
income
earned
on
tax-exempt
assets
to
make
it
fully
equivalent
to
interest
income
earned
on
taxable
investments.
We
believe
this
adjustment
may
be
useful
when
comparing
yields
and
margins
for
all
earning
assets.
We
may
also
use
annualized,
proforma,
estimated
or
third
party
numbers
for
illustrative
or
comparative
purposes
only.
These
may
not
reflect
actual
results.
This presentation may also include discussion of other non-GAAP financial measures, which,
to the extent not so qualified therein or in the Appendix, is qualified by GAAP
reconciliation information available on our corporate website at www.pnc.com under “About PNC–Investor Relations.” |
 3
3Q13 Highlights
Financial performance: Net income of $1.0 billion; Diluted EPS
of $1.79; ROAA of 1.36%
Stronger capital position
Grew commercial and consumer loans
Maintained expense discipline
Continued improvement in overall credit quality
Demonstrated progress on strategic priorities
YTD performance highlights
PNC Is Well-Positioned to Continue to Create Shareholder Value.
|
 4
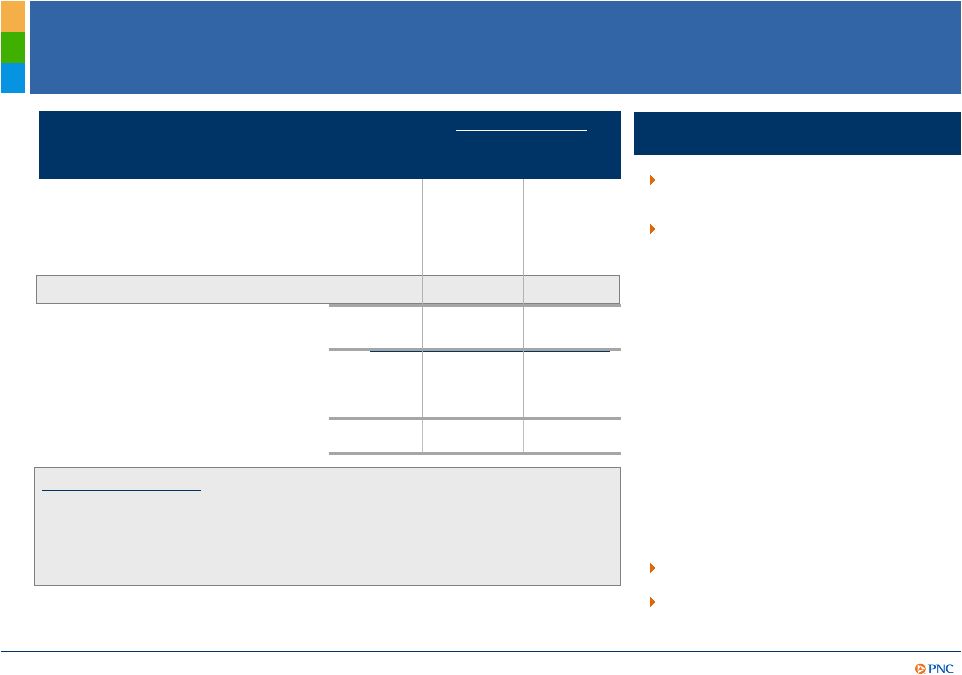
Continued Loan Growth and Capital Improvement
Investment securities stable
from end of 2Q13
Loans
increased $3.1 billion
within commercial and
consumer lending
Total deposits grew $3.8 billion
Stronger capital position
(1)
Estimated as of September 30, 2013. (2)
See Note A in the Appendix for further details. (3) PNC’s pro forma Basel III Tier 1
common capital ratio was estimated without benefit of phase-ins. See
Estimated Pro forma Basel III Tier 1 Common Capital and related information in the
Appendix for further details. (4) Pro forma Basel III Tier 1 common capital ratio estimate not
provided in 3Q12. Linked quarter highlights
% change from:
Category (billions)
Sep. 30,
2013
Jun. 30,
2013
Sep. 30,
2012
Investment securities
$57
(0.3%)
(8.8%)
Total commercial lending
$114
1.0%
8.8%
Total consumer lending
79
2.5%
2.3%
Total loans
$193
1.6%
6.0%
Total assets
$309
1.4%
2.6%
Transaction deposits
182
3.5%
8.0%
Total deposits
$216
1.8%
4.8%
Total shareholders’
equity
$41
2.1%
6.3%
Capital ratios
(1)
:
Basel I Tier 1 common capital
ratio
(2)
10.4%
10.1%
9.5%
Pro forma Basel III Tier 1
common capital ratio
(3)
8.6%
8.2%
*
(4)
Balances at period-end
–
Commercial lending
increased $1.2 billion
largely as a result of
commercial real estate and
to a lesser extent other
specialty lending businesses
–
Consumer lending grew
$1.9 billion primarily due to
automobile, home equity,
credit cards and purchased
residential real estate loans
partially offset by paydowns
of education loans |
 5
Lower Revenues and Improved Credit Quality
Impacted Profitability and Returns
Highlights
Revenue declined 4% driven by:
Decline in expense reflected
focused expense management
Pretax pre-provision earnings
(1)
decreased 8% primarily due to
lower noninterest income
Credit costs declined as overall
credit trends continued to
improve, but at a slower pace
$ change from:
(millions)
3Q13
2Q13
3Q12
Net interest income
$2,234
($24)
($165)
Noninterest income
1,686
(120)
(3)
Total revenue
$3,920
($144)
($168)
Noninterest expense
($2,424)
$11
$226
Pretax pre-provision
earnings
(1)
$1,496
($133)
$58
Provision
(137)
20
91
Pretax earnings
(2)
1,359
(113)
149
Net income
$1,039
($84)
$114
Returns
ROAA
(3)
1.36%
1.49%
1.23%
ROACE
(3)
10.50%
11.81%
10.15%
(1),(2),(3) See Notes B, C and D respectively in the Appendix for additional details. (4) See
Reconcilement section of the Appendix. YTD:
Pretax pre-provision earnings
(1)(4)
increased 27% primarily due to
noninterest income growth of 20%
and expense decline of 6%
ROAA and ROACE increased to
1.40% and 11.00%
Linked
quarter:
–
Decline in NII
–
Lower noninterest income
primarily due to impact of
higher asset sales and
valuations in 2Q13 |
 6
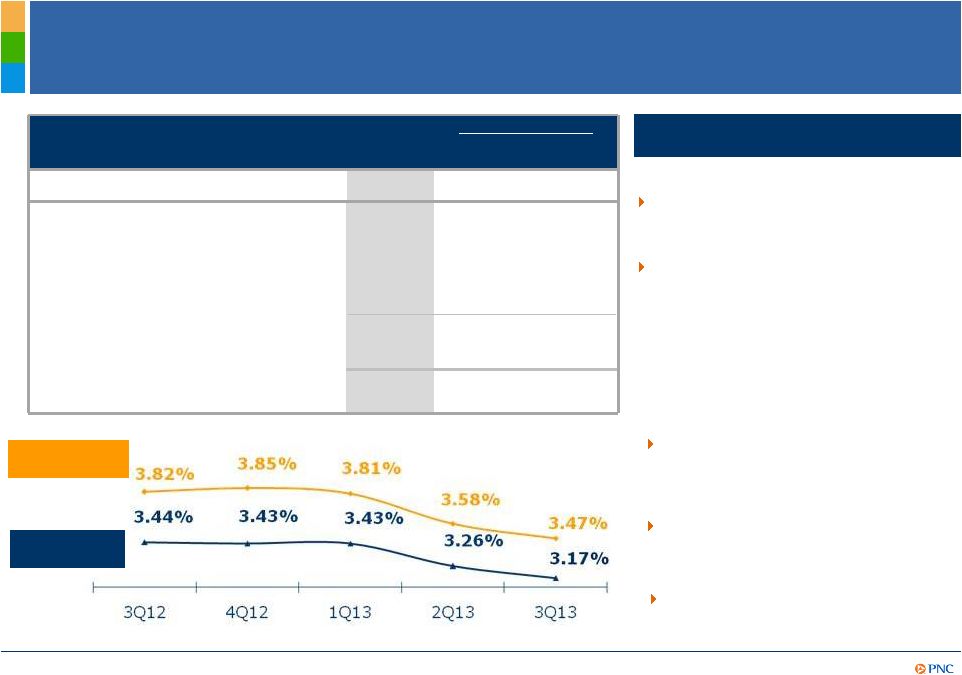
Net Interest Income Highlights
(1) Core net interest income (Core NII) is total net interest income (NII), as reported, less
related purchase accounting accretion (scheduled and excess cash recoveries). (2) See
Note E in Appendix for further details. (3) Net interest margin less (annualized
PAA/average interest-earning assets). See Reconcilement in Appendix.
Core NII
(1)
$2,035
($19)
($119)
Scheduled accretion
173
(20)
(51)
Excess cash recoveries
(2)
26
15
5
Total purchase accounting
accretion (PAA)
199
(5)
(46)
Total NII
$2,234
($24)
($165)
Highlights
Linked quarter:
Prior year quarter:
Average interest-earning assets
increased
1.4% primarily due to
average loan growth of 1.0%
NII decline of 1%
Average interest-earning assets
growth
of 3% driven by average
loan growth of 5% offset by decline
in investment securities balances
Core NII
(1)
decreased primarily due
to decline in asset yields
NII declined 5% primarily due to
lower yields and declining PAA
YTD:
$ change from:
(billions)
3Q13
2Q13
3Q12
Average interest-earning assets
$260
$4
$7
Net interest
Margin(NIM)
Core NIM
(3)
(millions)
–
Further spread compression
partially offset by loan growth
–
Lower scheduled accretion
partially offset by higher excess
cash recoveries on purchased
impaired loans |
 7
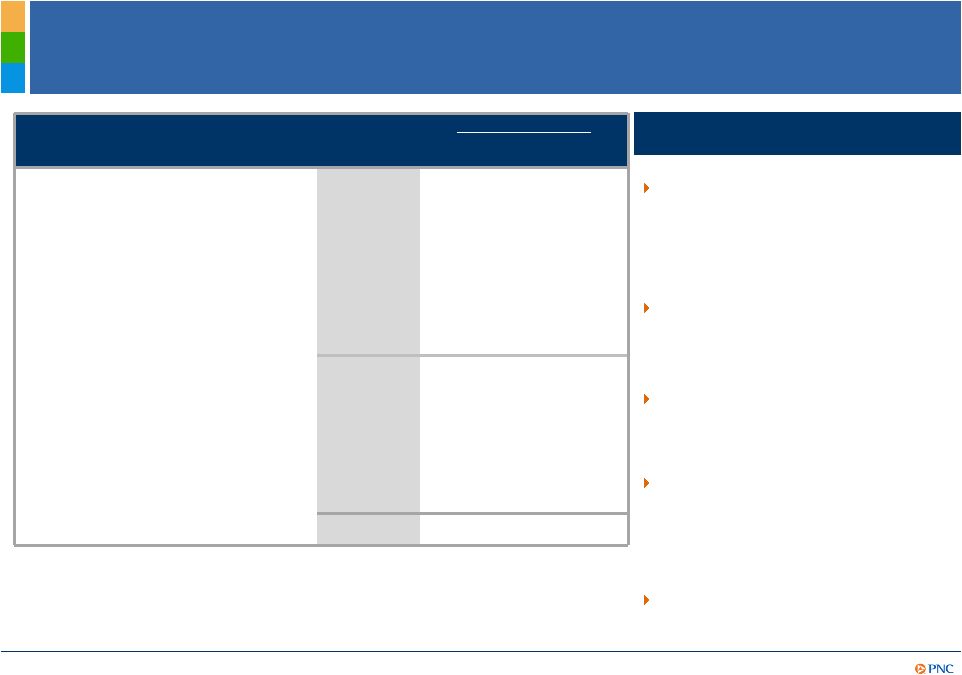
Diversified Businesses Drove Fee Income
Highlights
(1) Asset management includes the Asset Management Group and BlackRock. (2) Commercial
mortgage servicing rights valuation adjustments, net of economic hedge (CMSR) and
credit valuations related to customer-initiated hedging activities (CVA). (3) See
Reconcilement section of the Appendix.
Noninterest income decreased 7%
primarily due to:
Fee income grew 1% primarily driven by
Deposit and Consumer services as well
as improvement in residential mortgage
repurchase obligations provision and
higher net hedging gains on RMSR
Noninterest income to total revenue of
43%
Linked quarter:
$ change from:
(millions)
3Q13
2Q13
3Q12
Asset management
(1)
$330
($10)
$25
Consumer services
316
2
28
Corporate services
306
(20)
11
Residential mortgage
199
32
(28)
Deposit service charges
156
9
4
Fee income
$1,307
$13
$40
Net gains on sales of securities
less net OTTI
19
(38)
3
Gain on VISA sales
85
2
(52)
Other
275
(97)
6
Total noninterest income
$1,686
($120)
($3)
Prior Year Quarter:
Stable noninterest income largely
reflects strong fee income growth
including lower provision for
residential mortgage repurchase
obligations
YTD:
Fee income increased 19% or 5%
excluding provision for residential
mortgage
repurchase
obligations
(3)
–
Impact of higher asset sales and
valuations
(2)
in 2Q13
–
Decline in residential mortgage
loan sales revenue |
 8
Disciplined Expense Management While Investing for
Growth
$ change from:
(millions)
3Q13
2Q13
3Q12
Adjusted for specified items
(1)
:
Personnel
$1,181
($5)
$8
Occupancy
205
(1)
(2)
Equipment
194
5
10
Marketing
68
1
6
Other
728
(26)
(113)
Noninterest expense, adjusted
for TPS charges and Other
specified items
(1)
$2,376
($26)
($91)
Trust preferred securities
redemption-related charges
27
(3)
(68)
Other specified items
21
18
(67)
Total noninterest expense
$2,424
($11)
($226)
Efficiency ratio
(3)
62%
60%
65%
Efficiency ratio, adjusted
(3,4)
61%
59%
62%
Noninterest expense decline
reflects continued focus on
expense management
Achieved $700 million
CIP
(2)
target
Highlights
Linked quarter:
(1)
Specified
items
are
trust
preferred
securities
redemption-related
charges
and
Other
specified
items.
Other
specified
items
are
residential
mortgage
foreclosure-related
matters
and
integration
costs.
See
Reconcilement
section
of
the
Appendix
for
impact
of
each
specified
item
on
each
category
of
noninterest
expense,
where
applicable.
(2)
CIP
refers
to
PNC’s
Continuous
Improvement
Program.
(3)
See
Note
F
in
the
Appendix.
(4)
Efficiency
ratio
adjusted
for
integration
costs
and
trust
preferred
securities
redemption-related
charges
in
each
quarter
where
applicable.
See
Reconcilement
section
of
the
Appendix.
Prior Year Quarter:
Noninterest expense decline of
9% largely reflects lower trust
preferred securities redemption
charges, lower integration costs
and the benefit of our continuous
improvement efforts
YTD:
Noninterest expense down 6% |
 9
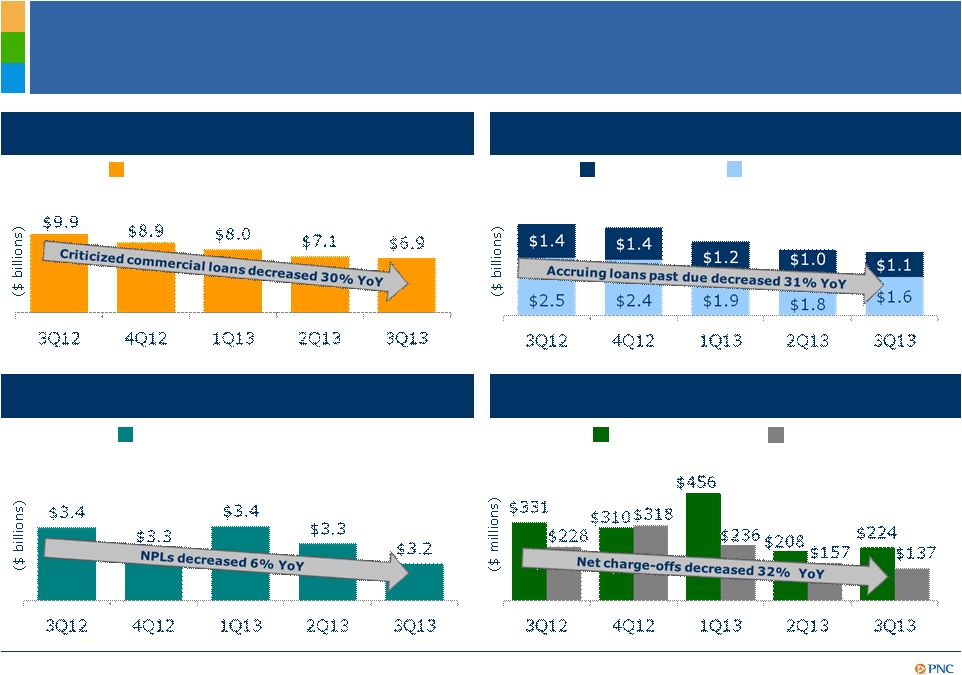
Overall Credit Quality Continued to Improve
Nonperforming
loans
(2,4)
Provision and net charge-offs
Criticized commercial loans
30-89 Days
90 Days +
Accruing
loans
past
due
(2,3)
As
of
quarter
end
except
net
charge-offs
and
provision,
which
are
for
the
quarter.
(1)
Criticized
loans
are
ones
that
we
consider
“special
mention,”
“substandard’”
or
“doubtful”.
(2)
Loans
acquired
from
National
City
or
RBC
Bank
(USA)
that
were
impaired
are
not
included
as
they
were
recorded
at
estimated
fair
value
when
acquired
and
are
currently
considered
performing
loans
due
to
the
accretion
of
interest
in
purchase
accounting.
(3)
Includes
loans
that
are
government
guaranteed/insured,
primarily
residential
mortgages.
These
loans
totaled
$2.0
billion
in
3Q13.
(4)
Does
not
include
loans
held
for
sale
or
foreclosed
and
other
assets.
Excludes
certain
government
insured
or
guaranteed
loans
and
loans
accounted
for
under
the
fair
value
option.
Criticized
Commercial
loans
(1)
Total nonperforming loans
Provision
Net charge-offs |
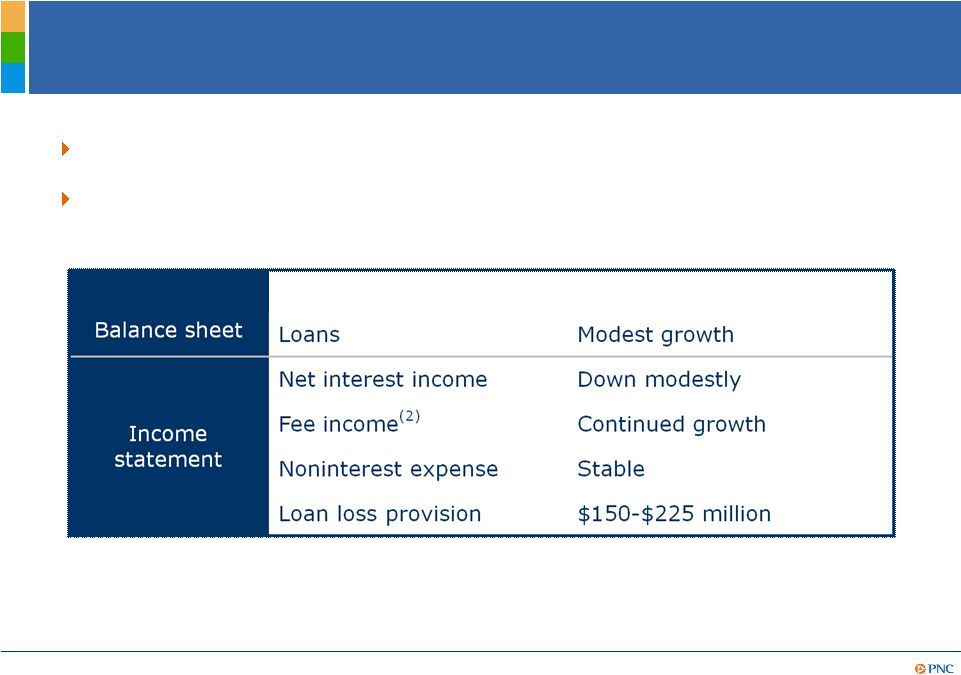 10
Outlook
(1)
–
4Q13 vs. 3Q13
(1)
Refer
to
Cautionary
Statement
in
the
Appendix,
including
economic
and
other
assumptions.
Does
not
take
into
account
impact
of
potential
legal
and
regulatory
contingencies
or
the
potential
impacts
of
the
Congress
failing
to
timely
raise
the
Federal
debt
ceiling.
(2)
Fee
income
refers
to
Noninterest
income
in
the
following
categories:
asset
management,
consumer
services,
corporate
services,
residential
mortgage,
and
service
charges
on
deposits.
Revenue to increase in 2013 compared to 2012
Expectation for 4Q13 vs. 3Q13: |
 11
Cautionary Statement Regarding Forward-Looking
Information
Appendix
This
presentation
includes
“snapshot”
information
about
PNC
used
by
way
of
illustration
and
is
not
intended
as
a
full
business
or
financial
review.
It
should
not
be viewed
in
isolation
but
rather
in
the
context
of
all
of
the
information
made
available
by
PNC
in
its
SEC
filings.
We
also
make
statements
in
this
presentation,
and
we
may
from
time
to
time
make
other
statements,
regarding
our
outlook
for
earnings,
revenues,
expenses,
capital
levels
and
ratios,
liquidity
levels,
asset
levels,
asset
quality,
financial
position,
and
other
matters
regarding
or
affecting
PNC
and
its
future
business
and
operations
that
are
forward-looking
statements
within
the
meaning
of
the
Private
Securities
Litigation
Reform
Act.
Forward-looking
statements
are
typically
identified
by
words
such
as
“believe,”
“plan,”
“expect,”
“anticipate,”
“see,”
“look,”
“intend,”
“outlook,”
“project,”
“forecast,”
“estimate,”
“goal,”
“will,”
“should”
and
other
similar words
and
expressions.
Forward-looking
statements
are
subject
to
numerous
assumptions,
risks
and
uncertainties,
which
change
over
time.
Forward-looking
statements
speak
only
as
of
the
date
made.
We
do
not
assume
any
duty
and
do
not
undertake
to
update
forward-looking
statements.
Actual
results
or
future
events
could
differ,
possibly
materially,
from
those
anticipated
in
forward-looking
statements,
as
well
as
from
historical
performance.
Our forward-looking statements are subject to the following principal risks and
uncertainties. •Our businesses, financial results and balance sheet
values are affected by business and economic conditions, including the following:
•Changes in interest rates and valuations in debt, equity and other financial
markets. •Disruptions in the liquidity and other functioning of U.S. and
global financial markets. •The
impact
on
financial
markets
and
the
economy
of
any
changes
in
the
credit
ratings
of
U.S.
Treasury
obligations
and
other
U.S.
government-backed
debt,
as
well
as
issues
surrounding
the
level
of
U.S.
and
European
government
debt
and
concerns
regarding
the
creditworthiness
of
certain
sovereign
governments,
supranationals
and
financial
institutions
in
Europe.
•Actions
by
the
Federal
Reserve,
U.S.
Treasury
and
other
government
agencies,
including
those
that
impact
money
supply
and
market
interest
rates.
•Changes in customers’, suppliers’
and other counterparties’
performance and creditworthiness.
•Slowing or reversal of the current moderate U.S. economic expansion.
•Continued effects of aftermath of recessionary conditions and uneven spread
of positive impacts of recovery on the economy and our counterparties, including
adverse impacts on levels of unemployment, loan utilization rates, delinquencies,
defaults and counterparty ability to meet credit and other obligations.
•Changes in customer preferences and behavior, whether due to changing
business and economic conditions, legislative and regulatory initiatives, or other
factors.
•Our
forward-looking
financial
statements
are
subject
to
the
risk
that
economic
and
financial
market
conditions
will
be
substantially
different
than
we
are
currently
expecting.
These
statements
are
based
on
our
current
view
that
the
moderate
U.S.
economic
expansion
will
persist,
despite
drags
from
Federal
fiscal
restraint,
the partial
Federal
government
shutdown
will
not
continue
for
an
extended
period
of
time,
and
short-term
interest
rates
will
remain
very
low
but
bond
yields
will
remain elevated
in
the
second
half
of
2013.
These
forward-looking
statements
also
do
not,
unless
otherwise
indicated,
take
into
account
the
impact
of
potential
legal
and
regulatory
contingencies
or
the
potential
impacts
of
the
Congress
failing
to
timely
raise
the
Federal
debt
ceiling. |
 12
Cautionary Statement Regarding Forward-Looking
Information (continued)
Appendix
•PNC’s ability to take certain capital actions, including paying dividends and any plans to increase common stock dividends,
repurchase common stock under
current or future programs, or issue or redeem preferred stock or other regulatory capital instruments, is subject to
the review of such proposed actions by the Federal Reserve as part of PNC’s comprehensive
capital plan for the applicable period in connection
with
the
regulators’
Comprehensive
Capital
Analysis
and
Review
(CCAR)
process
and
to
the
acceptance
of
such
capital
plan
and
non-objection to such capital actions by the Federal Reserve
•PNC’s regulatory capital ratios in the future will depend on, among other things, the company’s financial performance, the scope and terms
of final capital regulations then in effect (particularly those implementing the Basel Capital
Accords), and management actions affecting the composition
of
PNC’s
balance
sheet.
In
addition,
PNC’s
ability
to
determine,
evaluate
and
forecast
regulatory
capital
ratios,
and
to
take
actions (such as capital distributions) based on actual or forecasted capital ratios, will be
dependent on the ongoing development, validation and regulatory approval of related
models. •Legal
and
regulatory
developments
could
have
an
impact
on
our
ability
to
operate
our
businesses,
financial
condition,
results
of
operations,
competitive
position,
reputation,
or
pursuit
of
attractive
acquisition
opportunities.
Reputational
impacts
could
affect
matters
such
as
business
generation
and
retention,
liquidity,
funding,
and
ability
to
attract
and
retain
management.
These
developments
could
include:
•Changes resulting from legislative and
regulatory reforms, including major reform of the regulatory oversight structure of the
financial services industry and changes to laws and regulations involving tax, pension,
bankruptcy, consumer protection, and other industry aspects, and changes in accounting
policies and principles. We will be impacted by extensive reforms provided for in the
Dodd-Frank Wall Street Reform and Consumer Protection Act (the “Dodd-Frank
Act”) and otherwise growing out of the recent financial crisis, the precise
nature, extent and timing of which, and their impact on us, remains uncertain.
•Changes to regulations governing bank
capital and liquidity standards, including due to the Dodd-Frank Act and to Basel-related
initiatives.
•Unfavorable resolution of legal
proceedings or other claims and regulatory and other governmental investigations or other inquiries.
In
addition
to
matters
relating
to
PNC’s
business
and
activities,
such
matters
may
include
proceedings,
claims,
investigations,
or
inquiries relating to pre-acquisition business and activities of acquired companies, such
as National City. These matters may result in monetary judgments or settlements
or other remedies, including fines, penalties, restitution or alterations in our business
practices, and in additional expenses and collateral costs, and may cause reputational harm to
PNC. •Results of the regulatory
examination and supervision process, including our failure to satisfy requirements of agreements with
governmental agencies.
•Impact
on
business
and
operating
results
of
any
costs
associated
with
obtaining
rights
in
intellectual
property
claimed
by
others
and of adequacy of our intellectual property protection in general.
|
 13
Cautionary Statement Regarding Forward-Looking
Information (continued)
Appendix
•Business and operating results are affected by our ability to identify and effectively
manage risks inherent in our businesses, including, where
appropriate,
through
effective
use
of
third-party
insurance,
derivatives,
and
capital
management
techniques,
and
to
meet
evolving
regulatory capital standards. In particular, our results currently depend on our ability
to manage elevated levels of impaired assets. •Business
and
operating
results
also
include
impacts
relating
to
our
equity
interest
in
BlackRock,
Inc.
and
rely
to
a
significant
extent
on
information provided to us by BlackRock. Risks and uncertainties that could affect
BlackRock are discussed in more detail by BlackRock in its SEC filings.
•We grow our business in part by acquiring from time to time other financial services
companies, financial services assets and related deposits and other liabilities.
Acquisition risks and uncertainties include those presented by the nature of the business acquired, including
in some cases those associated with our entry into new businesses or new geographic or other
markets and risks resulting from our inexperience in those new areas, as well as risks
and uncertainties related to the acquisition transactions themselves, regulatory issues, and
the integration of the acquired businesses into PNC after closing.
•Competition can have an impact on customer acquisition, growth and retention and on
credit spreads and product pricing, which can affect market share, deposits and
revenues. Industry restructuring in the current environment could also impact our business and financial
performance
through
changes
in
counterparty
creditworthiness
and
performance
and
in
the
competitive
and
regulatory
landscape.
Our
ability to anticipate and respond to technological changes can also impact our ability to
respond to customer needs and meet competitive demands.
•Business and operating results can also be affected by widespread natural and other
disasters, dislocations, terrorist activities or international hostilities through
impacts on the economy and financial markets generally or on us or our counterparties specifically.
We provide greater detail regarding these as well as other factors in our 2012 Form 10-K
and our first and second quarter 2013 Form 10- Qs,
including
in
the
Risk
Factors
and
Risk
Management
sections
and
the
Legal
Proceedings
and
Commitments
and
Guarantees
Notes
of
the
Notes
To
Consolidated
Financial
Statements
in
those
reports,
and
in
our
subsequent
SEC
filings.
Our
forward-looking
statements
may
also
be subject to other risks and uncertainties, including those we may discuss elsewhere in this
presentation or in SEC filings, accessible on the SEC’s website at www.sec.gov and
on our corporate website at www.pnc.com/secfilings. We have included these web addresses as
inactive
textual
references
only.
Information
on
these
websites
is
not
part
of
this
document.
Any annualized, proforma, estimated, third party or consensus numbers in this presentation are
used for illustrative or comparative purposes
only
and
may
not
reflect
actual
results.
Any
consensus
earnings
estimates
are
calculated
based
on
the
earnings
projections
made
by analysts who cover that company. The analysts’
opinions, estimates or forecasts (and therefore the consensus earnings estimates) are
theirs alone, are not those of PNC or its management, and may not reflect PNC’s or other
company’s actual or anticipated results. |
 14
Notes
Appendix
Explanatory Notes
(A) Basel I Tier 1 common capital ratio is period-end Basel I Tier 1 common capital
divided by period-end Basel I risk-weighted assets.
(E) Excess cash recoveries represent cash payments from customers that exceeded the recorded
investment of the designated impaired loans.
(C) Pretax earnings is income before income taxes and noncontrolling interests.
(F) Efficiency ratio calculated as noninterest expense divided by total revenue.
(B) Pretax pre-provision earnings is defined as total revenue less noninterest expense. We
believe that pretax pre-provision earnings, a non-GAAP measure, is useful as a
tool to help evaluate the ability to provide for credit costs through operations. (D)
ROAA is Return on Average Assets and ROACE is Return on Average Common Shareholders' Equity. |
 15
Estimated Pro forma Basel III Tier I Common Capital
Appendix
Basel I Tier 1 Common Capital Ratio
Dollars in millions
Sept. 30, 2013 (a)
June 30, 2013
December 31, 2012
Sept. 30, 2012
Basel I Tier 1 common capital
$27,543
$26,668
$24,951
$24,382
Basel I risk-weighted assets
265,708
264,750
260,847
257,297
Basel I Tier 1 common capital ratio
10.4%
10.1%
9.6%
9.5%
(a) Estimated as of September 30, 2013.
Estimated Pro forma Basel III Tier 1 Common Capital Ratio (b)
Dollars in millions
Sept. 30, 2013
June 30, 2013
December 31, 2012
Basel I Tier 1 common capital
$27,543
$26,668
$24,951
Less regulatory capital adjustments:
Basel III quantitative limits
(2,049)
(2,224)
(2,330)
Accumulated other comprehensive income (a)
(231)
(241)
276
All other adjustments
(274)
(283)
(396)
Estimated Basel III Tier 1 common capital
$24,989
$23,920
$22,501
Estimated Basel III risk-weighted assets
289,695
290,838
301,006
Pro forma Basel III Tier 1 common capital ratio
8.6%
8.2%
7.5%
(a) Represents net adjustments related to accumulated other comprehensive income for available
for sale securities and pension and other postretirement benefit plans. (b) Pro forma
Basel III Tier 1 common capital ratio estimate not provided in 3Q12. We provide
information below regarding PNC’s pro forma fully phased-in Basel III Tier 1 common capital ratio and how it differs from the Basel I
Tier 1 common capital ratio. This Basel III ratio, which is calculated using PNC's estimated
risk-weighted assets under the Basel III advanced approaches, will replace the
current Basel I ratio for this regulatory metric when PNC exits the parallel run qualification phase. The Federal
Reserve Board announced final rules implementing Basel III on July 2, 2013. Our estimate of
Basel III capital information set forth below is based on our understanding of the
final Basel III rules. Tier 1 common capital as defined under the Basel III rules
differs materially from Basel I. For example, under Basel III, significant common stock
investments in unconsolidated financial institutions, mortgage servicing rights and deferred tax assets must be deducted from capital to the
extent they individually exceed 10%, or in the aggregate exceed 15%, of the institution's
adjusted Tier 1 common capital. Also, Basel I regulatory capital excludes certain other
comprehensive income related to both available for sale securities and pension and other
postretirement plans, whereas under Basel III these items are a component of PNC's capital.
Basel III risk-weighted assets were estimated under the advanced approaches
included in the Basel III rules and application of Basel II.5, and reflect credit, market and operational risk.
PNC utilizes this capital ratio estimate to assess its Basel III capital position (without the
benefit of phase-ins), including comparison to similar estimates made by other
financial institutions. This Basel III capital estimate is likely to be impacted by any additional regulatory guidance,
continued analysis by PNC as to the application of the rules to PNC, and the ongoing
evolution, validation and regulatory approval of PNC's models integral to the
calculation of advanced approaches risk-weighted assets. |
 16
Non-GAAP to GAAP Reconcilement
Appendix
$ in millions
Sept. 30, 2013
Jun. 30, 2013
Mar. 31, 2013
Dec. 31, 2012
Sep. 30, 2012
Net interest margin, as reported
3.47%
3.58%
3.81%
3.85%
3.82%
Purchase accounting accretion (1)
$199
$204
$249
$273
$245
Purchase accounting accretion, if annualized
$790
$818
$1,010
$1,086
$975
Avg. interest earning assets
$259,606
$256,102
$256,180
$253,643
$252,606
Annualized purchase accounting accretion/Avg. interest-earning assets
0.30%
0.32%
0.38%
0.42%
0.38%
Core net interest margin (2)
3.17%
3.26%
3.43%
3.43%
3.44%
For the three months ended
(1) Purchase accounting accretion is scheduled purchase accounting accretion plus cash
recoveries. (2)
PNC
believes
that
core
net
interest
margin,
a
non-GAAP
measure,
is
useful
as
a
tool
to
help
evaluate
the
impact
of
purchase
accounting
accretion
on
net interest margin. The adjustment represents annualized purchase accounting accretion
divided by average interest-earning assets. $ in millions
Sept. 30, 2013
Sept. 30, 2012
% Change
Net interest income
$6,881
$7,216
-5%
Noninterest income
$5,058
$4,227
20%
Total revenue
$11,939
$11,443
4%
Noninterest expense
($7,254)
($7,753)
-6%
Pretax pre-provision earnings (1)
$4,685
$3,690
27%
Net income
$3,166
$2,282
39%
(1) PNC believes that pretax, pre-provision earnings, a non-GAAP measure, is useful as
a tool to help evaluate the ability to provide for credit costs
through operations. For
the nine months ended |
 17
Non-GAAP to GAAP Reconcilement
Appendix
$ in millions
Sept. 30, 2013
Jun. 30, 2013
Sept. 30, 2012
Total revenue, as reported
$3,920
$4,064
$4,088
Total noninterest expense, as reported
$2,424
$2,435
$2,650
Efficiency ratio, as reported
62%
60%
65%
Total revenue, as reported
$3,920
$4,064
$4,088
Total noninterest expense, as reported
$2,424
$2,435
$2,650
Adjustments:
Integration costs
-
-
(35)
Total noninterest expense, as adjusted
$2,397
$2,405
$2,520
Efficiency ratio, as adjusted
61%
59%
62%
* Efficiency ratio calculated as noninterest expense divided by total revenue
For the three months ended
Noncash charges for unamortized discounts related to
redemption of trust preferred securities
(27)
(30)
(95)
$ in millions
Sept. 30, 2013
Sept. 30, 2012
% change
Asset management
$978
$867
Consumer services
$926
$842
Corporate services
$909
$817
Residential mortgage
$600
$284
Deposit service charges
$439
$423
Total fee income, as reported
$3,852
$3,233
19%
Provision for residential mortgage repurchase obligations
($71)
($507)
Fee income, adjusted for provision for residential mortgage repurchase obligations
$3,923
$3,740
5%
For
the nine months ended |
 18
Non-GAAP to GAAP Reconcilement
Appendix
In millions
Sept. 30, 2013
Jun. 30, 2013
Sept. 30, 2012
Personnel, as reported
$1,181
$1,186
$1,171
Integration costs
2
Personnel, as adjusted
$1,181
$1,186
$1,173
Occupancy, as reported
$205
$206
$212
Integration costs
(5)
Occupancy, as adjusted
$205
$206
$207
Equipment, as reported
$194
$189
$185
Integration costs
(1)
Equipment, as adjusted
$194
$189
$184
Marketing, as reported
$68
$67
$74
Integration costs
(12)
Marketing, as adjusted
$68
$67
$62
Other, as reported
$776
$787
$1,008
Residential mortgage foreclosure-related matters
(21)
(3)
(53)
TPS redemption-related charges
(27)
(30)
(95)
Integration costs
-
-
(19)
Other, as adjusted
$728
$754
$841
Noninterest expense, adjusted for specified items
$2,376
$2,402
$2,467
Specified items -
Total
48
33
183
Total noninterest expense
$2,424
$2,435
$2,650
For the quarter ended |