Attached files
| file | filename |
|---|---|
| 8-K - FORM 8-K - KEYCORP /NEW/ | d611847d8k.htm |
| EX-99.1 - EX-99.1 - KEYCORP /NEW/ | d611847dex991.htm |
| EX-99.3 - EX-99.3 - KEYCORP /NEW/ | d611847dex993.htm |
| KeyCorp
Third Quarter 2013 Earnings Review
October 16, 2013
Beth E. Mooney
Chairman and
Chief Executive Officer
Don Kimble
Chief Financial Officer
Exhibit 99.2 |
| 2
FORWARD-LOOKING STATEMENTS AND ADDITIONAL
INFORMATION DISCLOSURE
This presentation contains forward-looking statements, including statements
about our financial condition, results of operations, asset quality trends,
capital
levels
and
profitability.
Forward-looking
statements
can
often
be
identified
by
words
such
as
“outlook,”
“goal,”
“objective,”
“plan,”
“expect,”
“anticipate,”
“intend,”
“project,”
“believe,”
or “estimate.”
Forward-looking statements represent management’s current expectations
and forecasts regarding future events. If underlying assumptions prove to be
inaccurate or unknown risks or uncertainties arise, actual results could vary
materially from these projections or expectations. Risks and uncertainties
include but are not limited to: (1) continued strain on the global financial markets; (2) the slow progress of the U.S. economic
recovery; changes in trade, monetary and fiscal policies; (3) our ability to
anticipate interest rate changes correctly and manage interest rate risk; (4)
changes
in
local,
regional
and
international
business,
economic
or
political
conditions;
(5)
regulatory
initiatives
in
the
U.S.,
including
the
Dodd-Frank
Act, subjecting us to new and more stringent regulatory requirements; (6) the
increase in unemployment or deterioration in real estate asset values or
their failure to recover for an extended period of time; (7) adverse changes in
credit quality trends; (8) our ability to determine accurate values of
certain assets and liabilities; (9) adverse behaviors in securities, public debt,
and capital markets ; (10) unanticipated changes in our liquidity position,
including but not limited to, changes in the cost of liquidity, our ability to
enter the financial markets and to secure alternative funding sources; (11) the
soundness
of
other
financial
institutions;
(12)
our
ability
to
satisfy
new
capital
and
liquidity
standards
such
as
those
imposed
by
the
Dodd-Frank
Act
and
those
adopted
by
the
Basel
Committee;
(13)
our
ability
to
receive
dividends
from
our
subsidiary,
KeyBank;
(14)
downgrades
in
our
credit
ratings
and the credit ratings of KeyBank; (15) our ability to timely and effectively
implement our strategic initiatives; (16) operational or risk management
failures; breaches of security or failures of our technology systems due to
technological or other factors and cybersecurity threats; (17) the occurrence
of natural or man-made disasters or conflicts or terrorist attacks; (18) the
adequacy of our risk management programs; (19) adverse judicial
proceedings;
(20)
increased
competitive
pressure
due
to
industry
consolidation;
(21)
our
ability
to
attract
and
retain
talented
executives
and
employees, to effectively sell additional products or services to new or existing
customers, and to manage our reputational risks; and (22) unanticipated
adverse effects of acquisitions and dispositions of assets or businesses. We
provide greater detail regarding these factors in our 2012 Form 10-K and subsequent filings, which are available online at www.key.com/ir and
www.sec.gov. Forward looking statements speak only as of the date they are made and
Key does not undertake any obligation to update the forward- looking
statements to reflect new information or future events. This
presentation
also
includes
certain
Non-GAAP
financial
measures
related
to
“tangible
common
equity,”
“Tier
1
common
equity,”
“pre-provision
net
revenue,”
“cash efficiency ratio,”
and “adjusted cash efficiency ratio.”
Management believes these ratios may assist investors, analysts
and regulators
in analyzing Key’s financials. Although Key has procedures in place to ensure
that these measures are calculated using the appropriate GAAP or
regulatory
components,
they
have
limitations
as
analytical
tools
and
should
not
be
considered
in
isolation,
or
as
a
substitute
for
analysis
of
results
under GAAP. For more information on these calculations and to view the
reconciliations to the most comparable GAAP measures, please refer to the
Appendix to this presentation or our most recent earnings press release, which
is accessible at www.key.com/ir. |
 3
Grew average loans 5% from the prior year, driven by CF&A up 11%
Linked quarter average total loans up 4.4% annualized
Increased investment banking & debt placement fees; 4 quarter
rolling average up 29%
from prior year Completed CRE servicing acquisition (now #3 primary, #5 CMBS
special servicer in the U.S.)
Achieved expense target, with $207 million in annualized savings
Incurred charges of $41 million during 3Q13 related to efficiency initiative
(incl. pension settlement)
Consolidated 8 branches in 3Q13; 65 total from launch of efficiency initiative
Improve
Efficiency
Repurchased $198 million of common shares during 3Q13
Completed Victory divestiture on July 31; after-tax net gain of $92 million in
discontinued operations
Committed to capital priorities: organic growth, dividends, repurchases,
opportunistic growth
Optimize and
Grow
Revenue
Investor Highlights –
3Q13
Execution of strategy and differentiated business model driving results
Effectively
Manage
Capital |
 4
Financial Review |
 5
Financial Highlights
TE = Taxable equivalent, EOP = End of Period
(a)
From continuing operations
(b)
Year-over-year average balance growth
(c)
From consolidated operations
(d)
9-30-13 ratios are estimated
(e)
Non-GAAP measure: see Appendix for reconciliation
(f)
Efficiency initiative charges include pension settlement in 3Q13
Metrics
3Q13
2Q13
1Q13
4Q12
3Q12
EPS –
assuming dilution
$ .25
$ .21
$ .21
$ .20
$ .22
Cash efficiency ratio
(e)
67.5
%
69.1
%
66.0
%
69.0
%
64.1
%
Adj. cash efficiency ratio (ex. initiative charges
)
63.6
65.4
64.5
67.5
63.3
Net interest margin (TE)
3.11
3.13
3.24
3.37
3.23
Return on average total assets
1.12
.95
.99
.96
1.06
Total loans and leases
5
%
7
%
6
%
7
%
6
%
CF&A loans
11
14
16
21
24
Deposits (excl. foreign deposits)
5
8
7
7
7
Tier 1 common equity
(d), (e)
11.1
%
11.2
%
11.4
%
11.4
%
11.3
%
Tier 1 risk-based capital
(d)
11.9
11.9
12.2
12.2
12.1
Tangible common equity to tangible assets
(e)
9.9
10.0
10.2
10.2
10.4
NCOs to average loans
.28
%
.34
%
.38
%
.44
%
.86
%
NPLs to EOP portfolio loans
1.01
1.23
1.24
1.28
1.27
Allowance for loan losses to EOP loans
1.62
1.65
1.70
1.68
1.73
Financial
Performance
(a)
Balance
Sheet
Growth
(a),
(b)
Capital
(c)
Asset
Quality
(a)
(e)
(f) |
 6
3Q13 Significant Items
$ in millions, except per share amounts
Pre-tax
After-tax
EPS
(a)
Continuing operations
Leveraged lease terminations
(b)
$ 15
$ 15
$ .02
Net interest income: $(8) million; Net interest margin: (4) bps;
Noninterest income: $23 million
Efficiency initiative charges (incl. pension settlement)
$ (41)
$ (26)
$ (.03)
Total continuing operations
$ (26)
$ (11)
$ (.01)
Discontinued operations
Victory divestiture
$ 146
$ 92
$ .10
Education lending trust fair value adjustment
$ (77)
$ (48)
$ (.05)
Total discontinued operations
$ 69
$ 44
$ .05
(a)
EPS may not foot due to rounding
(b)
Excludes the total tax impact of leveraged lease terminations of $13
million, or $.01 per common share |
 7
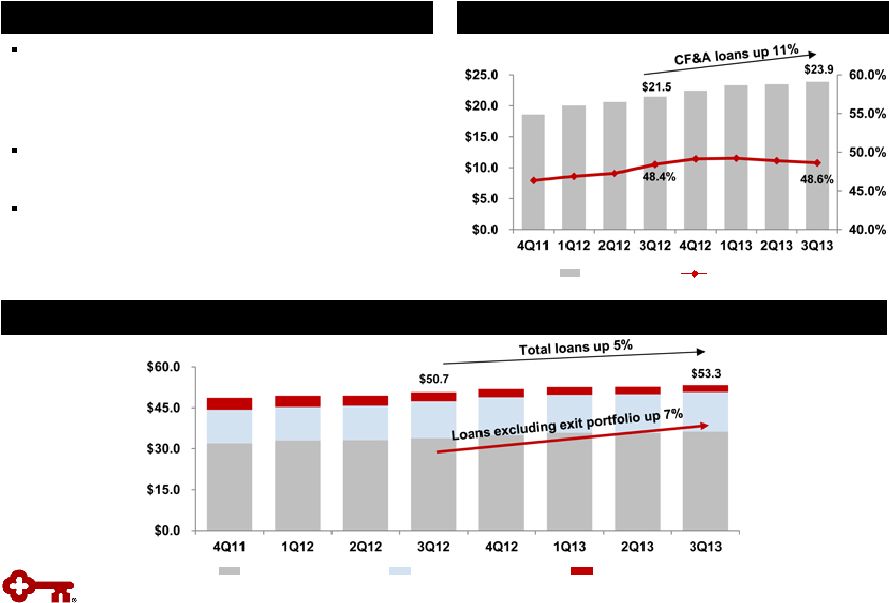
Average loan growth from prior year driven by
CF&A up 11%
–
Loan growth benefitted from distinctive
business model and client expansion
Average loans up 7% from prior year, excluding
the exit portfolio
High quality new loan originations: consistent with
moderate risk profile
Loan Growth
$ in billions
Highlights
Average Commercial, Financial & Agricultural Loans
CF&A loans
Utilization rate
Average Loans
Exit Portfolios
Home Equity & Other
Total Commercial
$ in billions |
 8
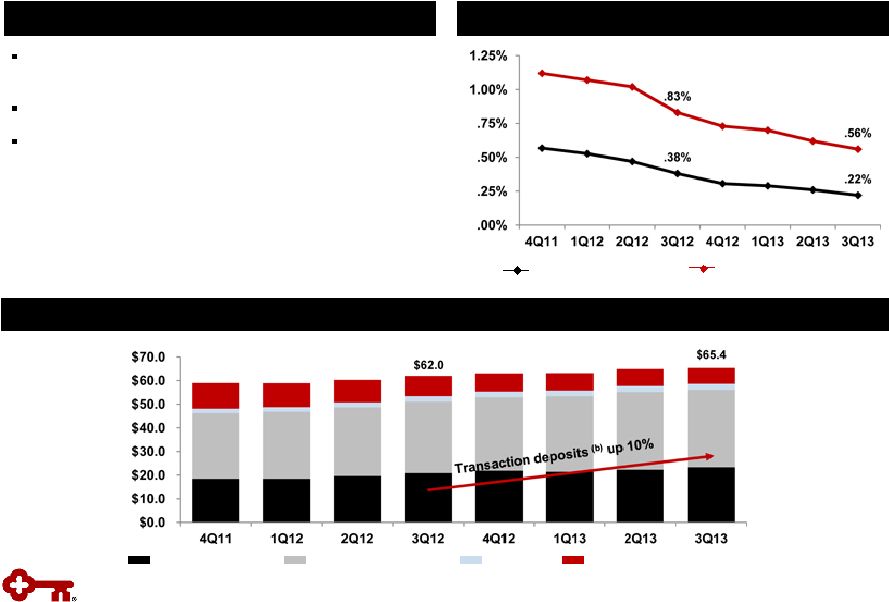
Improving Deposit Mix
Highlights
Funding Cost
Overall funding cost continues to improve, with
total deposit cost declining to 22 bps
Transaction deposit balances up 10% from 3Q12
Total CD maturities and average cost
–
2013 Q4: $1.6 billion at .78%
–
2014: $3.4 billion at 1.37%
–
2015 & beyond: $1.5 billion at 1.97%
Average
Deposits
(a)
$ in billions
(a)
Excludes deposits in foreign office
(b)
Transaction deposits include noninterest-bearing, and NOW and MMDA
Cost of total deposits
(a)
Interest-bearing liability cost
CDs and other time deposits
Savings
Noninterest-bearing
NOW and MMDA |
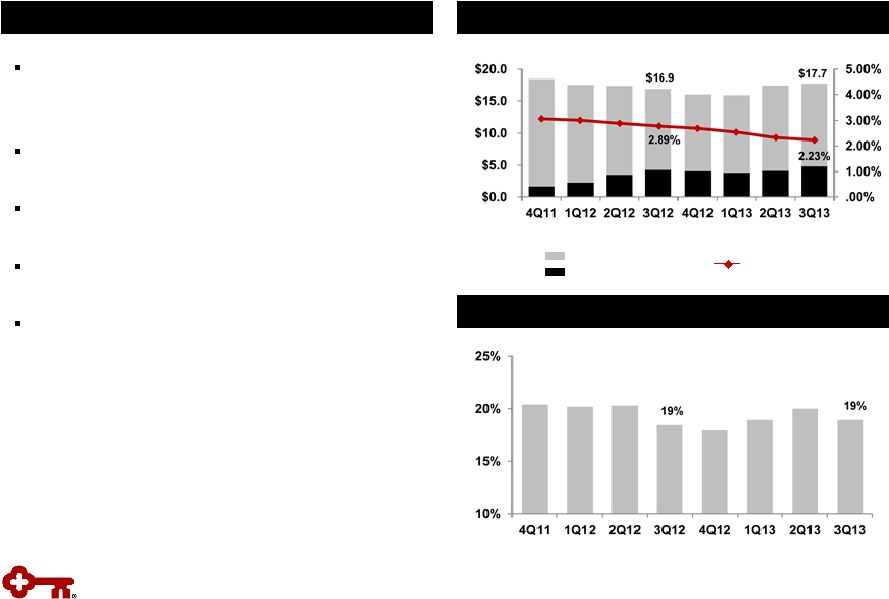
 9
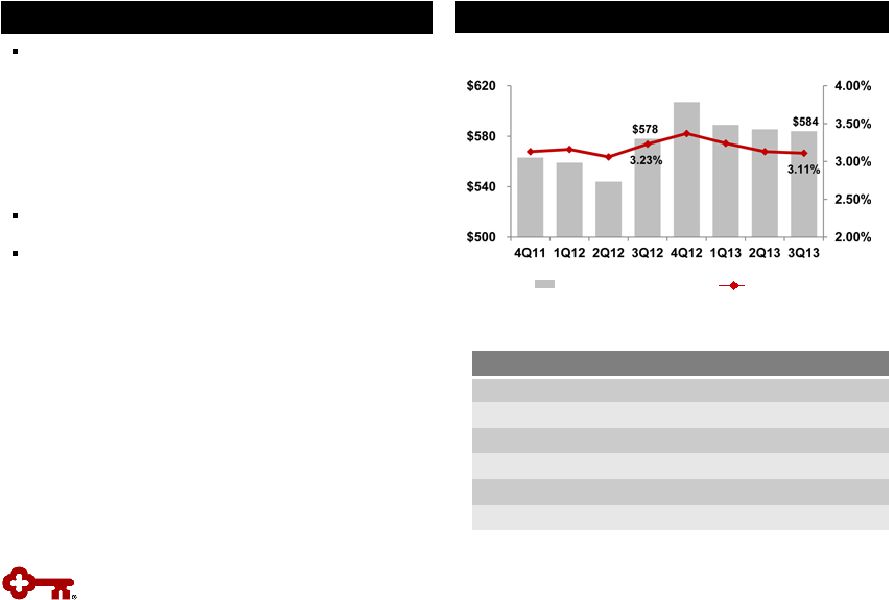
Net Interest Income and Margin
TE = Taxable equivalent
Continuing Operations
Highlights
Net Interest Income (TE) & Net Interest Margin (TE) Trend
Net interest income increased 1% from prior year
and down slightly from prior quarter
–
Early termination of leveraged leases reduced
net interest income by $13 MM in 3Q12 and by
$8 MM in 3Q13
–
Excl. impact of leveraged leases, net interest
income is up 4% from prior quarter annualized
Net interest margin down 2 bps from prior quarter
Maintaining moderate asset sensitive position
–
Naturally asset sensitive balance sheet:
approximately 70% of loans variable rate
–
High quality investment portfolio with average
life of 3.8 years
–
Flexibility to quickly adjust interest rate risk
position through use of swaps
NIM Change (bps):
vs. 2Q13
Leveraged lease terminations
(.04)
Loan yield, mix and fees
(.04)
Interest rate risk management / swaps
(.02)
Liquidity / securities
.02
Funding cost
.06
Total Change
(.02)
Net interest income (TE)
NIM (TE)
$ in millions |
 10
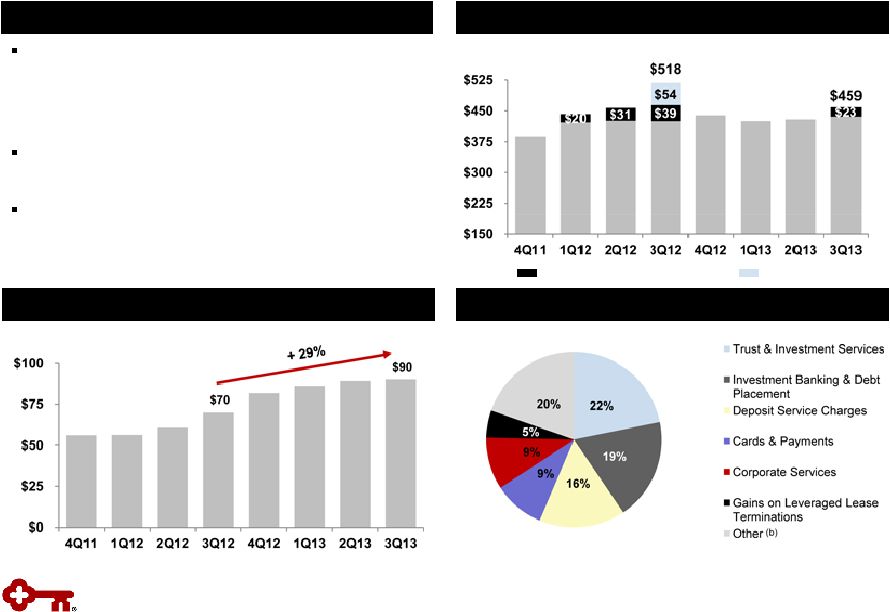
Noninterest Income
TE = Taxable equivalent
Continuing Operations
Highlights
Noninterest Income
Continued strength in core fee income categories
–
Excl. gains from TruPS and leveraged leases
(a)
,
noninterest income is up 3% from prior year and
up 7% from prior quarter annualized
Investment banking and debt placement fees, up
29% from prior year on a rolling four quarter avg.
Broad-based components of noninterest income
strengthen revenue diversity
Investment Banking & Debt Placement Fees
3Q13
Noninterest Income Components
Rolling Four Quarter Average
$ in millions
$ in millions
(a)
Excludes gains from the redemption of trust preferred securities
amounting to $54MM in 3Q12 and gains resulting from the early termination
of leveraged leases amounting to $39 MM in 3Q12 and $23 MM in 3Q13
(b)
Other includes corporate-owned life insurance, principal investing, mortgage
servicing revenue, etc. Leveraged lease termination gains
TruPS gains |
 $
in millions 11
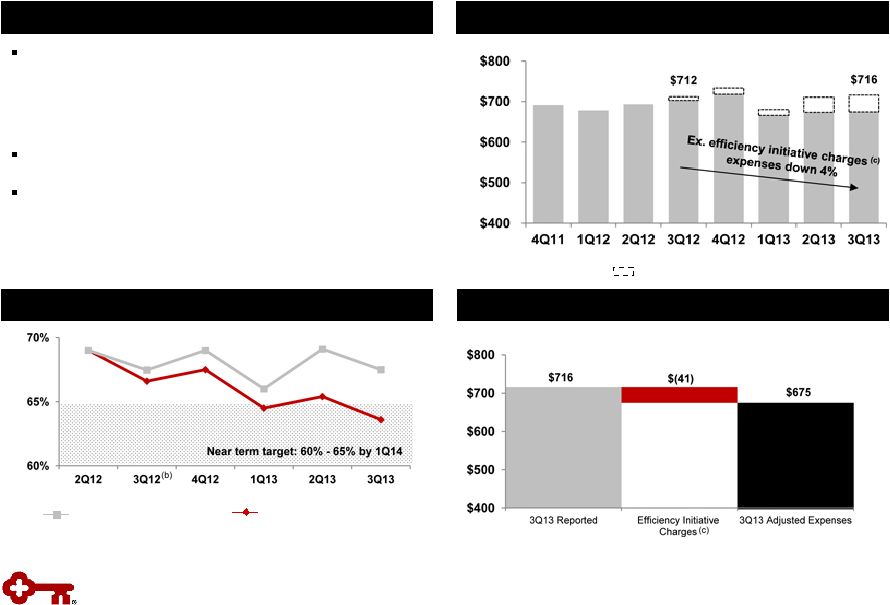
Focused Expense Management
Noninterest Expense
$ in millions
Highlights
Noninterest Expense
(a)
Non-GAAP measures: see Appendix for reconciliation
(b)
Excludes one-time gains of $54 million related to the redemption of trust
preferred securities (c)
Efficiency initiative charges includes pension settlement in 3Q13
Efficiency Ratio
(a)
Adjusted cash efficiency ratio
(ex. efficiency initiative charges )
Cash efficiency ratio
Efficiency initiative charges
(c)
(c)
Achieved expense target, with $207
million
in savings
–
3Q13 expense included $41 million related to
efficiency initiative
(c)
Focused on further efficiency improvements
Expenses excluding pension and efficiency charges:
–
Down 4% from prior year
–
Relatively flat to prior quarter due to increased
marketing spend in 3Q13 |
 12
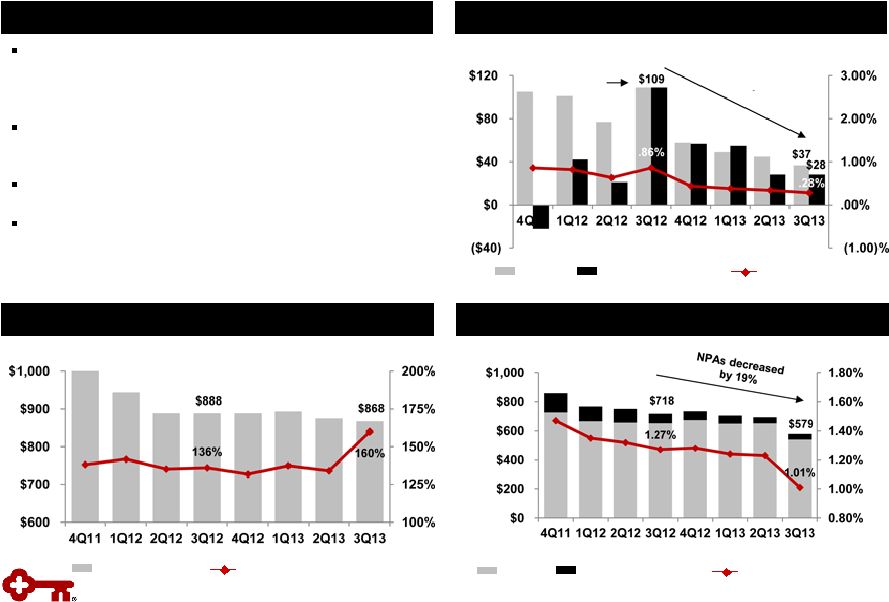
Nonperforming Assets
Net Charge-offs & Provision for Loan and Lease Losses
NPLs
NPLs to period-end loans
NCOs
Provision for loan and
lease losses
NCOs to average loans
$ in millions
$ in millions
NPLs held for sale,
OREO & other NPAs
Continued Improvement in Asset Quality
Highlights
Net loan charge-offs decreased 66% from 3Q12 to
$37MM, or 28 bps of average loans (down 42%
excluding impact of updated regulatory guidance)
3Q13 commercial loan net charge-offs were $5MM
or 5 bps of average loans
Gross recoveries up $12MM or 41% from 2Q13
Net charge-offs expected to be within or below
targeted range
Allowance for Loan and Lease Losses
Allowance for loan and
lease losses to NPLs
Allowance for loan
and lease losses
$ in millions
NCOs decreased
by 66%
Includes $45MM for
updated regulatory
guidance |
 13
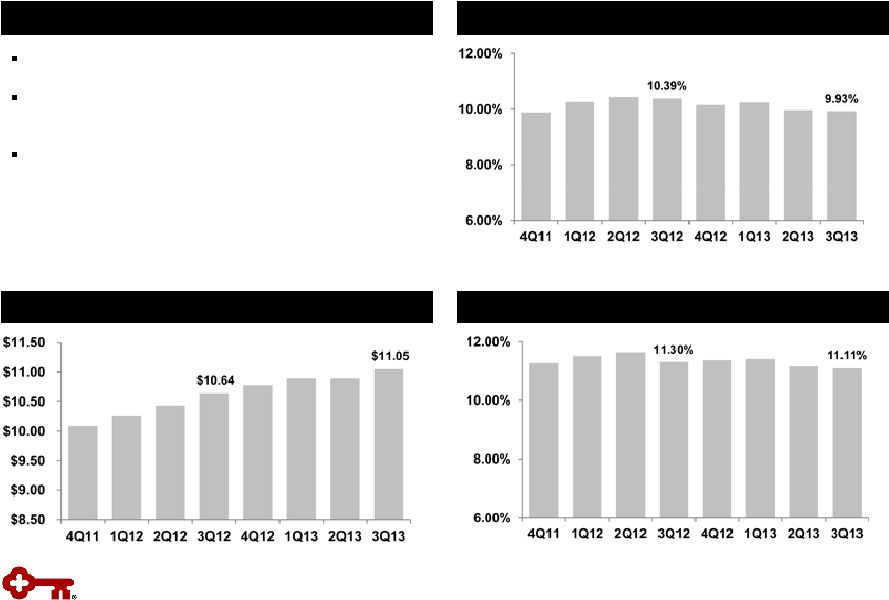
Disciplined execution of capital plan
Repurchased $198 million in common shares
during 3Q13
Estimated Tier 1 common equity ratio under the
Regulatory Capital Rules of 10.6%
(a), (b)
Tier 1 Common Equity
(b), (c)
Tangible Common Equity to Tangible Assets
(b)
Strong Capital Ratios
Highlights
Book Value per Share
(a)
Based upon September 30, 2013 pro forma analysis; see Appendix for further
detail (b)
Non-GAAP measure: see Appendix for reconciliations
(c)
9-30-13 ratio is estimated |
 14
Outlook and Expectations
Loans
•
Mid-single digit average balance growth
NIM
•
Relatively stable to the 3Q13 level over the next few quarters
•
Potential downward pressure, dependent upon level of liquidity
Revenue
•
Net interest income relatively stable in 2H13
•
Continued strength in fee income businesses
Expense
•
$680 -
$700 million for 4Q13, including one-time charges
Efficiency
•
60% -
65% cash efficiency
NCOs / Provision
•
Within or below targeted range of 40 –
60 bps of average loans
•
Provision near the level of net charge-offs
Capital
•
Remaining share repurchase authority of $187 million over the next
two quarters |
 15
Appendix |
 16
(a)
Continuing operations, unless otherwise note
(b)
Represents period-end consolidated total loans and loans held for sale
(excluding education loans in the securitization trusts) divided by
period-end consolidated total deposits (excluding deposits in foreign office)
(c)
Excludes intangible asset amortization; Non-GAAP measure: see Appendix for
reconciliation (d)
Efficiency initiative charges include pension settlement
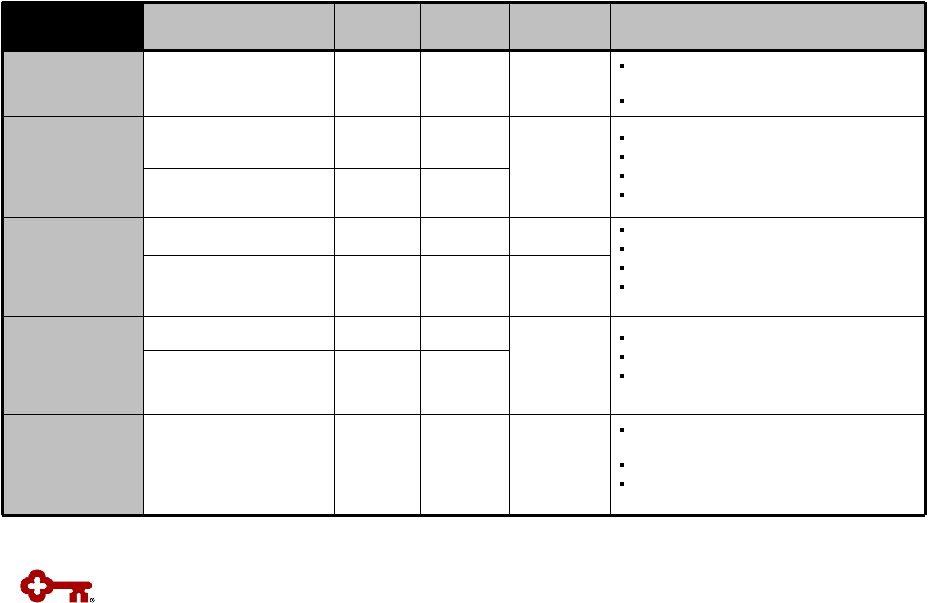
Progress on Targets for Success
KEY Business
Model
KEY Metrics
(a)
KEY
3Q13
KEY
2Q13
Targets
Action Plans
Efficient balance
sheet
Loan to deposit ratio
(b)
84%
84%
90-100%
Use integrated model to grow relationships
and loans
Improve deposit mix
Maintaining
moderate risk
profile
NCOs to average loans
.28%
.34%
40-60 bps
Focus on relationship clients
Exit noncore portfolios
Limit concentrations
Focus on risk-adjusted returns
Provision to average
loans
.21%
.21%
Growing high
quality, diverse
revenue streams
Net interest margin
3.11%
3.13%
>3.50%
Improve funding mix
Focus on risk-adjusted returns
Grow client relationships
Capitalize on Key’s total client solutions and
cross-selling capabilities
Noninterest income
to total revenue
44%
42%
>40%
Creating positive
operating
leverage
Cash efficiency ratio
(c)
68%
69%
60-65%
Improve efficiency and effectiveness
Better utilize technology
Change cost base to more variable from
fixed
Adj. cash efficiency ratio
(ex. efficiency initiative
charges
(d)
)
(c)
64%
65%
Executing our
strategies
Return on average
assets
1.12%
.95%
1.00-1.25%
Execute our client insight-driven
relationship model
Focus on operating leverage
Improved funding mix with lower cost core
deposits |
 17
Average Total Investment Securities
Highlights
Average AFS securities
$ in billions
High Quality Investment Portfolio
Portfolio composed of Agency or GSE backed
CMOs: Fannie, Freddie & GNMA
–
No private label MBS or financial paper
Average portfolio life at 9/30/13 of 3.8 years
compared to 3.2 years at 6/30/13
Unrealized net gain of $3 million on available-for-
sale securities portfolio at 9/30/13
Securities cash flows of $1.3 billion in 3Q13
and $1.5 billion in 2Q13
Yields on purchases were 67 bps lower than
3Q13 maturities
Securities to Total Assets
(b)
(a) Yield is calculated on the basis of amortized cost
(b) Includes end of period held-to-maturity and
available-for-sale securities Average yield
(a)
Average HTM securities |
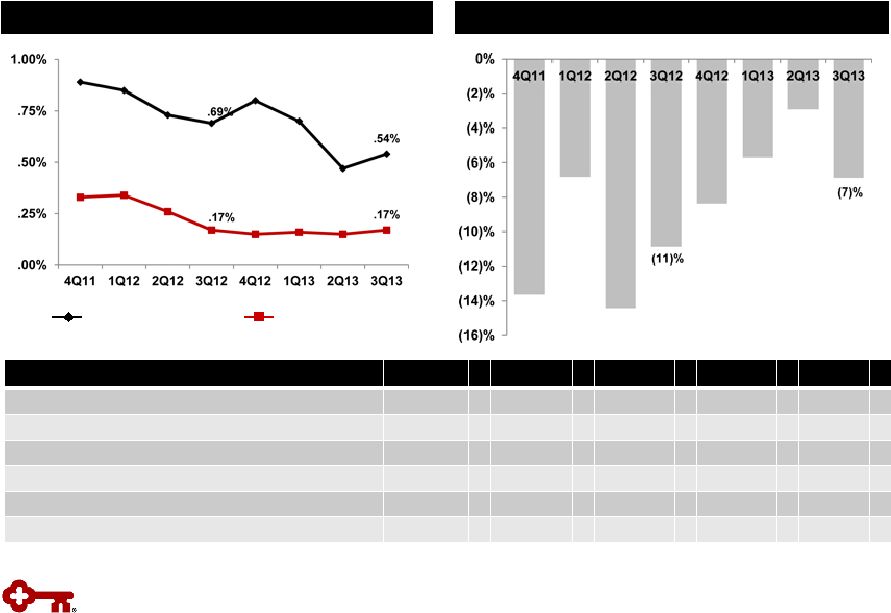 18
Asset Quality Trends
Quarterly Change in Criticized Outstandings
(a)
Delinquencies to Period-end Total Loans
(a)
Loan and lease outstandings
(b)
From continuing operations
30 –
89 days delinquent
90+ days delinquent
Metric
(b)
3Q13
2Q13
1Q13
4Q12
3Q12
Delinquencies to EOP total loans: 30-89 days
.54
%
.47
%
.70
%
.80
%
.69
%
Delinquencies to EOP total loans: 90+ days
.17
.15
.16
.15
.17
NPLs to EOP portfolio loans
1.01
1.23
1.24
1.28
1.27
NPAs to EOP portfolio loans + OREO + Other NPAs
1.08
1.30
1.34
1.39
1.39
Allowance for loan losses to period-end loans
1.62
1.65
1.70
1.68
1.73
Allowance for loan losses to NPLs
160.4
134.4
137.4
131.8
136.0
Continuing Operations
Continuing Operations |
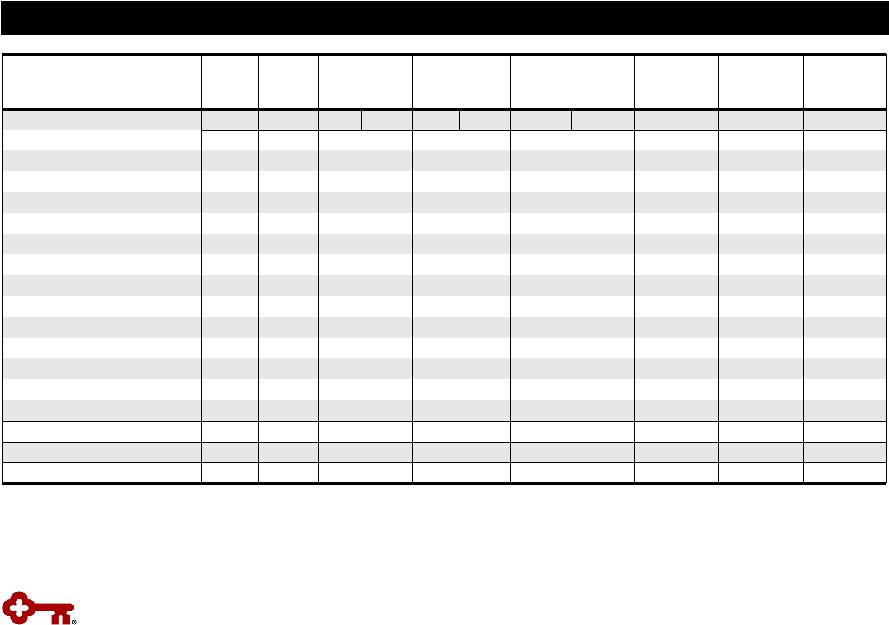 19
Period-
end
loans
Average
loans
Net loan
charge-offs
Net loan
charge-offs
(b)
/
average loans
(%)
Nonperforming
loans
(c)
Ending
allowance
(d)
Allowance /
period-end
loans
(d)
(%)
Allowance /
NPLs
(%)
9/30/13
3Q13
3Q13
2Q13
3Q13
2Q13
9/30/13
6/30/13
9/30/13
9/30/13
9/30/13
Commercial, financial and agricultural
(a)
$24,317
$23,864
$ 4
$ 8
.07
.14
$ 102
$ 146
$
370 1.52
362.75
Commercial real estate:
Commercial Mortgage
7,544
7,575
(8)
(2)
(.42)
(.11)
58
106
172
2.28
296.55
Construction
1,058
1,073
(6)
1
(2.22)
.38
17
26
36
3.40
211.76
Commercial lease financing
4,550
4,633
15
(2)
1.28
(.17)
22
14
64
1.41
290.91
Real estate
–
residential mortgage
2,198
2,193
2
4
.36
.74
98
94
35
1.59
35.71
Home equity:
Key Community Bank
10,285
10,247
12
14
.46
.56
198
205
82
.80
41.41
Other
353
364
2
5
2.18
5.16
13
16
14
3.97
107.69
Consumer other
–
Key Community Bank
1,440
1,435
7
5
1.94
1.44
2
3
27
1.88
N/M
Credit cards
698
700
8
6
4.53
3.45
4
11
34
4.87
850.00
Consumer other:
Marine
1,083
1,120
1
5
.35
1.66
25
30
31
2.86
124.00
Other
71
67
-
1
-
5.42
2
1
3
4.23
150.00
Continuing total
(e)
$53,597
$53,271
$ 37
$ 45
.28
.34
$ 541
$ 652
$
868 1.62
160.44
Discontinued operations
4,738
4,905
9
7
1.36
1.04
23
19
38
.80
165.22
Consolidated total
$58,335
$58,176
$46
$ 52
.33
.38
$ 564
$ 671
$
906 1.55
160.64
Credit Quality by Portfolio
Credit Quality
(a)
9-30-13
ending
loan
balances
include
$96
million
of
commercial
credit
card
balances;
9-30-13
average
loan
balances
include
$96
million
of
assets
from commercial credit cards
(b)
Net loan charge-off amounts are annualized in calculation. NCO ratios for
discontinued operations and consolidated Key exclude education loans in the
securitization trusts since valued at fair-market value (c)
9-30-13 and 6-30-13 NPL amounts exclude $18 million and $19
million respectively of purchased credit impaired loans acquired in July 2012.
(d) 9-30-13 allowance by portfolio is estimated.
Allowance/period loans ratios for discontinued operations and consolidated Key exclude education
loans in the securitization trusts since valued at fair-market value
(e) 9-30-13 ending loan balances include purchased loans of $176
million of which $18 million were purchased credit impaired $ in millions
N/M = Not Meaningful |
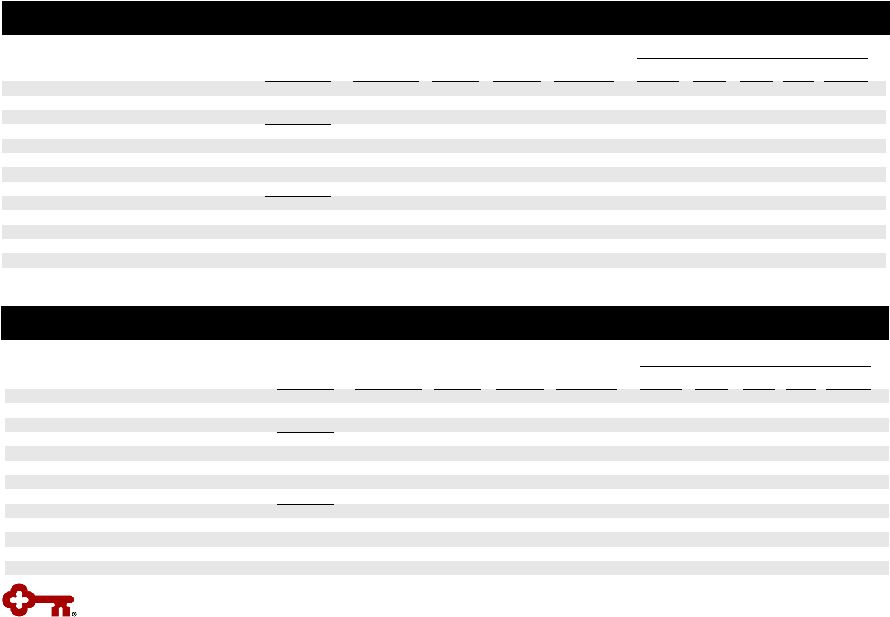 Vintage (% of Loans)
Loan
Balances
Average Loan
Size ($)
Average
FICO
Average
LTV
(a)
% of Loans
LTV>90%
2012 and
later
2011
2010
2009
2008 and
prior
Home equity loans and lines
First lien
$
16
$
23,209
744
35
%
.4
%
-
-
1%
1%
98
%
Second lien
337
23,003
729
82
32.5
-
-
-
-
100
Total home equity loans and lines
$
353
23,013
729
80
31.0
-
-
-
-
100
Nonaccrual loans
First lien
$
1
$
24,247
729
33
%
-
-
-
-
-
100
%
Second lien
12
24,712
702
82
35.1
%
-
-
-
-
100
Total home equity nonaccrual loans
$
13
24,685
703
80
33.0
-
-
-
-
100
Exit Portfolio -
Home Equity
Third quarter net charge-offs
$
2 -
-
-
-
100
%
Net loan charge-offs to average loans
2.18
%
Vintage (% of Loans)
Loan
Balances
Average Loan
Size ($)
Average
FICO
Average
LTV
(a)
% of Loans
LTV>90%
2012 and
later
2011
2010
2009
2008 and
prior
Home equity loans and lines
First lien
$ 5,932
$
67,691
765
67
%
.6
%
40
%
6%
4
%
4
%
46%
Second lien
4,353
47,569
760
76
3.2
25
6
4
4
61
Total home equity loans and lines
$
10,285
57,525
763
71
1.8
33
6
4
4
53
Nonaccrual loans
First lien
$
108
$
58,708
713
73
%
.4%
2
%
3%
3
%
5
%
87%
Second lien
90
48,922
711
78
2.0
-
2
2
4
92
Total home equity nonaccrual loans
$
198
53,794
712
75
1.1
1
2
3
5
89
Community Bank -
Home Equity
Third quarter net charge-offs
$
12
-
3%
-
4
%
93%
Net loan charge-offs to average loans
.46
%
20
(a)
Average LTVs are at origination. Current average LTVs for Community Bank total
home equity loans and lines is approximately 74%, which compares to 75% at
the end of the second quarter 2013. Community Bank –
Home Equity
Exit Portfolio –
Home Equity
$ in millions, except average loan size
Home Equity Loans –
9/30/13
$ in millions, except average loan size |
 Balance Outstanding
Change
Net Loan Charge-offs
Balance on
Nonperforming Status
9-30-13
6-30-13
9-30-13
vs.
6-30-13
3Q13
(c)
2Q13
(c)
9-30-13
6-30-13
Residential properties –
homebuilder
$ 26
$ 26
-
-
$ 1
$ 8
$ 8
Marine and RV floor plan
25
28
$ (3)
-
-
6
7
Commercial lease financing
(a)
796
931
(135)
$ (2)
(2)
1
1
Total commercial loans
847
985
(138)
(2)
(1)
15
16
Home equity –
Other
353
375
(22)
2
5
14
16
Marine
1,083
1,160
(77)
1
5
25
31
RV and other consumer
71
69
2
-
1
2
-
Total consumer loans
1,507
1,604
(97)
3
11
41
47
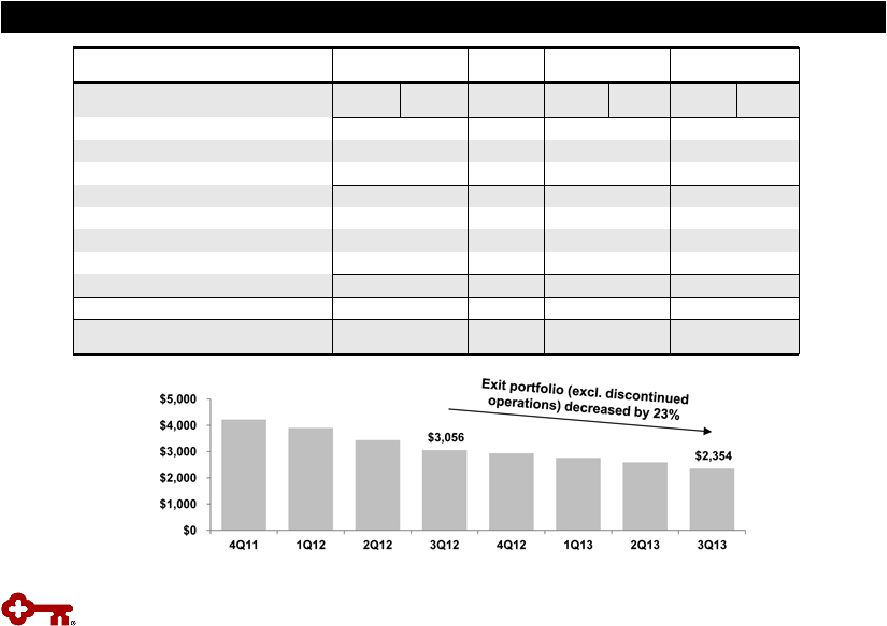
Total exit loans in loan portfolio
$ 2,354
$ 2,589
$ (235)
$ 1
$ 10
$ 56
$ 63
Discontinued operations –
education lending
business (not included in exit loans above)
(b)
$ 4,738
$ 4,992
$ (254)
$ 9
$ 7
$ 23
$ 19
21
$ in millions
(a)
Includes (1) the business aviation, commercial vehicle, office products,
construction and industrial leases; (2) Canadian lease financing portfolios;
and (3) all remaining balances related to lease in, lease out; sale in, lease out;
service contract leases; and qualified technological equipment leases (b)
Includes loans in Key’s consolidated education loan securitization
trusts (c)
Credit amounts indicate recoveries exceeded charge-offs
$ in millions
Exit Loan Portfolio
Exit Loan Portfolio |
 Three months ended
9-30-13
6-30-13
9-30-12
Tangible common equity to tangible assets at period end
Key shareholders’
equity (GAAP)
$
10,206
$
10,229
$
10,251
Less:
Intangible assets
(a)
1,017
1,021
1,031
Preferred Stock, Series A
(b)
282
282
291
Tangible common equity (non-GAAP)
$
8,907
$
8,926
$
8,929
Total assets (GAAP)
$
90,708
$
90,639
$
86,950
Less:
Intangible assets
(a)
1,017
1,021
1,031
Tangible assets (non-GAAP)
$
89,691
$
89,618
$
85,919
Tangible common equity to tangible assets ratio (non-GAAP)
9.93
%
9.96
%
10.39
%
Tier 1 common equity at period end
Key shareholders' equity (GAAP)
$
10,206
$
10,229
$
10,251
Qualifying capital securities
339
339
339
Less:
Goodwill
979
979
979
Accumulated other comprehensive income (loss)
(c)
(409)
(359)
(109)
Other assets
(d)
97
101
121
Total Tier 1 capital (regulatory)
9,878
9,847
9,599
Less:
Qualifying capital securities
339
339
339
Preferred Stock, Series A
(b)
282
282
291
Total Tier 1 common equity (non-GAAP)
$
9,257
$
9,226
$
8,969
Net risk-weighted assets (regulatory)
(d), (e)
$
83,335
$
82,528
$
79,363
Tier 1 common equity ratio (non-GAAP)
(e)
11.11
%
11.18
%
11.30
%
Pre-provision net revenue
Net interest income (GAAP)
$
578
$
581
$
572
Plus:
Taxable-equivalent adjustment
6
5
6
Noninterest income (GAAP)
459
429
518
Less:
Noninterest expense (GAAP)
716
711
712
Pre-provision net revenue from continuing operations (non-GAAP)
$
327
$
304
$
384
GAAP to Non-GAAP Reconciliation
22
$ in millions
(a)
Three months ended September 30, 2013, June 30, 2013, and September 30, 2012
exclude $99 million, $107 million, and $130 million, respectively, of
period end purchased credit card receivable intangible assets (b)
Net of capital surplus for the three months ended September 30, 2013 and June 30,
2013 (c)
Includes net unrealized gains or losses on securities available for sale (except
for net unrealized losses on marketable equity securities), net gains or
losses on cash flow hedges, and amounts resulting from the application of the applicable accounting guidance for defined benefit and other
postretirement plans
(d)
Other assets deducted from Tier 1 capital and net risk-weighted assets consist
of disallowed intangible assets (excluding goodwill) and deductible
portions of nonfinancial equity investments. There were no disallowed deferred tax assets at 9-30-13, 6-30-13, and 9-30-12
(e)
9-30-13 amount is estimated |
 GAAP
to Non-GAAP Reconciliation (continued) $ in millions
23
(a)
Three months ended September 30, 2013, June 30, 2013, and September 30, 2012
exclude $103 million, $110 million and $86 million, respectively, of
average ending purchased credit card receivable intangible assets
Three months ended
9-30-13
6-30-13
9-30-12
Average tangible common equity
Average Key shareholders' equity (GAAP)
$
10,237
$
10,314
$
10,222
Less:
Intangible assets (average)
(a)
1,019
1,023
1,026
Preferred Stock, Series A (average)
291
291
291
Average tangible common equity (non-GAAP)
$
8,927
$
9,000
$
8,905
Return on average tangible common equity from continuing operations
Net income (loss) from continuing operations attributable to Key
common shareholders
(GAAP)
$
229
$
193
$
211
Average tangible common equity (non-GAAP)
8,927
9,000
8,905
Return on average tangible common equity from continuing operations
(non-GAAP) 10.18
%
8.60
%
9.43
%
Return on average tangible common equity consolidated
Net income (loss) attributable to Key common shareholders (GAAP)
$
266
$
198
$
214
Average tangible common equity (non-GAAP)
8,927
9,000
8,905
Return on average tangible common equity consolidated (non-GAAP)
11.82
%
8.82
%
9.56
%
Cash efficiency ratio
Noninterest expense (GAAP)
$
716
$
711
$
712
Less:
Intangible asset amortization on credit cards (GAAP)
8
7
6
Other intangible asset amortization (GAAP)
4
3
3
Adjusted noninterest expense (non-GAAP)
$
704
$
701
$
703
Net interest income (GAAP)
$
578
$
581
$
572
Plus:
Taxable-equivalent adjustment
6
5
6
Noninterest income (GAAP)
459
429
518
Total taxable-equivalent revenue (non-GAAP)
$
1,043
$
1,015
$
1,096
Cash efficiency ratio (non-GAAP)
67.5
%
69.1
%
64.1
%
Adjusted cash efficiency ratio
Adjusted noninterest expense (non-GAAP)
$
704
$
701
$
703
Less:
Efficiency initiative and pension settlement charges (non-GAAP)
41
37
9
Net adjusted noninterest expense (non-GAAP)
$
663
$
664
$
694
Total taxable-equivalent revenue (non-GAAP)
$
1,043
$
1,015
$
1,096
Adjusted cash efficiency ratio (non-GAAP)
63.6
%
65.4
%
63.3
% |
 Tier 1
Common Equity Under the Regulatory Capital Rules, Incorporating Basel III
Guidance (estimated) (a)
KeyCorp & Subsidiaries
24
$ in billions
Quarter ended
Sept. 30, 2013
Tier 1 common equity under current regulatory rules
$
9.3 Adjustments from current regulatory rules
to the Regulatory Capital Rules: Deferred tax assets and PCCRs
(b)
(.1)
Tier 1 common equity anticipated under the Regulatory Capital Rules
(c)
$
9.1 Total risk-weighted
assets under current regulatory rules
$
83.3 Adjustments from current regulatory rules to the
Regulatory Capital Rules: Loan commitments <1 year
.5
Past Due Loans
.2
Mortgage servicing assets
(d)
.6
Deferred tax assets
(d)
.2
Other
1.5
Total risk-weighted assets anticipated under the Regulatory Capital
Rules
$
86.3 Tier 1 common equity ratio under the Regulatory Capital
Rules 10.6
%
(a)
Tier
1
common
equity
is
a
non-generally
accepted
accounting
principle
(GAAP)
financial
measure
that
is
used
by
investors,
analysis
and
bank
regulatory agencies to assess the capital position of financial services
companies; management reviews Tier 1 common equity along with other
measures of capital as part of its financial analyses
(b)
Includes the deferred tax asset subject to future taxable income
for realization, primarily tax credit carryforwards as well as the deductible
portion of purchased credit card receivables
(c)
The
anticipated
amount
of
regulatory
capital
and
risk-weighted
assets
is
based
upon
the
federal
banking
agencies’
Regulatory
Capital
Rules
(as
fully phased-in on January 1, 2019); Key is subject to the Regulatory
Capital Rules under the “standardized approach”
(d)
Item is included in the 10%/15% exceptions bucket calculation and is
risk-weighted at 250% Table may not foot due to rounding
|