Attached files
| file | filename |
|---|---|
| 8-K - FORM 8-K - AMERICAN EAGLE ENERGY Corp | v357443_8k.htm |
| EX-99.2 - EXHIBIT 99.2 - AMERICAN EAGLE ENERGY Corp | v357443_ex99-2.htm |
American Eagle Energy Corp (AMZG) Investor Presentation October 2013 Williston Basin (Bakken / Three Forks) Oil Focused Operator
F ORWARD L OOKING I NFORMATION 2 This presentation includes forward - looking statements within the meaning of Section 27 A of the Securities Act of 1933 , as amended (the “Securities Act”), and Section 21 E of the Securities Exchange Act of 1934 , as amended (the “Exchange Act”) . All statements other than statements of historical facts are forward - looking statements . Such statements can be identified by the use of forward - looking terminology such as “believe,” “expect,” “may,” “should,” “seek,” “on - track,” “plan,” “project,” “forecast,” “intend” or “anticipate,” or the negative thereof or comparable terminology, or by discussions of vision, strategy or outlook, including statements related to our beliefs and intentions with respect to our growth strategy, including the amount we may invest, the location, and the scale of the drilling projects in which we intend to participate ; our beliefs with respect to the potential value of drilling projects ; our beliefs with regard to the impact of environmental and other regulations on our business ; our beliefs with respect to the strengths of our business model ; our assumptions, beliefs, and expectations with respect to future market conditions ; our plans for future capital expenditures ; and our capital needs, the adequacy of our capital resources, and potential sources of capital . You are cautioned that our business and operations are subject to a variety of risks and uncertainties, many of which are beyond our control and, consequently, our actual results may differ materially from those projected by any forward - looking statements . The SEC permits oil and natural gas companies, in their SEC filings, to disclose only reserves anticipated to be economically producible, as of a given date, by application of development projects to known accumulations . We use certain terms in this presentation, such as total potential, unrisked potential, de - risked, un - risked drilling locations and EUR (expected ultimate recovery), that the SEC’s guidelines strictly prohibit us from using in our SEC filings . These terms represent our internal estimates of volumes of oil and natural gas that are not proved reserves but are potentially recoverable through exploratory drilling or additional drilling or recovery techniques and are not intended to correspond to probable or possible reserves as defined by SEC regulations . By their nature these estimates are more speculative than proved, probable or possible reserves and subject to greater risk they will not be realized . The company has based these forward - looking statements on current expectations and assumptions about future events . While the company’s management considers these expectations and assumptions to be reasonable, they are inherently subject to significant business, economic, competitive, regulatory and other risks, contingencies and uncertainties, most of which are difficult to predict and many of which are beyond the company’s control . Accordingly, results actually achieved may differ materially from expected results in these statements . Forward - looking statements speak only as of the date they are made . The company does not undertake, and specifically disclaims, any obligation to update any forward - looking statements to reflect events or circumstances occurring after the date of such statements, other than as may be required by applicable law or regulation . You are urged not to place undue reliance on these forward - looking statements . You are also urged to carefully review and consider the various disclosures made by the company in its reports filed with the SEC, which attempt to advise interested parties of the risks and factors that may affect its business, financial condition, results of operation and cash flows . If one or more of these risks or uncertainties materialize, or if the underlying assumptions prove incorrect, the company’s actual results may vary materially from those expected or projected . All forward-looking statements speak only as of the date of this presentation and American Eagle Energy Corporation assumes no obligation to, and expressly disclaims any obligation to, update or revise any forward-looking statement, except as required by law . You should not place undue reliance on these forward-looking statements .
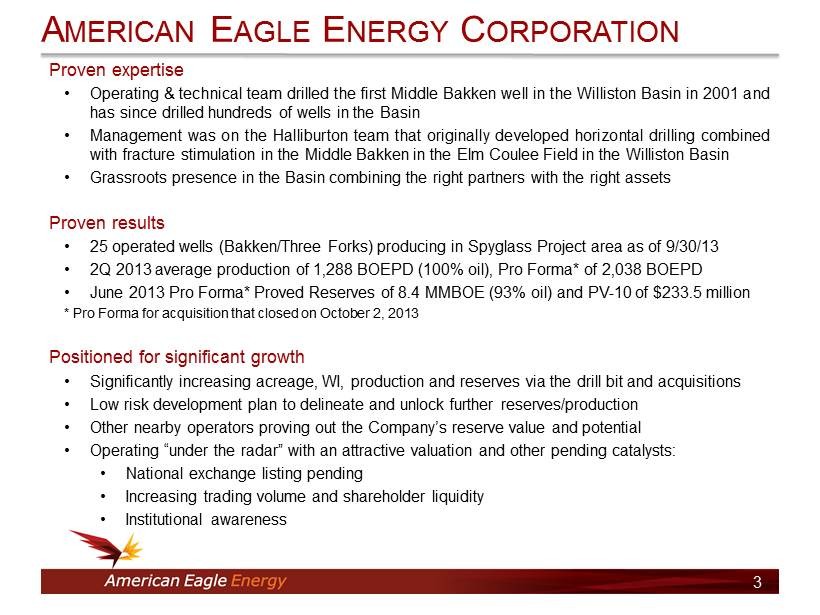
A MERICAN E AGLE E NERGY C ORPORATION Proven expertise • Operating & technical team drilled the first Middle Bakken well in the Williston Basin in 2001 and has since drilled hundreds of wells in the Basin • Management was on the Halliburton team that originally developed horizontal drilling combined with fracture stimulation in the Middle Bakken in the Elm Coulee Field in the Williston Basin • Grassroots presence in the Basin combining the right partners with the right assets Proven results • 25 operated wells (Bakken/Three Forks) producing in Spyglass Project area as of 9 / 30 / 13 • 2 Q 2013 average production of 1 , 288 BOEPD ( 100 % oil), Pro Forma* of 2 , 038 BOEPD • June 2013 Pro Forma* Proved Reserves of 8 . 4 MMBOE ( 93 % oil) and PV - 10 of $ 233 . 5 million * Pro Forma for acquisition that closed on October 2 , 2013 Positioned for significant growth • Significantly increasing acreage, WI, production and reserves via the drill bit and acquisitions • Low risk development plan to delineate and unlock further reserves/production • Other nearby operators proving out the Company’s reserve value and potential • Operating “under the radar” with an attractive valuation and other pending catalysts : • National exchange listing pending • Increasing trading volume and shareholder liquidity • Institutional awareness 3
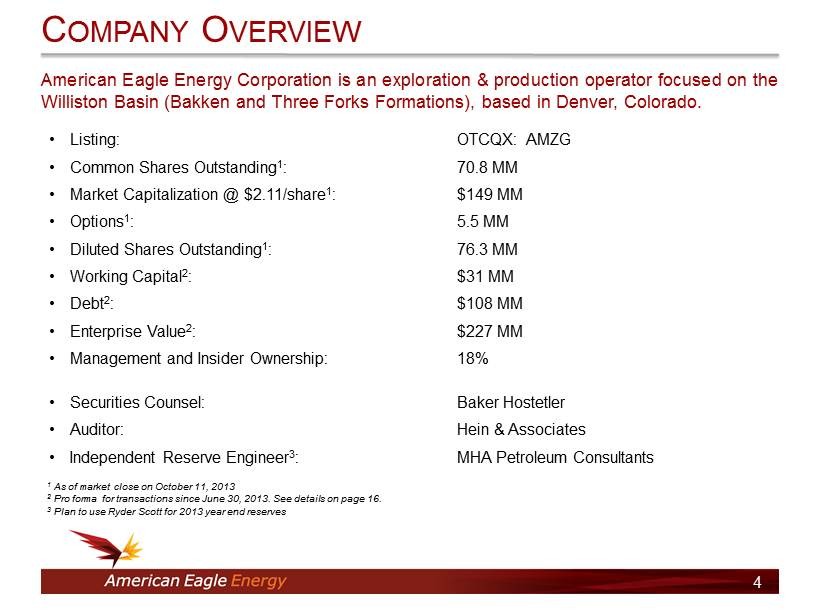
American Eagle Energy Corporation is an exploration & production operator focused on the Williston Basin (Bakken and Three Forks Formations), based in Denver, Colorado . 4 C OMPANY O VERVIEW • Listing: OTCQX : AMZG • Common Shares Outstanding 1 : 70.8 MM • Market Capitalization @ $2.11/share 1 : $149 MM • Options 1 : 5.5 MM • Diluted Shares Outstanding 1 : 76.3 MM • Working Capital 2 : $31 MM • Debt 2 : $108 MM • Enterprise Value 2 : $227 MM • Management and Insider Ownership: 18% • Securities Counsel: Baker Hostetler • Auditor: Hein & Associates • Independent Reserve Engineer 3 : MHA Petroleum Consultants 1 As of market close on October 11 , 2013 2 Pro forma for transactions since June 30 , 2013 . See details on page 16 . 3 Plan to use Ryder Scott for 2013 year end reserves
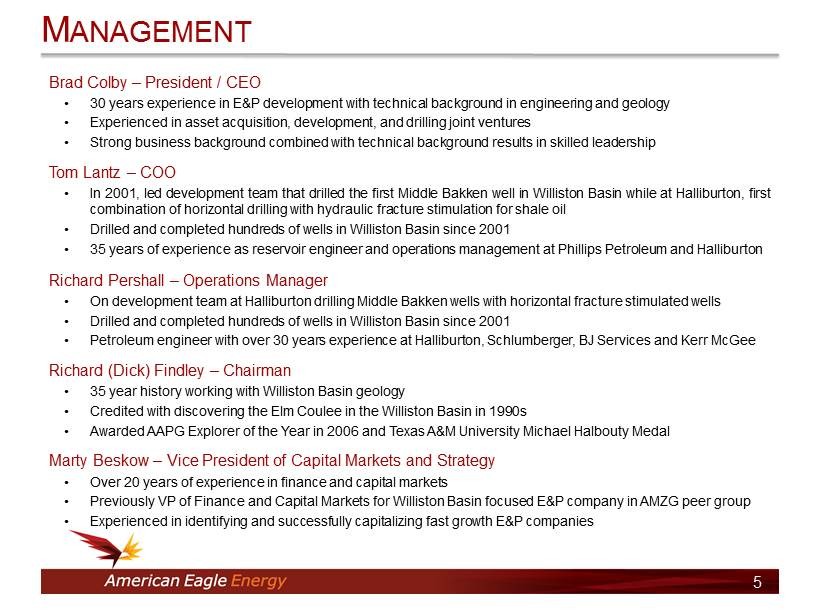
Brad Colby – President / CEO • 30 years experience in E&P development with technical background in engineering and geology • Experienced in asset acquisition, development, and drilling joint ventures • Strong business background combined with technical background results in skilled leadership Tom Lantz – COO • In 2001 , led development team that drilled the first Middle Bakken well in Williston Basin while at Halliburton, first combination of horizontal drilling with hydraulic fracture stimulation for shale oil • Drilled and completed hundreds of wells in Williston Basin since 2001 • 35 years of experience as reservoir engineer and operations management at Phillips Petroleum and Halliburton Richard Pershall – Operations Manager • On development team at Halliburton drilling Middle Bakken wells with horizontal fracture stimulated wells • Drilled and completed hundreds of wells in Williston Basin since 2001 • Petroleum engineer with over 30 years experience at Halliburton, Schlumberger, BJ Services and Kerr McGee Richard (Dick) Findley – Chairman • 35 year history working with Williston Basin geology • Credited with discovering the Elm Coulee in the Williston Basin in 1990 s • Awarded AAPG Explorer of the Year in 2006 and Texas A&M University Michael Halbouty Medal Marty Beskow – Vice President of Capital Markets and Strategy • Over 20 years of experience in finance and capital markets • Previously VP of Finance and Capital Markets for Williston Basin focused E&P company in AMZG peer group • Experienced in identifying and successfully capitalizing fast growth E&P companies M ANAGEMENT 5

W ILLISTON B ASIN – S PYGLASS O PERATING A REA 6
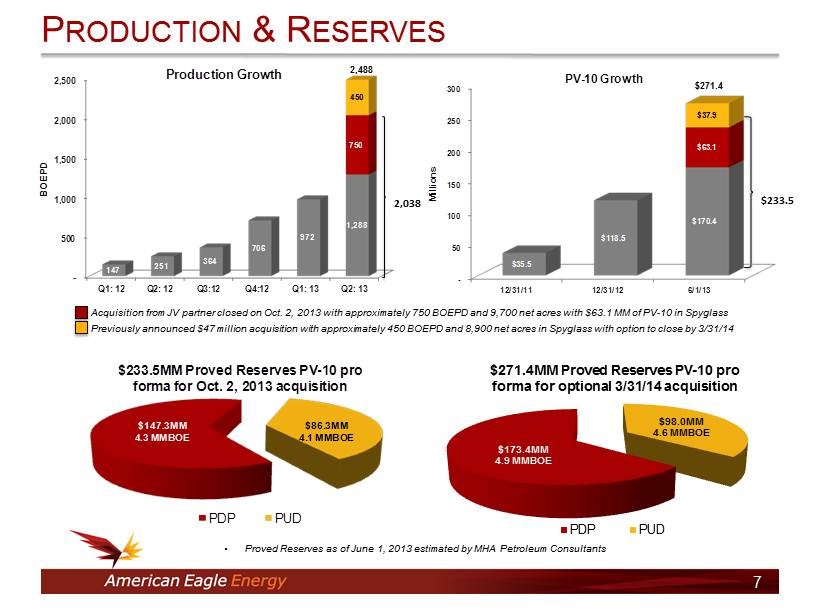
P RODUCTION & R ESERVES 7 Acquisition from JV partner closed on Oct. 2, 2013 with approximately 750 BOEPD and 9,700 net acres with $63.1 MM of PV - 10 in Sp yglass Previously announced $47 million acquisition with approximately 450 BOEPD and 8,900 net acres in Spyglass with option to clos e b y 3/31/14 • Proved Reserves as of June 1, 2013 estimated by MHA Petroleum Consultants 2,488 $271.4 $173.4MM 4.9 MMBOE $98.0MM 4.6 MMBOE $271.4MM Proved Reserves PV - 10 pro forma for optional 3/31/14 acquisition PDP PUD - 500 1,000 1,500 2,000 2,500 Q1: 12 Q2: 12 Q3:12 Q4:12 Q1: 13 Q2: 13 147 251 364 706 972 1,288 750 450 BOEPD Production Growth $233.5 2,038 $147.3MM 4.3 MMBOE $86.3MM 4.1 MMBOE $233.5MM Proved Reserves PV - 10 pro forma for Oct. 2, 2013 acquisition PDP PUD - 50 100 150 200 250 300 12/31/11 12/31/12 6/1/13 $35.5 $118.5 $170.4 $63.1 $37.9 Millions PV - 10 Growth
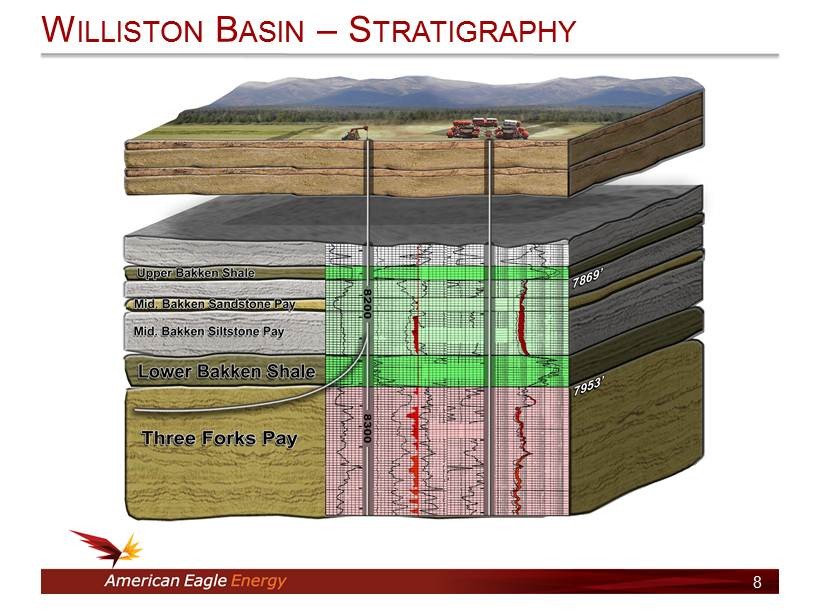
8 W ILLISTON B ASIN – S TRATIGRAPHY
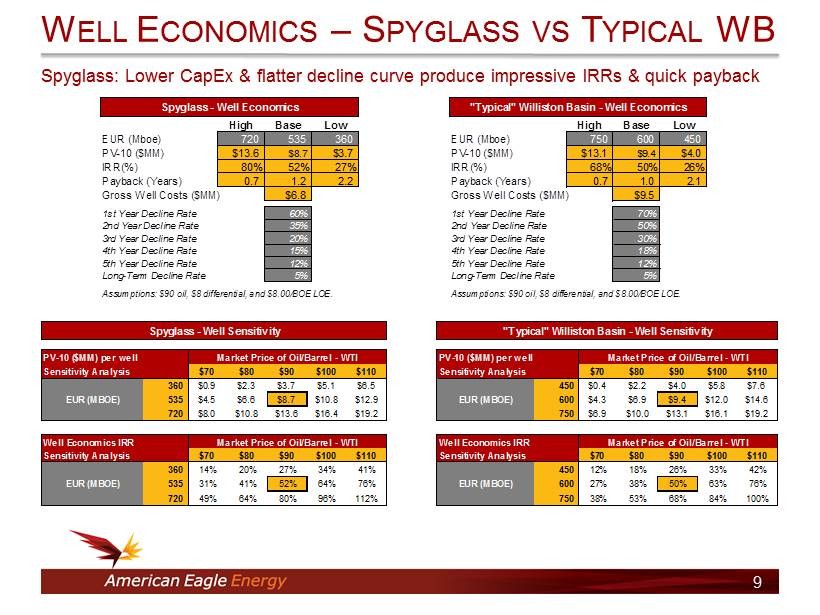
Spyglass: Lower CapEx & flatter decline curve produce impressive IRRs & quick payback W ELL E CONOMICS – S PYGLASS VS T YPICAL WB 9 High Base Low EUR (Mboe) 720 535 360 PV-10 ($MM) $13.6 $8.7 $3.7 IRR(%) 80% 52% 27% Payback (Years) 0.7 1.2 2.2 Gross Well Costs ($MM) $6.8 1st Year Decline Rate 60% 2nd Year Decline Rate 35% 3rd Year Decline Rate 20% 4th Year Decline Rate 15% 5th Year Decline Rate 12% Long-Term Decline Rate 5% Assumptions: $90 oil, $8 differential, and $8.00/BOE LOE. Spyglass - Well Economics High Base Low EUR (Mboe) 750 600 450 PV-10 ($MM) $13.1 $9.4 $4.0 IRR(%) 68% 50% 26% Payback (Years) 0.7 1.0 2.1 Gross Well Costs ($MM) $9.5 1st Year Decline Rate 70% 2nd Year Decline Rate 50% 3rd Year Decline Rate 30% 4th Year Decline Rate 18% 5th Year Decline Rate 12% Long-Term Decline Rate 5% Assumptions: $90 oil, $8 differential, and $8.00/BOE LOE. "Typical" Williston Basin - Well Economics PV-10 ($MM) per well Market Price of Oil/Barrel - WTI PV-10 ($MM) per well Market Price of Oil/Barrel - WTI Sensitivity Analysis $70 $80 $90 $100 $110 Sensitivity Analysis $70 $80 $90 $100 $110 360 $0.9 $2.3 $3.7 $5.1 $6.5 450 $0.4 $2.2 $4.0 $5.8 $7.6 EUR (MBOE) 535 $4.5 $6.6 $8.7 $10.8 $12.9 EUR (MBOE) 600 $4.3 $6.9 $9.4 $12.0 $14.6 720 $8.0 $10.8 $13.6 $16.4 $19.2 750 $6.9 $10.0 $13.1 $16.1 $19.2 Well Economics IRR Market Price of Oil/Barrel - WTI Well Economics IRR Market Price of Oil/Barrel - WTI Sensitivity Analysis 0% $70 $80 $90 $100 $110 Sensitivity Analysis 0% $70 $80 $90 $100 $110 360 14% 20% 27% 34% 41% 450 12% 18% 26% 33% 42% EUR (MBOE) 535 31% 41% 52% 64% 76% EUR (MBOE) 600 27% 38% 50% 63% 76% 720 49% 64% 80% 96% 112% 750 38% 53% 68% 84% 100% Spyglass - Well Sensitivity "Typical" Williston Basin - Well Sensitivity

Spyglass Three Forks production curve is flat over last several months S PYGLASS – 1 ST T HREE F ORKS W ELL 10

Spyglass Middle Bakken production curve is flat, similar to Three Forks wells S PYGLASS – M IDDLE B AKKEN W ELL 11
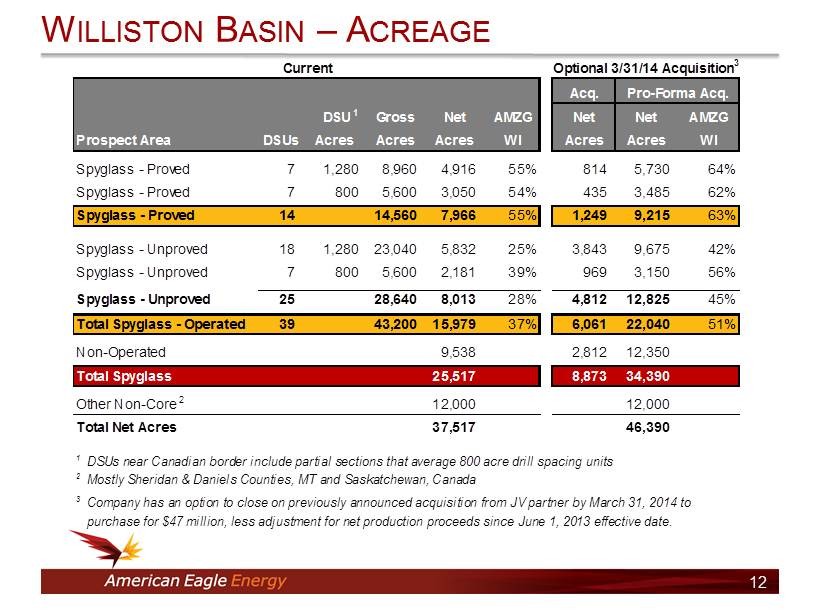
W ILLISTON B ASIN – A CREAGE 12 Acq. DSU 1 Gross Net AMZG Net Net AMZG Prospect Area DSUs Acres Acres Acres WI Acres Acres WI Spyglass - Proved 7 1,280 8,960 4,916 55% 814 5,730 64% Spyglass - Proved 7 800 5,600 3,050 54% 435 3,485 62% Spyglass - Proved 14 14,560 7,966 55% 1,249 9,215 63% Spyglass - Unproved 18 1,280 23,040 5,832 25% 3,843 9,675 42% Spyglass - Unproved 7 800 5,600 2,181 39% 969 3,150 56% Spyglass - Unproved 25 28,640 8,013 28% 4,812 12,825 45% Total Spyglass - Operated 39 43,200 15,979 37% 6,061 22,040 51% Non-Operated 9,538 2,812 12,350 Total Spyglass 25,517 8,873 34,390 Other Non-Core 2 12,000 12,000 Total Net Acres 37,517 46,390 1 DSUs near Canadian border include partial sections that average 800 acre drill spacing units 2 Mostly Sheridan & Daniels Counties, MT and Saskatchewan, Canada 3 Company has an option to close on previously announced acquisition from JV partner by March 31, 2014 to purchase for $47 million, less adjustment for net production proceeds since June 1, 2013 effective date. Current Optional 3/31/14 Acquisition 3 Pro-Forma Acq.
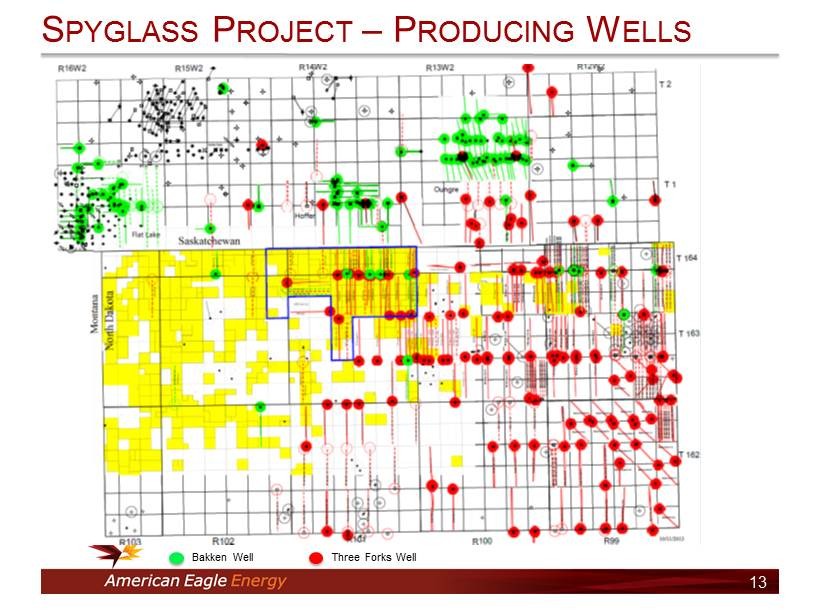
S PYGLASS P ROJECT – P RODUCING W ELLS 13 Bakken Well Three Forks Well

S PYGLASS D RILLING I NVENTORY 14 Project Area DSUs DSU Size (Acres) Net Acres Potential Wells per DSU 1 Unrisked Potential Locations NRI NRI Wells Per Well EUR (Mboe) 2 Total Unrisked Potential (Mmboe) Spyglass Proved 7 1,280 4,916 8 31 80% 25 545 13.4 Spyglass Proved 7 800 3,050 8 31 80% 24 360 8.8 Spyglass Unproved 18 1,280 5,832 8 36 80% 29 545 15.9 Spyglass Unproved 7 800 2,181 8 22 80% 17 360 6.3 Total Operated 39 15,979 119 44.4 Williston Non-Operated 9,538 8 60 80% 48 545 26.0 Total Potential 25,517 179 70.3 1 Management estimates based on 4 Three Forks wells and 4 Middle Bakken wells per drilling spacing unit 2 EUR based on assumptions from 3rd party reserve report as of 6/1/2013 Current Project Area DSUs DSU Size (Acres) Net Acres Potential Wells per DSU 1 Unrisked Potential Locations NRI NRI Wells Per Well EUR (Mboe) 2 Total Unrisked Potential (Mmboe) Spyglass Proved 7 1,280 5,730 8 36 80% 29 545 15.6 Spyglass Proved 7 800 3,485 8 35 80% 28 360 10.0 Spyglass Unproved 18 1,280 9,675 8 60 80% 48 545 26.4 Spyglass Unproved 7 800 3,150 8 32 80% 25 360 9.1 Total Operated 39 22,040 163 61.1 Williston Non-Operated 12,350 8 77 80% 62 545 33.7 Total Potential 34,390 240 94.7 1 Management estimates based on 4 Three Forks wells and 4 Middle Bakken wells per drilling spacing unit 2 EUR based on assumptions from MHA 3rd party reserve report as of 6/1/2013 Pro-Forma Post Optional 3/31/14 Acquisition

2H 2013 Operated Development Plans: • 5 gross Bakken wells financed by JV partner with Carry Agreement* • 6 gross wells (3 Bakken and 3 Three Forks) financed by JV partner with Farm - Out Agreement* • 3 gross wells to be drilled outside of JV Carry and Farm - Out Agreements G UIDANCE – C AP E X AND P RODUCTION 15 * See page 19 for details. 2014 Operated Development Plans: • 1 - 2 rigs expected to drill 18 gross wells which equates to approximately 10 net wells • Approximately $65 million 3Q2013 Production Guidance: • Approximately 1,200 - 1,300 BOEPD • 5 wells added to production late in quarter offset by wells shut - in for completion of in - fill wells 4Q2013 Production Guidance: • Approximately 2,100 BOEPD • October acquisition plus wells to be completed during quarter partially offset by potential wells shut - in during fracture stimulation of in - fill wells - 500 1,000 1,500 2,000 2,500 Q1: 12 Q2: 12 Q3:12 Q4:12 Q1: 13 Q2: 13 Q3: 13E Q4: 13E 147 251 364 706 972 1,288 1,250 2,100 BOEPD Production Forecast 2H 2013 E 2014 E Gross Operated Wells Drilled 14 18 Net Operated Wells Drilled 3 10 Est. Operated Well CapEx $19 $65 American Eagle Operated Well Guidance
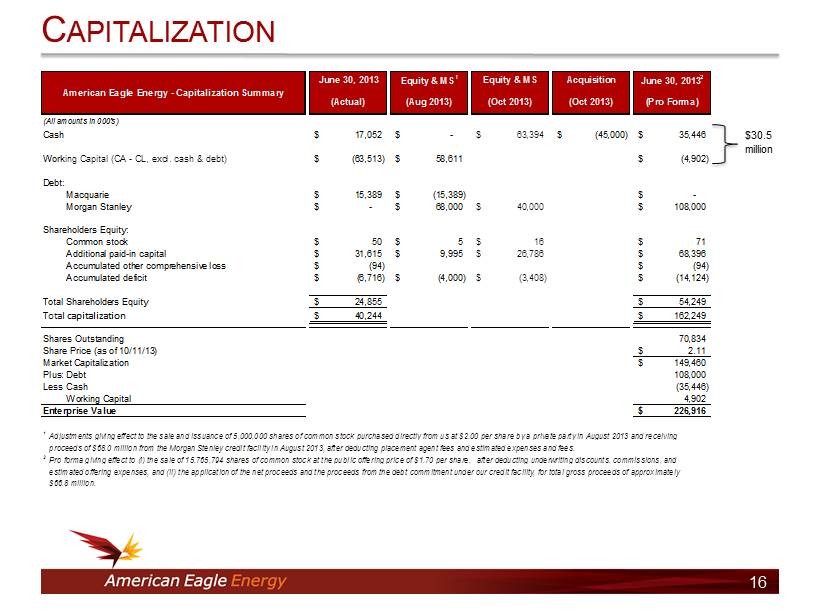
C APITALIZATION 16 $30.5 million June 30, 2013 Equity & MS 1 Equity & MS Acquisition June 30, 2013 2 (Actual) (Aug 2013) (Oct 2013) (Oct 2013) (Pro Forma) (All amounts in 000's) Cash 17,052$ -$ 63,394$ (45,000)$ 35,446$ Working Capital (CA - CL, excl. cash & debt) (63,513)$ 58,611$ (4,902)$ Debt: Macquarie 15,389$ (15,389)$ -$ Morgan Stanley -$ 68,000$ 40,000$ 108,000$ Shareholders Equity: Common stock 50$ 5$ 16$ 71$ Additional paid-in capital 31,615$ 9,995$ 26,786$ 68,396$ Accumulated other comprehensive loss (94)$ (94)$ Accumulated deficit (6,716)$ (4,000)$ (3,408)$ (14,124)$ Total Shareholders Equity 24,855$ 54,249$ Total capitalization 40,244$ 162,249$ Shares Outstanding 70,834 Share Price (as of 10/11/13) 2.11$ Market Capitalization 149,460$ Plus:Debt 108,000 Less:Cash (35,446) Working Capital 4,902 Enterprise Value 226,916$ 1 Adjustments giving effect to the sale and issuance of 5,000,000 shares of common stock purchased directly from us at $2.00 per share by a private party in August 2013 and receiving proceeds of $68.0 million from the Morgan Stenley credit facility in August 2013, after deducting placement agent fees and estimated expenses and fees. 2 Pro forma giving effect to (i) the sale of 15,765,794 shares of common stock at the public offering price of $1.70 per share, after deducting underwriting discounts, commissions, and estimated offering expenses, and (ii) the application of the net proceeds and the proceeds from the debt commitment under our credit facility, for total gross proceeds of approximately $66.8 million. American Eagle Energy - Capitalization Summary
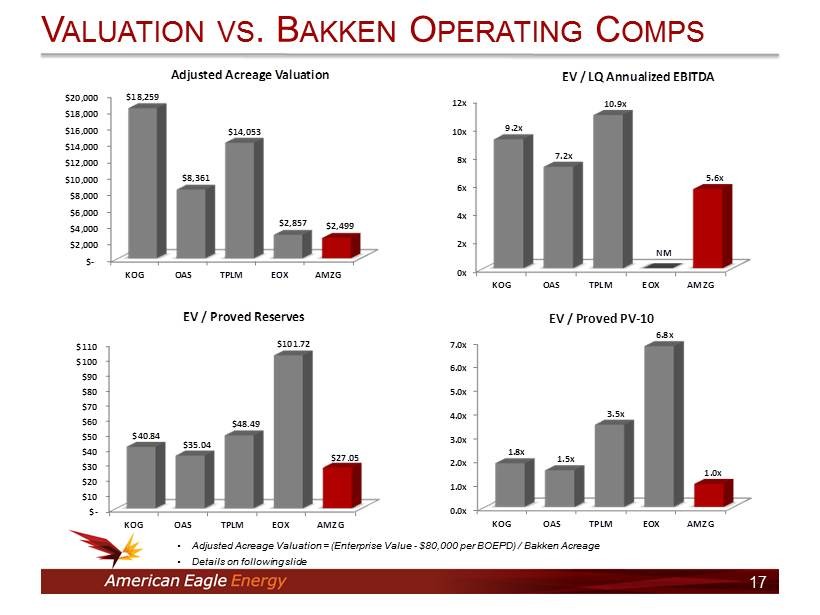
V ALUATION VS . B AKKEN O PERATING C OMPS 17 • Adjusted Acreage Valuation = (Enterprise Value - $80,000 per BOEPD) / Bakken Acreage • Details on following slide $ - $2,000 $4,000 $6,000 $8,000 $10,000 $12,000 $14,000 $16,000 $18,000 $20,000 KOG OAS TPLM EOX AMZG $18,259 $8,361 $14,053 $2,857 $2,499 Adjusted Acreage Valuation 0x 2x 4x 6x 8x 10x 12x KOG OAS TPLM EOX AMZG 9.2x 7.2x 10.9x NM 5.6x EV / LQ Annualized EBITDA $ - $10 $20 $30 $40 $50 $60 $70 $80 $90 $100 $110 KOG OAS TPLM EOX AMZG $40.84 $35.04 $48.49 $101.72 $27.05 EV / Proved Reserves 0.0x 1.0x 2.0x 3.0x 4.0x 5.0x 6.0x 7.0x KOG OAS TPLM EOX AMZG 1.8x 1.5x 3.5x 6.8x 1.0x EV / Proved PV - 10
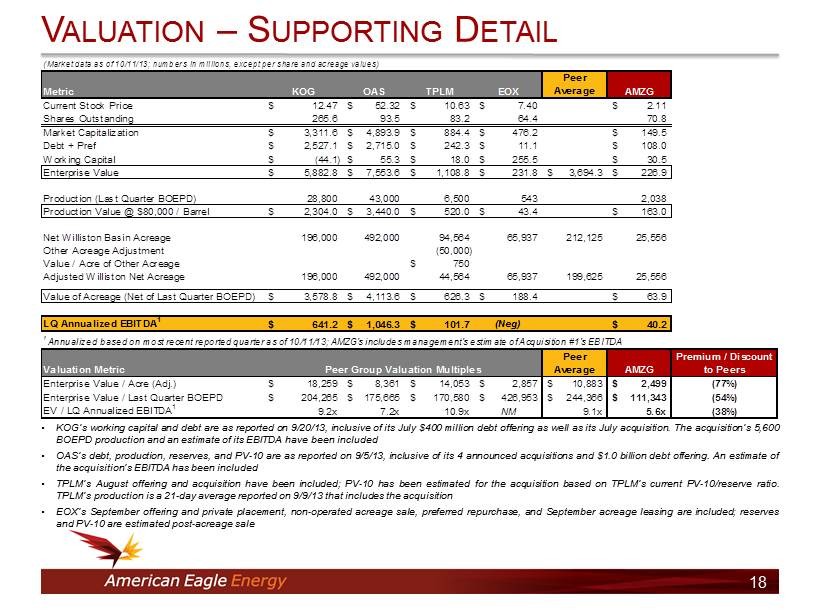
V ALUATION – S UPPORTING D ETAIL • KOG’s working capital and debt are as reported on 9 / 20 / 13 , inclusive of its July $ 400 million debt offering as well as its July acquisition . The acquisition’s 5 , 600 BOEPD production and an estimate of its EBITDA have been included • OAS’s debt, production, reserves, and PV - 10 are as reported on 9 / 5 / 13 , inclusive of its 4 announced acquisitions and $ 1 . 0 billion debt offering . An estimate of the acquisition’s EBITDA has been included • TPLM’s August offering and acquisition have been included ; PV - 10 has been estimated for the acquisition based on TPLM’s current PV - 10 /reserve ratio . TPLM’s production is a 21 - day average reported on 9 / 9 / 13 that includes the acquisition • EOX’s September offering and private placement, non - operated acreage sale, preferred repurchase, and September acreage leasing are included ; reserves and PV - 10 are estimated post - acreage sale 18 (Market data as of 10/11/13; numbers in millions, except per share and acreage values) Metric KOG OAS TPLM EOX Peer Average AMZG Current Stock Price 12.47$ 52.32$ 10.63$ 7.40$ 2.11$ Shares Outstanding 265.6 93.5 83.2 64.4 70.8 Market Capitalization 3,311.6$ 4,893.9$ 884.4$ 476.2$ 149.5$ Debt + Pref 2,527.1$ 2,715.0$ 242.3$ 11.1$ 108.0$ Working Capital (44.1)$ 55.3$ 18.0$ 255.5$ 30.5$ Enterprise Value 5,882.8$ 7,553.6$ 1,108.8$ 231.8$ 3,694.3$ 226.9$ Production (Last Quarter BOEPD) 28,800 43,000 6,500 543 2,038 Production Value @ $80,000 / Barrel 2,304.0$ 3,440.0$ 520.0$ 43.4$ 163.0$ Net Williston Basin Acreage 196,000 492,000 94,564 65,937 212,125 25,556 Other Acreage Adjustment (50,000) Value / Acre of Other Acreage 750$ Adjusted Williston Net Acreage 196,000 492,000 44,564 65,937 199,625 25,556 Value of Acreage (Net of Last Quarter BOEPD) 3,578.8$ 4,113.6$ 626.3$ 188.4$ 63.9$ LQ Annualized EBITDA 1 641.2$ 1,046.3$ 101.7$ (Neg) 40.2$ 1 Annualized based on most recent reported quarter as of 10/11/13; AMZG's includes management's estimate of Acquisition #1's EBITDA Valuation Metric Peer Group Valuation Multiples Peer Average AMZG Premium / Discount to Peers Enterprise Value / Acre (Adj.) 18,259$ 8,361$ 14,053$ 2,857$ 10,883$ 2,499$ (77%) Enterprise Value / Last Quarter BOEPD 204,265$ 175,665$ 170,580$ 426,953$ 244,366$ 111,343$ (54%) EV / LQ Annualized EBITDA 1 9.2x 7.2x 10.9x NM 9.1x 5.6x (38%)

Sold 5 . 0 MM shares of common stock $ 2 . 00 /share in August 2013 • 17 % premium to prior day’s closing price . Sold 15 . 8 MM shares of common stock $ 1 . 70 /share in October 2013 • Brought in long - term, institutional holders Morgan Stanley credit facility of up to $ 200 MM closed in August 2013 • $ 68 MM initial drawdown, used to pay - down existing debt, for working capital and development . • $ 40 MM additional drawdown in October 2013 , used to close Acquisition . • Interest rate of 5 . 5 % - 10 . 5 % , based on AMZG’s Proved Developed Reserves to debt ratio Carry Agreement JV partner pays 100 % of AMZG’s well development costs for up to 5 Bakken wells in an area of proved Three Forks wells, operated by AMZG, with AMZG receiving 50 % of its NRI for each well until ( 1 ) the JV partner has recouped 112 % of the development costs ; or ( 2 ) after two years at which point AMZG pays remaining obligation for JV partner to recoup 112 % on a per - well basis . Then 100 % of AMZG’s well bore interests revert back to AMZG . Farm - Out Agreement JV partner agrees to pay 100 % of AMZG’s well development costs for up to 6 Three Forks or Bakken wells in unproved area, operated by AMZG, with the JV partner receiving 100 % of AMZG’s NRI in each well until the JV partner has recouped 112 % of the development costs on a per - well basis . Then 30 % of AMZG’s well bore interests revert back to AMZG . R ECENT F INANCING AND A GREEMENTS 19
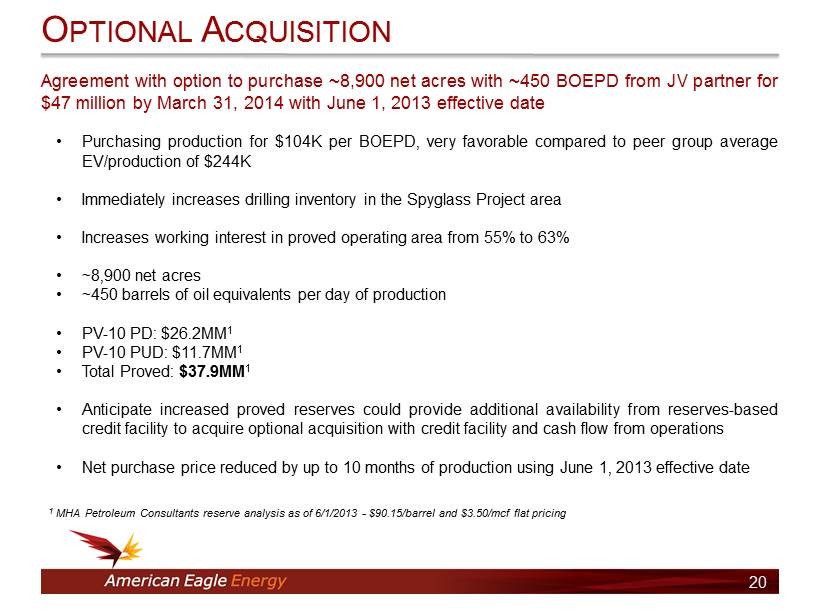
Agreement with option to purchase ~ 8 , 900 net acres with ~ 450 BOEPD from JV partner for $ 47 million by March 31 , 2014 with June 1 , 2013 effective date • Purchasing production for $ 104 K per BOEPD, very favorable compared to peer group average EV/production of $ 244 K • Immediately increases drilling inventory in the Spyglass Project area • Increases working interest in proved operating area from 55 % to 63 % • ~ 8 , 900 net acres • ~ 450 barrels of oil equivalents per day of production • PV - 10 PD : $ 26 . 2 MM 1 • PV - 10 PUD : $ 11 . 7 MM 1 • Total Proved : $ 37 . 9 MM 1 • Anticipate increased proved reserves could provide additional availability from reserves - based credit facility to acquire optional acquisition with credit facility and cash flow from operations • Net purchase price reduced by up to 10 months of production using June 1 , 2013 effective date O PTIONAL A CQUISITION 1 MHA Petroleum Consultants reserve analysis as of 6/1/2013 - $90.15/barrel and $3.50/ mcf flat pricing 20
K EY I NVESTMENT H IGHLIGHTS Proven and aligned operating management team • Experienced Williston Basin operating & technical team • Management and insiders own approximately 18 % of shares outstanding • Management has a track record of organically : • Increasing production • Multiplying reserves • Aggregating acreage positions Announced acquisitions, JVs, and financing can add immediate value • Acquisition locked in at accretive terms • Acquisition adds immediate production, drilling inventory, and reserve potential • Joint ventures allow for the Bakken & Three Forks delineation of the Spyglass acreage • $ 108 million available and drawn on $ 200 million Morgan Stanley credit facility Near - term catalysts for growth • National exchange listing application pending • Accelerated development plan continues to unlock key reserve value operating “under the radar” with an attractive valuation • Increasing trading volume and shareholder liquidity • Institutional awareness 21

Marty Beskow, CFA Vice President of Capital Markets & Strategy American Eagle Energy Corporation 2549 West Main Street, Suite 202 Littleton, CO 80120 303 - 798 - 5235 ir@amzgcorp.com C ONTACT I NFORMATION 22