Attached files
| file | filename |
|---|---|
| 8-K - 8-K - CHRISTOPHER & BANKS CORP | a8-koctober2013investorpre.htm |

Charting Our Path to Profitability October, 2013
Certain statements on the slides which follow may be forward-looking statements about Christopher & Banks Corporation (the “Company”). Such forward-looking statements involve risks and uncertainties which may cause actual results to differ. These forward-looking statements may be identified by such terms as “will”, “expect”, “believe”, “anticipate”, “outlook”, “target”, “plan”, “initiatives”, “estimated”, “strategy” and similar terms. You are directed to the cautionary statements regarding risks or uncertainties described in the Company’s filings with the Securities and Exchange Commission, including our most recent Annual Report on Form 10-K and other SEC filings made since the date of that 10-K report. Participants are cautioned not to place undue reliance on such forward-looking statements, which reflect management’s views only as of October 14, 2013. The Company undertakes no obligation to update or revise the forward-looking statements. 2 Safe Harbor
Our Vision & Mission Vision: To become her trusted brand by delivering style and value every day. Mission: To provide women of all sizes, apparel and accessories with style and versatility that reflects who she is; lasting quality and affordable value she expects, delivered with the personalized attention she deserves. 3
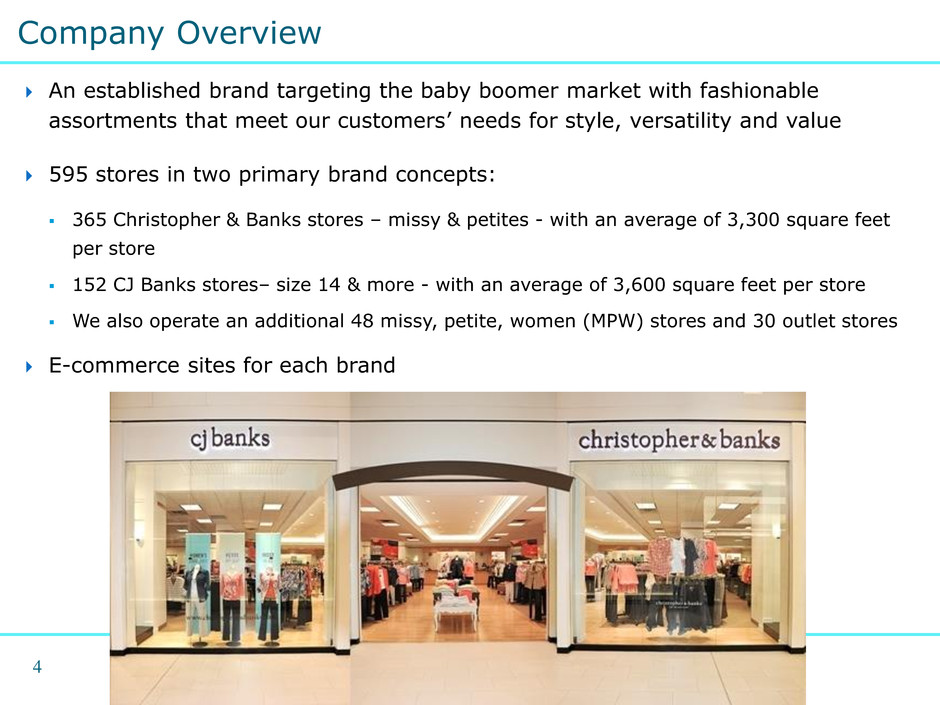
4 An established brand targeting the baby boomer market with fashionable assortments that meet our customers’ needs for style, versatility and value 595 stores in two primary brand concepts: 365 Christopher & Banks stores – missy & petites - with an average of 3,300 square feet per store 152 CJ Banks stores– size 14 & more - with an average of 3,600 square feet per store We also operate an additional 48 missy, petite, women (MPW) stores and 30 outlet stores E-commerce sites for each brand Company Overview
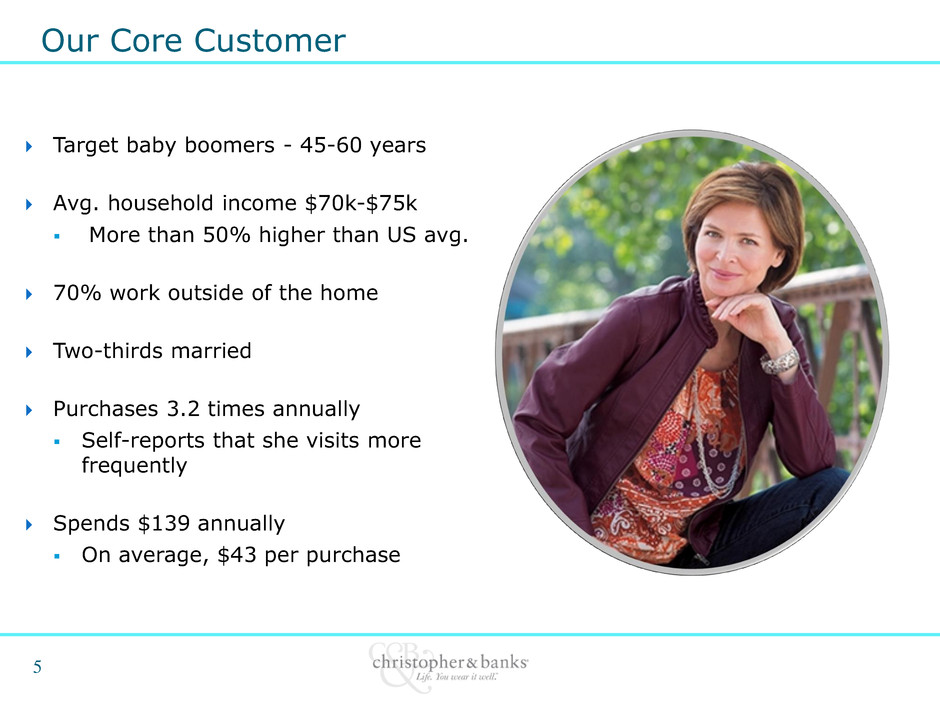
Our Core Customer Target baby boomers - 45-60 years Avg. household income $70k-$75k More than 50% higher than US avg. 70% work outside of the home Two-thirds married Purchases 3.2 times annually Self-reports that she visits more frequently Spends $139 annually On average, $43 per purchase 5
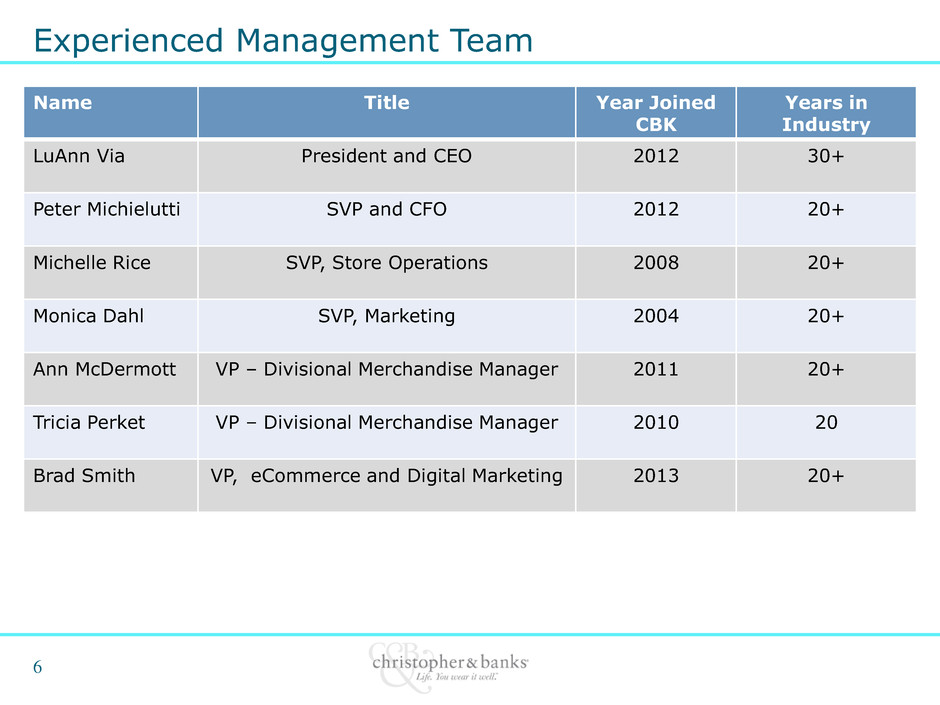
Experienced Management Team Name Title Year Joined CBK Years in Industry LuAnn Via President and CEO 2012 30+ Peter Michielutti SVP and CFO 2012 20+ Michelle Rice SVP, Store Operations 2008 20+ Monica Dahl SVP, Marketing 2004 20+ Ann McDermott VP – Divisional Merchandise Manager 2011 20+ Tricia Perket VP – Divisional Merchandise Manager 2010 20 Brad Smith VP, eCommerce and Digital Marketing 2013 20+ 6
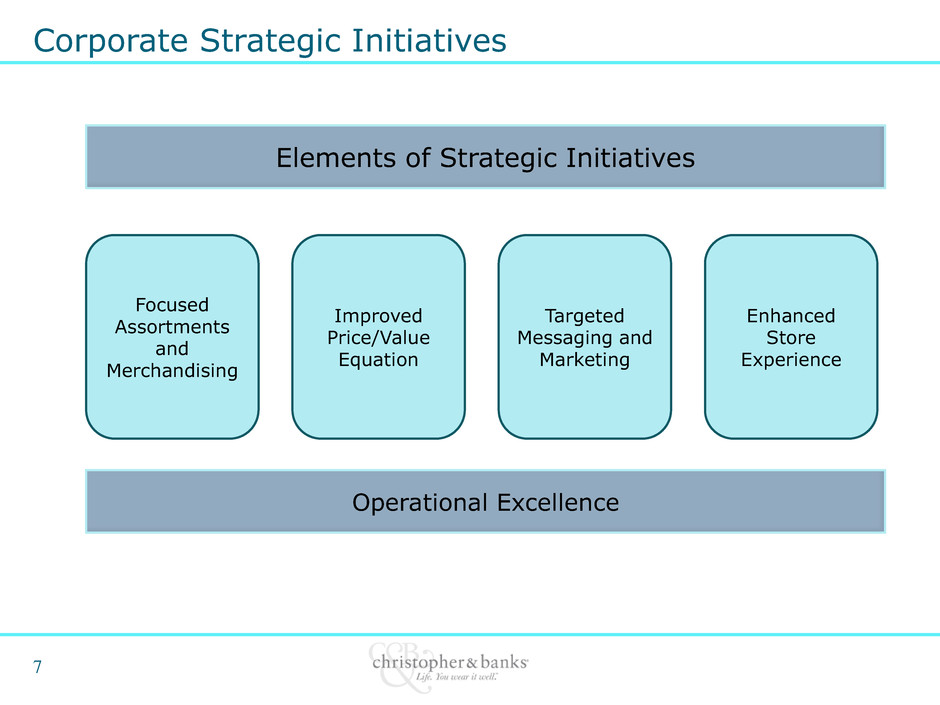
Corporate Strategic Initiatives Elements of Strategic Initiatives Focused Assortments and Merchandising Improved Price/Value Equation Targeted Messaging and Marketing Enhanced Store Experience Operational Excellence 7
8 Consistently deliver a balanced, compelling and versatile fashion assortment Continue to maximize sales and margin with core basic programs Introduce increased fit solutions and easy care fabrics Increase wear-to-work options including jackets, blouses, essential cardigans and year round pants Expand assortment to include weekend wear collections and soft knit dressing Increase depth in a greater number of key styles Offer appropriate newness for our customer’s fashion sensibility Provide easy, complete outfitting with complementing accessories Communicate merchandise improvements through enhanced marketing programs Focused Merchandise Assortments
9 Offer a price/value proposition that resonates with customers Provide attractive opening price points Develop planned promotional buys to maximize margin Expand penetration of top 10 key programs at key price points Continue to refine good / better / best mix of product offerings Consistently deliver on quality Enhanced promotional strategy Increase targeted and pre-planned category promotions Continue to refine store signage to drive traffic and improve messaging of offer Supplement in-store offers with effective bounce-backs and direct mail offers to increase repeat visits Improved Price/Value Equation
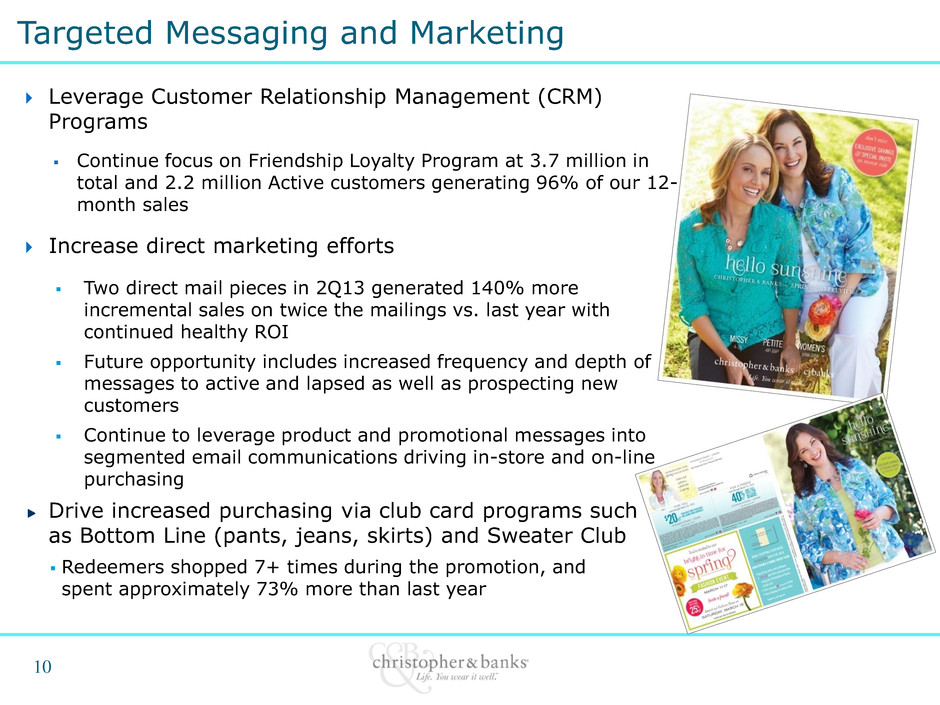
10 Leverage Customer Relationship Management (CRM) Programs Continue focus on Friendship Loyalty Program at 3.7 million in total and 2.2 million Active customers generating 96% of our 12- month sales Increase direct marketing efforts Two direct mail pieces in 2Q13 generated 140% more incremental sales on twice the mailings vs. last year with continued healthy ROI Future opportunity includes increased frequency and depth of messages to active and lapsed as well as prospecting new customers Continue to leverage product and promotional messages into segmented email communications driving in-store and on-line purchasing Drive increased purchasing via club card programs such as Bottom Line (pants, jeans, skirts) and Sweater Club Redeemers shopped 7+ times during the promotion, and spent approximately 73% more than last year Targeted Messaging and Marketing
11 Continue to grow Private Label Credit Card Program (launched in April 2012) At present, cardholders represent 15% of active customers and 21% of overall sales Average transaction size of cardholders is approximately 50% higher than non-card holders During Q2, cardholders spent 19% more than they did the comparable period last year, due to increased visits and higher ADS Drive sign-up and usage via accelerated point offers and cardholder events communicated via direct mail, email and store front Upgraded eCommerce platform ensures websites best reflect the brand and are effectively leveraged as a multi-channel catalyst Targeted Messaging and Marketing (cont’d)
Enhanced Store Experience Refresh “Selling with Care” program Introduce additional selling techniques and learning tools like video Re-enforce clientelling as key to selling culture Increase selling hours at stores where proven effective at increasing sales productivity Upgrade Talent Expand training and development programs Revise On-boarding Program by providing updated and cohesive new hire checklists Enhance Visual Merchandising Strengthen outfitting displays through increased collaboration with merchant teams Provide additional direction on brand standards to create consistency from store to store Invest in additional mannequins, tables and visual props for increased flexibility and visual appeal Enhance Personal Relationships with Our Customer In-store seasonal Fashion Events Maximize grassroots opportunities i.e. women’s conventions, leadership conferences and women’s clubs 12
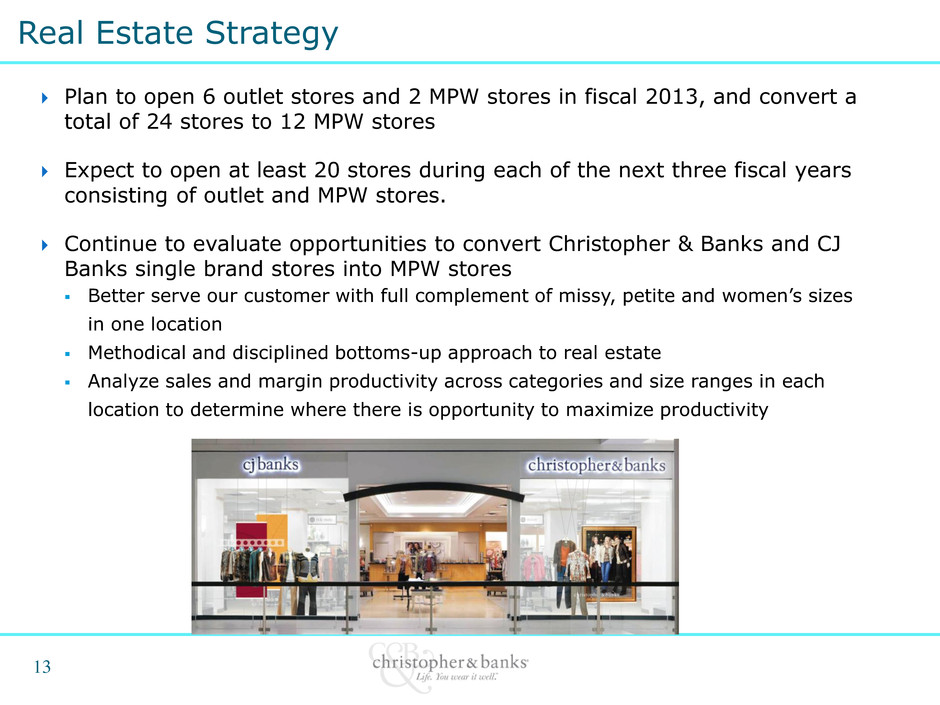
13 Plan to open 6 outlet stores and 2 MPW stores in fiscal 2013, and convert a total of 24 stores to 12 MPW stores Expect to open at least 20 stores during each of the next three fiscal years consisting of outlet and MPW stores. Continue to evaluate opportunities to convert Christopher & Banks and CJ Banks single brand stores into MPW stores Better serve our customer with full complement of missy, petite and women’s sizes in one location Methodical and disciplined bottoms-up approach to real estate Analyze sales and margin productivity across categories and size ranges in each location to determine where there is opportunity to maximize productivity Real Estate Strategy
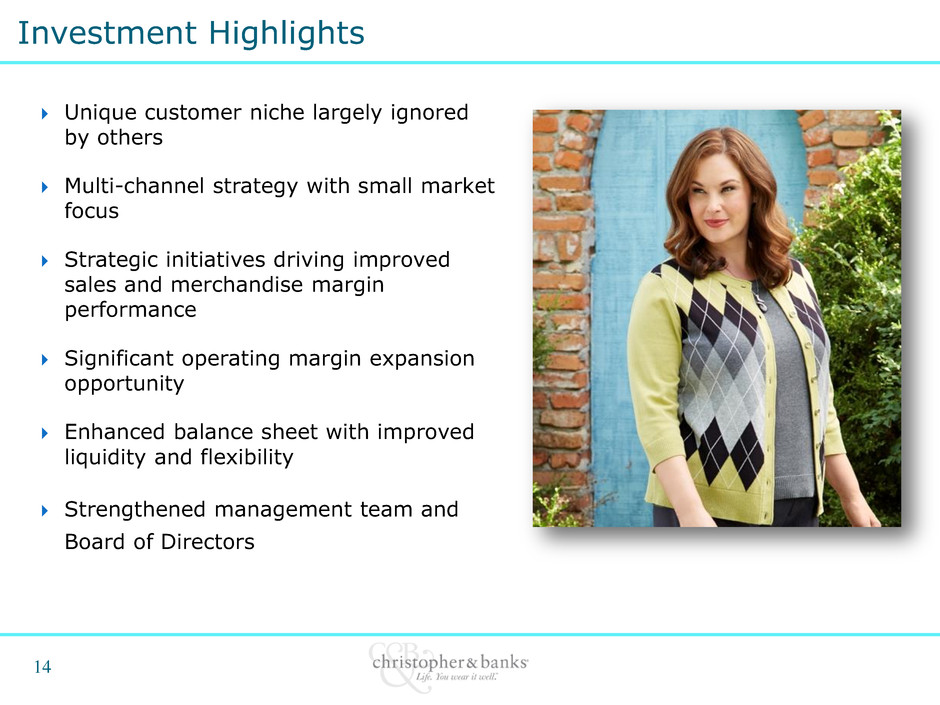
14 Unique customer niche largely ignored by others Multi-channel strategy with small market focus Strategic initiatives driving improved sales and merchandise margin performance Significant operating margin expansion opportunity Enhanced balance sheet with improved liquidity and flexibility Strengthened management team and Board of Directors Investment Highlights

Financial Highlights
16 Total comparable sales for second quarter up 7.7% On top of an 8.9% increase in last year’s second quarter and compared to a 23.4% increase in the first quarter of 2013 Improved conversion rates, higher units per transactions, and an increase in the AUR led to a 7.0% increase in average dollar sale Despite operating an average of 8.8% fewer stores, sales for the second quarter grew 0.8% as compared to the same period last year Gross margin in the second quarter of 33.5% compared to 27.7% for last year’s second quarter Merchandise margin rate improved on a year-over-year basis Improved inventory flow contributed to stronger sell-through Improved Financial Performance
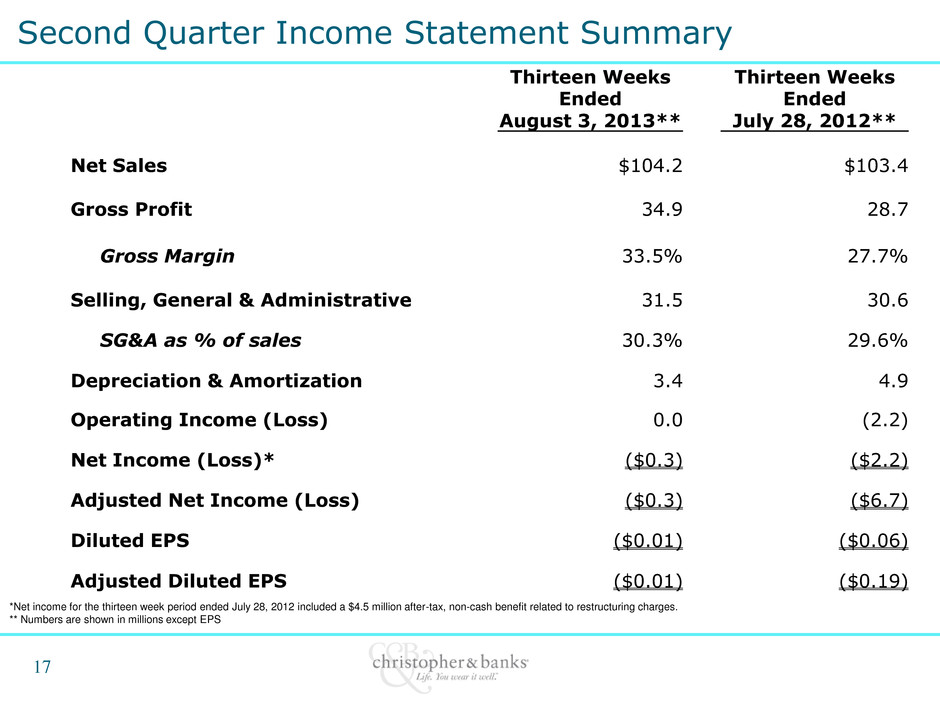
Thirteen Weeks Ended August 3, 2013** Thirteen Weeks Ended July 28, 2012** Net Sales $104.2 $103.4 Gross Profit 34.9 28.7 Gross Margin 33.5% 27.7% Selling, General & Administrative 31.5 30.6 SG&A as % of sales 30.3% 29.6% Depreciation & Amortization 3.4 4.9 Operating Income (Loss) 0.0 (2.2) Net Income (Loss)* ($0.3) ($2.2) Adjusted Net Income (Loss) ($0.3) ($6.7) Diluted EPS ($0.01) ($0.06) Adjusted Diluted EPS ($0.01) ($0.19) Second Quarter Income Statement Summary *Net income for the thirteen week period ended July 28, 2012 included a $4.5 million after-tax, non-cash benefit related to restructuring charges. ** Numbers are shown in millions except EPS 17
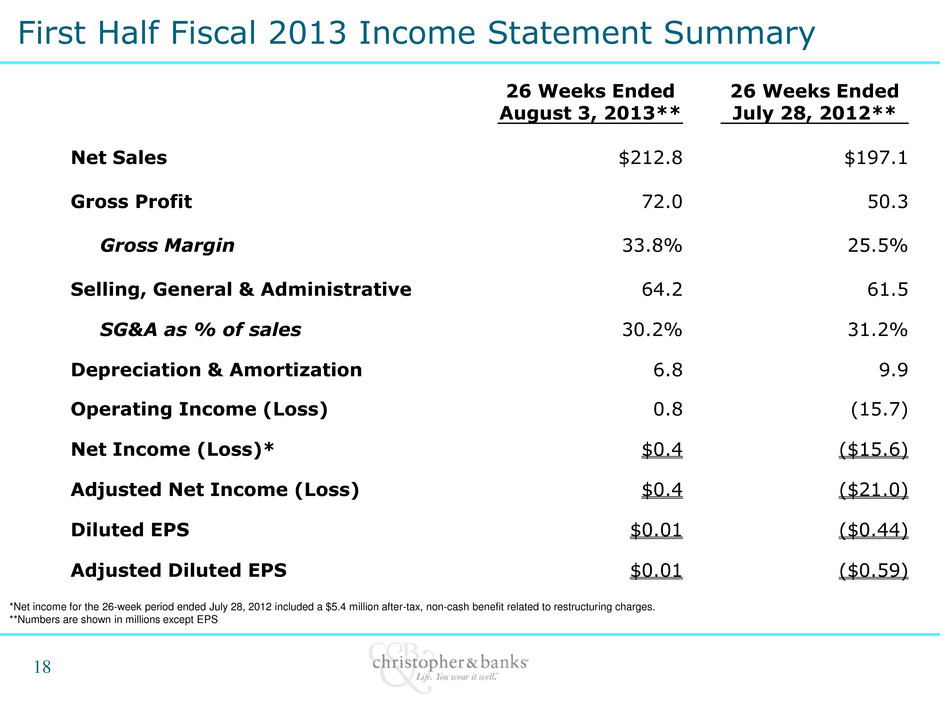
26 Weeks Ended August 3, 2013** 26 Weeks Ended July 28, 2012** Net Sales $212.8 $197.1 Gross Profit 72.0 50.3 Gross Margin 33.8% 25.5% Selling, General & Administrative 64.2 61.5 SG&A as % of sales 30.2% 31.2% Depreciation & Amortization 6.8 9.9 Operating Income (Loss) 0.8 (15.7) Net Income (Loss)* $0.4 ($15.6) Adjusted Net Income (Loss) $0.4 ($21.0) Diluted EPS $0.01 ($0.44) Adjusted Diluted EPS $0.01 ($0.59) *Net income for the 26-week period ended July 28, 2012 included a $5.4 million after-tax, non-cash benefit related to restructuring charges. **Numbers are shown in millions except EPS First Half Fiscal 2013 Income Statement Summary 18
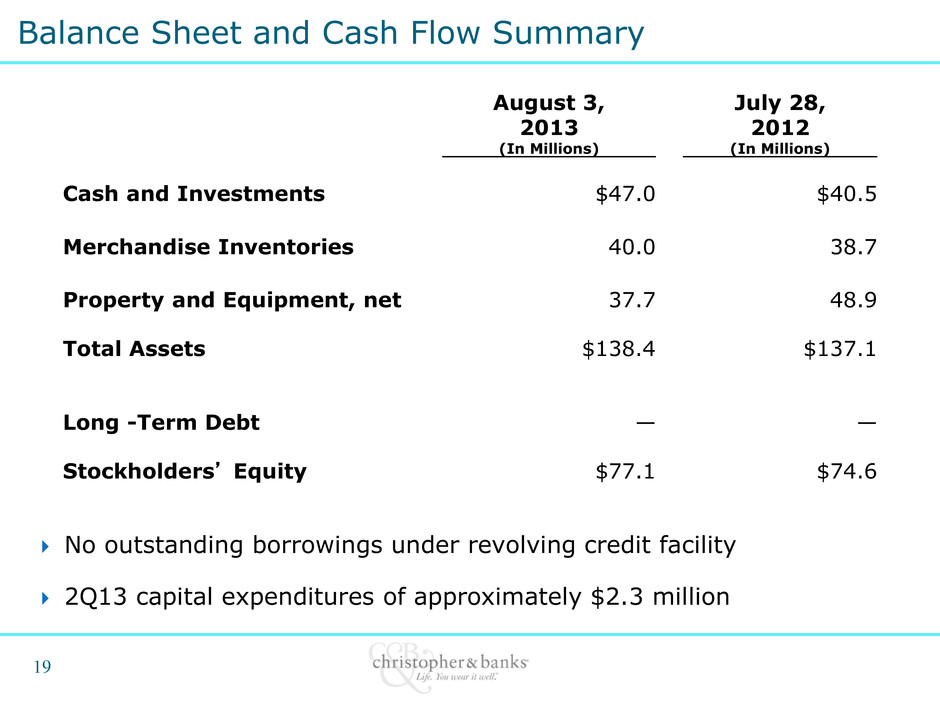
August 3, 2013 (In Millions) July 28, 2012 (In Millions) Cash and Investments $47.0 $40.5 Merchandise Inventories 40.0 38.7 Property and Equipment, net 37.7 48.9 Total Assets $138.4 $137.1 Long -Term Debt — — Stockholders’ Equity $77.1 $74.6 Balance Sheet and Cash Flow Summary No outstanding borrowings under revolving credit facility 2Q13 capital expenditures of approximately $2.3 million 19
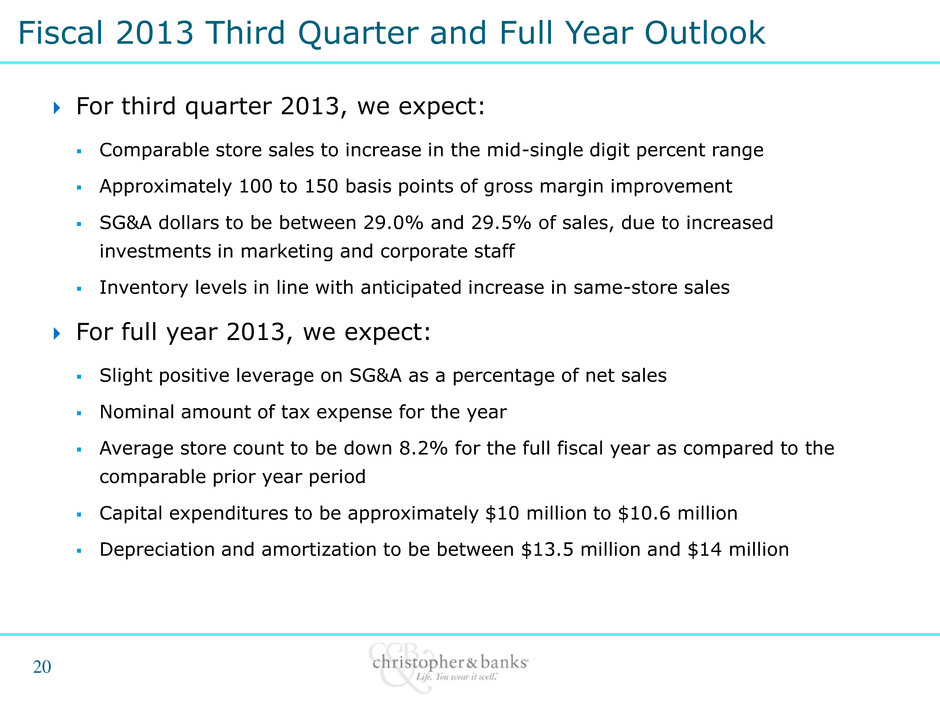
20 For third quarter 2013, we expect: Comparable store sales to increase in the mid-single digit percent range Approximately 100 to 150 basis points of gross margin improvement SG&A dollars to be between 29.0% and 29.5% of sales, due to increased investments in marketing and corporate staff Inventory levels in line with anticipated increase in same-store sales For full year 2013, we expect: Slight positive leverage on SG&A as a percentage of net sales Nominal amount of tax expense for the year Average store count to be down 8.2% for the full fiscal year as compared to the comparable prior year period Capital expenditures to be approximately $10 million to $10.6 million Depreciation and amortization to be between $13.5 million and $14 million Fiscal 2013 Third Quarter and Full Year Outlook
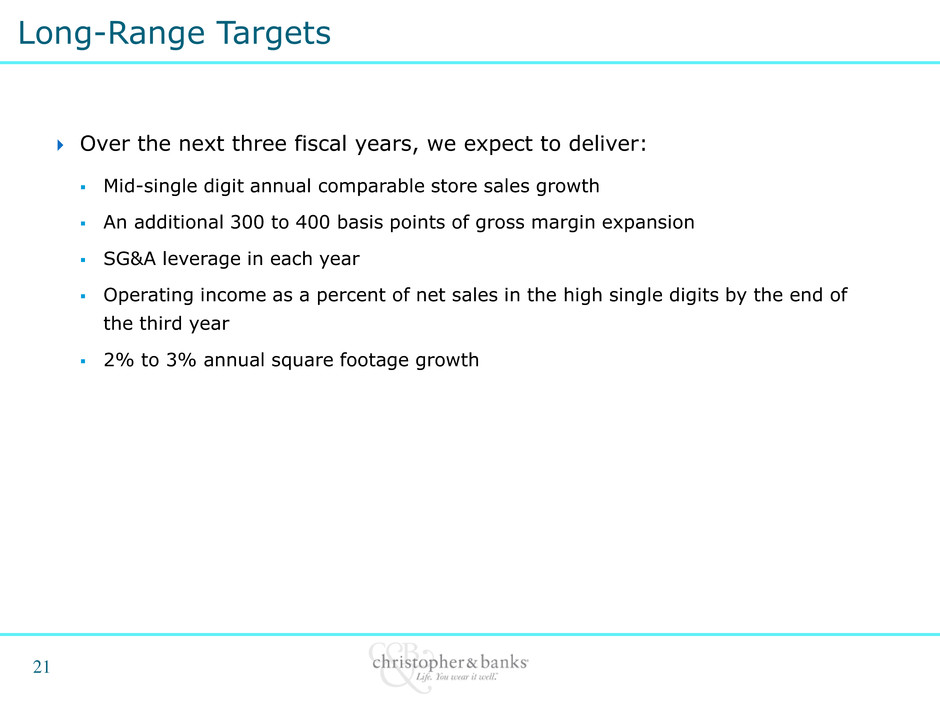
Over the next three fiscal years, we expect to deliver: Mid-single digit annual comparable store sales growth An additional 300 to 400 basis points of gross margin expansion SG&A leverage in each year Operating income as a percent of net sales in the high single digits by the end of the third year 2% to 3% annual square footage growth Long-Range Targets 21
