Attached files
| file | filename |
|---|---|
| 8-K - CHINA FUND INC | fp0008429_8k.htm |
|
Sep 30, 2013
|
Monthly Insight
The China Fund, Inc. (CHN)
|
|
Investment Objective
|
The investment objective of the Fund is to achieve long term capital appreciation. The Fund seeks to achieve its objective through investment in the equity securities of companies and other entities with significant assets, investments, production activities, trading or other business interests in China or which derive a significant part of their revenue from China.
The Fund has an operating policy that the Fund will invest at least 80% of its assets in China companies. For this purpose, ‘China companies’ are (i) companies for which the principal securities trading market is in China; (ii) companies for which the principal securities trading market is outside of China or in companies organized outside of China, that in both cases derive at least 50% of their revenues from goods or services sold or produced, or have a least 50% of their assets in China; or (iii) companies organized in China. Under the policy, China means the People’s Republic of China, including Hong Kong, and Taiwan. The Fund will provide its stockholders with at least 60 days’ prior notice of any change to this policy.
|
Performance Overview
|
|
Performance History
|
1 month
|
3 months
|
YTD
|
1 Year
|
3 Years
|
5 Years
|
10 Years
|
Since
|
|
(p.a.)
|
(p.a.)
|
(p.a.)
|
Inception
|
|
NAV (%)
|
3.47
|
7.61
|
9.57
|
15.86
|
0.08
|
11.67
|
14.64
|
10.83
|
|
Market price (%)
|
4.32
|
8.66
|
1.40
|
12.39
|
-2.09
|
9.80
|
12.32
|
9.73
|
|
Benchmark (%)
|
4.73
|
8.92
|
3.29
|
11.33
|
3.22
|
10.32
|
10.26
|
N/A
|
|
Performance History
|
2012
|
2011
|
2010
|
2009
|
2008
|
2007
|
2006
|
2005
|
|
NAV (%)
|
12.07
|
-24.37
|
27.25
|
72.82
|
-46.95
|
86.20
|
57.10
|
6.09
|
|
Market price (%)
|
20.46
|
-27.51
|
23.60
|
72.19
|
-40.65
|
50.24
|
65.67
|
-21.51
|
|
Benchmark (%)
|
22.65
|
-18.36
|
13.60
|
67.12
|
-49.37
|
37.97
|
39.50
|
10.27
|
Source: State Street Bank and Trust Company. Source for index data: MSCI as at Sep 30, 2013.
|
Portfolio Analysis
|
|
Sector allocation (%)
|
Country allocation (%)
|
 |
 |
|
Source: State Street Bank and Trust Company as at Sep 30, 2013.
|
* China includes A-shares (6.7%), A-share equity linked securities (6.9%), B-shares (0.0%), H-shares (12.2%) and Red-chips (15.8%).
|

The China Fund, Inc. (CHN)
|
Portfolio Analysis (continued)
|
|
Top 10 Holdings
|
Sector
|
%
|
|
HAND ENTERPRISE SOLUTIONS CO., LTD.
|
I.T.
|
6.7
|
|
CHINA EVERBRIGHT INTERNATIONAL, LTD.
|
INDUSTRIALS
|
5.6
|
|
TAIWAN SEMICONDUCTOR MANUFACTURING CO., LTD.
|
I.T.
|
5.3
|
|
SUN HUNG KAI PROPERTIES, LTD.
|
FINANCIALS
|
4.4
|
|
INDUSTRIAL & COMMERCIAL BANK OF CHINA
|
FINANCIALS
|
4.4
|
|
CNOOC, LTD.
|
ENERGY
|
3.7
|
|
TENCENT HOLDINGS, LTD.
|
I.T.
|
3.5
|
|
ENN ENERGY HOLDINGS, LTD.
|
UTILITIES
|
3.2
|
|
CHINA MOBILE, LTD.
|
TELECOM
|
2.9
|
|
RUENTEX DEVELOPMENT CO., LTD.
|
FINANCIALS
|
2.6
|
|
Total
|
42.3
|
|
|
Direct Investments
|
Sector
|
%
|
|
GOLDEN MEDITECH HOLDINGS, LTD. 15.0%, 11/16/13
|
OTHERS
|
1.5
|
|
Total
|
1.5
|
Source: State Street Bank and Trust Company as at Sep 30, 2013.
|
Fund Details
|
|
NAV
|
$24.74
|
|
Market price
|
$21.71
|
|
Premium/Discount
|
-12.25%
|
|
Market cap
|
US$340.46m
|
|
Shares outstanding
|
15,682,029
|
|
Exchange listed
|
NYSE
|
|
Listing date
|
July 10, 1992
|
|
Benchmark
|
MSCI Golden Dragon Index (Total Return)
|
|
Fund Manager
|
Christina Chung
|
|
Listed and direct investment manager
|
RCM Asia Pacific Limited
|
Source: State Street Bank and Trust Company as at Sep 30, 2013.
|
Distribution History (10 years)
|
|
Declaration
date |
Ex-dividend
date
|
Record
date |
Payable
date |
Dividend/
Share |
Income
|
Long-term Capital
|
Short-term Capital
|
|
10 Dec 2012
|
20 Dec 2012
|
24 Dec 2012
|
28 Dec 2012
|
3.2517
|
0.3473
|
2.9044
|
0.0000
|
|
8 Dec 2011
|
21 Dec 2011
|
23 Dec 2011
|
29 Dec 2011
|
2.9964
|
0.1742
|
2.8222
|
0.0000
|
|
8 Dec 2010
|
21 Dec 2010
|
24 Dec 2010
|
29 Dec 2010
|
2.2742
|
0.3746
|
1.8996
|
0.0000
|
|
9 Dec 2009
|
22 Dec 2009
|
24 Dec 2009
|
29 Dec 2009
|
0.2557
|
0.2557
|
0.0000
|
0.0000
|
|
8 Dec 2008
|
22 Dec 2008
|
24 Dec 2008
|
23 Jan 2009
|
5.8174
|
0.4813
|
5.3361
|
0.0000
|
|
7 Dec 2007
|
19 Dec 2007
|
21 Dec 2007
|
25 Jan 2008
|
12.1200
|
0.2800
|
9.0000
|
2.8400
|
|
8 Dec 2006
|
19 Dec 2006
|
21 Dec 2006
|
29 Dec 2006
|
4.0117
|
0.2996
|
2.7309
|
0.9812
|
|
9 Dec 2005
|
19 Dec 2005
|
21 Dec 2005
|
29 Dec 2005
|
2.5119
|
0.2172
|
2.2947
|
0.0000
|
|
13 Dec 2004
|
20 Dec 2004
|
22 Dec 2004
|
7 Jan 2005
|
3.5701
|
0.1963
|
3.2664
|
0.1074
|
|
19 Dec 2003
|
29 Dec 2003
|
31 Dec 2003
|
15 Jan 2004
|
1.7800
|
0.0700
|
0.6700
|
1.0400
|
Source : State Street Bank and Trust Company as at December 31, 2012
2
The China Fund, Inc. (CHN)
The China Fund Inc. NAV Performance of USD $10,000 since inception (with dividends reinvested at NAV price)
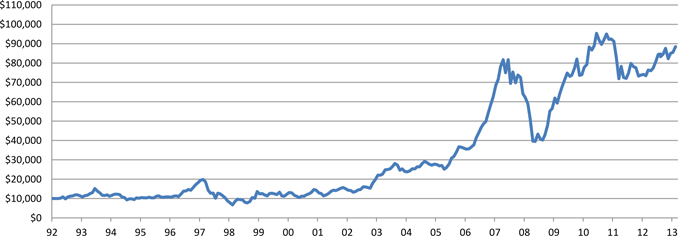
Past performance is not a guide to future returns.
Source: State Street Bank and Trust Company as at Sep 30, 2013.
The China Fund Inc. Premium / Discount

Past performance is not a guide to future returns.
Source: State Street Bank and Trust Company as at Sep 30, 2013.
3
The China Fund, Inc. (CHN)
Manager’s Commentary
Market Review
The Hong Kong equity market continued to perform well in September. Investors appeared to be turning more positive about China, encouraged by the better than expected macro numbers and expectations that the November meeting of the Communist Party’s Central Committee will endorse a series of major economic reforms. News flow regarding the Shanghai Free Trade Zone boosted market sentiment positively for the month and the stock prices of companies with related themes performed strongly. International investors’ low market weightings in China also remain one of the key drivers for fund flows into Chinese equities for the month. However, those flows were largely confined to index heavyweights, like big Chinese banks, China Mobile and Tencent. Investors continued to be bullish on internet and Macau related stocks, these two sectors are widely regarded as the top beneficiaries of the rapid rise in Chinese consumer spending.
While investors were still unwilling to make a big bet on the Hong Kong property sector, small Hong Kong banks performed strongly on the back of news flow regarding the potential sale of a stake by a local bank.
In Taiwan, August export orders were +0.5% year-on-year, lower than the consensus of +1.3% year-on-year; however, the recent Purchasing Manager Index figures for China and Europe should provide some positive news for Taiwanese exporters in the coming months. In all, we maintain our view that the second half of the year will be better than the first half, but we have cut our expectation on the strength of recovery due to downward revisions of both domestic consumption and exports.
Fund Review
The Fund underperformed the benchmark in September, mainly due to stock selection. Stock picking in industrials sector hurt the Fund’s relative performance the most.
The top detractor for the month was China Everbright International. Although there was no specific negative news flow on the company, the share price consolidated after strong year-to-date performance. On the other hand, the top active contributor was Qingling Motors. The share price benefited from the overall positive sentiment on China’s auto sector, where auto sales conti nue to be resilient.
Outlook
We believe that Chinese equities are likely to rise further in the fourth quarter 2013 as investors anticipate further news flow on economic reforms. However, following a couple of months of strong economic data, there could be some easing of growth momentum in China as restocking runs its course in addition to a higher base of comparison. Overall, 2013 economic growth should be within market expectations. Yet, in the absence of significant growth drivers, China’s economic outlook could remain subdued in 2014. Against this backdrop, we believe that Chinese equities will remain within a trading range in the medium term.
With respect to the Taiwanese equity market, despite a sluggish economy, we remain positive for the second half of the year. We maintain our view of that sales momentum will recover starting from August/September on inventory re-stocking and new product launches. After the second quarter result announcements and revisions, our 2013 fiscal year full-year earnings growth forecast stays intact and our preliminary 2014 fiscal year earnings growth forecast is in the high single digits, with positive growth year-on-year in all quarters.
Source : RCM Asia Pacific Limited as at September 30, 2013.
4
The China Fund, Inc. (CHN)
Portfolio Holdings
|
CUSIP
|
Security Description
|
Cost Base
|
Base MV
|
Shares
|
Percentage of
Net Assets
|
|
B3VN92906
|
HAND Enterprise Solutions Co., Ltd.
|
1,764,077.00
|
25,927,786.00
|
9,397,863
|
6.7
|
|
663094902
|
China Everbright International, Ltd.
|
11,203,641.00
|
21,805,211.00
|
24,687,000
|
5.6
|
|
688910900
|
Taiwan Semiconductor Manufacturing Co., Ltd.
|
16,072,089.00
|
20,679,880.00
|
6,084,000
|
5.3
|
|
685992000
|
Sun Hung Kai Properties, Ltd.
|
17,289,798.00
|
17,213,880.00
|
1,269,000
|
4.4
|
|
B1G1QD902
|
Industrial & Commercial Bank of China
|
16,829,555.00
|
17,014,158.00
|
24,390,000
|
4.4
|
|
B00G0S903
|
CNOOC, Ltd.
|
14,516,684.00
|
14,340,830.00
|
7,048,000
|
3.7
|
|
B01CT3905
|
Tencent Holdings, Ltd.
|
7,312,795.00
|
13,748,311.00
|
262,100
|
3.5
|
|
633393905
|
Enn Energy Holdings, Ltd.
|
606,420.00
|
12,305,546.00
|
2,204,000
|
3.2
|
|
607355906
|
China Mobile, Ltd.
|
10,406,102.00
|
11,292,165.00
|
1,009,500
|
2.9
|
|
674842901
|
Ruentex Development Co., Ltd.
|
4,180,803.00
|
10,112,442.00
|
4,933,904
|
2.6
|
|
635186901
|
Digital China Holdings, Ltd.
|
13,205,899.00
|
8,888,373.00
|
7,256,000
|
2.4
|
|
671815900
|
Qingling Motors Co., Ltd.
|
8,718,221.00
|
8,476,681.00
|
28,960,000
|
2.3
|
|
913BMZ902
|
Ping An Insurance (Group) Company of China, Ltd. Access Product (expiration 06/30/15)
|
9,494,980.00
|
8,234,316.00
|
1,418,047
|
2.1
|
|
B15456906
|
Bank of China, Ltd.
|
8,369,492.00
|
8,088,872.00
|
17,771,000
|
2.1
|
|
959GRNII9
|
Taiwan Life Insurance Co., Ltd., 4.0%, 12/28/14
|
6,178,274.00
|
8,016,816.00
|
200,000,000
|
2.1
|
|
17313A533
|
Gree Electric Appliances, Inc. Access Product (expiration 01/17/14)
|
6,453,442.00
|
7,942,519.00
|
1,838,546
|
2.0
|
|
626073902
|
Delta Electronics, Inc.
|
4,550,608.00
|
7,838,215.00
|
1,615,000
|
2.0
|
|
B3WH02907
|
Hermes Microvision, Inc.
|
7,867,215.00
|
7,824,263.00
|
269,000
|
2.0
|
|
658444906
|
Merida Industry Co., Ltd.
|
6,624,016.00
|
7,311,936.00
|
1,126,000
|
1.9
|
|
619376908
|
China Resources Land, Ltd.
|
5,128,719.00
|
7,294,508.00
|
2,554,000
|
1.9
|
|
620267906
|
Advantech Co., Ltd.
|
4,104,778.00
|
7,187,134.00
|
1,284,000
|
1.9
|
|
644094906
|
Taiwan FamilyMart Co., Ltd.
|
1,060,595.00
|
7,137,716.00
|
1,435,652
|
1.8
|
|
B2R2ZC908
|
CSR Corp., Ltd.
|
7,466,210.00
|
6,927,043.00
|
9,930,000
|
1.8
|
|
637248907
|
MediaTek, Inc.
|
6,194,126.00
|
6,910,221.00
|
559,000
|
1.8
|
|
608169900
|
Beijing Enterprises Holdings, Ltd.
|
6,527,292.00
|
6,697,355.00
|
927,500
|
1.7
|
|
644806002
|
Hutchison Whampoa, Ltd.
|
5,075,405.00
|
6,383,067.00
|
532,000
|
1.6
|
|
986PLG005
|
Golden Meditech Holdings, Ltd. (acquired 11/16/12 ) 15.0%, 11/16/13
|
6,001,198.00
|
6,005,957.00
|
58,222,500
|
1.5
|
|
B1L8PB906
|
Tong Hsing Electronic Industries, Ltd.
|
5,127,409.00
|
5,960,682.00
|
1,203,000
|
1.5
|
|
626735906
|
Hong Kong Exchanges and Clearing, Ltd.
|
4,947,274.00
|
4,916,457.00
|
306,500
|
1.3
|
|
B236JB905
|
Tiangong International Co., Ltd.
|
5,449,044.00
|
4,861,089.00
|
18,480,000
|
1.3
|
|
613623909
|
Hengan International Group Co., Ltd.
|
3,889,897.00
|
4,391,558.00
|
375,500
|
1.1
|
|
B57JY2909
|
China Minsheng Banking Corp., Ltd.
|
3,689,595.00
|
4,336,591.00
|
3,628,000
|
1.1
|
|
B633D9904
|
Zhongsheng Group Holdings, Ltd.
|
3,466,065.00
|
4,194,504.00
|
2,662,000
|
1.1
|
|
633521901
|
Taiwan Hon Chuan Enterprise Co., Ltd.
|
4,732,446.00
|
4,134,231.00
|
1,904,000
|
1.1
|
|
645166901
|
Largan Precision Co., Ltd.
|
3,937,557.00
|
3,970,981.00
|
118,000
|
1.0
|
|
17313X574
|
China State Construction Engineering Corp., Ltd. (expiration 01/17/14)
|
4,674,320.00
|
3,864,905.00
|
7,375,772
|
1.0
|
|
643055908
|
Golden Meditech Holdings, Ltd.
|
4,555,715.00
|
3,795,288.00
|
35,040,000
|
1.0
|
|
628625907
|
Li & Fung, Ltd.
|
3,939,103.00
|
3,793,308.00
|
2,608,000
|
1.0
|
|
665157905
|
Comba Telecom Systems Holdings, Ltd.
|
7,565,579.00
|
3,631,496.00
|
10,958,500
|
0.9
|
|
668787906
|
Kinsus Interconnect Technology Corp.
|
3,765,894.00
|
3,605,371.00
|
1,025,000
|
0.9
|
|
B16NHT900
|
Shui On Land, Ltd.
|
4,155,622.00
|
3,578,108.00
|
11,055,500
|
0.9
|
|
B6VG8G904
|
Asian Pay Television Trust
|
4,074,574.00
|
3,377,162.00
|
5,200,000
|
0.9
|
|
651795908
|
Natural Beauty Bio-Technology, Ltd.
|
4,906,910.00
|
3,322,038.00
|
47,710,000
|
0.9
|
|
993HWH901
|
Daqin Railway Co., Ltd. Access Product (expiration 11/02/11)
|
2,786,924.00
|
2,901,007.00
|
2,449,968
|
0.7
|
|
B3ZVDV905
|
Sinopharm Group Co., Ltd.
|
1,995,025.00
|
1,936,139.00
|
771,600
|
0.5
|
|
972ZGS900
|
Gree Electric Appliances, Inc. Access Product (expiration 10/14/13)
|
1,898,593.00
|
1,858,675.00
|
430,249
|
0.5
|
|
B1TDQL904
|
Ping An Insurance (Group) Company of China, Ltd.
|
1,566,145.00
|
1,218,889.00
|
209,900
|
0.3
|
|
Access Product (expiration 01/17/14)
|
|||||
|
BD04NT905
|
Integrated Waste Solutions Group Holdings, Ltd.
|
7,974,083.00
|
1,119,583.00
|
25,314,000
|
0.3
|
|
ACI009HH0
|
China Suntien Green Energy Corp., Ltd.
|
828,785.00
|
845,422.00
|
2,790,000
|
0.2
|
|
972ZHB906
|
China State Construction Engineering Corp., Ltd. (expiration 07/28/14)
|
886,370.00
|
814,795.00
|
1,555,844
|
0.2
|
|
ACI0090H8
|
Zong Su Foods (acquired 09/21/10)
|
15,000,034.00
|
0.00
|
2,677
|
0.0
|
Source: State Street Bank and Trust Company as at Sep 30, 2013.
5
The China Fund, Inc. (CHN)
The information contained herein has been obtained from sources believed to be reliable but RCM and its affiliates do not warrant the information to be accurate, complete or reliable. The opinions expressed herein are subject to change at any time and without notice. Past performance is not indicative of future results. This material is not intended as an offer or solicitation for the purchase or sale of any financial instrument. Investors should consider the investment objectives, risks, charges and expenses of any mutual fund carefully before investing. This and other information is contained in the fund’s annual and semiannual reports, proxy statement and other fund information, which may be obtained by contacting your financial advisor or visiting the fund’s website at www.chinafundinc.com. This information is unaudited and is intended for informational purposes only. It is presented only to provide information on investment strategies and opportunities. The Fund seeks to achieve its objective through investment in the equity securities of companies and other entities with significant assets, investments, production activities, trading or other business interests in China or which derive a significant part of their revenue from China. Investing in non-U.S. securities entails additional risks, including political and economic risk and the risk of currency fluctuations, as well as lower liquidity. These risks, which can result in greater price volatility, will generally be enhanced in less diversified funds that concentrate investments in a particular geographic region. The Fund is a closed-end exchange traded management investment company. This material is presented only to provide information and is not intended for trading purposes. Closed-end funds, unlike open-end funds, are not continuously offered. After the initial public offering, shares are sold on the open market through a stock exchange, where shares may trade at a premium or a discount. Holdings are subject to change daily.