Attached files
| file | filename |
|---|---|
| EX-99.1 - EX-99.1 - Zep Inc. | a13-21985_1ex99d1.htm |
| 8-K - 8-K - Zep Inc. | a13-21985_18k.htm |
Exhibit 99.2
|
|
Zep Fourth Quarter & Fiscal 2013 Earnings Conference Call October 9, 2013 John K. Morgan Chairman, President and Chief Executive Officer Mark R. Bachmann Executive Vice President and Chief Financial Officer © 2013 Zep Inc. - All rights reserved. |
|
|
Safe Harbor This presentation and our commentary contain forward-looking statements within the meaning of the Private Securities Litigation Reform Act of 1995. Specifically, forward-looking statements include, but are not limited to, statements relating to our future economic performance, business prospects, revenue, income, and financial condition; and statements preceded by, followed by, or that include the words "expects," "believes," "intends," "will," "anticipates," and similar terms that relate to future events, performance, or our results. Examples of forward-looking statements in this presentation and our commentary include but are not limited to: statements regarding the economic environment and the impact this environment has had or could have on our current and/or future financial results; statements regarding our expectations for pricing actions and gross margin performance; statements regarding benefits that we may realize from our acquisitions and our restructuring activities; statements regarding investments that may be made in the future to grow our business, either organically or otherwise, in accordance with our strategic plan, or that may be made for other purposes; and statements and related estimates concerning the benefits that the execution of our strategic initiatives are expected to have on future financial results. Specifically, the following statements are forward-looking statements within the meaning of the Private Securities Litigation Reform Act of 1995: Statements regarding our optimism about future results and our ability to implement measures that will result in profitable growth; statements regarding our ability to realize $9 million of cost savings in fiscal 2014 and reinvest a portion of those savings in strategic business initiatives; statements regarding our top-line results during fiscal 2014; statements regarding the impact of our restructuring and simplification activities on our free cash flow and outstanding indebtedness; statements regarding the expected magnitude of the reductions to our revenue from such activities and the timing of the reductions; statements regarding our expectations for fiscal 2014 gross margin percentage, statements regarding our expectation for the amount of capital expenditures in fiscal 2014; statements regarding our expectation for the amount of interest expense in fiscal 2014; statements regarding our fiscal 2014 anticipated tax rate and statements regarding our expectation to reduce our debt/EBITDA ratio in fiscal 2014.. Our forward-looking statements are subject to certain risks and uncertainties that could cause actual results, expectations, or outcomes to differ materially from our historical experience as well as our present expectations or projections. These risks and uncertainties include, but are not limited to: economic conditions in general; customer and supplier relationships and prices; competition; ability to realize anticipated benefits from strategic planning and restructuring initiatives and timing of benefits; market demand; and litigation and other contingent liabilities, such as environmental matters. A variety of other risks and uncertainties could cause our actual results to differ materially from the anticipated results or other expectations expressed in our forward-looking statements. A number of those risks are discussed in Part I, "Item 1A. Risk Factors" of our Annual Report on Form 10-K for the fiscal year ended August 31, 2012. We believe the forward-looking statements are reasonable; however, undue reliance should not be placed on any forward-looking statements, which are based on current expectations. Further, forward-looking statements speak only as of the date they are made, and we undertake no obligation to update publicly any of them in light of new information or future events. 2 © 2013 Zep Inc. - All rights reserved. |
|
|
Introduction |

|
|
Fiscal 4th Quarter Summary Revenue growth of 6%+ Gross margins improved 130 basis points Enacted initial cost-reduction actions Adjusted EBITDA grew 8% to $17 million Free cash flow grew by almost $27 million Reduced net debt by more than $29 million in the quarter 4 © 2013 Zep Inc. - All rights reserved. Strategic Execution Drove Free Cash Flow |
|
|
Fiscal 2013 Summary 5.5% revenue growth North America direct sales channel stabilizing (albeit lower) Gross margins improved 110 basis points Increased free cash flow by $34 million to $38 million, or $1.69 per share in fiscal 2013 Adjusted EBITDA grew 6% to $57 million in fiscal 2013 Following Zep Vehicle Care transaction, achieved approximately 50 basis point reduction in leverage ratio to 3.3 times and $0.02 EPS accretion 5 © 2013 Zep Inc. - All rights reserved. Drove Free Cash & Finished Fiscal 2013 with Improved Cost Structure |
|
|
Near-Term Expectations 4th Quarter 2013 Announced that we are reducing non-sales headcount by 6% Implemented series of restructuring actions with annualized savings of between $8-$12 million, $9 million of which is expected in 2014 1st & 2nd Quarter 2014 Expect to reinvest a portion of restructuring savings in the business New organization that will align sales & marketing to drive innovation, sales productivity and sales capacity Supply chain focused on sourcing opportunities, optimizing distribution footprint and system enhancements 6 © 2013 Zep Inc. - All rights reserved. Simplification Initiative is Key to Achieving Profitable Growth |
|
|
Detailed Financial Performance |

|
|
8 4Q ‘13 Revenue Drivers © 2013 Zep Inc. - All rights reserved. Revenues Increased 6.1% to $182.2 million ( ) ( ) |

|
|
4Q’13 North American Sales End-market Performance © 2013 Zep Inc. - All rights reserved. 9 * Adjusted for one less selling day. Determined by applying average daily sales in Q4 ‘13 to average daily sales in Q4 ‘12. Transportation Jan/San & Institutional Industrial/ MRO & Other 23.8% 2.6% 4.6% Change from Q4 ‘12 to Q4 ’13* 38% 22% 40% % of Q4 2013 North American Revenue 60% of North American Revenue Derived from Transportation and Industrial/MRO End Markets |

|
|
10 Fiscal 2013 Revenue Drivers © 2013 Zep Inc. - All rights reserved. Revenues Increased 5.5% to $689.6 million ( ) ( ) |

|
|
Fiscal 2013 North American Sales End-market Performance © 2013 Zep Inc. - All rights reserved. 11 * Adjusted for two less selling days. Determined by applying average daily sales in 2013 to average daily sales in 2012. Transportation Jan/San & Institutional Industrial/ MRO & Other 18.9% 2.6% 2.4% Change from 2012 to 2013* 38% 22% 40% % of 2013 North American Revenue Strategic Focus on Transportation and Industrial/MRO End Markets |

|
|
12 4Q ‘13 Gross Profit Margin © 2013 Zep Inc. - All rights reserved. Year-over-Year +130bps Quarter-to-Quarter +10bps ( ) Mix Positively Impacting Margins ( ) |
|
|
13 Fiscal 2013 Gross Profit Margin © 2013 Zep Inc. - All rights reserved. Year-over-Year +110bps Zep Vehicle Care Drove Margin Improvement ( ) |

|
|
4Q & 2013 Operating Expense 14 © 2013 Zep Inc. - All rights reserved. Selling, distribution and administrative expense increased by $6.1 million in the quarter and $22.3 million in fiscal 2013 due to: Inclusion of Zep Vehicle Care Expect initial and additional cost-reduction efforts to positively impact fiscal Q1 and subsequent quarters. Reducing 6% of non-sales headcount Consolidating selected distribution & production facilities Simplifying organization Analyzing product/customer portfolio |
|
|
15 Q4 ‘13 EBITDA © 2013 Zep Inc. - All rights reserved. ( ) ( ) ( ) |

|
|
16 Fiscal 2013 EBITDA © 2013 Zep Inc. - All rights reserved. ERP Implementation Affected Revenue and Expenses Equally, Resulting in $5 - $7 Million Reduction in EBITDA. Revenue Impact Expected to Last Through the 1st Half of Fiscal ‘14. ( ) ( ) ( ) |
|
|
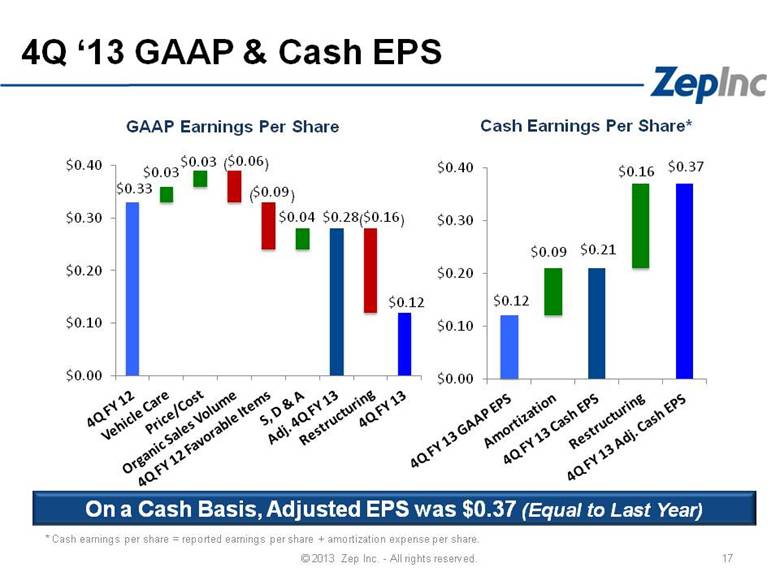
17 4Q ‘13 GAAP & Cash EPS © 2013 Zep Inc. - All rights reserved. GAAP Earnings Per Share Cash Earnings Per Share* On a Cash Basis, Adjusted EPS was $0.37 (Equal to Last Year) ( ) ( ) * Cash earnings per share = reported earnings per share + amortization expense per share. ( ) |
|
|
18 Fiscal 2013 GAAP & Cash EPS © 2013 Zep Inc. - All rights reserved. GAAP Earnings Per Share Cash Earnings Per Share* On a Cash Basis, Adjusted EPS was $1.15 (vs. $1.16 in FY 2012) ( ) ( ) * Cash earnings per share = reported earnings per share + amortization expense per share. ( ) ( ) |

|
|
Free Cash Flow 4Q ‘13 free cash flow flow increased $26.8 million to $28.5 million or $1.26 per share Improvement driven by: Working capital improvements Increased accruals for several operating expense items and the restructuring reserve we established during the quarter 2013 free cash flow increased $33.7 million to $38 million or $1.69 per share Improvement driven by: Working capital improvements Increased accruals Increased quarterly dividend by 25% to $0.05 per share 19 © 2013 Zep Inc. - All rights reserved. |
|
|
Fixed Charge Coverage Ratio* Debt to EBITDA* Net Debt Position ($mm) Covenants Debt Position 20 © 2013 Zep Inc. - All rights reserved. Net debt decreased $29.2 million Performance against debt covenants improved in the 4th quarter * As defined by Zep Inc.’s Credit Facility |
|
|
Fiscal 2014 Outlook Continued negative pressure on top-line results Gross margin between 46% - 48% Capital spending between $12 to $14 million Net interest expense between $8 - $9 million Tax rate between 35.5% and 36.5% Approximately half-turn improvement in Debt to EBITDA ratio 21 © 2013 Zep Inc. - All rights reserved. Note: Represents year-over-year comparisons. Confident in Ability to Drive Cost Reduction & Long-Term Strategy |
|
|
Near-Term Priorities Execute our complexity-reduction and cost-control plans to optimize our earnings and cash flow Utilize excess cash flow to reduce debt, make strategic investments and fund our dividend 22 © 2013 Zep Inc. - All rights reserved. |
|
|
Questions and Answers |