Attached files
| file | filename |
|---|---|
| 8-K - FORM 8-K - OMNOVA SOLUTIONS INC | d604264d8k.htm |
 Kevin
McMullen Chairman & CEO
October 2, 2013
Deutsche Bank’s
2013 Leveraged Finance
Conference
Exhibit 99 |
 -
2 -
Forward-Looking Statements
Non-GAAP Financial Measures
This presentation includes EBITDA, Adjusted EBITDA and Net Debt which are
non-GAAP financial measures as defined by the Securities and Exchange Commission.
For a reconciliation to the most directly comparable GAAP financial measures, refer
to the presentation Appendix.
•
This presentation and the accompanying oral remarks includes descriptions of our current business,
operations, assets and other matters affecting the Company as well as “forward-looking
statements,” as defined by federal securities laws. All forward-looking statements, as well as any verbal statements by the Company in
connection with this presentation, are intended to qualify for the protections afforded
forward-looking statements under the Private Securities Litigation Reform Act of 1995.
Forward-looking statements reflect management’s current expectation, judgment, belief, assumption, estimate or forecast about future events, circumstances
or results and may address business conditions and prospects, strategy, capital structure, sales,
profits, earnings, markets, products, technology, operations, customers, raw materials, claims
and litigation, financial condition, and accounting policies among other matters. Words such as, but not limited to, “will,” “may,”
“should,” “projects,” “forecasts,” “seeks,”
“believes,” “expects,” “anticipates,” “estimates,” “intends,” “plans,” “targets,” “optimistic,” “likely,” “would,” “could” and similar
expressions or phrases identify forward-looking statements.
•
All descriptions of our current business, operations and assets, as well as all forward-looking
statements involve risks and uncertainties. Many risks and uncertainties are inherent in
business generally and the markets in which the Company operates or proposes to operate. Other risks and uncertainties are more
specific to the Company’s businesses, including businesses that the Company acquires. There
may be risks and uncertainties not currently known to the Company. The occurrence of such risks
and uncertainties and the impact of such occurrence is often not predictable or within the Company’s control. Such impacts could
adversely effect the Company’s results and, in some cases, such effect could be material.
•
All written and verbal descriptions of our current business, operations and assets and
forward-looking statements attributable to the Company or any person acting on the
Company’s behalf are expressly qualified in their entirety by the risks, uncertainties and cautionary statements contained herein.
•
Any forward-looking statement speaks only as of the date on which such statement is made, and the
Company undertakes no obligation, and specifically declines any obligation, other than that
imposed by law, to publicly update or revise any forward-looking statements whether as a result of new information, future events or
otherwise.
•
Risks and uncertainties that may adversely impact our current business, operations, assets, or other
matters affecting the Company, and which may cause actual results to differ materially from
expected results include, among others: economic trends and conditions affecting the economy in general and/or the Company’s
end-use markets; prices and availability of raw materials including styrene, butadiene, vinyl
acetate monomer, polyvinyl chloride, acrylonitrile, acrylics and textiles; ability to increase
pricing to offset raw material cost increases; product substitution and/or demand destruction due to product technology, performance or cost
disadvantages; high degree of customer concentration and potential loss of a significant customer;
supplier, customer and/or competitor consolidation; customer credit and bankruptcy risk;
failure to successfully develop and commercialize new products; a decrease in regional customer demand due to reduced in-region
production or increased import competition; risks associated with international operations including
political unrest, fluctuations in exchange rates, and regulatory uncertainty; failure to
successfully implement productivity enhancement and cost reduction initiatives; risks associated with chemical handling and manufacturing
and with acts of war, terrorism, natural disasters or accidents, including fires, floods, explosions
and releases of hazardous substances; unplanned full or partial suspension of plant operations;
ability to comply, and cost of compliance with legislative and regulatory changes, including changes impacting environmental, health
and safety compliance and changes which may restrict or prohibit the Company from using or selling
certain products and raw materials; losses from the Company’s strategic alliance, joint
venture, acquisition, integration and operational activities; rapid inflation in health care costs; loss of key employees and inability to attract and
retain new key employees; prolonged work stoppage resulting from labor disputes with unionized
workforce; changes in, and significant contributions required to meet pension plan funding
obligations; attacks on and/or failure of the Company’s information systems; infringement or loss of the Company’s intellectual property;
litigation and claims against the Company related to products, services, contracts, employment,
environmental, safety, intellectual property and other matters; adverse litigation judgments or
settlements; absence of or inadequacy of insurance coverage for litigation judgments, settlements or other losses; higher than
expected capital expenditures; availability of financing at anticipated rates and terms; and loan
covenant default arising from substantial debt and leverage and the inability to service that
debt, including increases in applicable short-term or long-term borrowing rates.
•
For further information on risks and uncertainties, see the Company’s Form 10-K and Form
10-Q filings with the Securities and Exchange Commission.
Cautionary |
 -
3 -
LTM Sales = $1.0B*
Adj. EBITDA = $94M*
Performance Chemicals
LTM Sales $784M*
Engineered Surfaces
LTM Sales $254M*
Value-added emulsion polymers and
specialty chemicals used in coatings,
adhesives, binders and other
applications
Functional surfaces for
transportation, furnishings, new
construction and refurbishment
A Focused Polymer Company With Market Leadership Positions
A Focused Polymer Company With Market Leadership Positions
* LTM: Last Twelve Months is Through August 31, 2013;
See Appendices 1, 2 and 3
Business Segments At A Glance
|
 -
4 -
1.
1. Business Model / Market Position
2. Expanded Global Capability
3. Technology / Differentiation
Company / Business Model Changes & Highlights
|
 -
5 -
1. Business Model / Market Position
•
Leadership
positions
–
Typically
#1
or
#2
in
key
applications
•
Supplier of ingredients or components critical to
performance of finished products, but representing small
fraction of total cost
•
Market position and business model enables effective
margin management through periodic raw material volatility
–
Enhanced global sourcing capabilities
–
Diverse, value-added technology options
–
Responsive pricing mechanisms
Company / Business Model Changes & Highlights
|
 -
6 -
1. Business Model / Market Position
•
Strong, growing position in key markets rebounding from last
recession
–
Residential housing and commercial real estate
•
Refurbishment
•
New Construction
–
Transportation
•
Improved profitability of Engineered Surfaces unit
–
Exited commercial wallcovering (N.A. & U.K.)
–
Increased capacity utilization by reducing manufacturing footprint
–
Strong pipeline of new products to enhance value to customers
•
North American asset repurposing in Performance Chemicals
–
Reduces 120 million pounds of SB latex capacity by 2015
–
Improves capacity utilization and profitability
–
Assets converted to high styrene and styrene acrylic products
(continued)
Company / Business Model Changes & Highlights
|
 -
7 -
2. Expanded Global Capability
•
Expanded global manufacturing and technology footprint
provides access to fastest growing emerging world markets
(Asia-Pacific, China, India)
•
Global infrastructure improvements drive margins and
strengthen foundation for growth
–
SAP enterprise-wide platform
–
Globally integrated management
–
Global sourcing & logistics
–
Sustainability –
Vision 2014
–
LEAN SixSigma
Company / Business Model Changes & Highlights
|
 -
8 -
3. Technology / Differentiation
•
Focus on value added specialty applications through leading
technologies and deep application knowledge/support
•
Broader / diversified technologies in attractive growth
markets with acquisition of ELIOKEM
–
Specialty coatings
–
Elastomeric modifiers
–
Oilfield chemicals
Improved Business Model And Global Position
And Strong Foundation On Which To Build
Improved Business Model And Global Position
And Strong Foundation On Which To Build
Company / Business Model Changes & Highlights
|
 -
9 -
100% = $1.1 Billion
Asia &
Middle East
19%
USA
61%
Europe &
Africa
20%
Asia
2%
USA
87%
Europe
11%
•
New specialty emulsions plant in Caojing, China supports growth opportunities
•
Specialty
rubber
plant
in
India —
Global
production
hub
for
tires,
hoses,
belts,
gaskets
•
Low
cost
coated
fabrics
plants
in
China
and
Thailand
for
growing
transportation
position
2002
2002
2012*
2012*
100% = $681 Million
Sales by Region
* As of November 30, 2012
OMNOVA’s Global Reach
Growth Through Greater Global Diversification —
Growth Through Greater Global Diversification —
With Focus In Higher Growth Emerging Markets
With Focus In Higher Growth Emerging Markets |
 -
10 -
Refurbishment & New
Construction
35%
Transportation
21%
Industrial /
Other
10%
Personal
Hygiene
9%
Paper & Packaging
20%
Oilfield
5%
Markets Served -
Markets Served -
Global
Global
•
Strong products / positions to grow as
market recovers
Refurbishment & Construction
Refurbishment & Construction
•
A leading coated paper position in North
America
•
Leverage OMN technology for growth in:
–
N.A. packaging
–
China coated paper & packaging > 2013
Paper & Packaging
Paper & Packaging
•
Well positioned in growing Asian
markets
Transportation
Transportation
•
Oilfield chemicals
•
Personal hygiene
•
China / Asia
High Growth Markets
High Growth Markets
Sales by Market
LTM: Last Twelve Months is Through August 31, 2013
OMNOVA Consolidated
Attractive Growth Opportunities Leveraging OMNOVA Technology
Attractive Growth Opportunities Leveraging OMNOVA Technology
And Market Recovery
And Market Recovery |
 -
11 -
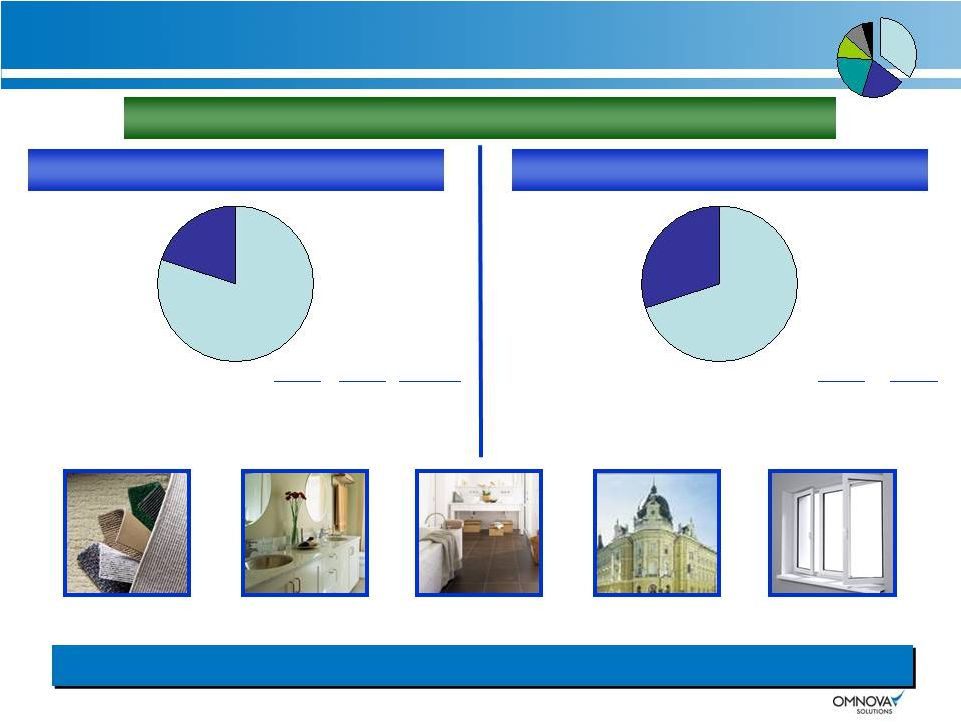
Refurbishment
80%
New
Construction
20%
Refurbishment
70%
New
Construction
30%
Elastomeric
Modification
2011
2013
CAGR
Sales of Existing Homes
4.26M
4.97M
+8%
New housing starts
429k
674k
+25%
Source: NAHB, MBA
Architectural
Coatings
Carpet
Latex
Kitchen and
Bath Laminates
2011
2014
Office vacancy rates
16.0%
14.1%
Commercial Real Estate Volume
$211B
$340B
Source: ULI / E&Y
+61%
LTM: Last Twelve Months is Through August 31, 2013
Solid Surface
Flooring Laminates
35% of OMNOVA LTM Sales or > $365 Million
35% of OMNOVA LTM Sales or > $365 Million
Strong Products / Positions To Grow As Industry Recovers
Strong Products / Positions To Grow As Industry Recovers
Residential Housing ~ 80%
Residential Housing ~ 80%
Commercial Building ~ 20%
Commercial Building ~ 20%
Refurbishment and New Construction
|
 -
12 -
Packaging And China Expected To Drive OMNOVA Growth in This Market
Packaging And China Expected To Drive OMNOVA Growth in This Market
20% of OMNOVA LTM Sales or ~
20% of OMNOVA LTM Sales or ~
$210 Million
$210 Million
Leverage technology for above
market performance
N. American
N. American
Coated Paper
Coated Paper
N. American
N. American
Packaging
Packaging
China
China
Coated
Coated
Paper & Packaging
Paper & Packaging
Rapidly growing middle class
drives growth in segment
OMN technology and assets drive
market penetration > 2013
Market
Size
(MM Lbs Emulsion
Polymers 2012)
Forecasted
Per Year Growth
(2013-2015)
OMNOVA Opportunity
900 -3% to
-4% 1,800
+5%
600
+2%
LTM: Last Twelve Months is Through August 31, 2013
OMN focus / technology to drive share gain
Market drivers - sustainability focus,
better point of sale promotion Paper and Packaging
Chemicals |
 -
13 -
Well Positioned In Growing Asian Markets With
China, India, Thailand Manufacturing
Well Positioned In Growing Asian Markets With
China, India, Thailand Manufacturing
21%
of
OMNOVA
LTM
Sales
or
>
$210
Million
Projected Strong Growth In China And Asian Light Vehicle
Sales And Work Tire Demand
Tire Cord Adhesives
-
Global -
Nitrile Rubber
(Belts, Hoses)
-
Asia -
Coated Fabrics
(Vehicle Seating)
-
Asia -
LTM: Last Twelve Months is Through August 31, 2013
Transportation
|
 -
14 -
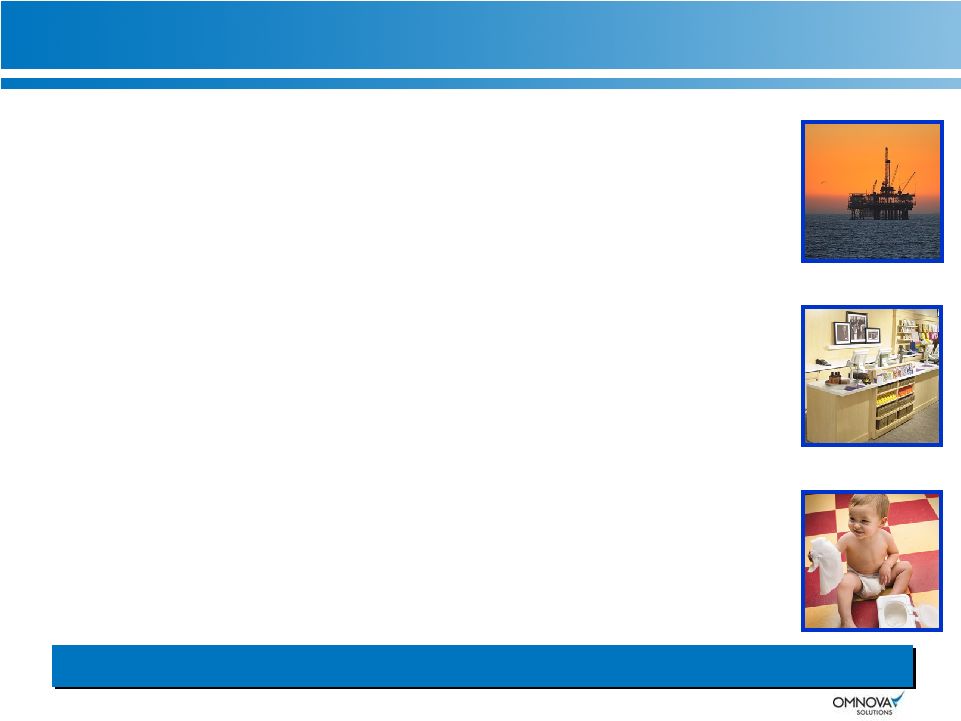
•
Oilfield / gas drilling and cementing chemicals
–
Oilfield
rigs
projected
growth
at
8-10%
per
year
through
2015
–
Opportunity for OMN to grow above market
•
Focus in fast growth high temperature / pressure environments
•
Unique new emulsion and powder products
•
Decorative laminates (for retail / store display, furniture,
flooring)
–
Bundled approach to provide matching paper and vinyl
laminates to “big box”
retail stores
–
OMNOVA
products
specified
by
retail
store
chains;
flooring
mfgrs
–
Cost in-use advantage / superior design aesthetics drives
substitution
•
Personal hygiene products grow in emerging markets
–
Global growth in nonwoven binders
–
New plant in Caojing, China positioned to serve rapidly growing
Asian markets
Unique Technology-Focused Value Proposition Drives Growth
Unique Technology-Focused Value Proposition Drives Growth
High Growth Markets / Applications
|
 -
15 -
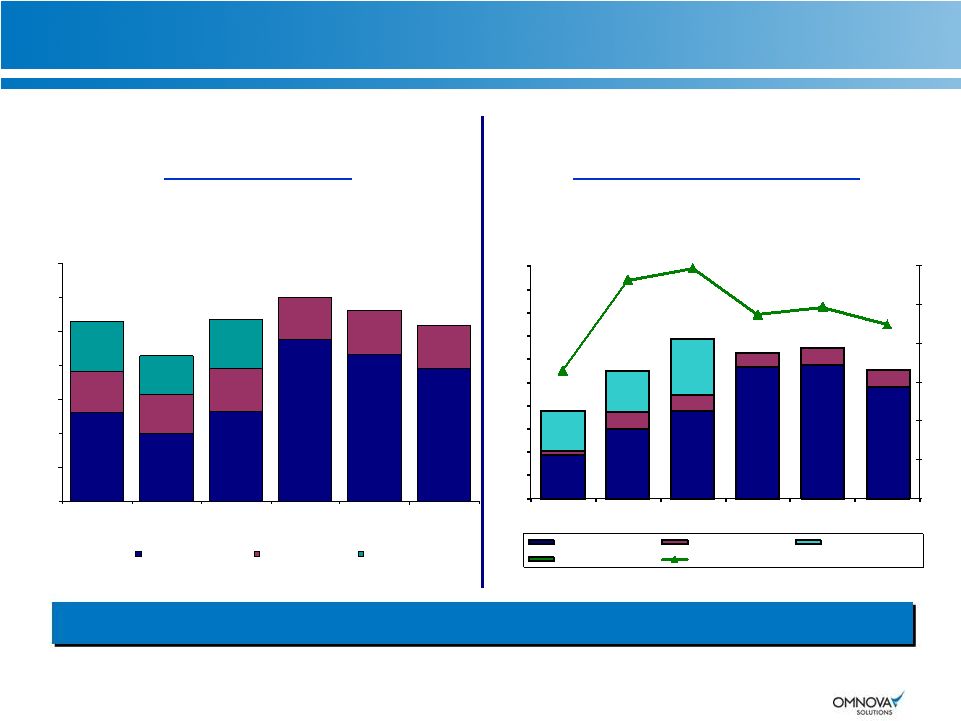
Annual Revenue*
Annual Adjusted EBITDA*
*
$521.6
$396.8
$527.9
$951.9
$864.5
$784.0
$245.1
$228.5
$253.8
$249.2
$261.0
$253.6
$229.5
$288.4
$289.5
$0
$200
$400
$600
$800
$1,000
$1,200
$1,400
2008
2009
2010
2011
2012
LTM
8/31/2013
Performance Chemicals
Engineered Surfaces
ELIOKEM
$854.8
$1,056.2
$1,201.1
$1,125.5
Strong EBITDA Performance Across Varied Business Conditions
Strong EBITDA Performance Across Varied Business Conditions
$1,037.6
$1,070.1
Pro forma results include ELIOKEM acquisition and exclude divested commercial wallcovering businesses
LTM: Last Twelve Months is Through August 31, 2013
Adjusted EBITDA - See Appendices 1, 2, 3, and 4; Annual Adjusted EBITDA includes OMNOVA Corporate
Expense of $6.1M, $12.7M, $10.8M, $11.6M, $17.6M and $17.2M for 2008, 2009, 2010, 2011, 2012 and LTM 2013, respectively.
Historical Financial Results
$37.5
$59.7
$75.8
$113.5
$115.0
$96.1
$3.6
$14.8
$13.4
$12.3
$14.5
$14.7
$34.6
$35.1
$48.7
6.6%
11.3%
11.9%
9.5%
9.9%
9.0%
0.0%
2.0%
4.0%
6.0%
8.0%
10.0%
12.0%
$0.0
$20.0
$40.0
$60.0
$80.0
$100.0
$120.0
$140.0
$160.0
$180.0
$200.0
2008
2009
2010
2011
2012
LTM 8/31/2013
Performance Chemicals
Engineered Surfaces
ELIOKEM
OMN Cons. Est.
EBITDA Margin
$96.9
$127.1
$114.2
$111.9
$93.6
$69.6 |
 -
16 -
Financial Goals
Financial Goals
•
Increased capacity utilization
•
Expansion in faster growing
markets in Asia
•
Higher value-added applications
•
Deeper penetration with strong
pipeline of new products and
broader technology
•
Leverage global infrastructure
investments (SAP, LSS, Sourcing)
•
Stronger presence in emerging
markets of Asia / India
•
Leverage future cyclical market
improvements in refurbishment, new
construction and transportation
•
Unique capabilities and proven
performance open opportunities in
niche applications (e.g. oilfield,
personal hygiene and retail displays,
flooring, food / hospitality fixtures)
Volume
Volume
Goal
Goal
4
4
-
-
6%
6%
Per
Per
Annum
Annum
Profit
Profit
Goal
Goal
12
12
–
–
14%
14%
EBITDA
EBITDA
OMNOVA Solutions
|
 -
17 -
0.0x
1.0x
2.0x
3.0x
4.0x
5.0x
6.0x
$0
$50
$100
$150
$200
$250
$300
$350
$400
Net Debt*
(Net Debt / Adjusted EBITDA)
($ Millions)
*
Change
in
net
debt
–
See
Appendix
5
–
Net
Debt
/
Leverage
LTM: Last Twelve Months is Through August 31, 2013
$111
Leverage*
$68
$356
Proven Success At Deleveraging Has Enabled Opportunities
Such As The ELIOKEM Acquisition
Proven Success At Deleveraging Has Enabled Opportunities
Such As The ELIOKEM Acquisition
$307
$300
2009
2010
2011
2011
2012
2013 Q3
Q1
YE
YTD
5.1x
0.9x
1.8x
2.7x
3.1x
2008
2009
2010
2011
2011
2012
LTM
Q1
YE
8/31/2013
3.2x
ELIOKEM
Acquisition
ELIOKEM
Acquisition
$376
3.5x
Significant Cash Flow Generation
|
 -
18 -
$250
$195
$5
Liquidity
Liquidity
Foreign Debt & L/C’s
•
Various short-term
maturities
Term Loan B
•
2018 Maturity
•
L+300; floor 1.25%
•
Net Sr. Secured leverage
ratio covenant
Senior Notes 7.875%
•
2018 Maturity
•
No financial covenants
Debt
$450 Million
Net Sr. Secured Leverage Ratio
Net Sr. Secured Leverage Ratio
2011
2012
2013
2014
Covenant
< 3.25
< 3.00
< 2.75
< 2.50
Actual
0.9
0.5
0.5
EBITDA
Cushion
$84M
$95M
$77M
Capital Structure
All-In Debt Cost
All-In Debt Cost
6.3% / Significant Liquidity And Covenant Cushion
6.3% / Significant Liquidity And Covenant Cushion
11/30/12
8/31/13
Revolver
$
76
$
75
Balance Drawn
Letters of Credit
0
2
0
2
Remaining Capacity
74
73
Cash
149
150
Total Liquidity
$223M
$223M |
 -
19 -
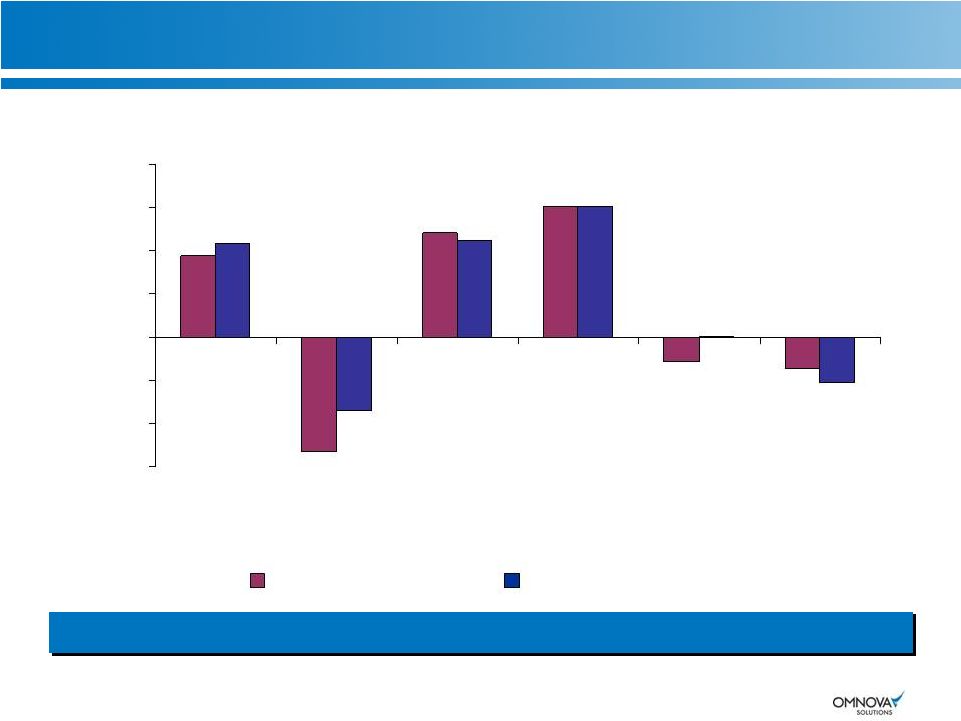
Improved Product Mix and Responsive Pricing Mechanism
Improved Product Mix and Responsive Pricing Mechanism
($ Millions)
Raw Material Inflation
OMNOVA Pricing Realization
OMNOVA Legacy 2008-2011
75.1
(106.8)
96.8
(23.0)
(29.3)
86.9
89.6
(42.0)
120.7
120.8
0.8
(68.7)
-$120
-$80
-$40
$0
$40
$120
2008
2009
2010
2011
2012
Q3 2013
YTD
$160
$80
Price Realization vs. Raw Material Inflation |
 Confidential
Engineered Surfaces
Engineered Surfaces |
 -
21 -
*
LTM: Last Twelve Months is Through August 31, 2013;
See
Appendix
2
–
Engineered
Surfaces
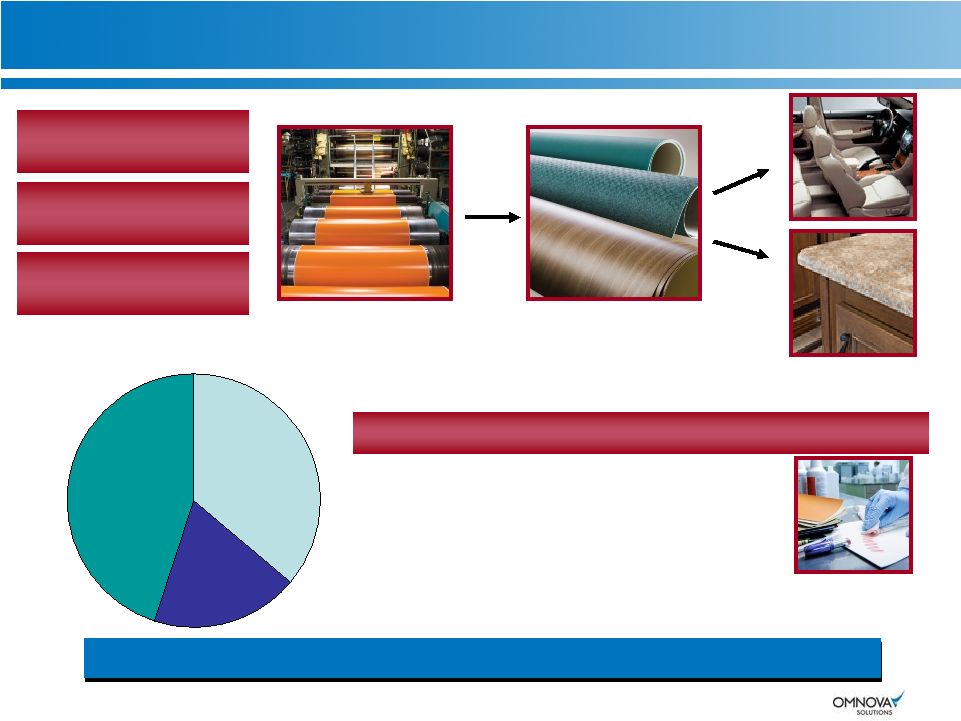
A Broad-Based Functional And Decorative Surfaces Business
A Broad-Based Functional And Decorative Surfaces Business
Sales*
Sales*
$254.0M
$254.0M
Adj. EBITDA*
Adj. EBITDA*
$14.7M
$14.7M
Adj. EBITDA Margin
Adj. EBITDA Margin
5.8%
5.8%
Manufacturing
Process
Functional and
Decorative Surfaces
Customers
•
Durability
•
Stain, scratch resistance, cleanability
•
Attractive designs
•
Critical part of finished product; small part of cost
•
Cost effective substitute for other materials
Key Characteristics:
Key Characteristics:
Laminates
36%
Performance
Films
19%
Coated
Fabrics
45%
Engineered Surfaces – Segment Overview
|
 -
22 -
•
Kitchen and bath laminates
•
Furniture using coated fabrics
•
Furniture, appliance and flooring laminates
Residential Housing
Residential Housing
Markets Served
Residential
Housing
27%
Transportation
40%
Industrial /
Other
15%
Commercial
Buildings
19%
•
Automotive seating and interior materials
•
Bus / mass transit seating upholstery
•
Recreational vehicle laminates
Transportation
Transportation
•
Store fixture and display laminates
•
Contract furniture upholstery
•
Interior wall partitions
•
Ceiling tile laminates
Commercial Building
Commercial Building
•
Medical application films
•
Tape and labels
Industrial / Other
Industrial / Other
LTM: Last Twelve Months is Through August 31, 2013
Engineered Surfaces
|
 -
23 -
Upholstery, Laminates and Films Engineered for Functional
Performance with Outstanding Design
Upholstery, Laminates and Films Engineered for Functional
Upholstery, Laminates and Films Engineered for Functional
Performance with Outstanding Design
Performance with Outstanding Design
Automotive
Mass
Transit
Kitchen &
Bath Cabinets
Marine
Contract
Flooring
Digital
Wall Murals
RV/Mfg. Housing
Industrial
Window
Profiles
Retail
Displays
Decking
Healthcare
Major Surface Applications
|
 Confidential
Performance Chemicals
Performance Chemicals
Performance Chemicals |
 -
25 -
*
LTM: Last Twelve Months is Through August 31, 2013;
See Appendix 3 –
Performance Chemicals
Adj. EBITDA*
Adj. EBITDA*
$96.1M
$96.1M
Providing Value-Added Solutions On A Global Basis
Providing Value-Added Solutions On A Global Basis
Providing Value-Added Solutions On A Global Basis
Adj. EBITDA Margin
Adj. EBITDA Margin
12.3%
12.3%
Sales*
Sales*
$784.0M
$784.0M
•
High performance, globally specified products
•
Many high margin, niche applications
•
High switching costs for customers
•
Solutions provider with value-added technical
service
Key Characteristics:
Key Characteristics:
Emulsion
Polymerization
Process
Customers
Specialty
Chemicals
63%
Performance
Materials
37%
Products
(Wet / Dry)
Raw Materials =
Basic Monomers
Styrene
Styrene
Butadiene
Butadiene
Acrylics
Acrylics
Acrylonitrile
Acrylonitrile
Others
Others
—
—
—
—
—
—
—
—
Critical ingredients – Key to finished product
performance; small % of total cost
Performance Chemicals – Segment Overview
|
 -
26 -
Personal
Hygiene
Coating
Resins
Tape &
Adhesives
Antioxidants
Oil/Gas
Drilling
Specialty
Rubber &
Reinforcement
Elastomeric
Modifiers
Construction
Floor
Care
Paper/
Packaging
Carpet
Tire
Cord
Global Chemical Markets
Numerous Applications Within The Emulsion Polymer Space
|
 -
27 -
Refurbishment &
New Construction
32%
Transportation
14%
Industrial
9%
Personal
Hygiene
11%
Paper &
Packaging
27%
Oilfield
7%
SB Latex
45%
Acrylics &
Vinyl Acetate
24%
Vinyl
Pyridine
Latex
9%
Nitrile
Rubber
8%
Other
Chemicals
4%
Antioxidants
5%
High Styrene
5%
Diversified Markets Served With
Broad-Based Chemistries
Diversified Markets Served With
Diversified Markets Served With
Broad-Based Chemistries
Broad-Based Chemistries
Markets
Markets
Served
Served
–
–
Global
Global
*
*
Chemistries
Chemistries
*
*
* LTM: Last Twelve Months Through August 31, 2013
OMNOVA Performance Chemicals
|
 -
28 -
Expanded manufacturing capability in high-growth (Asia and India) emerging
markets Strong global business/supply chain infrastructure on which to
build Improved capacity utilization through repurposing N.A.
assets Growing Global
Growing Global
Footprint
Footprint
Leading Market
Leading Market
Positions
Positions
Diverse Business
Diverse Business
Model
Model
Stronger And More
Stronger And More
Stable Margins
Stable Margins
Strong Free Cash
Strong Free Cash
Flow
Flow
OMNOVA Is Creating Value Through A Global Enterprise
OMNOVA Is Creating Value Through A Global Enterprise
OMNOVA Is Creating Value Through A Global Enterprise
Typically #1 or #2 –
in key applications provides competitive advantage and
above market growth
Strong technology and new product pipeline further enhanced with
acquisition
Over 1,000 products sold to over 1,500 customers in more than 90
countries
Significant expansion into adjacent markets in the emulsion polymer space through
acquisitions such as ELIOKEM
Improved margins since 2008 (despite sluggish economy and dynamic operating
conditions)
Margin improvement driven by diversification of markets & technologies
Position as a critical ingredients supplier
Strong legacy of cash generation
Maintenance capex generally below D&A
NOL’s shield cash taxes for several years
Key Investment Highlights
|
 -
29 -
Company Confidential |
 -
30 -
Appendix |
 -
31 -
This presentation includes EBITDA, Adjusted EBITDA and Net Debt which are
Non-GAAP financial measures as defined by the Securities and Exchange
Commission. OMNOVA’s EBITDA is calculated as income (loss) from continuing
operations less interest expense, amortization of deferred financing costs,
income taxes and depreciation and amortization expense. OMNOVA’s Adjusted EBITDA is
calculated as OMNOVA’s EBITDA less restructuring and severance expenses, asset
impairments, non-cash stock compensation and other items. Segment
EBITDA is calculated as segment operating income (loss) less interest expense,
amortization of deferred financing costs, income taxes and depreciation and amortization expense.
Segment Adjusted EBITDA is calculated as Segment EBITDA less restructuring and
severance expenses, asset impairments, non-cash stock compensation and
other items. For purposes of this presentation, Net Debt is calculated
as total debt less cash. ELIOKEM’s EBITDA is calculated as net
income less interest expense, amortization of deferred financing costs, income
taxes and depreciation and amortization expense. ELIOKEM’s Adjusted EBITDA is calculated as ELIOKEM’s
EBITDA less restructuring and severance expenses, asset impairments and other
items. EBITDA, Adjusted EBITDA and Net Debt are not measures of
financial performance under GAAP. EBITDA, Adjusted EBITDA
and
Net
Debt
are
not
calculated
in
the
same
manner
by
all
companies
and,
accordingly,
are
not
necessarily
comparable to similarly titled measures of other companies and may not be appropriate
measures for comparing performance relative to other companies. EBITDA,
Adjusted EBITDA and Net Debt should not be construed as indicators of the
Company’s operating performance or liquidity and should not be considered in isolation from or as
a substitute for net income (loss), cash flows from operations or cash flow data,
which are all prepared in accordance with GAAP. EBITDA, Adjusted EBITDA
and Net Debt are not intended to represent, and should not be considered more
meaningful than or as an alternative to, measures of operating performance as determined in
accordance with GAAP. Management believes that presenting this information is
useful to investors because these measures are commonly used as analytical
indicators to evaluate performance and by management to allocate
resources. Set forth below are the reconciliations of these non-GAAP
measures to their most directly comparable GAAP financial measure.
All appendix results are pro forma reflecting continuing business (including the
acquisition of ELIOKEM and excluding the sale of global wallcovering
businesses). Appendix – Non-GAAP Financial Measures |
 -
32 -
($ Millions)
LTM
OMNOVA Solutions Consolidated
2008
2009
2010
2011
2012
2013
Income (Loss) from Continuing Operations
$
(2.9)
$
27.4
$
117.2
$
16.7
$
25.7
$
11.6
Interest expense
12.3
7.5
8.0
35.3
33.8
30.5
Amortization of deferred financing costs
0.7
0.6
0.7
2.7
2.7
2.4
Income Tax
0.1
1.0
(83.9)
13.4
11.2
6.8
Depreciation and amortization
20.9
20.4
18.7
33.5
32.0
32.4
EBITDA
$
31.1
$
56.9
$
60.7
$
101.6
$
105.4
$
83.7
Restructuring, severance and other
0.6
1.9
0.6
2.2
1.0
5.0
Asset impairments
-
1.1
2.7
3.1
1.0
0.6
Non-cash stock compensation
2.1
2.4
3.2
3.6
4.5
2.8
Other
1.2
(0.5)
11.2
3.7
-
1.5
Adjusted EBITDA
$
35.0
$
61.8
$
78.4
$
114.2
$
111.9
$
93.6
Sales
$
766.7
$
625.3
$
781.7
$
1,201.1
$
1,125.5
$
1,037.6
Percentage of Adjusted EBITDA to Sales
4.6%
9.9%
10.0%
9.5%
9.9%
9.0%
LTM
Combined Adjusted EBITDA
2008
2009
2010
2011
2012
2013
OMNOVA Solutions Adjusted EBITDA
$
35.0
$
61.8
$
78.4
$
114.2
$
111.9
$
93.6
Eliokem International Adjusted EBITDA
34.6
35.1
48.7
-
-
-
Combined Adjusted EBITDA
$
69.6
$
96.9
$
127.1
$
114.2
$
111.9
$
93.6
Combined Sales
OMNOVA Solutions
$
766.7
$
625.3
$
781.7
$
1201.1
$
1,125.5
$
1,037.6
Eliokem International
289.5
229.5
288.4
-
-
-
Combined Sales
$
1,056.2
$
854.8
$
1,070.1
$
1,201.1
$
1,125.5
$
1,037.6
Percentage of Adjusted EBITDA to Sales
6.6%
11.3%
11.9%
9.5%
9.9%
9.0%
LTM: Last Twelve Months Through August 31, 2013
Appendix 1 – OMNOVA Consolidated
|
 -
33 -
($ Millions)
LTM
Engineered Surfaces Segment
2008
2009
2010
2011
2012
2013
Segment Operating Profit
$
(7.2)
$
2.2
$
(3.2)
$
(1.3)
$
3.8
$
4.1
Interest expense
-
-
-
-
-
-
Amortization of deferred financing costs
-
-
-
-
-
-
Income Tax
-
-
-
-
-
Depreciation and amortization
9.5
10.2
9.0
8.5
7.6
7.0
EBITDA
$
2.3
$
12.4
$
5.8
$
7.2
$
11.4
$
11.1
Restructuring, severance and other
0.4
1.4
0.1
1.1
1.1
3.7
Asset impairments
-
0.4
2.7
3.1
1.0
0.7
Non-cash stock compensation
0.9
0.6
0.5
0.5
0.9
0.4
Other
-
-
4.3
0.4
0.1
(1.2)
Adjusted EBITDA
$
3.6
$
14.8
$
13.4
$
12.3
$
14.5
$
14.7
Sales
$
245.1
$
228.5
$
253.8
$
249.2
$
261.0
$
253.6
Percentage of Adjusted EBITDA to Sales
1.5%
6.5%
5.3%
4.9%
5.6%
5.8%
LTM: Last Twelve Months Through August 31, 2013
Appendix 2 – Engineered Surfaces
- |
 -
34 -
($ Millions)
LTM
Performance Chemicals
2008
2009
2010
2011
2012
2013
Segment Operating Profit
$
25.2
$
47.9
$
73.3
$
86.5
$
89.6
$
69.4
Interest expense
-
-
-
-
-
-
Amortization of deferred financing costs
-
-
-
-
-
-
Income Tax
-
-
-
-
-
-
Depreciation and amortization
10.9
9.9
9.4
24.6
24.1
25.1
EBITDA
$
36.1
$
57.8
$
82.7
$
111.1
$
113.7
$
94.5
Restructuring, severance and other
0.1
0.2
1.5
1.1
-
1.2
Asset impairments
-
0.7
-
-
-
Non-cash stock compensation
1.2
0.8
1.2
1.3
1.5
0.7
Other
0.1
0.2
(9.6)
-
(0.2)
(0.3)
Adjusted EBITDA
$
37.5
$
59.7
$
75.8
$
113.5
$
115.0
$
96.1
Sales
$
521.6
$
396.8
$
527.9
$
951.9
$
864.5
$
784.0
Percentage of Adjusted EBITDA to Sales
7.2%
15.0%
14.4%
11.9%
13.3%
12.3%
LTM
Combined Adjusted EBITDA
2008
2009
2010
2011
2012
2013
Performance Chemicals Adjusted EBITDA
$
37.5
$
59.7
$
75.8
$
113.5
$
115.0
$
96.1
Eliokem International Adjusted EBITDA
34.6
35.1
48.7
-
-
-
Combined Adjusted EBITDA
$
72.1
$
94.8
$
124.5
$
113.5
$
115.0
$
96.1
Combined Sales
Performance Chemicals
$
521.6
$
396.8
$
527.9
$
951.9
$
864.5
$
784.0
Eliokem International
289.5
229.5
288.4
-
-
-
Combined Sales
$
811.1
$
626.3
$
816.3
$
951.9
$
864.5
$
784.0
Percentage of Combined Adjusted EBITDA
to Combined Sales
8.9%
15.1%
15.3%
11.9%
13.3%
12.3%
LTM: Last Twelve Months Through August 31, 2013
Appendix 3 – Performance Chemicals
- |
 -
35 -
($ Millions)
Eliokem International
2008
2009
2010
Net Income
$
(2.5)
$
1.2
$
0.4
Interest expense
17.5
16.8
16.0
Amortization of deferred financing costs
0.5
0.5
0.4
Income Tax
(3.3)
1.3
2.6
Depreciation and amortization
14.3
13.4
13.2
EBITDA
$
26.5
$
33.2
$
32.6
Restructuring & severance
1.1
3.9
1.1
Asset impairments
-
-
-
Non-cash stock compensation
-
-
-
Other
7.0
(2.0)
15.0
Adjusted EBITDA
$
34.6
$
35.1
$
48.7
Sales
$
289.5
$
229.5
$
288.4
Percentage of Adjusted EBITDA to Sales
12.0%
15.3%
16.9%
Appendix 4 – Pro Forma ELIOKEM
|
 -
36 -
($ Millions)
Asian Acq
Year-End
Year-End
Year-End
Eliokem
Year-End
Year-End
LTM
OMNOVA Solutions Consolidated
May 31, 2008
2008
2009
2010**
Dec 31, 2010
2011
2012
2013
Total Debt*
$
206.9
$
196.4
$
152.7
$
397.2
$
460.8
$
459.6
$
455.8
$
449.9
Less Cash*
(13.1)
(17.4)
(41.5)
(328.8)
(84.7)
(103.1)
(148.5)
(150.1)
Net Debt*
$
193.8
$
179.0
$
111.2
$
68.4
$
376.1
$
356.5
$
307.3
$
299.8
Adjusted EBITDA (Appendix 1)
$
35.0
$
61.8
$
78.4
$
114.2
$
111.9
$
93.6
Net Debt / Adjusted EBITDA
5.1
X
1.8
X
0.9
X
3.12
X
2.75
X
3.20
LTM: Last Twelve Months Through August 31, 2013
* As Defined by the Term Loan B Agreement
** 2010 Total Debt includes $250.0M of Senior Notes held in escrow and 2010 cash
includes restricted cash of $253.1M Appendix 5 – Net Debt / Leverage
|
 Company Confidential |