Attached files
| file | filename |
|---|---|
| 8-K - 8-K - ACRES Commercial Realty Corp. | form8kjmppresentation.htm |
0 Resource Capital Corp. October 2013
1 Safe Harbor This presentation contains forward-looking statements that involve risks and uncertainties. These forward-looking statements are not historical facts but rather are based on our current beliefs, assumptions and expectations. These beliefs, assumptions and expectations can change as a result of many possible events or factors, not all of which are known to us or are within our control. If a change occurs, our business, financial condition, liquidity and results of operations may vary materially from those expressed in our forward-looking statements. You should not place undue reliance on these forward-looking statements, which reflect our view only as of the date of this presentation. We use words such as “anticipate,” “expect,” “intend,” “plan,” “believe,” “seek,” “estimate,” and variations of these words and similar expressions to identify forward-looking statements. Forward-looking statements are subject to various risks and uncertainties that could cause actual results to vary from our forward-looking statements, including: changes in our industry, interest rates, the debt securities markets, real estate markets or the general economy; increased rates of default and/or decreased recovery rates on our investments; the performance and financial condition of our borrowers; the cost and availability of our financings, which depends in part on our asset quality, the nature of our relationships with our lenders and other capital providers, our business prospects and outlook and general market conditions; the availability and attractiveness of terms of additional debt repurchases; availability, terms and deployment of short-term and long-term capital; availability of, and ability to retain, qualified personnel; changes in our business strategy; availability of investment opportunities in commercial real estate-related and commercial finance assets; the resolution of our non-performing and sub-performing assets; our ability to comply with financial covenants in our debt instruments; the degree and nature of our competition; the adequacy of our cash reserves and working capital; the timing of cash flows, if any, from our investments; unanticipated increases in financial and other costs, including a rise in interest rates; our ability to maintain compliance with over-collateralization and interest coverage tests in our CDOs and/or CLOs; our dependence on our Manager and ability to find a suitable replacement in a timely manner, or at all, if we or our Manager were to terminate the management agreement; environmental and/or safety requirements; our ability to satisfy complex rules in order for us to qualify as a REIT, for federal income tax purposes and qualify for our exemption under the Investment Company Act of 1940, as amended, and our ability and the ability of our subsidiaries to operate effectively within the limitations imposed by these rules; legislative and regulatory changes (including changes to laws governing the taxation of REITs or the exemptions from registration as an investment company); and other factors discussed under Item IA. Risk Factors of our Annual Report on Form 10-K for the year ended December 31, 2012 and those factors that may be contained in any subsequent filing we make with the Securities Exchange Commission. We undertake no obligation to publicly update or revise any forward-looking statements, whether as a result of new information, future events or otherwise, except as required by law. In light of these risks and uncertainties, the forward-looking events and circumstances discussed in this presentation might not occur and actual results, performance or achievement could differ materially from that anticipated or implied in the forward-looking statements.
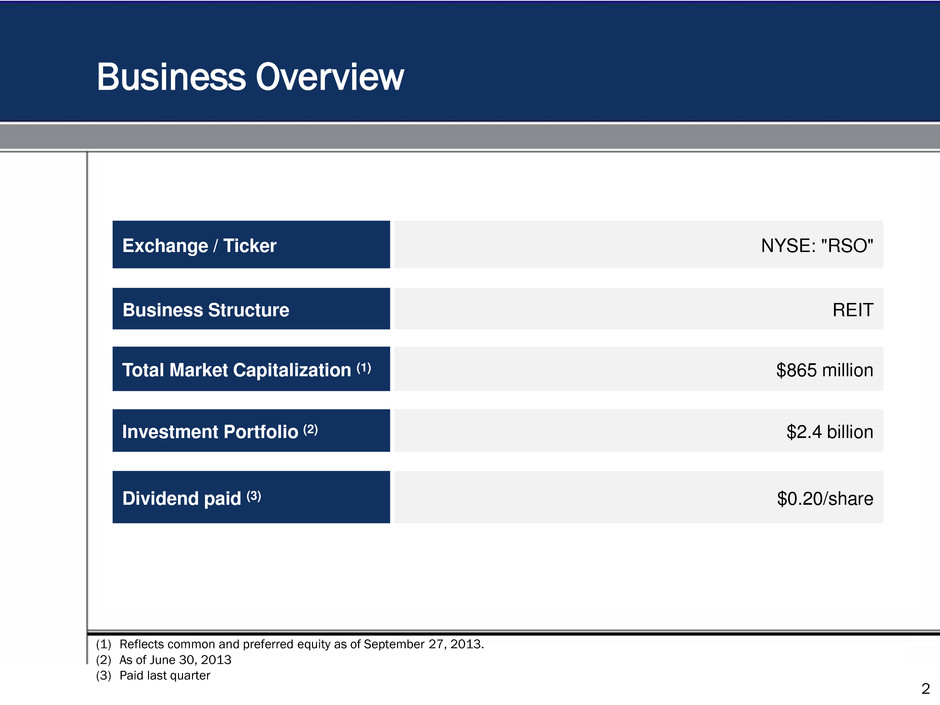
2 Business Overview (1) Reflects common and preferred equity as of September 27, 2013. (2) As of June 30, 2013 (3) Paid last quarter Exchange / Ticker NYSE: "RSO" Business Structure REIT Total Market Capitalization (1) $865 million Investment Portfolio (2) $2.4 billion Dividend paid (3) $0.20/share
RSO is a REIT primarily focused on originating, underwriting and investing in transitional commercial real estate mortgage loans Approximately $2.4 billion in assets as of June 30, 2013 Provides customized financing solutions throughout the US to commercial real estate borrowers in multi-family, office, retail, hotel and other property classes Well established and seasoned direct origination platform Floating-rate assets (LIBOR based) provide protection against rising interest rates Committed and experienced sponsor and management team Approximately 5.0% ownership by management team and affiliates Assets are predominantly term-funded RSO had $143 million of unrestricted cash as of September 30, 2013* Resource Capital Corp. Overview 3 * Please note this is an estimated cash number
4 Powerful and Established CRE Platform Powerful core real estate platform and established management team in origination, acquisition, asset management and securitization of real estate debt and debt securities Dedicated team of 12 professionals bolstered by 35 additional professionals at Resource Real Estate Solid origination team that focuses on transitional real estate loans. By having our own origination team, we maximize our ability to control the assets and monitor credit quality Management team has worked together for over 10 years; we still have the same team intact as before the crisis, and it is experienced in investing in a broad range of economic conditions Objective is to generate mid-teen returns (14-17%) on equity and grow Book Value. RSO has generated AFFO/BV returns of approximately 17% over the last two years
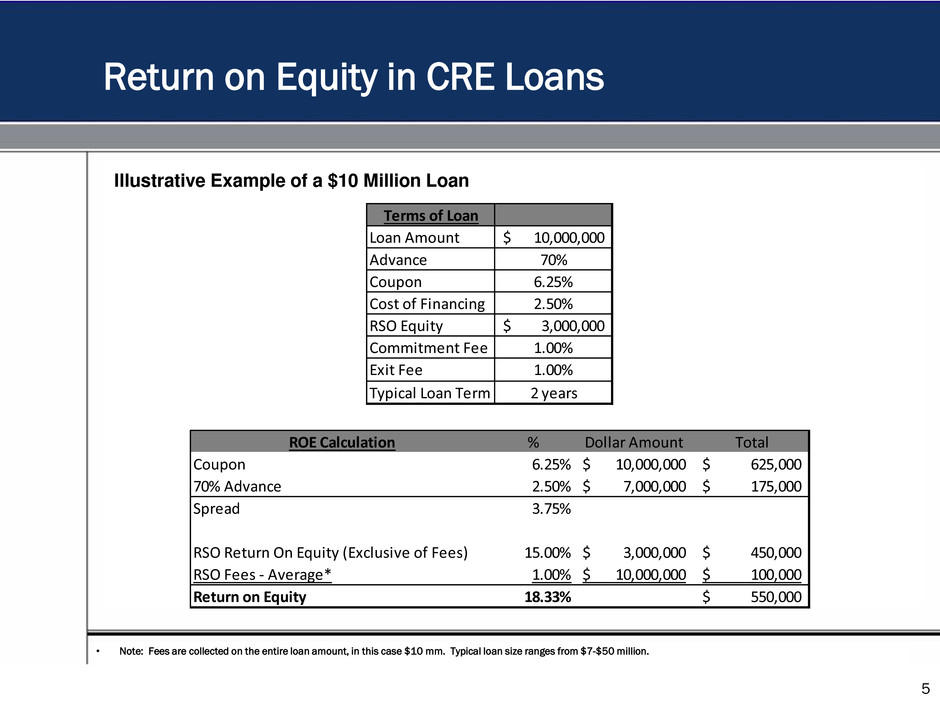
Return on Equity in CRE Loans 5 Illustrative Example of a $10 Million Loan • Note: Fees are collected on the entire loan amount, in this case $10 mm. Typical loan size ranges from $7-$50 million. Terms of Loan Loan Amount 10,000,000$ Advance 70% Coupon 6.25% Cost of Financing 2.50% RSO Equity 3,000,000$ Commitment Fee 1.00% Exit Fee 1.00% Typical Loan Term 2 years ROE Calculation % Dollar Amount Total Coupon 6.25% 10,000,000$ 625,000$ 70% Advance 2.50% 7,000,000$ 175,000$ Spread 3.75% RSO Return On Equity (Exclusive of Fees) 15.00% 3,000,000$ 450,000$ RSO Fees - Average* 1.00% 10,000,000$ 100,000$ Return on Equity 18.33% 550,000$
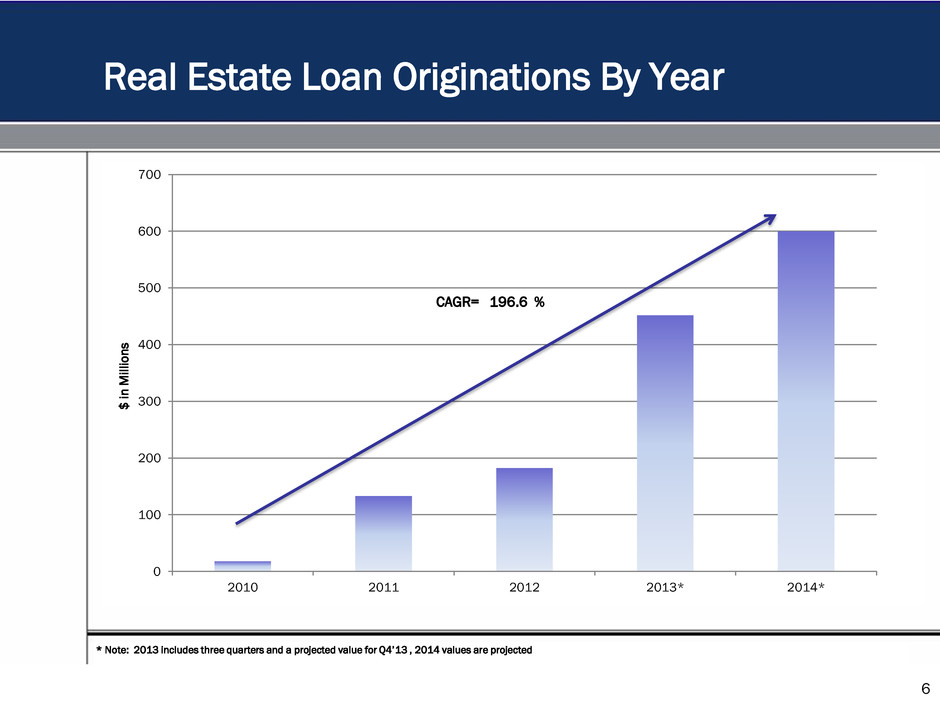
Real Estate Loan Originations By Year 6 * Note: 2013 includes three quarters and a projected value for Q4’13 , 2014 values are projected 0 100 200 300 400 500 600 700 2010 2011 2012 2013* 2014* $ i n M il lio n s CAGR= 196.6 %
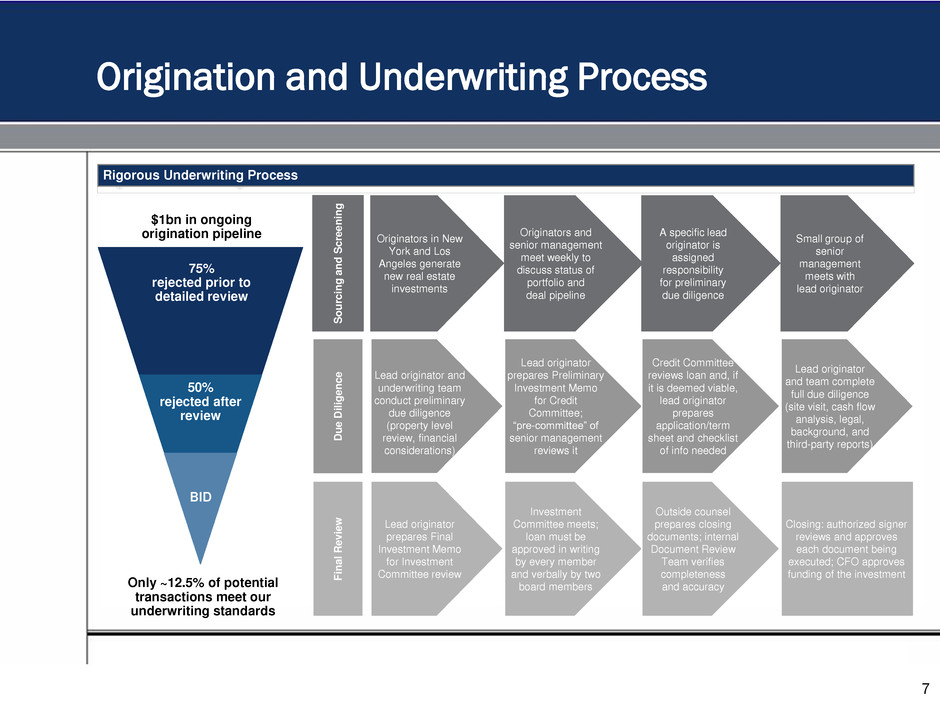
Origination and Underwriting Process 7 Rigorous Underwriting Process Originators in New York and Los Angeles generate new real estate investments S ourci n g a nd S c re e n in g D ue Di li gen c e F inal R e v ie w Originators and senior management meet weekly to discuss status of portfolio and deal pipeline A specific lead originator is assigned responsibility for preliminary due diligence Lead originator prepares Preliminary Investment Memo for Credit Committee; “pre-committee” of senior management reviews it Lead originator and underwriting team conduct preliminary due diligence (property level review, financial considerations) Small group of senior management meets with lead originator Credit Committee reviews loan and, if it is deemed viable, lead originator prepares application/term sheet and checklist of info needed Lead originator and team complete full due diligence (site visit, cash flow analysis, legal, background, and third-party reports) Investment Committee meets; loan must be approved in writing by every member and verbally by two board members Lead originator prepares Final Investment Memo for Investment Committee review Outside counsel prepares closing documents; internal Document Review Team verifies completeness and accuracy Closing: authorized signer reviews and approves each document being executed; CFO approves funding of the investment 75% rejected prior to detailed review 50% rejected after review $1bn in ongoing origination pipeline BID Only ~12.5% of potential transactions meet our underwriting standards
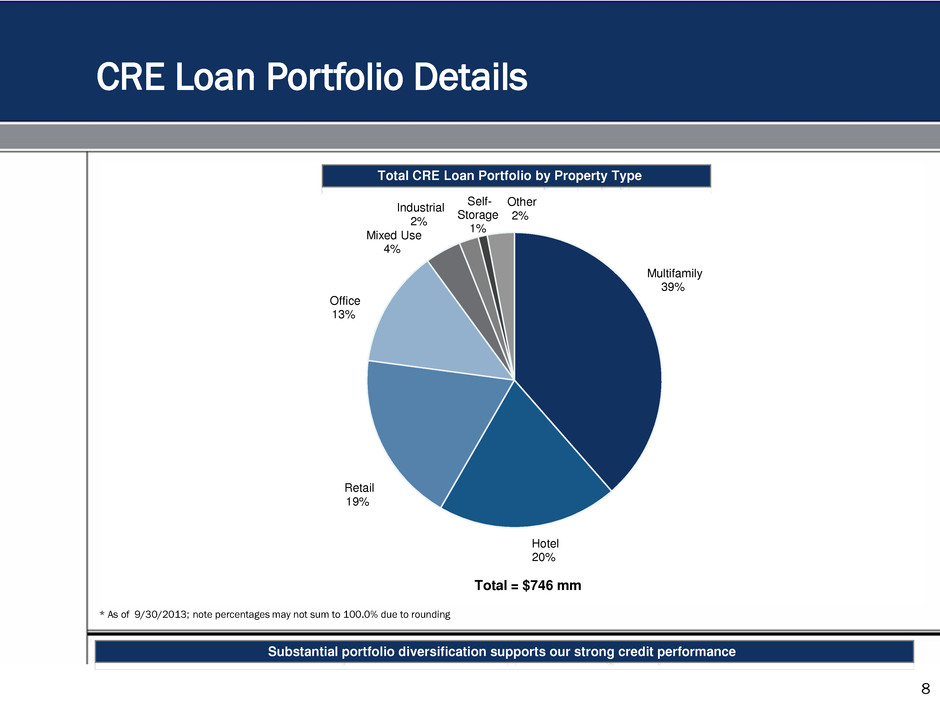
Multifamily 39% Hotel 20% Retail 19% Office 13% Mixed Use 4% Industrial 2% Self- Storage 1% Other 2% CRE Loan Portfolio Details 8 * As of 9/30/2013; note percentages may not sum to 100.0% due to rounding Substantial portfolio diversification supports our strong credit performance Total CRE Loan Portfolio by Property Type Total = $746 mm
9 The term financing facilities are being utilized as we aggregate collateral and make plans to access the securitized financing markets to optimally match fund our assets Loans are currently financed on a $250 million term financing facility with Wells Fargo Bank and a $200 million term financing facility with Deutsche Bank Returning to the securitization market in 2013 allows RSO’s assets to be match term- funded with no recourse Securitization also increases the Company’s ability to efficiently lever RSO’s real estate portfolio Securitization frees up capacity on the term financing facilities allowing us to continue to expand our loan originations CRE Loan Financing
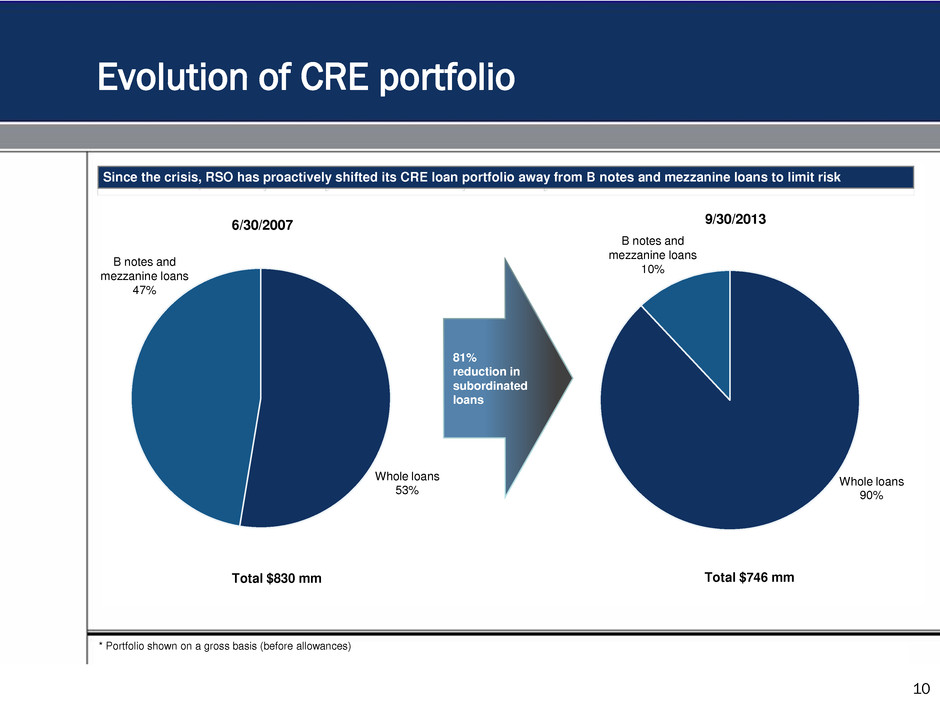
Whole loans 53% B notes and mezzanine loans 47% Whole loans 90% B notes and mezzanine loans 10% Evolution of CRE portfolio 10 6/30/2007 9/30/2013 81% reduction in subordinated loans * Portfolio shown on a gross basis (before allowances) Since the crisis, RSO has proactively shifted its CRE loan portfolio away from B notes and mezzanine loans to limit risk Total $830 mm Total $746 mm
CMBS Activities 11 RSO has a dedicated CMBS team that manages a portfolio of approximately $330 million • CMBS AAA bonds are financed on a $100 million term facility with Wells Fargo • CMBS bonds are used as cash substitute and opportunistic purchases • The duration of the majority of the CMBS portfolio is short, limiting interest rate risk • The portfolio is diverse with over 90 different positions The objective of the CMBS program is: • To utilize cash to provide attractive short term investments • To enhance yields with the use of prudent leverage • To choose investments with no risk of principal loss
Additional CRE Activities 12 RSO also has an equity portfolio which currently consists of two wholly-owned and one JV owned multifamily properties comprised of 1,154 units, a 179 room luxury hotel and spa, and one 30,000 square foot office building RSO, along with an institutional partner, also owns a portfolio of 8 distressed multifamily properties and non-performing loans acquired at substantial discounts representing a total current investment of $57.4 million • RSO receives 25% of the joint venture’s gains and has realized returns from asset resolutions to date RSO will continue to invest in both value-add and distressed real estate transactions that provide opportunities for significant value creation and capital appreciation
Leveraged/Middle Market Loans & Commercial Finance 13
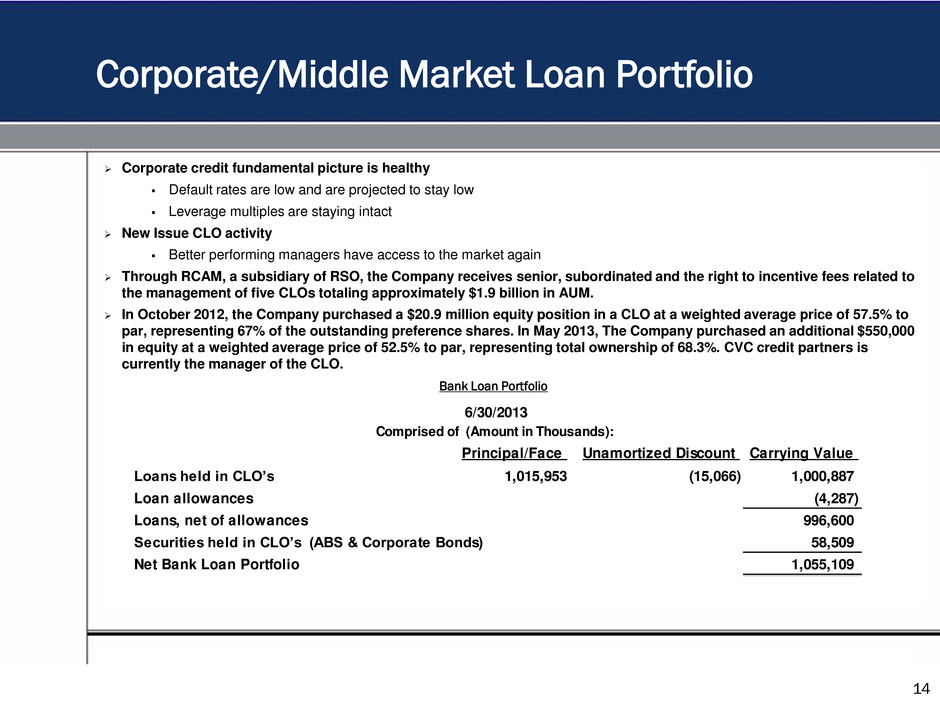
14 Corporate credit fundamental picture is healthy Default rates are low and are projected to stay low Leverage multiples are staying intact New Issue CLO activity Better performing managers have access to the market again Through RCAM, a subsidiary of RSO, the Company receives senior, subordinated and the right to incentive fees related to the management of five CLOs totaling approximately $1.9 billion in AUM. In October 2012, the Company purchased a $20.9 million equity position in a CLO at a weighted average price of 57.5% to par, representing 67% of the outstanding preference shares. In May 2013, The Company purchased an additional $550,000 in equity at a weighted average price of 52.5% to par, representing total ownership of 68.3%. CVC credit partners is currently the manager of the CLO. Corporate/Middle Market Loan Portfolio Bank Loan Portfolio Principal/Face Unamortized Discount Carrying Value Loans held in CLO’s 1,015,953 (15,066) 1,000,887 Loan allowances (4,287) Loans, net of allowances 996,600 Securities held in CLO’s (ABS & Corporate Bonds) 58,509 Net Bank Loan Portfolio 1,055,109 6/30/2013 Comprised of (Amount in Thousands):
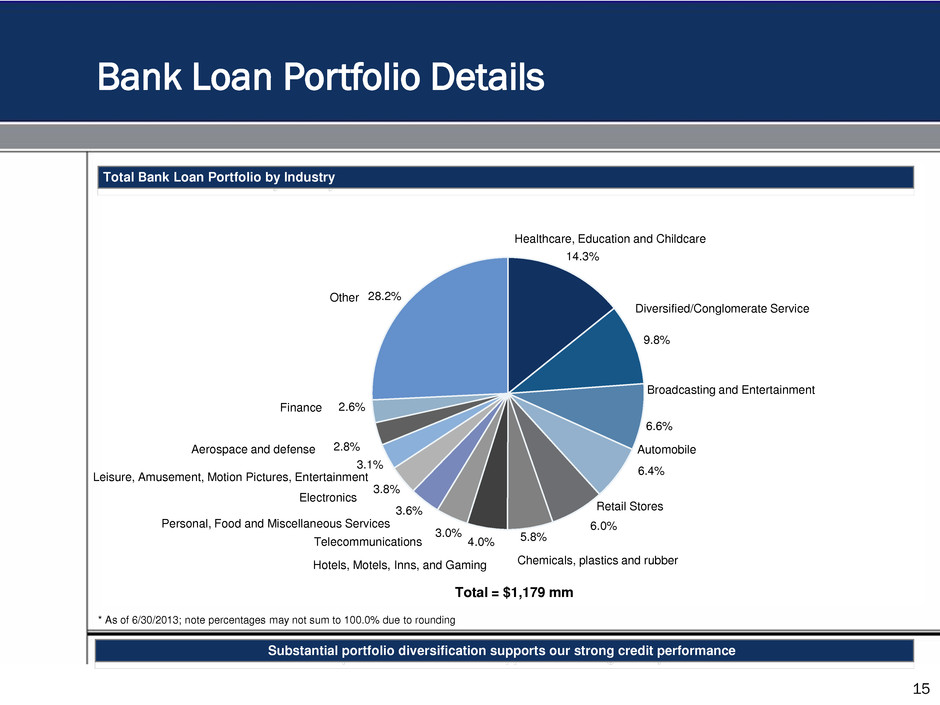
14.3% 9.8% 6.6% 6.4% 6.0% 5.8% 4.0% 3.0% 3.6% 3.8% 3.1% 2.8% 2.6% 28.2% Chemicals, plastics and rubber Total = $1,179 mm Bank Loan Portfolio Details 15 * As of 6/30/2013; note percentages may not sum to 100.0% due to rounding Substantial portfolio diversification supports our strong credit performance Total Bank Loan Portfolio by Industry Healthcare, Education and Childcare Diversified/Conglomerate Service Broadcasting and Entertainment Automobile Retail Stores Electronics Hotels, Motels, Inns, and Gaming Telecommunications Personal, Food and Miscellaneous Services Aerospace and defense Leisure, Amusement, Motion Pictures, Entertainment Finance Other
Company Summary 16
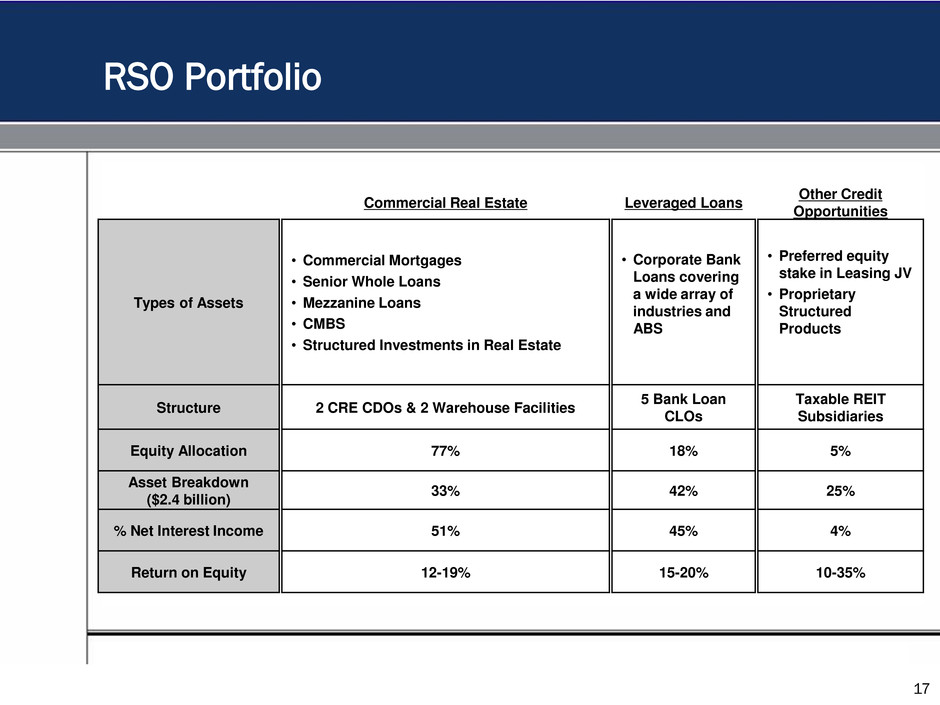
RSO Portfolio Commercial Real Estate Leveraged Loans Other Credit Opportunities Types of Assets • Commercial Mortgages • Senior Whole Loans • Mezzanine Loans • CMBS • Structured Investments in Real Estate • Corporate Bank Loans covering a wide array of industries and ABS • Preferred equity stake in Leasing JV • Proprietary Structured Products Structure 2 CRE CDOs & 2 Warehouse Facilities 5 Bank Loan CLOs Taxable REIT Subsidiaries Equity Allocation 77% 18% 5% Asset Breakdown ($2.4 billion) 33% 42% 25% % Net Interest Income 51% 45% 4% Return on Equity 12-19% 15-20% 10-35% 17
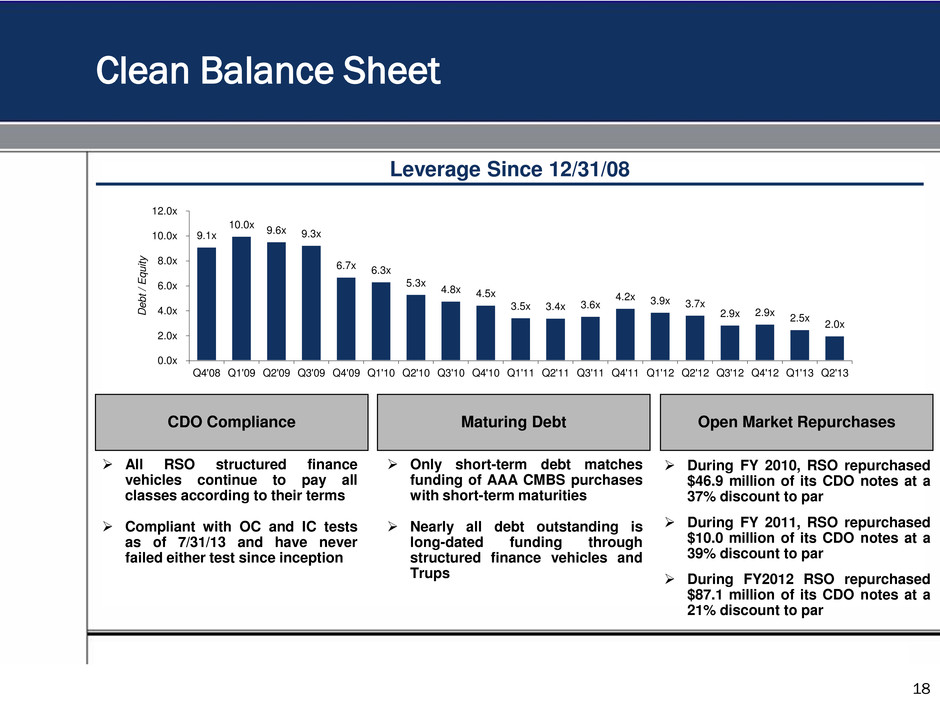
18 Clean Balance Sheet Leverage Since 12/31/08 During FY 2010, RSO repurchased $46.9 million of its CDO notes at a 37% discount to par During FY 2011, RSO repurchased $10.0 million of its CDO notes at a 39% discount to par During FY2012 RSO repurchased $87.1 million of its CDO notes at a 21% discount to par CDO Compliance Maturing Debt Open Market Repurchases All RSO structured finance vehicles continue to pay all classes according to their terms Compliant with OC and IC tests as of 7/31/13 and have never failed either test since inception Only short-term debt matches funding of AAA CMBS purchases with short-term maturities Nearly all debt outstanding is long-dated funding through structured finance vehicles and Trups 9.1x 10.0x 9.6x 9.3x 6.7x 6.3x 5.3x 4.8x 4.5x 3.5x 3.4x 3.6x 4.2x 3.9x 3.7x 2.9x 2.9x 2.5x 2.0x 0.0x 2.0x 4.0x 6.0x 8.0x 10.0x 12.0x Q4'08 Q1'09 Q2'09 Q3'09 Q4'09 Q1'10 Q2'10 Q3'10 Q4'10 Q1'11 Q2'11 Q3'11 Q4'11 Q1'12 Q2'12 Q3'12 Q4'12 Q1'13 Q2'13 D e b t / E q u it y
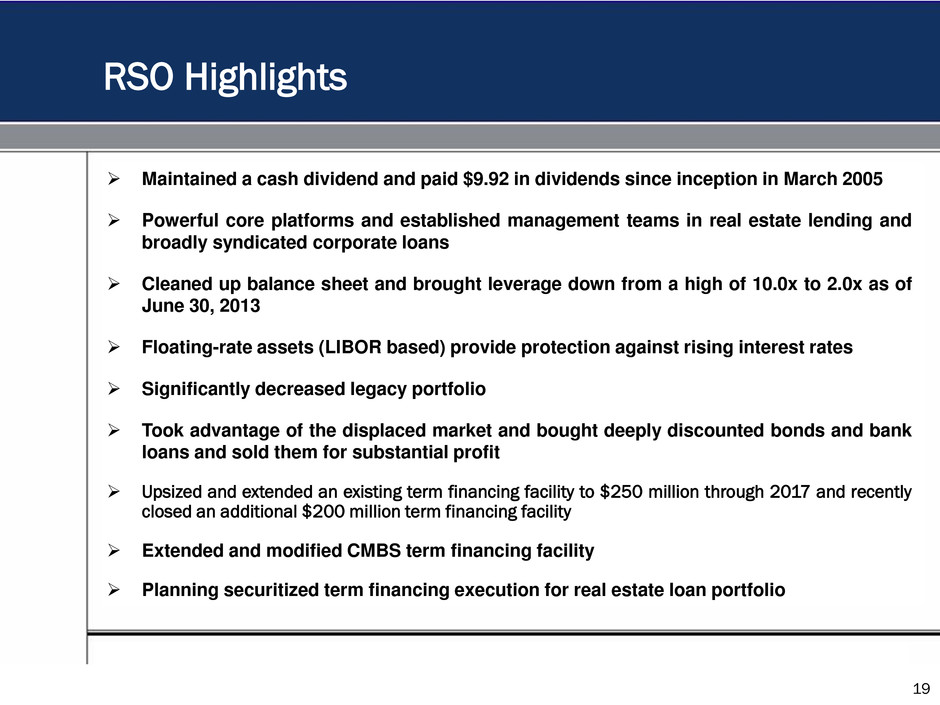
Maintained a cash dividend and paid $9.92 in dividends since inception in March 2005 Powerful core platforms and established management teams in real estate lending and broadly syndicated corporate loans Cleaned up balance sheet and brought leverage down from a high of 10.0x to 2.0x as of June 30, 2013 Floating-rate assets (LIBOR based) provide protection against rising interest rates Significantly decreased legacy portfolio Took advantage of the displaced market and bought deeply discounted bonds and bank loans and sold them for substantial profit Upsized and extended an existing term financing facility to $250 million through 2017 and recently closed an additional $200 million term financing facility Extended and modified CMBS term financing facility Planning securitized term financing execution for real estate loan portfolio RSO Highlights 19
