Attached files
| file | filename |
|---|---|
| 8-K - 8-K - Dime Community Bancshares, Inc. /NY/ | a13-21635_18k.htm |
| EX-99.1 - EX-99.1 - Dime Community Bancshares, Inc. /NY/ | a13-21635_1ex99d1.htm |
|
|
2 Bridge Bancorp, Inc. (“Bridge Bancorp”) has filed a registration statement (including a prospectus and a related prospectus supplement) with the SEC for the offering to which this communication relates. Before you invest, you should read the prospectus and the prospectus supplement in that registration statement and other documents Bridge Bancorp has filed with the SEC for more complete information about Bridge Bancorp and this offering. You may get these documents for free by visiting EDGAR on the SEC web site at www.sec.gov. Alternatively, Bridge Bancorp or the underwriters participating in the offering will arrange to send you the prospectus and the prospectus supplement if you request it by calling toll-free 1-877-822-4089. This presentation contains forward-looking information for Bridge Bancorp, Inc. Such information constitutes forward-looking statements (within the meaning of the Private Securities Litigation Reform Act of 1995) which involve significant risks and uncertainties. Please refer to the discussion of the risk factors set forth in the prospectus supplement and the documents incorporated by reference therein for those factors that may cause actual results to differ materially from the results discussed in these forward-looking statements. Forward Looking Statements and Risk Factors |
|
|
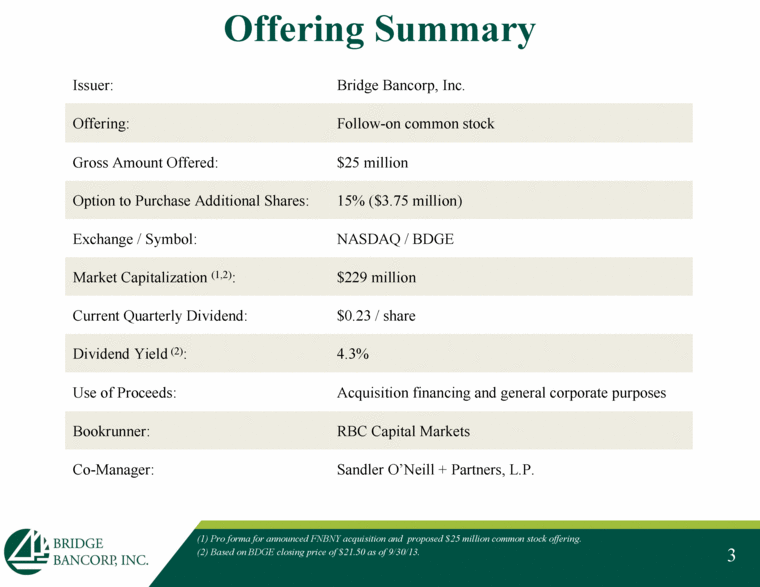
3 Offering Summary Issuer: Bridge Bancorp, Inc. Offering: Follow-on common stock Gross Amount Offered: $25 million Option to Purchase Additional Shares: 15% ($3.75 million) Exchange / Symbol: NASDAQ / BDGE Market Capitalization (1,2): $229 million Current Quarterly Dividend: $0.23 / share Dividend Yield (2): 4.3% Use of Proceeds: Acquisition financing and general corporate purposes Bookrunner: RBC Capital Markets Co-Manager: Sandler O’Neill + Partners, L.P. (1) Pro forma for announced FNBNY acquisition and proposed $25 million common stock offering. (2) Based on BDGE closing price of $21.50 as of 9/30/13. |
|
|
Company Overview |
|
|
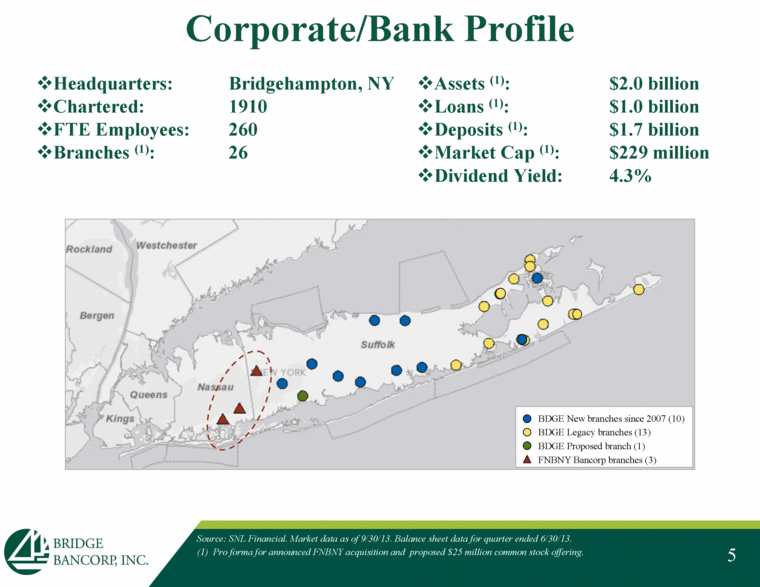
5 Headquarters: Bridgehampton, NY Chartered: 1910 FTE Employees: 260 Branches (1): 26 Assets (1): $2.0 billion Loans (1): $1.0 billion Deposits (1): $1.7 billion Market Cap (1): $229 million Dividend Yield: 4.3% Corporate/Bank Profile Source: SNL Financial. Market data as of 9/30/13. Balance sheet data for quarter ended 6/30/13. (1) Pro forma for announced FNBNY acquisition and proposed $25 million common stock offering. BDGE New branches since 2007 (10) BDGE Legacy branches (13) BDGE Proposed branch (1) FNBNY Bancorp branches (3) |
|
|
6 Management Profile Executive Team Kevin M. O’Connor, President and CEO Howard H. Nolan, Chief Financial Officer James J. Manseau, Chief Retail Banking Officer Kevin L. Santacroce, Chief Lending Officer John M. McCaffery, Treasurer All with Over 20 years of Financial Services Experience Hired Over 30 Experienced Professionals in the Past 3 Years Revenue Producers, Compliance and Operational Positions |
|
|
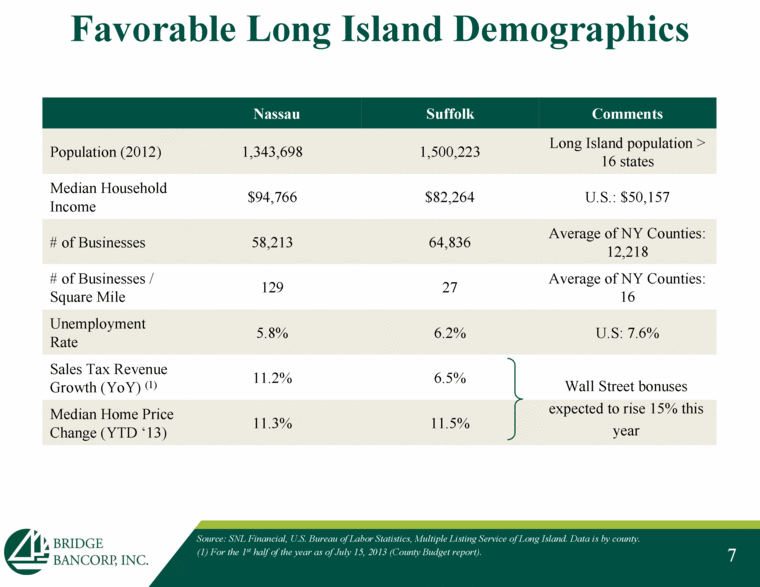
7 Favorable Long Island Demographics Nassau Suffolk Comments Population (2012) 1,343,698 1,500,223 Long Island population > 16 states Median Household Income $94,766 $82,264 U.S.: $50,157 # of Businesses 58,213 64,836 Average of NY Counties: 12,218 # of Businesses / Square Mile 129 27 Average of NY Counties: 16 Unemployment Rate 5.8% 6.2% U.S: 7.6% Sales Tax Revenue Growth (YoY) (1) 11.2% 6.5% Median Home Price Change (YTD ‘13) 11.3% 11.5% Source: SNL Financial, U.S. Bureau of Labor Statistics, Multiple Listing Service of Long Island. Data is by county. (1) For the 1st half of the year as of July 15, 2013 (County Budget report). Wall Street bonuses expected to rise 15% this year |
|
|
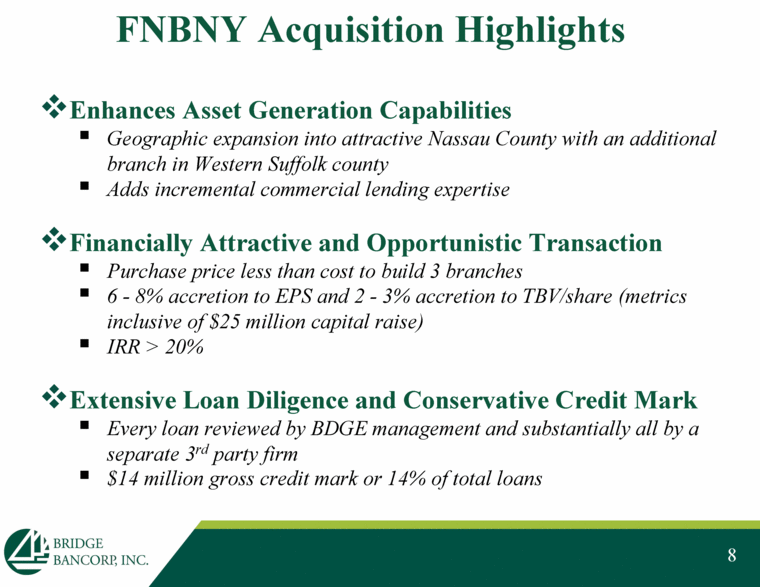
8 FNBNY Acquisition Highlights Enhances Asset Generation Capabilities Geographic expansion into attractive Nassau County with an additional branch in Western Suffolk county Adds incremental commercial lending expertise Financially Attractive and Opportunistic Transaction Purchase price less than cost to build 3 branches 6 - 8% accretion to EPS and 2 - 3% accretion to TBV/share (metrics inclusive of $25 million capital raise) IRR > 20% Extensive Loan Diligence and Conservative Credit Mark Every loan reviewed by BDGE management and substantially all by a separate 3rd party firm $14 million gross credit mark or 14% of total loans |
|
|
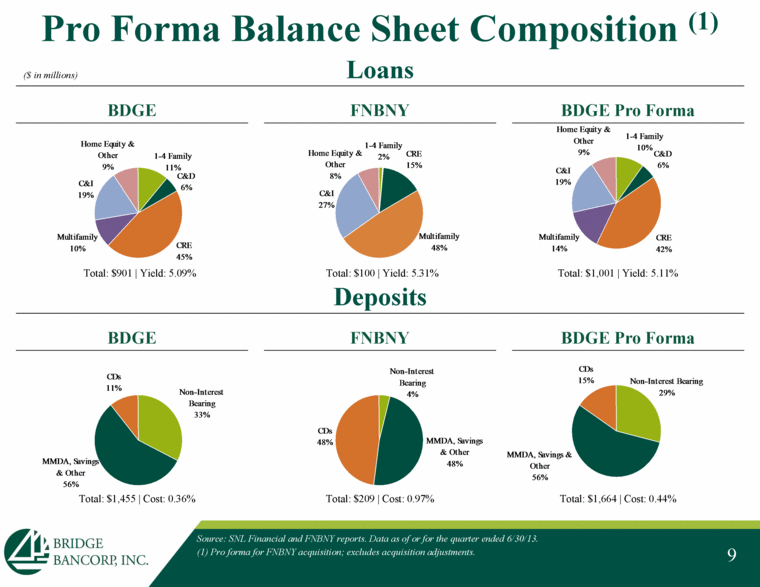
9 Pro Forma Balance Sheet Composition (1) Loans BDGE FNBNY BDGE Pro Forma Deposits BDGE FNBNY BDGE Pro Forma Total: $901 | Yield: 5.09% Total: $100 | Yield: 5.31% Total: $1,001 | Yield: 5.11% Total: $1,455 | Cost: 0.36% Total: $209 | Cost: 0.97% Total: $1,664 | Cost: 0.44% Source: SNL Financial and FNBNY reports. Data as of or for the quarter ended 6/30/13. (1) Pro forma for FNBNY acquisition; excludes acquisition adjustments. ($ in millions) |
|
|
Investment Highlights |
|
|
11 Drivers of Shareholder Value Strong & Consistent Financial Performance Outstanding Asset Quality and Balance Sheet Flexibility Superior Franchise Growth with Compelling Opportunities Attractive Dividend Yield Significant Tangible Book Value Growth Clear Understanding of Risks, Opportunities and Challenges |
|
|
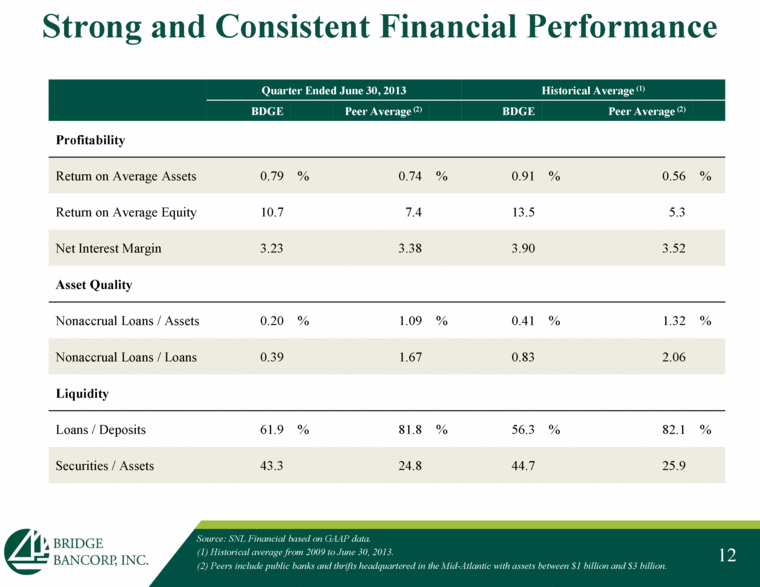
12 Strong and Consistent Financial Performance Source: SNL Financial based on GAAP data. (1) Historical average from 2009 to June 30, 2013. (2) Peers include public banks and thrifts headquartered in the Mid-Atlantic with assets between $1 billion and $3 billion. Quarter Ended June 30, 2013 Historical Average (1) BDGE Peer Average (2) BDGE Peer Average (2) Profitability Return on Average Assets 0.79 % 0.74 % 0.91 % 0.56 % Return on Average Equity 10.7 7.4 13.5 5.3 Net Interest Margin 3.23 3.38 3.90 3.52 Asset Quality Nonaccrual Loans / Assets 0.20 % 1.09 % 0.41 % 1.32 % Nonaccrual Loans / Loans 0.39 1.67 0.83 2.06 Liquidity Loans / Deposits 61.9 % 81.8 % 56.3 % 82.1 % Securities / Assets 43.3 24.8 44.7 25.9 |
|
|
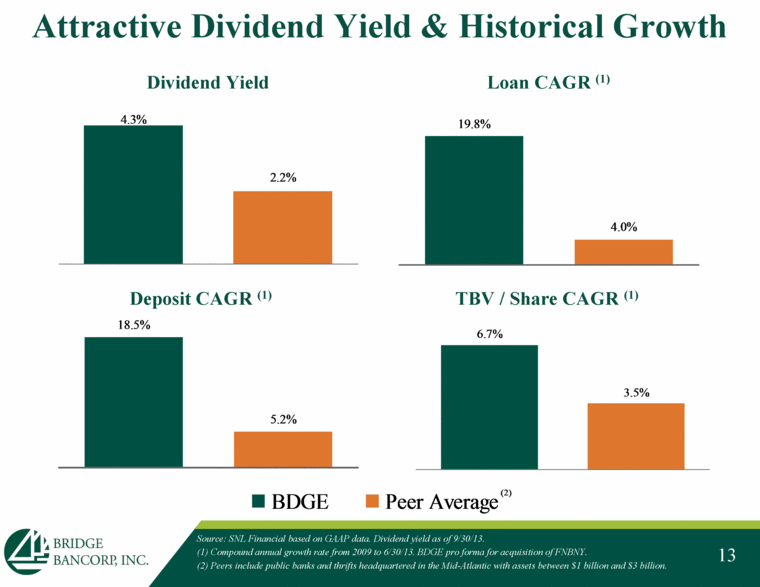
13 Attractive Dividend Yield & Historical Growth Source: SNL Financial based on GAAP data. Dividend yield as of 9/30/13. (1) Compound annual growth rate from 2009 to 6/30/13. BDGE pro forma for acquisition of FNBNY. (2) Peers include public banks and thrifts headquartered in the Mid-Atlantic with assets between $1 billion and $3 billion. Dividend Yield Loan CAGR (1) Deposit CAGR (1) TBV / Share CAGR (1) |
|
|
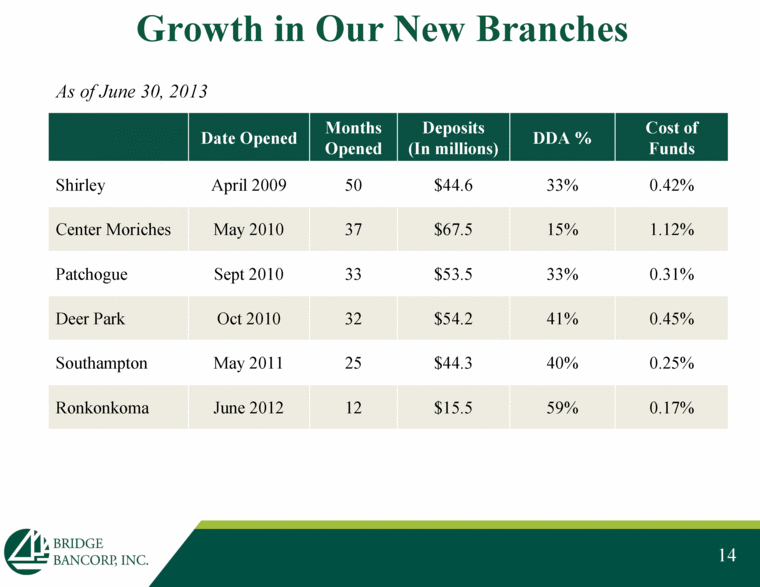
14 Growth in Our New Branches Date Opened Months Opened Deposits (In millions) DDA % Cost of Funds Shirley April 2009 50 $44.6 33% 0.42% Center Moriches May 2010 37 $67.5 15% 1.12% Patchogue Sept 2010 33 $53.5 33% 0.31% Deer Park Oct 2010 32 $54.2 41% 0.45% Southampton May 2011 25 $44.3 40% 0.25% Ronkonkoma June 2012 12 $15.5 59% 0.17% As of June 30, 2013 |
|
|
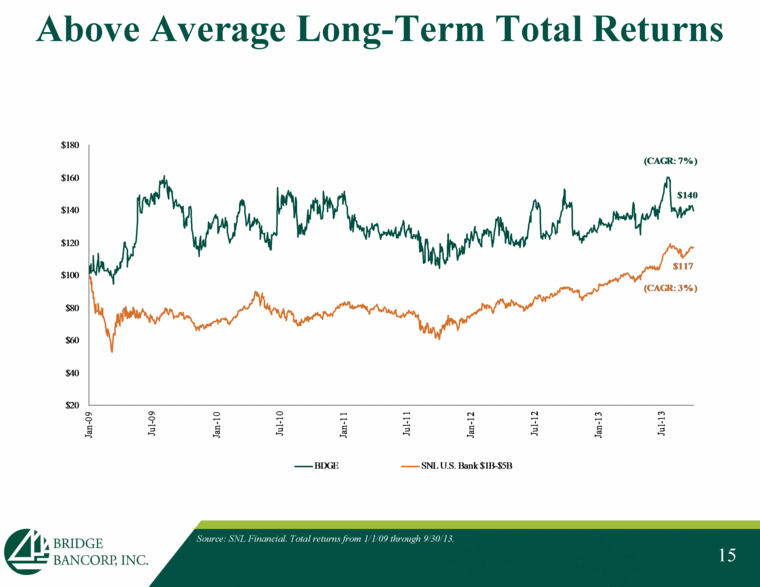
15 Above Average Long-Term Total Returns Source: SNL Financial. Total returns from 1/1/09 through 9/30/13. |
|
|
|
|
|
16 Drivers of Franchise Growth Opportunities from Market Dislocation/Mergers Local Competitors Acquired by Large Out of State Banks Enhanced Asset Generating Capabilities Continued Geographic Expansion into Attractive, Loan Rich Markets (Nassau & Western Suffolk Counties) Hired Seasoned Banking Professionals/Lenders Deployment of excess liquidity Diversification of Portfolio Products, Industries and Geography Maintain Our Strong Foundation and Culture |
|
|
Acquisition of FNBNY |
|
|
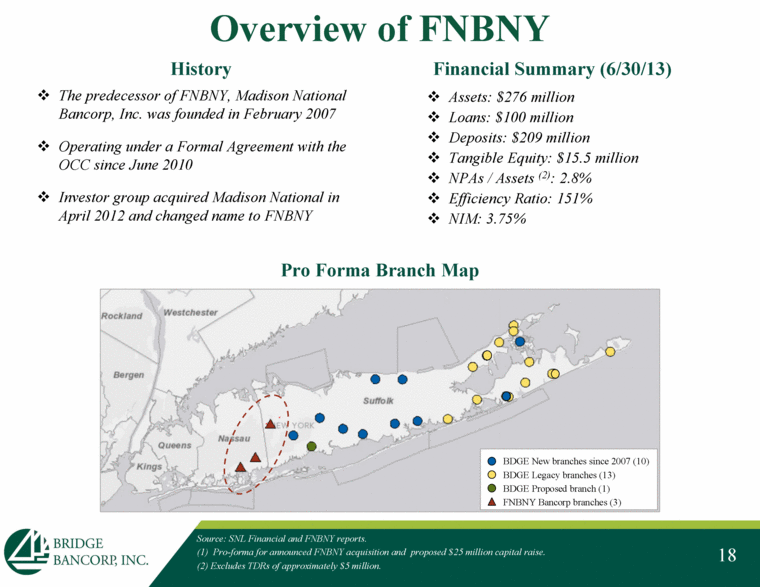
18 Overview of FNBNY Source: SNL Financial and FNBNY reports. (1) Pro-forma for announced FNBNY acquisition and proposed $25 million capital raise. (2) Excludes TDRs of approximately $5 million. BDGE New branches since 2007 (10) BDGE Legacy branches (13) BDGE Proposed branch (1) FNBNY Bancorp branches (3) History Financial Summary (6/30/13) Pro Forma Branch Map The predecessor of FNBNY, Madison National Bancorp, Inc. was founded in February 2007 Operating under a Formal Agreement with the OCC since June 2010 Investor group acquired Madison National in April 2012 and changed name to FNBNY Assets: $276 million Loans: $100 million Deposits: $209 million Tangible Equity: $15.5 million NPAs / Assets (2): 2.8% Efficiency Ratio: 151% NIM: 3.75% |
|
|
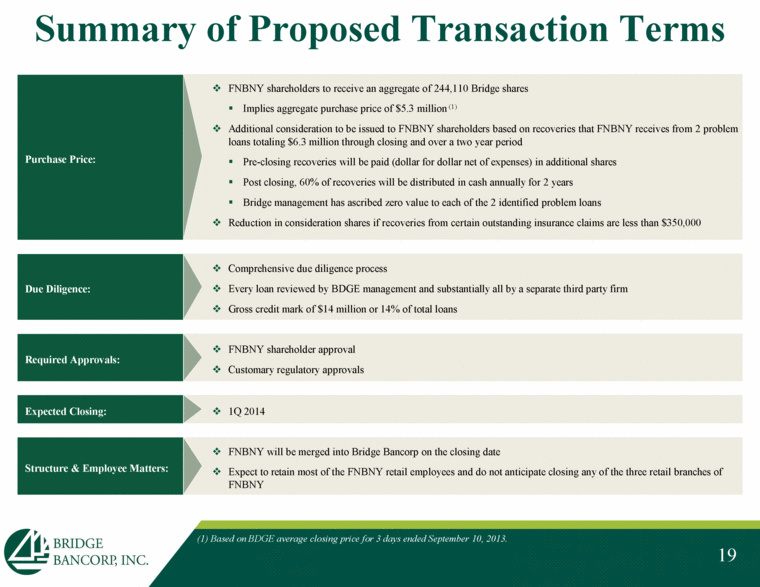
19 Summary of Proposed Transaction Terms FNBNY shareholders to receive an aggregate of 244,110 Bridge shares Implies aggregate purchase price of $5.3 million (1) Additional consideration to be issued to FNBNY shareholders based on recoveries that FNBNY receives from 2 problem loans totaling $6.3 million through closing and over a two year period Pre-closing recoveries will be paid (dollar for dollar net of expenses) in additional shares Post closing, 60% of recoveries will be distributed in cash annually for 2 years Bridge management has ascribed zero value to each of the 2 identified problem loans Reduction in consideration shares if recoveries from certain outstanding insurance claims are less than $350,000 Purchase Price: 1Q 2014 Expected Closing: FNBNY shareholder approval Customary regulatory approvals Required Approvals: Comprehensive due diligence process Every loan reviewed by BDGE management and substantially all by a separate third party firm Gross credit mark of $14 million or 14% of total loans Due Diligence: (1) Based on BDGE average closing price for 3 days ended September 10, 2013. FNBNY will be merged into Bridge Bancorp on the closing date Expect to retain most of the FNBNY retail employees and do not anticipate closing any of the three retail branches of FNBNY Structure & Employee Matters: |
|
|
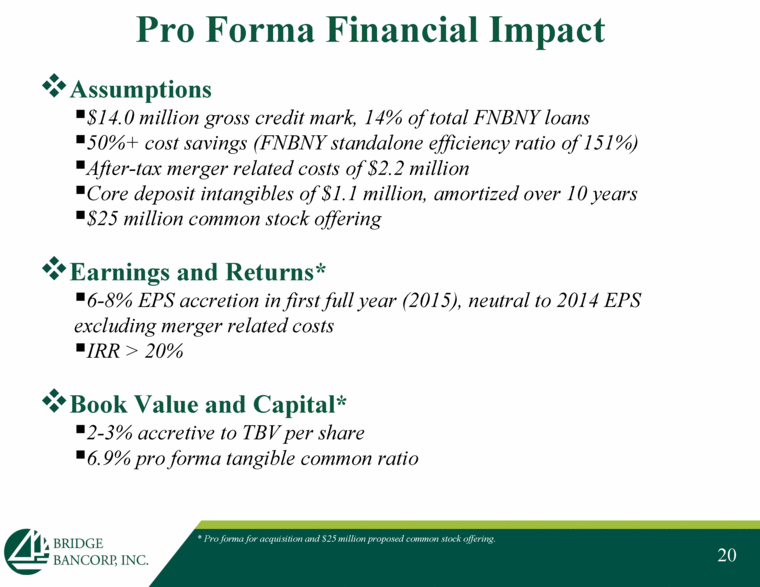
20 Pro Forma Financial Impact Assumptions $14.0 million gross credit mark, 14% of total FNBNY loans 50%+ cost savings (FNBNY standalone efficiency ratio of 151%) After-tax merger related costs of $2.2 million Core deposit intangibles of $1.1 million, amortized over 10 years $25 million common stock offering Earnings and Returns* 6-8% EPS accretion in first full year (2015), neutral to 2014 EPS excluding merger related costs IRR > 20% Book Value and Capital* 2-3% accretive to TBV per share 6.9% pro forma tangible common ratio * Pro forma for acquisition and $25 million proposed common stock offering. |
|
|
Appendix |
|
|
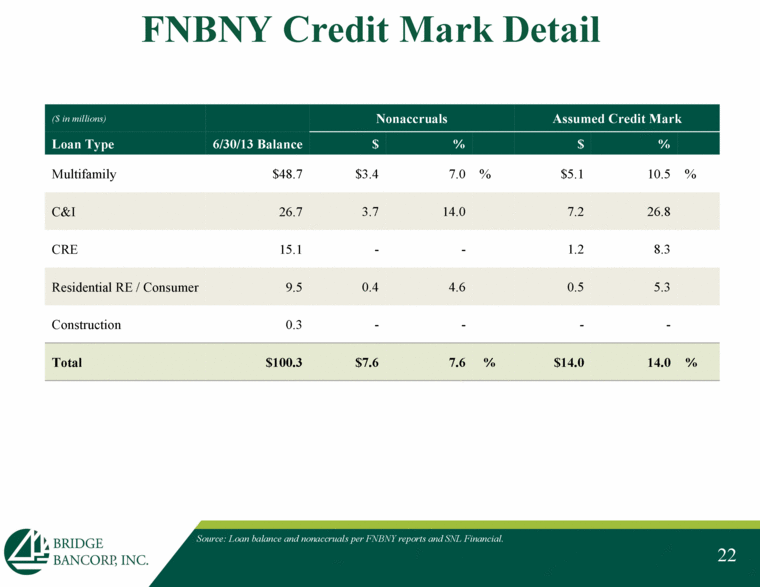
22 FNBNY Credit Mark Detail ($ in millions) Nonaccruals Assumed Credit Mark Loan Type 6/30/13 Balance $ % $ % Multifamily $48.7 $3.4 7.0 % $5.1 10.5 % C&I 26.7 3.7 14.0 7.2 26.8 CRE 15.1 - - 1.2 8.3 Residential RE / Consumer 9.5 0.4 4.6 0.5 5.3 Construction 0.3 - - - - Total $100.3 $7.6 7.6 % $14.0 14.0 % Source: Loan balance and nonaccruals per FNBNY reports and SNL Financial. |

