Attached files
| file | filename |
|---|---|
| 8-K - 8-K - Atkore International Holdings Inc. | a8-kdeutschebankpresentati.htm |
1 Deutsche Bank Leveraged Finance Conference John Williamson, President and CEO Jim Mallak, Chief Financial Officer Chuck Cohrs, Treasurer October 1, 2013
2 Disclaimer This presentation and its contents are confidential, proprietary information and may not be reproduced or otherwise disseminated in whole or in part without the Company’s prior written consent. This presentation contains statements that are not historical facts. Such statements are or may constitute forward-looking statements. These statements are subject to a number of risks and uncertainties that are beyond the Company’s control. The words “anticipate,” “believe,” “could,” “estimate,” “expect,” “intend,” “may,” “might,” “plan,” “potential,” “predict,” “project,” “should,” “will,” “would,” or the negative of these terms, and similar words and phrases are intended to identify forward-looking statements, but are not the exclusive means of identifying such statements. Statements regarding the implementation of operating and financing strategies, capital expenditure plans, direction of future operations and factors or trends affecting financial condition, liquidity or results of operations are examples of forward-looking statements. There is no guarantee that the expected events or results will actually occur. Any forward-looking statement speaks only as of the date on which it is made, and the Company undertakes no obligation to update any forward-looking statement to reflect events or circumstances after the date on which it is made or to reflect the occurrence of anticipated or unanticipated events or circumstances. New factors emerge from time to time that may cause the business not to develop as the Company expects, and it is not possible for the Company to predict all such factors. Comparisons of results for current and any prior periods are not intended to express any future trends or indications of future performance and should be viewed only as historical data. Additional information regarding these statements is contained under the heading “Risk Factors” set forth in the Atkore International Holdings Inc. 10-K for the fiscal year ended September 28, 2012. In addition to disclosing financial results that are determined in accordance with U.S. generally accepted accounting principles (“GAAP”), we also disclose in this presentation certain “non-GAAP financial measures,” as defined under the rules of the SEC, including EBITDA, Adjusted EBITDA, Adjusted EBITDA before corporate costs and free cash flow. These financial measures are not recognized measures under GAAP and the items excluded therefrom are significant components in understanding and assessing the Company’s financial performance. These financial measures are not intended to be and should not be considered in isolation from, as a substitute for or superior to, the financial information prepared and presented in accordance with GAAP, such as net income, cash flows provided by or used in operating, investing or financing activities or other financial statement data presented in the Company’s consolidated financial statements as an indicator of financial performance or liquidity. Reconciliations of non-GAAP financial measures to net income or operating income for specified periods are set forth in this presentation. EBITDA measures are commonly used by management and investors as performance measures. Since EBITDA, Adjusted EBITDA, Adjusted EBITDA before corporate costs and free cash flow are not measures determined in accordance with GAAP and are susceptible to varying calculations, these measures, as presented, may not be comparable to other similarly titled measures of other companies.
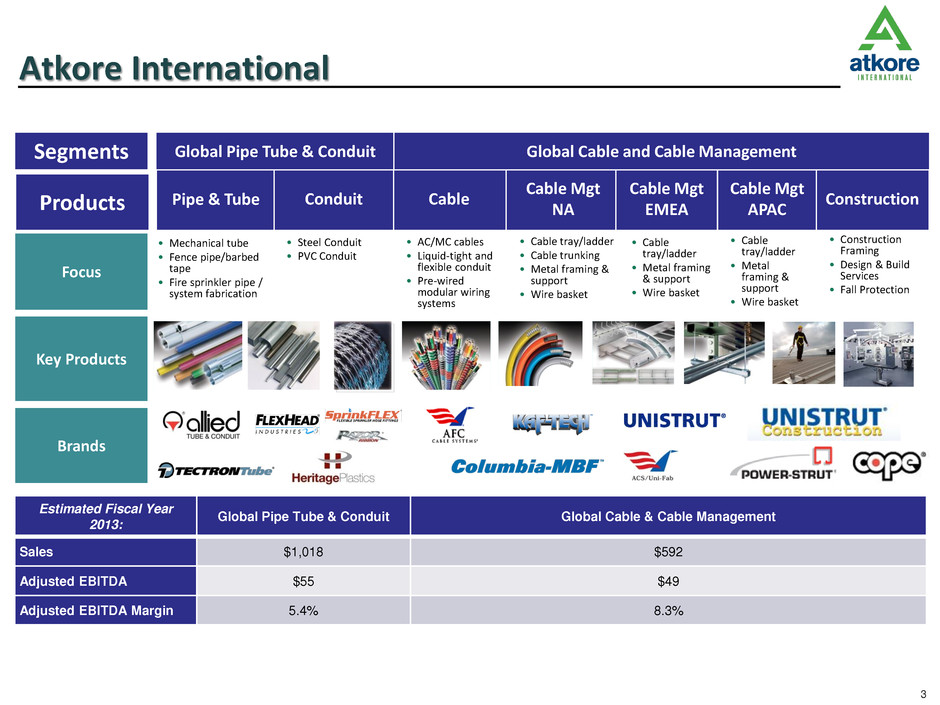
3 Focus • Mechanical tube • Fence pipe/barbed tape • Fire sprinkler pipe / system fabrication Key Products Brands Segments Pipe & Tube • AC/MC cables • Liquid-tight and flexible conduit • Pre-wired modular wiring systems • Cable tray/ladder • Cable trunking • Metal framing & support • Wire basket • Steel Conduit • PVC Conduit • Cable tray/ladder • Metal framing & support • Wire basket • Cable tray/ladder • Metal framing & support • Wire basket Construction • Construction Framing • Design & Build Services • Fall Protection Cable Mgt NA Cable Mgt EMEA Cable Mgt APAC Cable Conduit Global Pipe Tube & Conduit Global Cable and Cable Management Atkore International Estimated Fiscal Year 2013: Global Pipe Tube & Conduit Global Cable & Cable Management Sales $1,018 $592 Adjusted EBITDA $55 $49 Adjusted EBITDA Margin 5.4% 8.3% Products
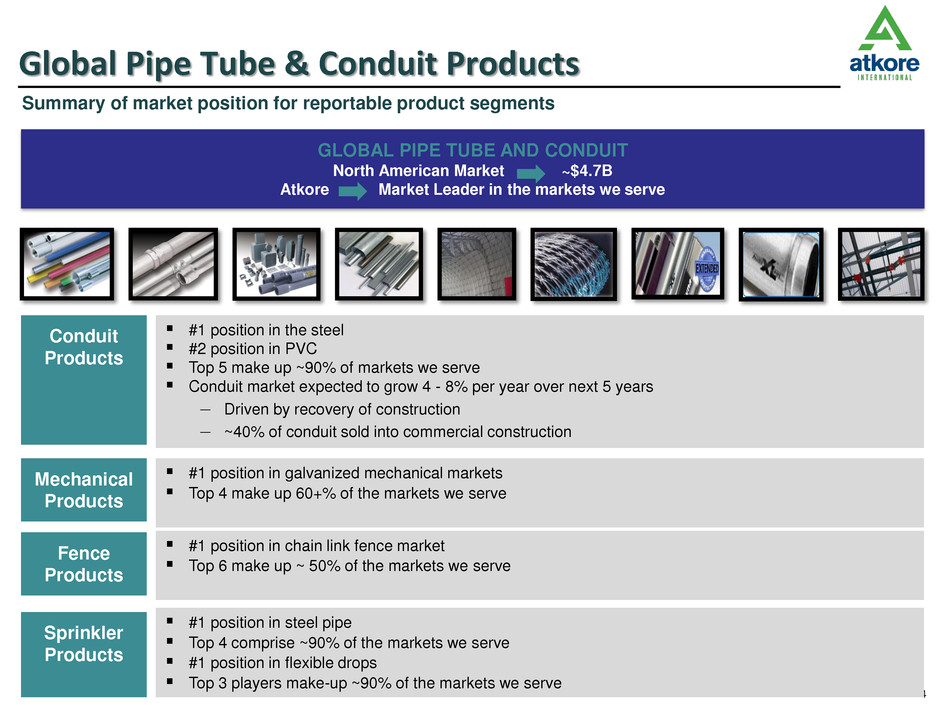
4 #1 position in steel pipe Top 4 comprise ~90% of the markets we serve #1 position in flexible drops Top 3 players make-up ~90% of the markets we serve Mechanical Products Sprinkler Products GLOBAL PIPE TUBE AND CONDUIT North American Market ~$4.7B Atkore Market Leader in the markets we serve Conduit Products #1 position in galvanized mechanical markets Top 4 make up 60+% of the markets we serve #1 position in the steel #2 position in PVC Top 5 make up ~90% of markets we serve Conduit market expected to grow 4 - 8% per year over next 5 years – Driven by recovery of construction – ~40% of conduit sold into commercial construction Fence Products #1 position in chain link fence market Top 6 make up ~ 50% of the markets we serve Global Pipe Tube & Conduit Products Summary of market position for reportable product segments
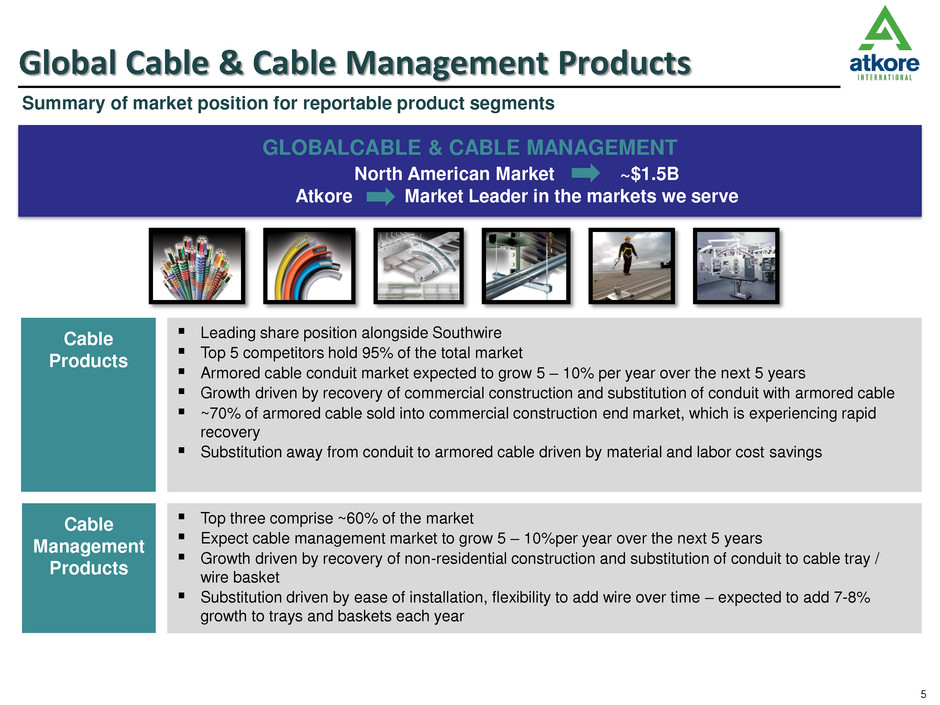
5 GLOBALCABLE & CABLE MANAGEMENT North American Market ~$1.5B Atkore Market Leader in the markets we serve Leading share position alongside Southwire Top 5 competitors hold 95% of the total market Armored cable conduit market expected to grow 5 – 10% per year over the next 5 years Growth driven by recovery of commercial construction and substitution of conduit with armored cable ~70% of armored cable sold into commercial construction end market, which is experiencing rapid recovery Substitution away from conduit to armored cable driven by material and labor cost savings Top three comprise ~60% of the market Expect cable management market to grow 5 – 10%per year over the next 5 years Growth driven by recovery of non-residential construction and substitution of conduit to cable tray / wire basket Substitution driven by ease of installation, flexibility to add wire over time – expected to add 7-8% growth to trays and baskets each year Cable Products Cable Management Products Global Cable & Cable Management Products Summary of market position for reportable product segments
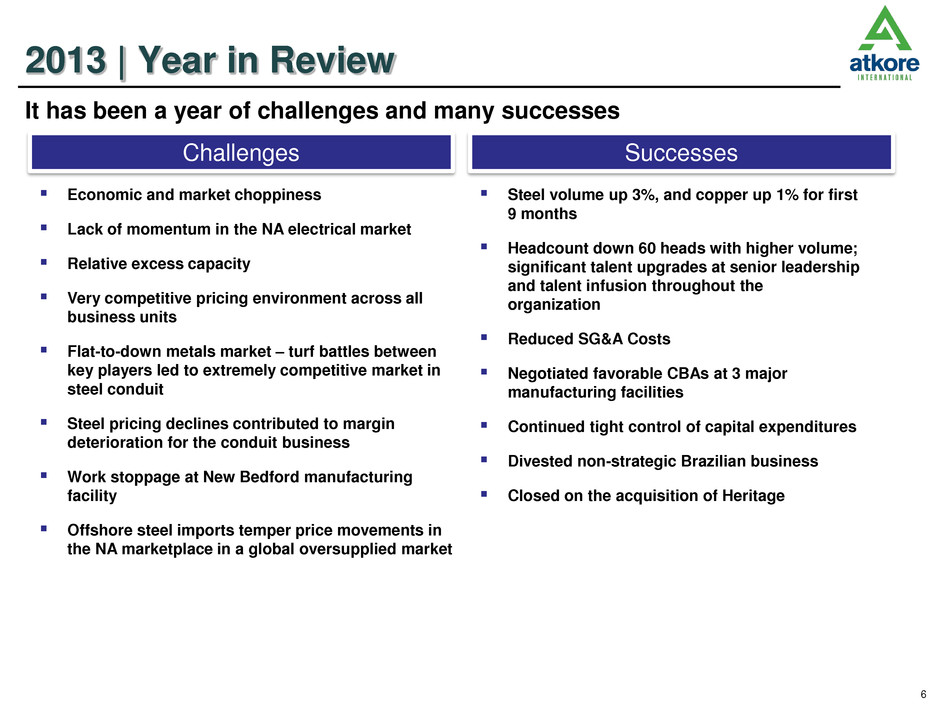
6 2013 | Year in Review Steel volume up 3%, and copper up 1% for first 9 months Headcount down 60 heads with higher volume; significant talent upgrades at senior leadership and talent infusion throughout the organization Reduced SG&A Costs Negotiated favorable CBAs at 3 major manufacturing facilities Continued tight control of capital expenditures Divested non-strategic Brazilian business Closed on the acquisition of Heritage Economic and market choppiness Lack of momentum in the NA electrical market Relative excess capacity Very competitive pricing environment across all business units Flat-to-down metals market – turf battles between key players led to extremely competitive market in steel conduit Steel pricing declines contributed to margin deterioration for the conduit business Work stoppage at New Bedford manufacturing facility Offshore steel imports temper price movements in the NA marketplace in a global oversupplied market It has been a year of challenges and many successes Challenges Successes
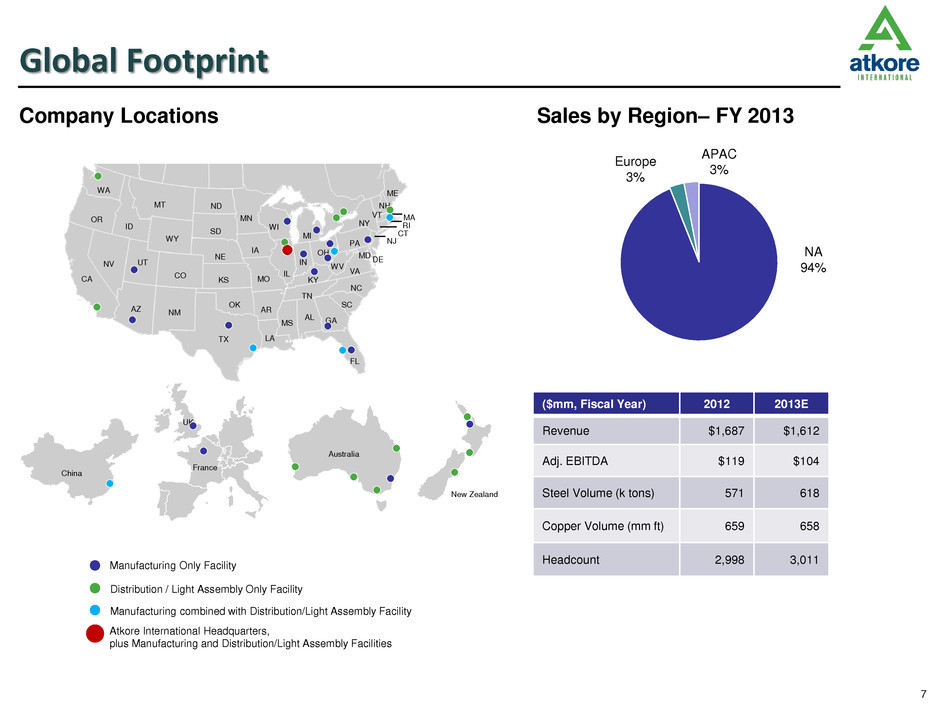
7 NA 94% Europe 3% APAC 3% Sales by Region– FY 2013 Company Locations UK France China Australia New Zealand RI NJ FL NM DE MD TX OK KS NE SD ND MT WY CO UT ID AZ NV WA CA OR KY ME NY PA MI VT NH MA CT VA WV OH IN IL NC TN SC AL MS AR LA MO IA MN WI GA Global Footprint ($mm, Fiscal Year) 2012 2013E Revenue $1,687 $1,612 Adj. EBITDA $119 $104 Steel Volume (k tons) 571 618 Copper Volume (mm ft) 659 658 Headcount 2,998 3,011 Manufacturing Only Facility Distribution / Light Assembly Only Facility Atkore International Headquarters, plus Manufacturing and Distribution/Light Assembly Facilities Manufacturing combined with Distribution/Light Assembly Facility

8 Total electrical market is $75B and our current served Raceway market is $6B Currently hold significant position in channel with unique ability to leverage. Electrical Raceway Global Pipe Tube & Conduit Global Cable & Cable Management Cope Allied AFC Unistrut Power Strut EWC KAF- TECH Electrical Agents Mech Agents Electrical Distributors/Wholesalers 4,260 Branches 1,052 Mech Dist. Plastic Pipe Conduit The benefit to our customers: Work with the raceway experts. Our raceway expertise is unmatched We steer customers to the right solution, not just the one we want to sell them Working with our distributors we can tailor the raceway solution to the jobsite, and deliver it On account of our presence in the raceway market, we have the best representation in the market, and our reps have critical mindshare with us Logistics and jobsite efficiency end up in the contractor’s pocket What’s in it for us: Allows us to differentiate our offering Allows for small premiums where we add true value to the customer Allows us to own a larger piece of the contractor’s mind, and wallet Our Electrical Raceway Mission: To provide a choice to electrical contractors – through distribution and wholesale – for a structure’s electrical raceway solution Our definition of the Electrical Raceway: The mechanical infrastructure that deploys, isolates and protects a structures electrical circuitry from curb to outlet, including support infrastructure such as strut and fittings, enclosed infrastructure such as conduit and trunking, and open infrastructure such as cable tray, ladder and basket, of any material and all associated accessories and fittings

9 Forward Looking Focus Atkore Business Units focus on: Driving operational and commercial excellence for effectiveness and productivity Analyzing and fixing our “Go to Market” Driving the Raceway value proposition that leads to a greater share of electrical distribution wallet Atkore functions enable Business Units by: Continuing the Focus on Talent Driving alignment and engagement Rebalancing the portfolio toward the Raceway Driving productivity in manufacturing, logistics and sourcing Incremental IT improvements in support of key initiatives
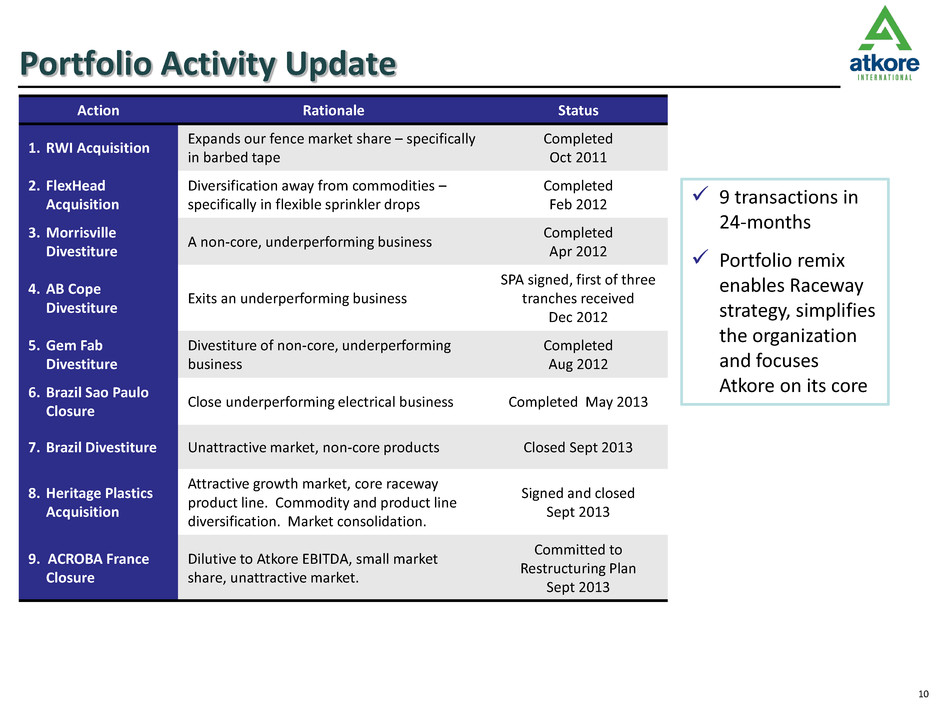
10 Portfolio Activity Update Action Rationale Status 1. RWI Acquisition Expands our fence market share – specifically in barbed tape Completed Oct 2011 2. FlexHead Acquisition Diversification away from commodities – specifically in flexible sprinkler drops Completed Feb 2012 3. Morrisville Divestiture A non-core, underperforming business Completed Apr 2012 4. AB Cope Divestiture Exits an underperforming business SPA signed, first of three tranches received Dec 2012 5. Gem Fab Divestiture Divestiture of non-core, underperforming business Completed Aug 2012 6. Brazil Sao Paulo Closure Close underperforming electrical business Completed May 2013 7. Brazil Divestiture Unattractive market, non-core products Closed Sept 2013 8. Heritage Plastics Acquisition Attractive growth market, core raceway product line. Commodity and product line diversification. Market consolidation. Signed and closed Sept 2013 9. ACROBA France Closure Dilutive to Atkore EBITDA, small market share, unattractive market. Committed to Restructuring Plan Sept 2013 9 transactions in 24-months Portfolio remix enables Raceway strategy, simplifies the organization and focuses Atkore on its core

11 Recovery Scenarios Over Time – Primary Non-Res Markets 600,000 800,000 1,000,000 1,200,000 1,400,000 1,600,000 1,800,000 2007: 4 2008: 3 2009: 2 20 1 0: 1 2010: 4 2011: 3 2012: 2 20 1 3: 1 2013: 4 2014: 3 2015: 2 2016: 1 Dodge analytics projects acceleration of non-residential starts in second half of fiscal 2013 & continuing through 2016. Recent strength of residential sector lends support for near- term non-residential recovery scenario. Dodge long term growth projections tend toward optimism and are generally revised downward with each successive forecast by approximately 10%. 2009 2010 2011 2012 2013 2014 2015 2016 sq ft in 000’s 2012* 2009* 2011* 2013* 2010* Key: * year of forecast Immediacy and amplitude of recovery continues to be recast unfavorably, but projected recovery still very significant, reaching 75% of peak from just under 50% today.
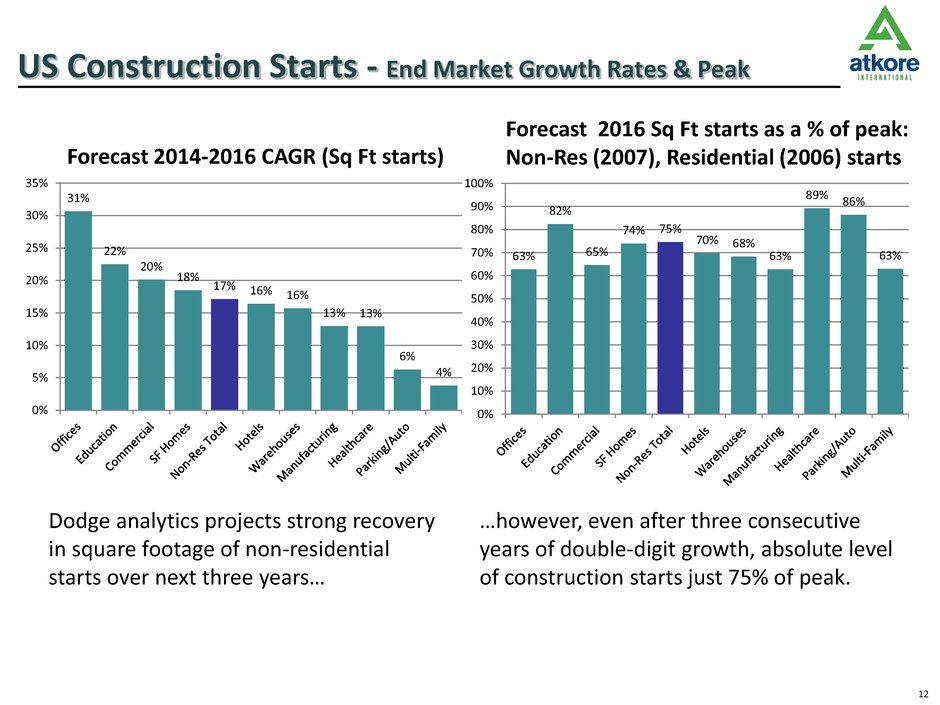
12 US Construction Starts - End Market Growth Rates & Peak 31% 22% 20% 18% 17% 16% 16% 13% 13% 6% 4% 0% 5% 10% 15% 20% 25% 30% 35% 63% 82% 65% 74% 75% 70% 68% 63% 89% 86% 63% 0% 10% 20% 30% 40% 50% 60% 70% 80% 90% 100% Forecast 2014-2016 CAGR (Sq Ft starts) Forecast 2016 Sq Ft starts as a % of peak: Non-Res (2007), Residential (2006) starts Dodge analytics projects strong recovery in square footage of non-residential starts over next three years… …however, even after three consecutive years of double-digit growth, absolute level of construction starts just 75% of peak.
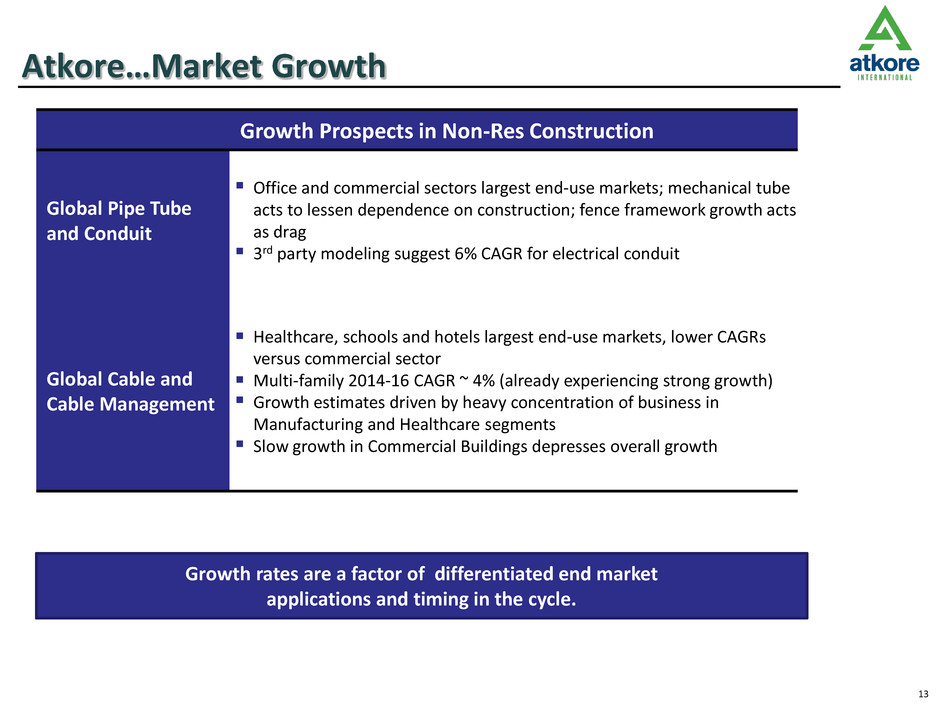
13 Atkore…Market Growth Growth Prospects in Non-Res Construction Global Pipe Tube and Conduit Office and commercial sectors largest end-use markets; mechanical tube acts to lessen dependence on construction; fence framework growth acts as drag 3rd party modeling suggest 6% CAGR for electrical conduit Global Cable and Cable Management Healthcare, schools and hotels largest end-use markets, lower CAGRs versus commercial sector Multi-family 2014-16 CAGR ~ 4% (already experiencing strong growth) Growth estimates driven by heavy concentration of business in Manufacturing and Healthcare segments Slow growth in Commercial Buildings depresses overall growth Growth rates are a factor of differentiated end market applications and timing in the cycle.
14 Rationale for PVC Acquisition Compliments Atkore market franchise and enhances Atkore bundling program PVC conduit is a direct substitute for Steel Conduit and Armored cable. But growing at 13% (faster than steel and A/C). PVC is a lower cost solution (material & labor), favored where code permits PVC has the same agent and distribution channel, but products are earlier in the cycle (PVC preferred for underground in the slab) Continuing consolidation of resin suppliers since the 1980’s (22 suppliers) now stable at 5 suppliers. Coupled with Brazil divestiture, reduces steel in the Atkore commodity mix.
15 Why Heritage/Liberty Plastics PVC market growth potential Atkore’s current regional presence with PVC Broadens our existing PVC offering Complements our core steel conduit offering Together, become a leader in PVC marketplace Strong company performance Highly experienced Heritage Plastics team Strategic locations Carrollton-OH, Tampa-FL, Louisville-KY , Weatherford-TX, Milford-UT Quality products with timely delivery Long-term customer relationships Similar end markets Loyal, dependable and dedicated employees 311 employees
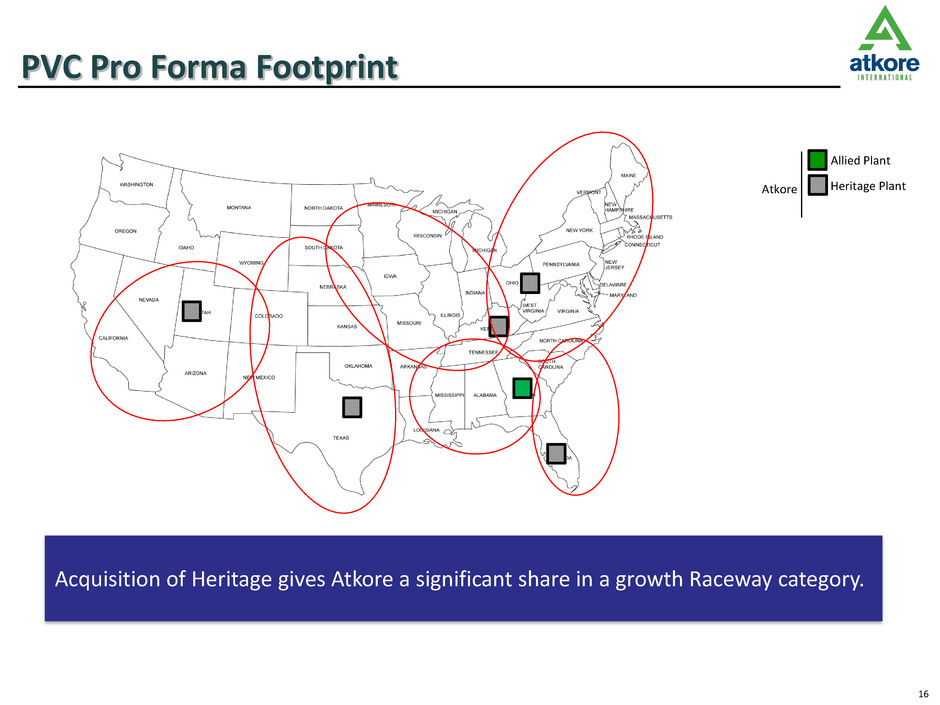
16 PVC Pro Forma Footprint Acquisition of Heritage gives Atkore a significant share in a growth Raceway category. Heritage Plant Allied Plant Atkore
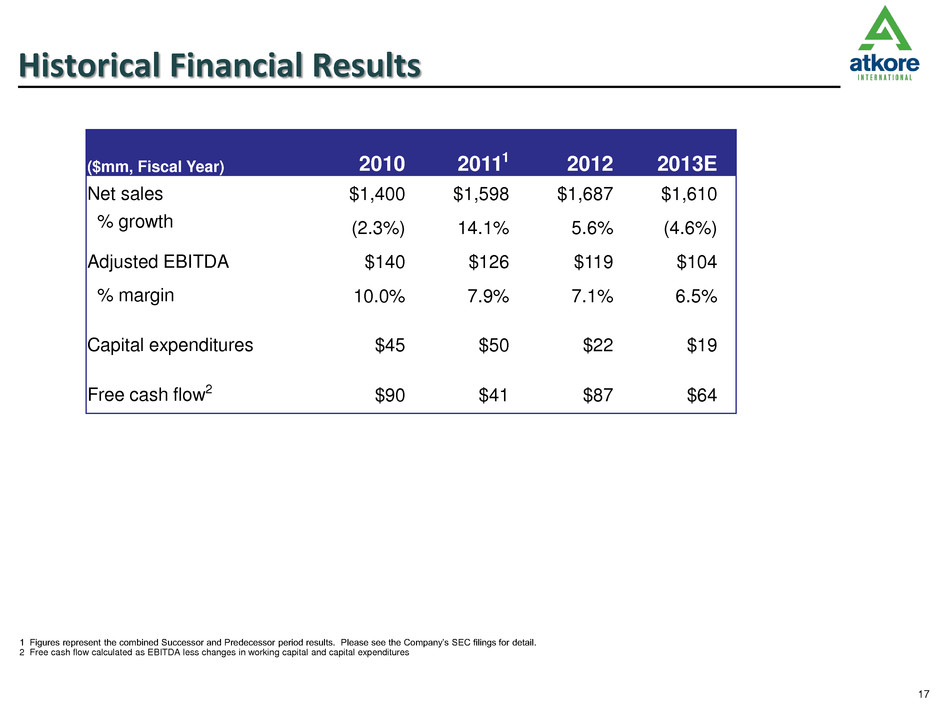
17 1 Figures represent the combined Successor and Predecessor period results. Please see the Company’s SEC filings for detail. 2 Free cash flow calculated as EBITDA less changes in working capital and capital expenditures Historical Financial Results ($mm, Fiscal Year) 2010 20111 2012 2013E Net sales $1,400 $1,598 $1,687 $1,610 % growth (2.3%) 14.1% 5.6% (4.6%) Adjusted EBITDA $140 $126 $119 $104 % margin 10.0% 7.9% 7.1% 6.5% Capital expenditures $45 $50 $22 $19 Free cash flow2 $90 $41 $87 $64

18 Strong Cash Flow Characteristics Adj. EBITDA Free Cash Flow $90 $41 $87 $64 $0 $50 $100 $150 $200 2010 2011 2012 2013E ($ m m ) $140 $126 $119 $104 $0 $50 $100 $150 $200 2010 2011 2012 2013E ($ m m )
19 Summary 2013 has been a year of challenges and many successes, but most importantly we have strengthened the business by: Building out the team we need to win Rebalancing the portfolio Building Muscle around financial shared services, customer service, Harvey lean, pricing capability in all Business Units, talent appraisal, management, selection and recruiting While volume will increase, market competitive conditions are not anticipated to be meaningfully better in 2014, but should improve through 2015 and 2016 with cumulative volume increases. Atkore Business Unit strategic plans focus on: Driving operational and commercial excellence for effectiveness and productivity Driving the Raceway value proposition that gets us a greater share of electrical distribution wallet Atkore functions will enable Business Unit Strategies by: Continuing Focus on Talent Rebalancing the portfolio toward the Raceway Incremental IT improvements in support of key initiatives
20 Q&A
21 Appendix
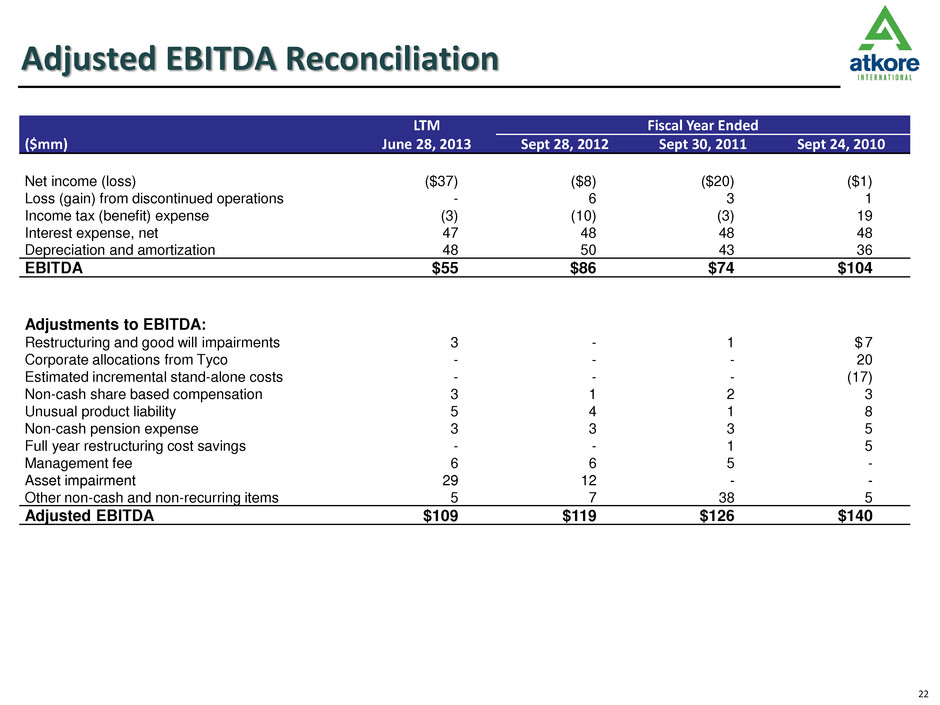
22 Adjusted EBITDA Reconciliation LTM Fiscal Year Ended ($mm) June 28, 2013 Sept 28, 2012 Sept 30, 2011 Sept 24, 2010 Net income (loss) ($37) ($8) ($20) ($1) Loss (gain) from discontinued operations - 6 3 1 Income tax (benefit) expense (3) (10) (3) 19 Interest expense, net 47 48 48 48 Depreciation and amortization 48 50 43 36 EBITDA $55 $86 $74 $104 Adjustments to EBITDA: Restructuring and good will impairments 3 - 1 $ 7 Corporate allocations from Tyco - - - 20 Estimated incremental stand-alone costs - - - (17) Non-cash share based compensation 3 1 2 3 Unusual product liability 5 4 1 8 Non-cash pension expense 3 3 3 5 Full year restructuring cost savings - - 1 5 Management fee 6 6 5 - Asset impairment 29 12 - - Other non-cash and non-recurring items 5 7 38 5 Adjusted EBITDA $109 $119 $126 $140
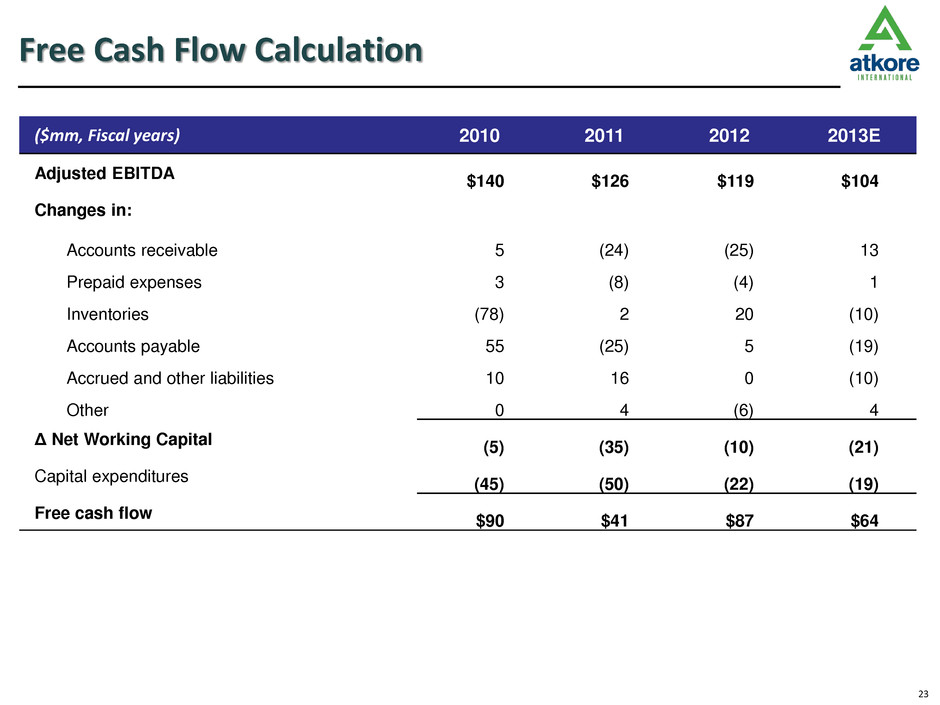
23 Free Cash Flow Calculation ($mm, Fiscal years) 2010 2011 2012 2013E Adjusted EBITDA $140 $126 $119 $104 Changes in: Accounts receivable 5 (24) (25) 13 Prepaid expenses 3 (8) (4) 1 Inventories (78) 2 20 (10) Accounts payable 55 (25) 5 (19) Accrued and other liabilities 10 16 0 (10) Other 0 4 (6) 4 Δ Net Working Capital (5) (35) (10) (21) Capital expenditures (45) (50) (22) (19) Free cash flow $90 $41 $87 $64
