Attached files
| file | filename |
|---|---|
| 8-K - 8-K - AVAYA INC | a8-kreboardcompxpatelandri.htm |
| EX-99.2 - AVAYA PRESS RELEASE - AVAYA INC | exhibit992pressrelease.htm |

© 2013 Avaya October 2013 Financial Update October, 2013 Matt Booher Treasurer Exhibit 99.1

2 © 2013 Avaya October 2013 Avaya Overview #477 of 2013 Fortune 500® 300k+ customers, >95% of Fortune 500® ~ 5,900 patents & patent applications pending Global leader of business collaboration and communications solutions ~17,000 employees in 59 countries 13 primary R&D facilities in 8 countries with 2,800 research & development professionals 74 new product releases since the start of the 2013 fiscal year Industry recognized by Gartner, Inc., IDC, Frost & Sullivan, InfoTech, Nemertes, Forrester All as of September 30, 2012, except where noted
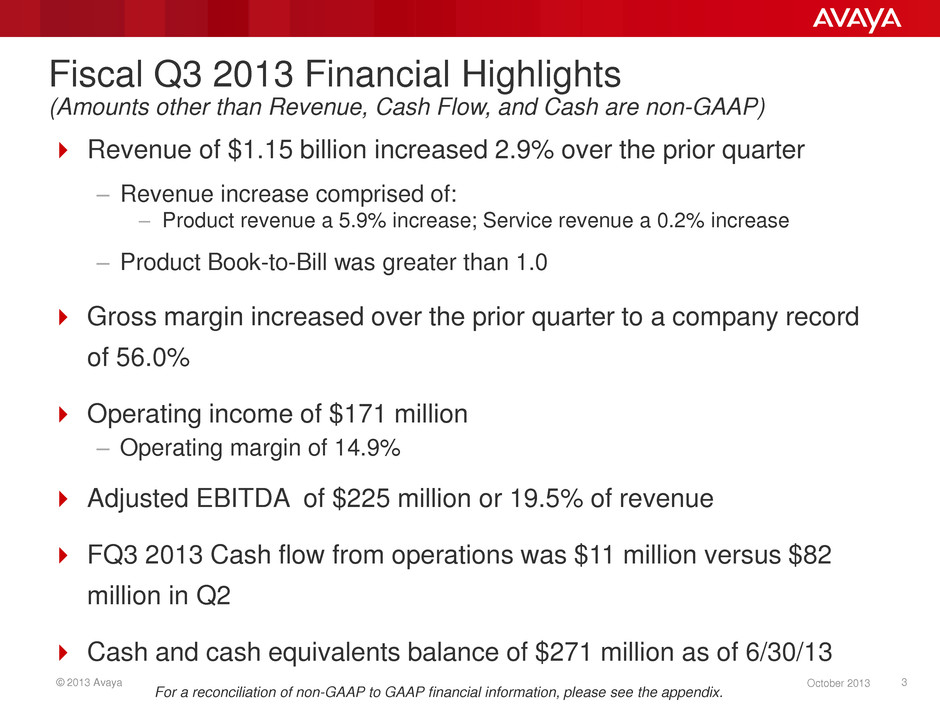
3 © 2013 Avaya October 2013 Fiscal Q3 2013 Financial Highlights (Amounts other than Revenue, Cash Flow, and Cash are non-GAAP) Revenue of $1.15 billion increased 2.9% over the prior quarter – Revenue increase comprised of: – Product revenue a 5.9% increase; Service revenue a 0.2% increase – Product Book-to-Bill was greater than 1.0 Gross margin increased over the prior quarter to a company record of 56.0% Operating income of $171 million – Operating margin of 14.9% Adjusted EBITDA of $225 million or 19.5% of revenue FQ3 2013 Cash flow from operations was $11 million versus $82 million in Q2 Cash and cash equivalents balance of $271 million as of 6/30/13 For a reconciliation of non-GAAP to GAAP financial information, please see the appendix.
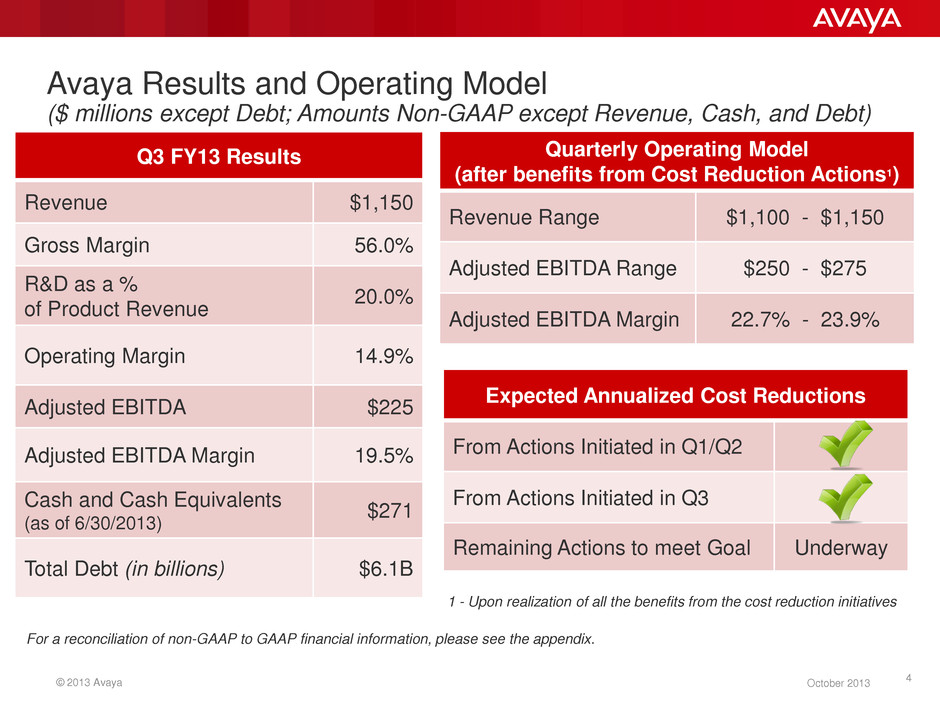
© 2013 Avaya 4 October 2013 Avaya Results and Operating Model ($ millions except Debt; Amounts Non-GAAP except Revenue, Cash, and Debt) Q3 FY13 Results Revenue $1,150 Gross Margin 56.0% R&D as a % of Product Revenue 20.0% Operating Margin 14.9% Adjusted EBITDA $225 Adjusted EBITDA Margin 19.5% Cash and Cash Equivalents (as of 6/30/2013) $271 Total Debt (in billions) $6.1B Quarterly Operating Model (after benefits from Cost Reduction Actions1) Revenue Range $1,100 - $1,150 Adjusted EBITDA Range $250 - $275 Adjusted EBITDA Margin 22.7% - 23.9% Expected Annualized Cost Reductions From Actions Initiated in Q1/Q2 From Actions Initiated in Q3 Remaining Actions to meet Goal Underway For a reconciliation of non-GAAP to GAAP financial information, please see the appendix. 1 - Upon realization of all the benefits from the cost reduction initiatives

5 © 2013 Avaya October 2013 17% 15% 0% 3% 6% 9% 12% 15% 18% Avaya FY 2012 Industry Average* 309 464 0 100 200 300 400 500 FY09 FY12 Growing Product Investments R&D as a % of Product Revenue R&D ($M) * Industry average for R&D as a percentage of product revenue for U.S. companies with market capitalization greater than $100 million in the GICS sector for technology hardware and equipment for CY2011. Innovation Avaya continues to invest in R&D and innovate; 74 new product releases introduced since the beginning of fiscal 2013 As of September 30, 2012, Avaya has approximately 5,900 patents and patent applications pending

6 © 2013 Avaya October 2013 Driving Innovation 24 New product releases* released in FQ3 2013 Top 20 ranking: Patent Board industry scorecard Growth in new product revenue from emerging technologies such as cloud services, mobility, and security Acquisitions have expanded product portfolio • New product releases inlcude Avaya releases of acquired products, new models of hardware, and major whole releases of software products.

7 © 2013 Avaya October 2013 0.0 0.0 0.2 0.0 2.1 1.1 1.3 1.4 $0.0 $0.5 $1.0 $1.5 $2.0 $2.5 2013 2014 2015 2016 2017 2018 2019 2020 2021 Avaya Debt Maturity Profile ($ in Billions) 2nd Lien Bonds (10.5%) Senior Secured Bonds (9%) Senior Secured Bonds (7%) Cash Pay Notes (9.75%) PIK Toggle Notes (10.125%) TLB - 5 (8.0%) TLB - 4 (7.5%) TLB - 3 (4.8%)

8 © 2013 Avaya October 2013 368 400 345 355 271 337 285 302 271 335 335 335 335 335 335 335 335 335 200 200 200 200 200 200 200 200 200 0 100 200 300 400 500 600 700 800 900 1000 3Q11 4Q11 1Q12 2Q12 3Q12 4Q12 1Q13 2Q13 3Q13 $ Millions Cash Asset Based Revolver Cash Flow Revolver Liquidity Cash plus borrowing capacity under existing revolvers (as of the end of each period indicated) * Original business model assumed a working capital requirement of only $150M *

© 2013 Avaya 9 October 2013 Q&A
© 2013 Avaya 10 October 2013 Forward-Looking Statements Certain statements contained in this presentation are forward-looking statements, including statements regarding our future financial and operating performance, as well as statements regarding our future growth plans and drivers. These statements may be identified by the use of forward-looking terminology such as "anticipate," "believe," "continue," "could," "estimate," "expect,“ "intend," "may," "might," "plan," "potential," "predict," "should" or "will" or other similar terminology. We have based these forward-looking statements on our current expectations, assumptions, estimates and projections. While we believe these expectations, assumptions, estimates and projections are reasonable, such forward looking statements are only predictions and involve known and unknown risks and uncertainties, many of which are beyond our control. These and other important factors may cause our actual results, performance or achievements to differ materially from any future results, performance or achievements expressed or implied by these forward-looking statements. For a list and description of such risks and uncertainties, please refer to our filings with the SEC that are available at www.sec.gov and in particular, our 2012 Form 10-K and our Form 10-Q for the quarter ended June 30, 2013. We disclaim any intention or obligation to update or revise any forward-looking statements, whether as a result of new information, future events or otherwise. For a reconciliation of non-GAAP to GAAP financial information, please see the appendix and our Form 8-K filed with the SEC on 8/10/2013.

© 2013 Avaya 11 October 2013 Appendix
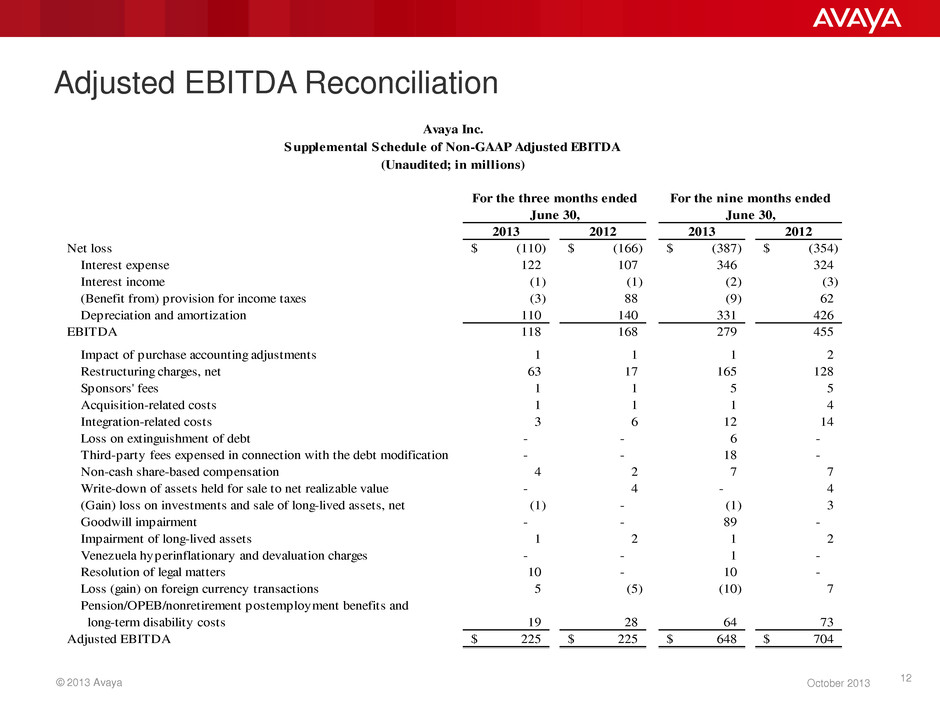
© 2013 Avaya 12 October 2013 Adjusted EBITDA Reconciliation 2013 2012 2013 2012 Net loss (110)$ (166)$ (387)$ (354)$ Interest expense 122 107 346 324 Interest income (1) (1) (2) (3) (Benefit from) provision for income taxes (3) 88 (9) 62 Depreciation and amortization 110 140 331 426 118 168 279 455 Impact of purchase accounting adjustments 1 1 1 2 Restructuring charges, net 63 17 165 128 Sponsors' fees 1 1 5 5 Acquisition-related costs 1 1 1 4 Integration-related costs 3 6 12 14 Loss on extinguishment of debt - - 6 - Third-party fees expensed in connection with the debt modification - - 18 - Non-cash share-based compensation 4 2 7 7 Write-down of assets held for sale to net realizable value - 4 - 4 (Gain) loss on investments and sale of long-lived assets, net (1) - (1) 3 Goodwill impairment - - 89 - Impairment of long-lived assets 1 2 1 2 Venezuela hyperinflationary and devaluation charges - - 1 - Resolution of legal matters 10 - 10 - Loss (gain) on foreign currency transactions 5 (5) (10) 7 Pension/OPEB/nonretirement postemployment benefits and long-term disability costs 19 28 64 73 Adjusted EBITDA 225$ 225$ 648$ 704$ Avaya Inc. Supplemental Schedule of Non-GAAP Adjusted EBITDA (Unaudited; in millions) EBITDA For the three months ended June 30, For the nine months ended June 30,
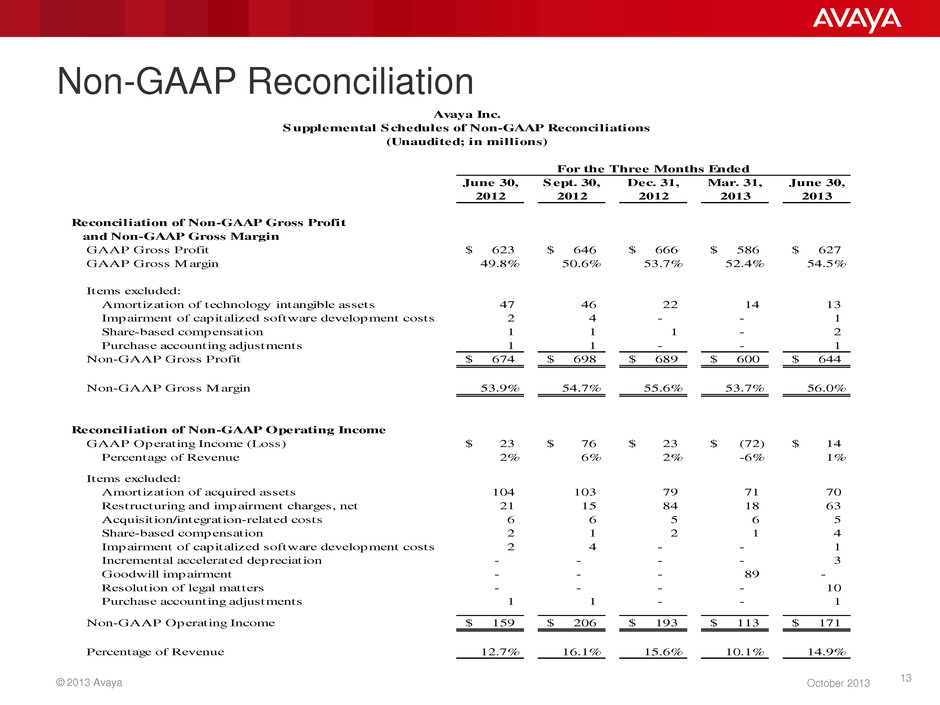
© 2013 Avaya 13 October 2013 Non-GAAP Reconciliation June 30, Sept. 30, Dec. 31, Mar. 31, June 30, 2012 2012 2012 2013 2013 GAAP Gross Profit 623$ 646$ 666$ 586$ 627$ GAAP Gross Margin 49.8% 50.6% 53.7% 52.4% 54.5% Items excluded: Amortization of technology intangible assets 47 46 22 14 13 Impairment of capitalized software development costs 2 4 - - 1 Share-based compensation 1 1 1 - 2 Purchase accounting adjustments 1 1 - - 1 Non-GAAP Gross Profit 674$ 698$ 689$ 600$ 644$ Non-GAAP Gross Margin 53.9% 54.7% 55.6% 53.7% 56.0% Reconciliation of Non-GAAP Operating Income GAAP Operating Income (Loss) 23$ 76$ 23$ (72)$ 14$ Percentage of Revenue 2% 6% 2% -6% 1% Items excluded: Amortization of acquired assets 104 103 79 71 70 Restructuring and impairment charges, net 21 15 84 18 63 Acquisition/integration-related costs 6 6 5 6 5 Share-based compensation 2 1 2 1 4 Impairment of capitalized software development costs 2 4 - - 1 Incremental accelerated depreciation - - - - 3 Goodwill impairment - - - 89 - Resolution of legal matters - - - - 10 Purchase accounting adjustments 1 1 - - 1 Non-GAAP Operating Income 159$ 206$ 193$ 113$ 171$ Percentage of Revenue 12.7% 16.1% 15.6% 10.1% 14.9% Reconciliation of Non-GAAP Gross Profit and Non-GAAP Gross Margin Avaya Inc. Supplemental Schedules of Non-GAAP Reconciliations (Unaudited; in millions) For the Three Months Ended

