Attached files
| file | filename |
|---|---|
| 8-K - FORM 8-K - UIL HOLDINGS CORP | t1300375_8k.htm |
Exhibit 99.1
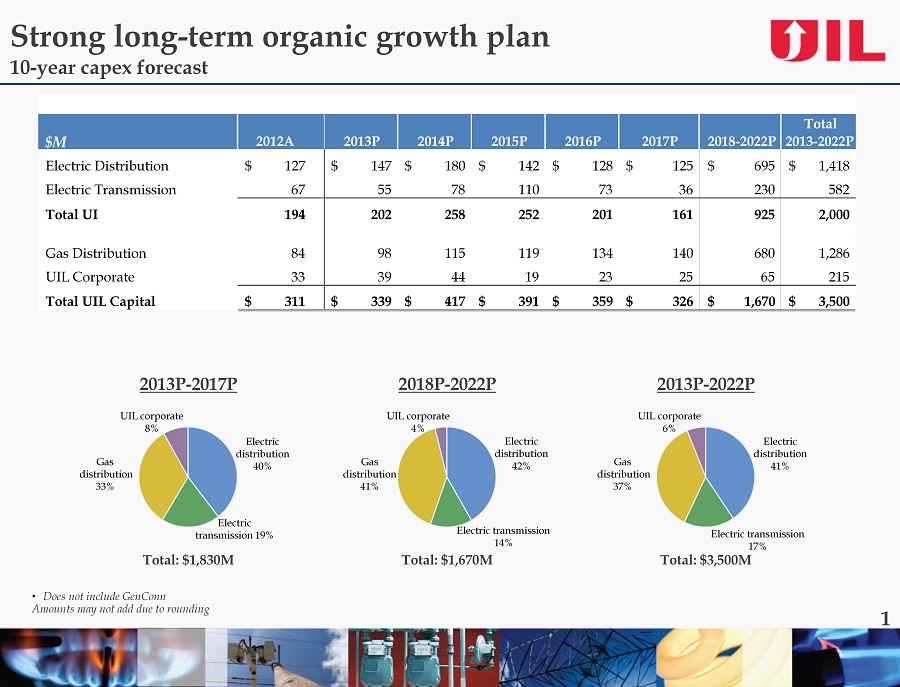
2012A 2013P 2014P 2015P 2016P 2017P 2018 - 2022P Total 2013 - 2022P Electric Distribution 127 $ 147 $ 180 $ 142 $ 128 $ 125 $ 695 $ 1,418 $ Electric Transmission 67 55 78 110 73 36 230 582 Total UI 194 202 258 252 201 161 925 2 ,000 Gas Distribution 84 98 115 119 134 140 680 1,286 UIL Corporate 33 39 44 19 23 25 65 215 Total UIL Capital 311 $ 339 $ 417 $ 391 $ 359 $ 326 $ 1,670 $ 3,500 $ $M • Does not include GenConn Amounts may not add due to rounding 1 2013P - 2017P Total: $1,830M Electric distribution 40% Electric transmission 19% Gas distribution 33% UIL corporate 8% Electric distribution 41% Electric transmission 17% Gas distribution 37% UIL corporate 6% 2013P - 2022P Total: $3,500M 2018P - 2022P Electric distribution 42% Electric transmission 14% Gas distribution 41% UIL corporate 4% Total: $1,670M Strong long - term organic growth plan 10 - year capex forecast
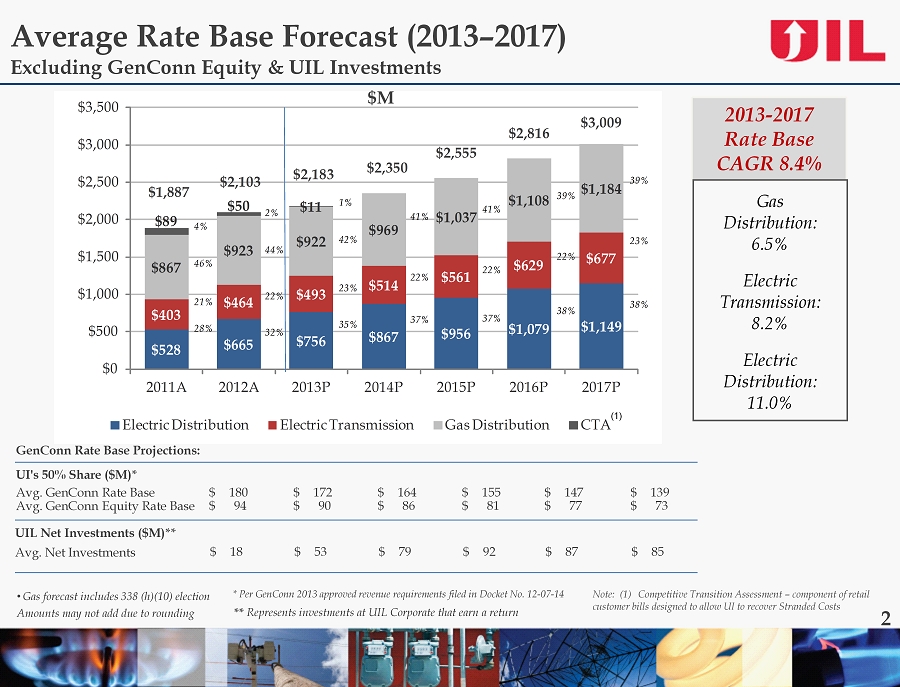
$528 $665 $756 $867 $956 $1,079 $1,149 $403 $464 $493 $514 $561 $629 $677 $867 $923 $922 $969 $1,037 $1,108 $1,184 $89 $50 $11 $0 $500 $1,000 $1,500 $2,000 $2,500 $3,000 $3,500 2011A 2012A 2013P 2014P 2015P 2016P 2017P Electric Distribution Electric Transmission Gas Distribution CTA $1,887 $2,103 $2,183 $2,350 $2,555 $2,816 $3,009 4% 46% 21% 28% 2% 44% 22% 32% 1% 42% 23% 35% 41% 22% 37% 41% 22% 37% 39% 22% 38% 39% 23% 38% Average Rate Base Forecast (2013 – 2017) Excluding GenConn Equity & UIL Investments $M 2013 - 2017 Rate Base CAGR 8.4% Gas Distribution: 6.5% Electric Transmission: 8.2% Electric Distribution: 11.0% • Gas forecast includes 338 (h)( 10) election Amounts may not add due to rounding 2 GenConn Rate Base Projections: UI's 50% Share ($M)* Avg. GenConn Rate Base Avg. GenConn Equity Rate Base 180 $ 94 $ 172 $ 90 $ 164 $ 86 $ 155 $ 81 $ 147 $ 77 $ 139 $ 73 $ * Per GenConn 2013 approved revenue requirements filed in Docket No. 12 - 07 - 14 ** Represents investments at UIL Corporate that earn a return UIL Net Investments ($M)** 18 $ 53 $ 79 $ 92 $ 87 $ 85 $ Avg. Net Investments (1) Note: (1) Competitive Transition Assessment – component of retail customer bills designed to allow UI to recover Stranded Costs
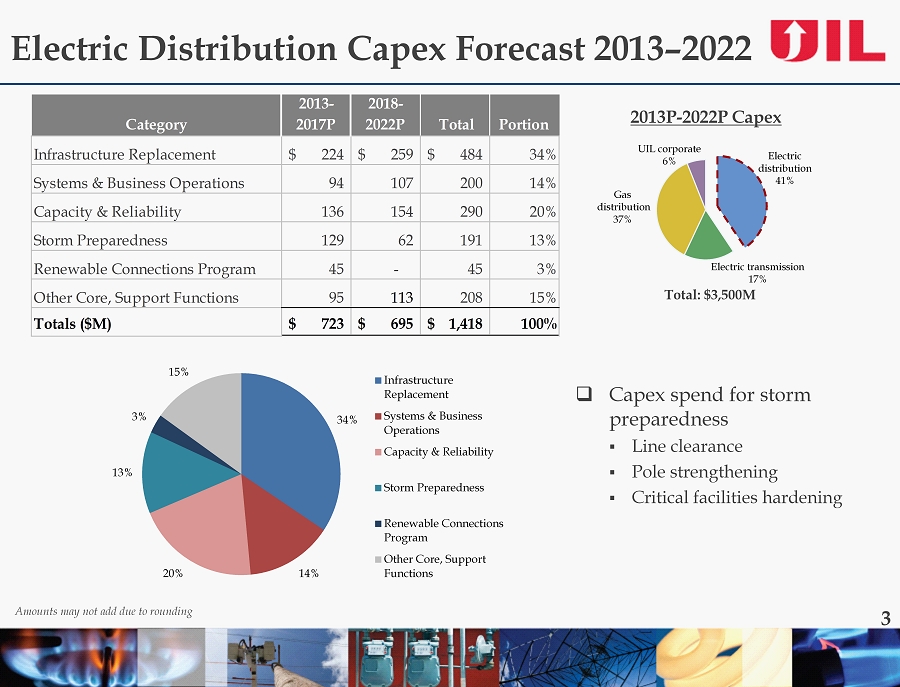
34% 14% 20% 13% 3% 15% Infrastructure Replacement Systems & Business Operations Capacity & Reliability Storm Preparedness Renewable Connections Program Other Core, Support Functions Electric Distribution Capex Forecast 2013 – 2022 □ Capex spend for storm preparedness ▪ Line clearance ▪ Pole strengthening ▪ Critical facilities hardening Amounts may not add due to rounding 3 Electric distribution 41% Electric transmission 17% Gas distribution 37% UIL corporate 6% 2013P - 2022P Capex Total: $3,500M Category 2013- 2017P 2018- 2022P Total Portion Infrastructure Replacement 224$ 259$ 484$ 34% Systems & Business Operations 94 107 200 14% Capacity & Reliability 136 154 290 20% Storm Preparedness 129 62 191 13% Renewable Connections Program 45 - 45 3% Other Core, Support Functions 95 113 208 15% Totals ($M) 723$ 695$ 1,418$ 100%
Electric Distribution Rate Case □ Final decision August 14, 2013 ▪ Revenue - $20M year 1, $25.8 M year 2 ▪ 9.15% ROE, 50% equity, 50% debt capital structure ▪ Continuation of existing decoupling mechanism ▪ Recovery of $38.1M of storm - related costs over 10 years; establishment of $2M per year storm reserve ▪ Earnings sharing mechanism approved at 50/50 with the customers’ portion being used to accelerate the recovery of the storm regulatory asset ▪ Capex – $425M 2013 - 2015 compared to current public amount of $444M • Does not include approximately $45 million for Renewable Connections Program □ Petition for reconsideration filed August 26, 2013 □ On September 18, 2013, PURA approved the Decision to review the Petition for Reconsideration 4
Electric Distribution Rate Case □ Final decision August 14, 2013 ▪ Revenue - $20M year 1, $25.8 M year 2 ▪ 9.15% ROE, 50% equity, 50% debt capital structure ▪ Continuation of existing decoupling mechanism ▪ Recovery of $38.1M of storm - related costs over 10 years; establishment of $2M per year storm reserve ▪ Earnings sharing mechanism approved at 50/50 with the customers’ portion being used to accelerate the recovery of the storm regulatory asset ▪ Capex – $425M 2013 - 2015 compared to current public amount of $444M • Does not include approximately $45 million for Renewable Connections Program □ Petition for reconsideration filed August 26, 2013 4
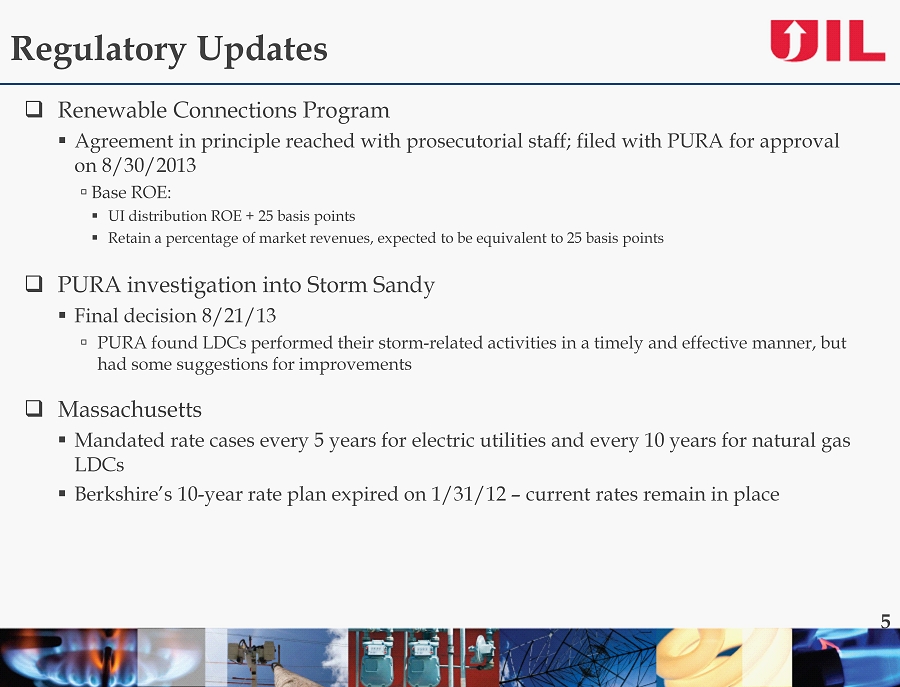
Regulatory Updates □ Renewable Connections Program ▪ Agreement in principle reached with prosecutorial staff; filed with PURA for approval on 8/30/2013 □; Base ROE: ▪ UI distribution ROE + 25 basis points ▪ Retain a percentage of market revenues, expected to be equivalent to 25 basis points □ PURA investigation into Storm Sandy ▪ Final decision 8/21/13 □; PURA found LDCs performed their storm - related activities in a timely and effective manner, but had some suggestions for improvements □ Massachusetts ▪ Mandated rate cases every 5 years for electric utilities and every 10 years for natural gas LDCs ▪ Berkshire’s 10 - year rate plan expired on 1/31/12 – current rates remain in place 5