Attached files
| file | filename |
|---|---|
| 8-K - FORM 8-K - PUBLIC SERVICE ENTERPRISE GROUP INC | d598949d8k.htm |
 Forward Looking Statement
3
EXHIBIT 99
Certain of the matters discussed in this communication about us and our
subsidiaries future performance, including, without limitation, future
revenues, earnings, strategies, prospects, consequences and all other
statements that are not purely historical constitute
“forward-looking statements” within the meaning of the Private Securities
Litigation Reform Act of 1995. Such forward-looking statements are subject
to risks and uncertainties, which could cause actual results to differ
materially from those anticipated. Such statements are based on
management’s beliefs as well as assumptions made by and information
currently available to management. When used herein, the words
“anticipate,” “intend,” “estimate,” “believe,” “expect,” “plan,” “should,”
“hypothetical,” “potential,” “forecast,”
“project,” variations of such words and similar expressions
are intended to identify forward-looking statements. Factors that may
cause actual results to differ are often presented with the forward-looking
statements themselves. Other factors that could cause actual results to
differ materially from those contemplated in any forward-looking
statements made by us herein are discussed in filings we make with the
United States Securities and Exchange Commission (SEC), including our
Annual Report on Form 10-K and subsequent reports on Form 10-Q and
Form 8-K and available on our website: http://www.pseg.com. These factors
include, but are not limited to:
• adverse changes in the demand for or the price of the capacity and
energy that we sell into wholesale electricity
markets, • adverse changes in energy industry law, policies and regulation,
including market structures and a potential
shift away from competitive markets toward subsidized
market mechanisms, transmission planning and cost allocation rules, including
rules regarding how transmission is planned and who is
permitted to build transmission in the future, and
reliability standards, • any inability of our transmission and distribution businesses to obtain
adequate and timely rate relief and regulatory
approvals from federal and state regulators, • changes in federal and state environmental regulations that could
increase our costs or limit our operations,
• changes in nuclear regulation and/or general developments in the nuclear
power industry, including various impacts from any
accidents or incidents experienced at our facilities
or by others in the industry, that could limit operations of our nuclear
generating units,
• actions or activities at one of our nuclear units located on a
multi-unit site that might adversely affect our
ability to continue to operate that unit or other units
located at the same site,
• any inability to balance our energy obligations, available supply and
risks, • any deterioration in our credit quality or the credit
quality of our counterparties, including in
our leveraged leases, • availability of capital and credit at commercially reasonable terms and
conditions and our ability to meet cash needs,
• changes in the cost of, or interruption in the supply of, fuel and
other commodities necessary to the operation of our
generating units, • delays in receipt of necessary permits and approvals for our
construction and development activities,
• delays or unforeseen cost escalations in our construction and
development activities,
• any inability to achieve, or continue to sustain, our expected levels
of operating performance,
• any equipment failures, accidents, severe weather events or other
incidents that impact our ability to provide safe
and reliable service to our customers, and any
inability to sufficiently obtain coverage or recover proceeds of insurance on
such matters,
• increases in competition in energy supply markets as well as
competition for certain rate-based
transmission projects, • any inability to realize anticipated tax benefits or retain tax
credits, • challenges associated with recruitment and/or retention of a qualified
workforce, • adverse performance of our decommissioning and defined benefit plan
trust fund investments and changes in funding
requirements, and • changes in technology and customer usage
patterns.
All of the forward-looking statements made in this communication are
qualified by these cautionary statements and we cannot assure you that
the results or developments anticipated by management will be realized
or even if realized, will have the expected consequences to, or effects
on, us or our business prospects, financial condition or results of
operations. Readers are cautioned not to place undue reliance on these
forward-looking statements in making any investment decision. Forward-
looking statements made in this communication apply only as of the date of
this communication. While we may elect to update forward-looking
statements from time to time, we specifically disclaim any obligation
to do so, even if internal estimates change, unless otherwise required
by applicable securities laws. The forward-looking statements
contained in this communication are intended to qualify for the safe
harbor provisions of Section 27A of the Securities Act of 1933, as
amended, and Section 21E of the Securities Exchange Act of 1934, as
amended. |
 GAAP Disclaimer
PSEG presents Operating Earnings in addition to its Income from Continuing
Operations/Net Income reported in accordance with accounting principles
generally accepted in the United States (GAAP). Operating Earnings
is a non- GAAP financial measure that differs from Net Income because
it excludes gains or losses associated with Nuclear Decommissioning
Trust (NDT), Mark-to-Market (MTM) accounting, and other material
one-time items. PSEG presents Operating Earnings because
management believes that it is appropriate for investors to consider
results excluding these items in addition to the results reported in
accordance with GAAP. PSEG believes that the non-GAAP financial
measure of Operating Earnings provides a consistent and comparable
measure of performance of its businesses to help shareholders understand
performance trends. This information is not
intended to be viewed as an alternative to GAAP
information. Slides A and B at the end of this presentation include a list of
items excluded from Income from Continuing Operations/Net Income to
reconcile to Operating Earnings, with a reference to that slide included
on each of the slides where the non-GAAP information appears.
4 |
 PSE&G’s Energy Strong Capital Program
addresses new reality
New ten-year, $3.9 Billion Infrastructure Program filed February 2013 with
the NJBPU to strengthen PSE&G’s distribution system focusing on
hardening and resiliency Plan to invest an additional $1.5 Billion in
transmission grid over the ten-year period The 10-year Energy
Strong proposal includes: Protecting 40 utility installations from severe
storms ($1.7 Billion)
Making the electric grid smarter and easier to repair ($460 Million) Adding backup
distribution lines and system redundancies ($550 Million)
Undergrounding 20 miles of overhead distribution lines ($60 Million) Modernizing
the gas distribution system ($1.2 Billion)
PSE&G is seeking BPU approval to implement the first five years of the
Energy Strong proposal, an investment of $2.6 Billion
The proposed filing creates ~5,800 jobs and stimulates economic activity for
New Jersey businesses
12 |
 68 local NJ towns and 6 counties
support
•
68 municipalities and six counties (Bergen, Hudson, Mercer,
Passaic, Somerset and Union) have approved resolutions in
support of Energy Strong, PSE&G’s infrastructure proposal to
improve and fortify its electric and gas distribution systems
•
The Energy Strong proposal is currently being evaluated by the
NJ Board of Public Utilities
•
Public hearings are scheduled for September and October 2013
13 |
 PSEG First Half 2013 -
Highlights
Maintaining 2013 operating earnings guidance of $2.25 -
$2.50 per share
Strong earnings: First half 2013 earnings of $1.33 per share vs. $1.28
in year-ago period Power benefitting from higher capacity prices
and asset location PSE&G seeing results from increased investment
in transmission O&M under control {Continuing control of O&M
supporting results} Capital investment on schedule
PSE&G received approval to invest $446 million in extensions of Solar 4
All and Solar Loan programs PSE&G’s existing $3.4 billion
Transmission investment program remains on schedule Hearings scheduled
for Energy Strong, PSE&G’s $2.6 billion, 5-year capital infrastructure program
Full year 2013 operating earnings expected to be at the upper end of
guidance, assuming normal weather and unit operations
17
Financial position remains strong
S&P credit rating upgrade across Enterprise, Power and PSE&G
Debt represented 41% of capital at June 30, 2013
Dividend
increased
1.4%
to
$1.44
per
share,
the
9
increase
in
the
last
ten
years
th |
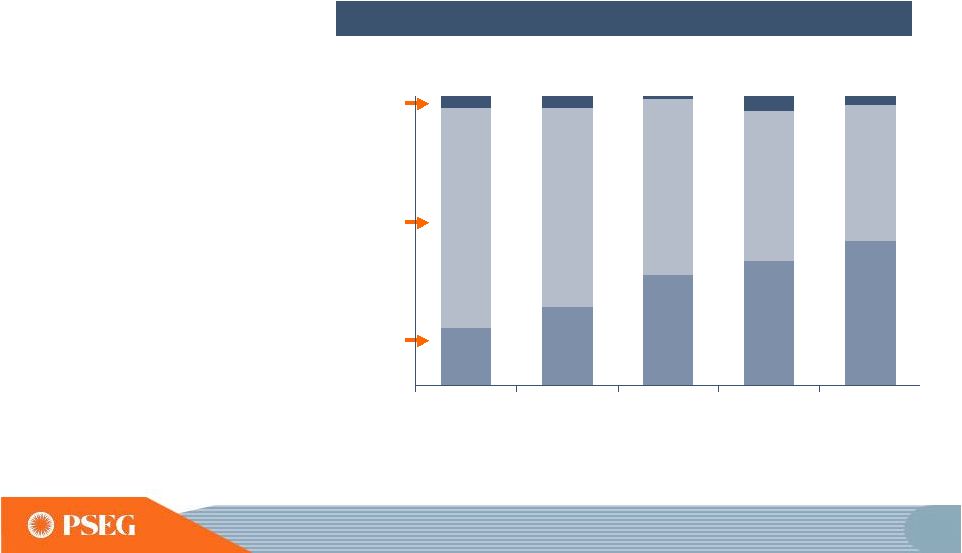 2013 Operating Earnings
*
Investment in the
regulated business
has changed the
earnings mix
Our 2009-2013
investment focus has
brought us to a 50/50
mix for 2013
PSE&G’s 2013-2017
Energy Strong Program
and ongoing transmission
investments will support
continued growth in
PSE&G’s earnings
Percent of Operating Earnings Contribution by Subsidiary
PSE&G
Power
Other
18
20%
27%
38%
43%
50%
76%
69%
61%
52%
47%
2009
2010
2011
2012
2013E
*SEE SLIDE A FOR ITEMS EXCLUDED FROM INCOME FROM CONTINUING OPERATIONS/NET
INCOME TO RECONCILE TO OPERATING EARNINGS; ALL PERIODS REFLECT TEXAS IN
DISCONTINUED OPERATIONS. E=ESTIMATE
$2.74
$2.44
$2.25 -$2.50E
$3.09
$3.12 |
 PSE&G’s 2013 operating earnings
benefiting from transmission growth and cost containment
initiatives
E= ESTIMATE
45
$528
2012
2013 Guidance
PSE&G Operating Earnings*
($ Millions)
$580 -
$635E
*SEE SLIDE A FOR ITEMS EXCLUDED FROM INCOME FROM CONTINUING
OPERATIONS/NET INCOME TO RECONCILE TO OPERATING EARNINGS. |
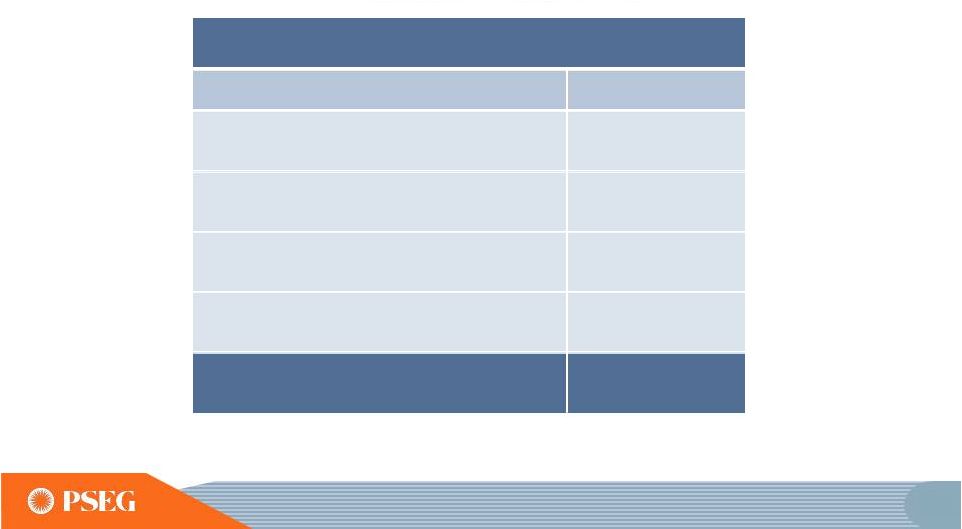 Maintaining 2013 operating earnings guidance
E = ESTIMATE
Based on our performance year-to-date, we expect full year
operating earnings to be at the upper end of guidance,
assuming normal weather and unit operations
87
PSEG Operating Earnings
$ Millions (except EPS)
2013E
PSEG Power
$535 -
$600
PSE&G
$580 -
$635
PSEG Energy Holdings/Parent
$25 -
$35
Operating Earnings*
$1,140 -
$1,270
2013 Earnings Guidance
$2.25
-
$2.50
*SEE SLIDE FOR ITEMS EXCLUDED FROM INCOME FROM CONTINUING
OPERATIONS/NET INCOME TO RECONCILE TO OPERATING EARNINGS. |
 PSEG Summary
•
Maintaining
2013
operating
earnings
guidance
of
$2.25
-
$2.50
per share --
based on financial results to date, we expect operating
earnings for the full year to be at the upper end of our guidance range
assuming normal weather and unit operations
•
Double digit operating earnings growth at PSE&G starting in 2013,
and continuing through 2015 driven by transmission investments
and approved programs
•
Power’s continued focus on operational excellence, market expertise
and financial strength reduces risk in low price environment
•
Strong Balance Sheet and Cash Flow support full capital program
without the need for equity
•
Long history of returning cash to the shareholder through the
common dividend, with opportunity for future growth
100 |
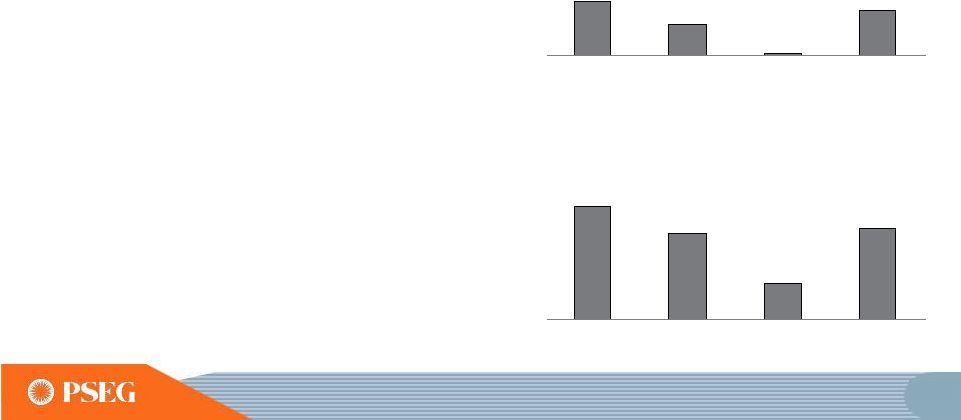 Slow economic recovery in NJ is constraining
growth in all market sectors
Modest residential growth limited
by housing market inactivity and
the slow economic recovery
Consumer spending is trending
with the slow economic recovery
and impacting growth in the
commercial sector
Industrial sales growth continues
to be constrained by slow
economic recovery
0.3%
0.4%
0.0%
0.5%
0.9%
0.7%
0.3%
0.7%
2013 -
2015
Projected
Sales
Growth
–
Gas*
2013 –
2015
Projected Sales Growth –
Electric*
Residential
Commercial
Industrial
Total
Residential
Commercial
Industrial
Total
110
*WEATHER NORMALIZED ESTIMATED ANNUAL GROWTH PER YEAR OVER FORECAST
PERIOD; PROJECTED SALES GROWTH FOR 2013 - 2015 GAS INCLUDES ONLY
FIRM SALES. |
 Items Excluded from Income from Continuing
Operations/Net Income to Reconcile to Operating Earnings
2012
2011
2010
2009
2008
Earnings Impact ($ Millions)
Gain (Loss) on Nuclear Decommissioning Trust (NDT)
Fund Related Activity (PSEG Power)
52
$
50
$
46
$
9
$
(71)
$
Gain (Loss) on Mark-to-Market (MTM) (PSEG Power)
(10)
107
(1)
(11)
14
Lease Transaction Activity (Energy Holdings)
36
(173)
-
29
(490)
Storm O&M (PSEG Power)
(39)
-
-
-
-
Market Transition Charge Refund (PSE&G)
-
-
(72)
-
-
Gain (Loss) on Asset Sales and Impairments (Energy Holdings)
-
34
-
-
(13)
Total Pro-forma adjustments
39
$
18
$
(27)
$
27
$
(560)
$
Fully Diluted Average Shares Outstanding (in Millions)
507
507
507
507
508
Per Share Impact (Diluted)
Gain (Loss) on NDT Fund Related Activity (PSEG Power)
0.10
$
0.10
$
0.09
$
0.02
$
(0.14)
$
Gain (Loss) on MTM (PSEG Power)
(0.02)
0.21
-
(0.02)
0.03
Lease Transaction Activity (Energy Holdings)
0.07
(0.34)
-
0.05
(0.96)
Storm O&M (PSEG Power)
(0.08)
-
-
-
-
Market Transition Charge Refund (PSE&G)
-
-
(0.14)
-
-
Gain (Loss) on Asset Sales and Impairments (Energy Holdings)
-
0.06
-
-
(0.03)
Total Pro-forma adjustments
0.07
$
0.03
$
(0.05)
$
0.05
$
(1.10)
$
For the Year Ended
December 31,
(Unaudited)
Pro-forma Adjustments, net of tax
A
PLEASE SEE PAGE 4 FOR AN EXPLANATION OF PSEG’S USE OF OPERATING EARNINGS
AS A NON-GAAP FINANCIAL MEASURE AND HOW IT DIFFERS FROM INCOME FROM
CONTINUING OPERATIONS/NET INCOME. |
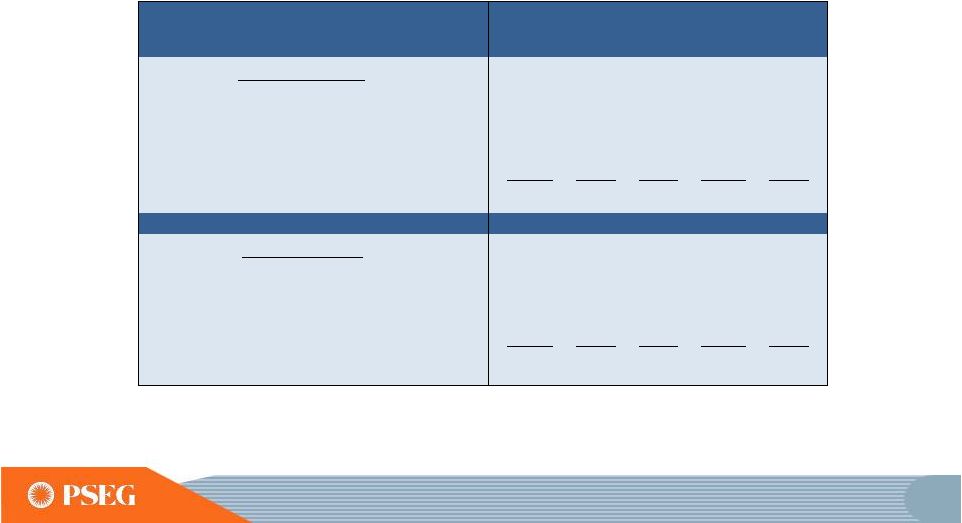
 Items Excluded from Income from Continuing
Operations/Net Income to Reconcile to Operating Earnings
B
2013
2012
2013
2012
Gain (Loss) on Nuclear Decommissioning Trust (NDT)
Fund Related Activity (PSEG Power)
8
$
4
$
17
$
9
$
Gain (Loss) on Mark-to-Market (MTM)
(a)
(PSEG Power)
80
(10)
(25)
42
Lease Related Activity (PSEG Energy Holdings)
-
2
-
6
Storm O&M, (PSEG Power)
2
-
(15)
-
Total Pro-forma adjustments
90
$
(4)
$
(23)
$
57
$
Fully Diluted Average Shares Outstanding (in Millions)
507
507
507
507
Per Share Impact (Diluted)
Gain (Loss) on NDT Fund Related Activity (PSEG Power)
0.02
$
0.01
$
0.04
$
0.02
$
Gain (Loss) on MTM
(a)
(PSEG Power)
0.16
(0.02)
(0.05)
0.08
Lease Related Activity (PSEG Energy Holdings)
-
-
-
0.01
Storm O&M, (PSEG Power)
-
-
(0.03)
-
Total Pro-forma adjustments
0.18
$
(0.01)
$
(0.04)
$
0.11
$
(a) Includes the financial impact from positions with forward delivery
months. Three Months Ended
Six Months Ended
PUBLIC SERVICE ENTERPRISE GROUP INCORPORATED
Reconciling Items Excluded from Income from Continuing Operations/Net Income to
Compute Operating Earnings (Unaudited)
June 30,
June 30,
Pro-forma Adjustments, net of tax
PLEASE SEE PAGE 4 FOR AN EXPLANATION OF PSEG’S USE OF OPERATING EARNINGS
AS A NON-GAAP FINANCIAL MEASURE AND HOW IT DIFFERS FROM INCOME FROM
CONTINUING OPERATIONS/NET INCOME.
Earnings Impact ($ Millions) |