Attached files
| file | filename |
|---|---|
| 8-K - 8-K - Brookfield Property REIT Inc. | a13-21135_18k.htm |
Exhibit 99.1
|
|
September 2013 |
|
|
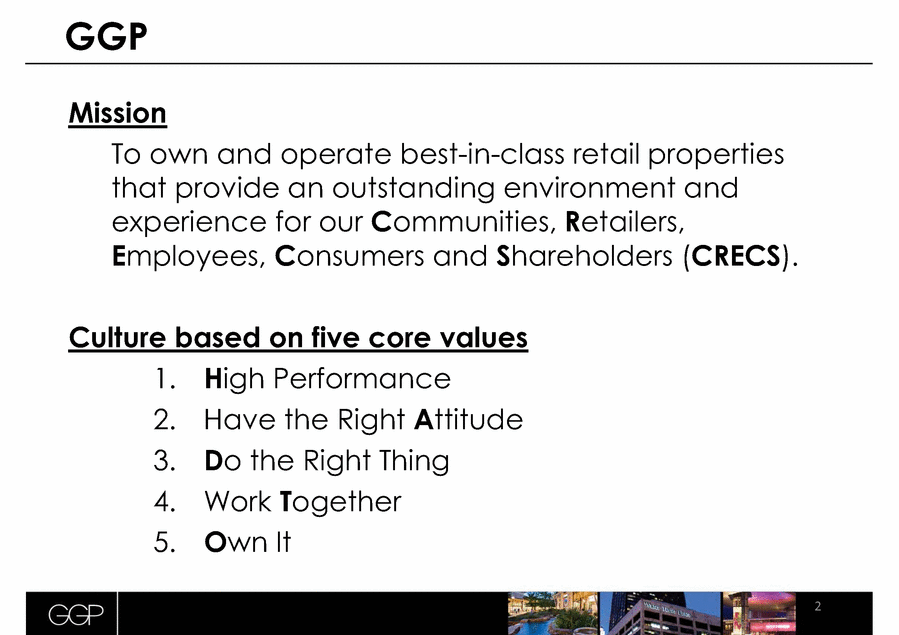
Mission To own and operate best-in-class retail properties that provide an outstanding environment and experience for our Communities, Retailers, Employees, Consumers and Shareholders (CRECS). Culture based on five core values 1. High Performance 2. Have the Right Attitude 3. Do the Right Thing 4. Work Together 5. Own It 2 GGP |
|
|
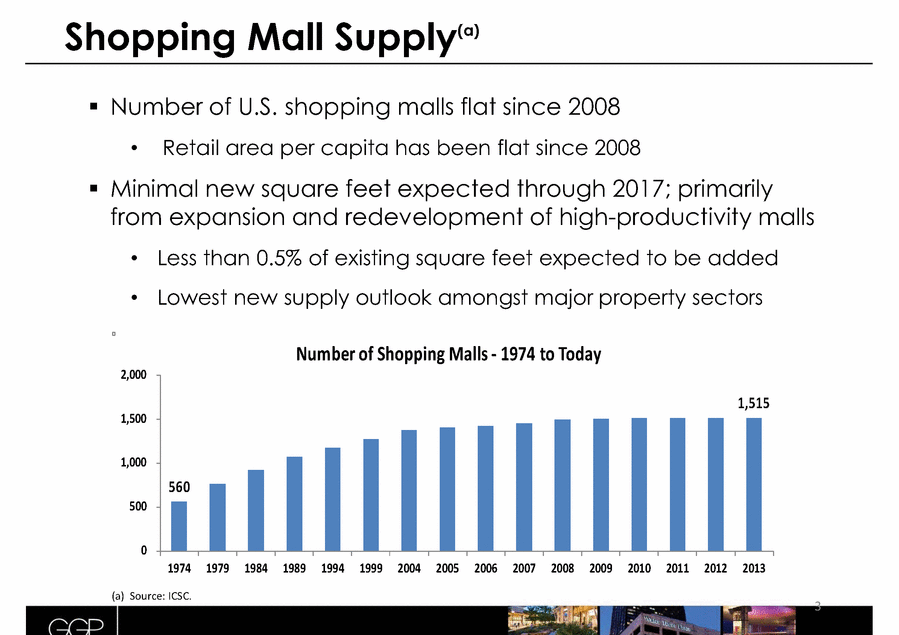
Number of U.S. shopping malls flat since 2008 • Retail area per capita has been flat since 2008 Minimal new square feet expected through 2017; primarily from expansion and redevelopment of high-productivity malls • Less than 0.5% of existing square feet expected to be added • Lowest new supply outlook amongst major property sectors 3 Shopping Mall Supply(a) 560 1,515 0 500 1,000 1,500 2,000 1974 1979 1984 1989 1994 1999 2004 2005 2006 2007 2008 2009 2010 2011 2012 2013 Number of Shopping Malls - 1974 to Today (a) Source: ICSC. |
|
|
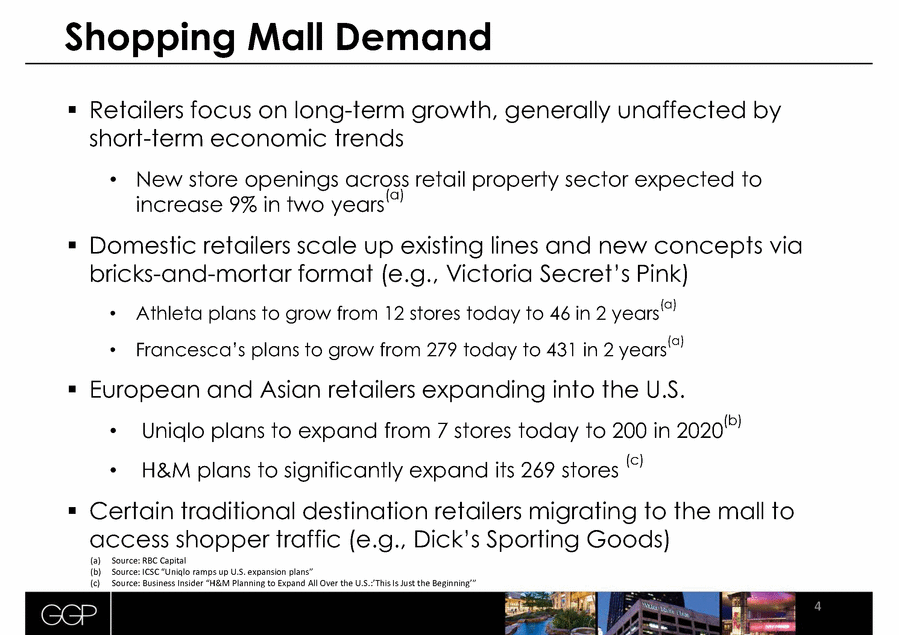
4 Retailers focus on long-term growth, generally unaffected by short-term economic trends • New store openings across retail property sector expected to increase 9% in two years (a) Domestic retailers scale up existing lines and new concepts via bricks-and-mortar format (e.g., Victoria Secret’s Pink) • Athleta plans to grow from 12 stores today to 46 in 2 years (a) • Francesca’s plans to grow from 279 today to 431 in 2 years (a) European and Asian retailers expanding into the U.S. • Uniqlo plans to expand from 7 stores today to 200 in 2020 (b) • H&M plans to significantly expand its 269 stores (c) Certain traditional destination retailers migrating to the mall to access shopper traffic (e.g., Dick’s Sporting Goods) Shopping Mall Demand (a) Source: RBC Capital (b) Source: ICSC “Uniqlo ramps up U.S. expansion plans” (c) Source: Business Insider “H&M Planning to Expand All Over the U.S.:’This Is Just the Beginning’” |
|
|
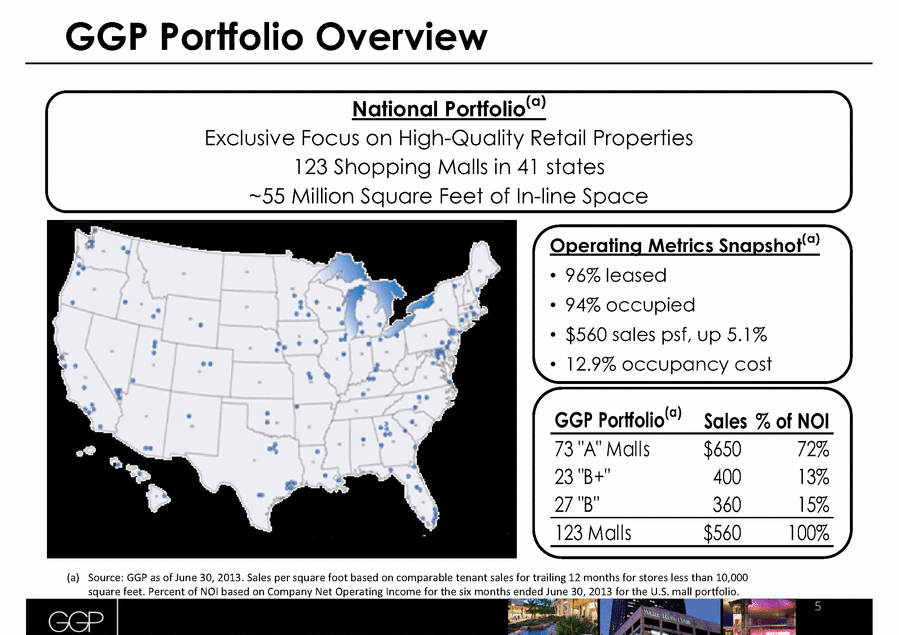
5 GGP Portfolio Overview Operating Metrics Snapshot(a) • 96% leased • 94% occupied • $560 sales psf, up 5.1% • 12.9% occupancy cost National Portfolio(a) Exclusive Focus on High-Quality Retail Properties 123 Shopping Malls in 41 states ~55 Million Square Feet of In-line Space GGP Portfolio(a) Sales % of NOI 73 "A" Malls $650 72% 23 "B+" 400 13% 27 "B" 360 15% 123 Malls $560 100% (a) Source: GGP as of June 30, 2013. Sales per square foot based on comparable tenant sales for trailing 12 months for stores less than 10,000 square feet. Percent of NOI based on Company Net Operating Income for the six months ended June 30, 2013 for the U.S. mall portfolio. |
|
|
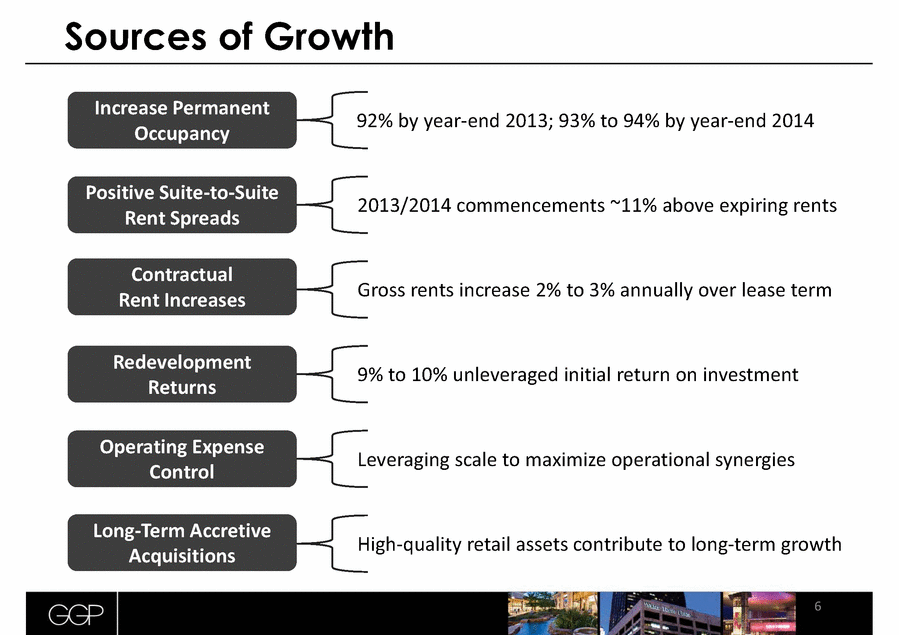
6 Sources of Growth Increase Permanent Occupancy Positive Suite-to-Suite Rent Spreads Contractual Rent Increases Redevelopment Returns Operating Expense Control Long-Term Accretive Acquisitions 92% by year-end 2013; 93% to 94% by year-end 2014 2013/2014 commencements ~11% above expiring rents Gross rents increase 2% to 3% annually over lease term 9% to 10% unleveraged initial return on investment Leveraging scale to maximize operational synergies High-quality retail assets contribute to long-term growth |
|
|
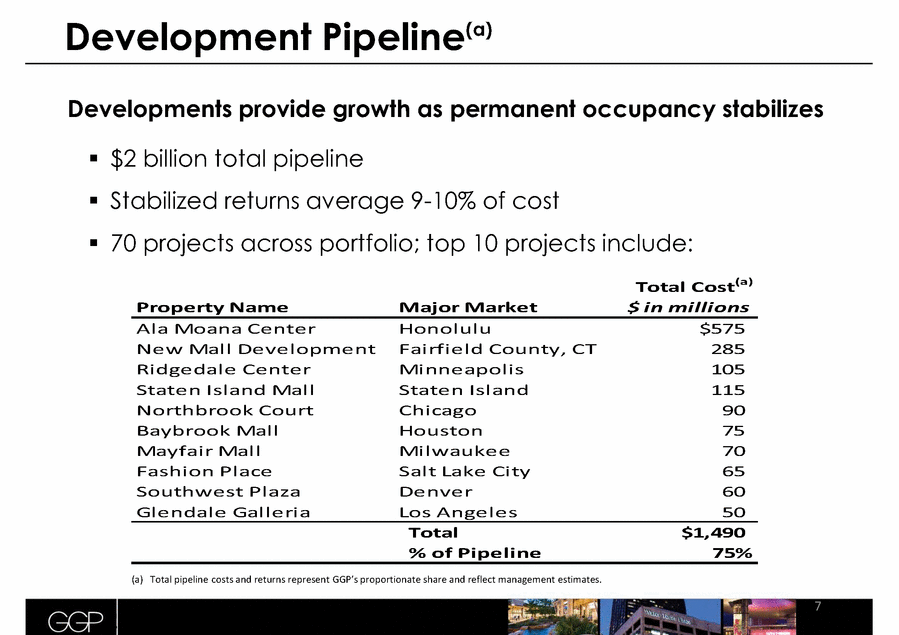
(a) Source: International Council of Shopping Centers (“ICSC”) (b) Green Street Advisors, Inc. 7 Development Pipeline(a) Developments provide growth as permanent occupancy stabilizes $2 billion total pipeline Stabilized returns average 9-10% of cost 70 projects across portfolio; top 10 projects include: Total Cost(a) Property Name Major Market $ in millions Ala Moana Center Honolulu $575 New Mall Development Fairfield County, CT 285 Ridgedale Center Minneapolis 105 Staten Island Mall Staten Island 115 Northbrook Court Chicago 90 Baybrook Mall Houston 75 Mayfair Mall Milwaukee 70 Fashion Place Salt Lake City 65 Southwest Plaza Denver 60 Glendale Galleria Los Angeles 50 Total $1,490 % of Pipeline 75% (a) Total pipeline costs and returns represent GGP’s proportionate share and reflect management estimates. |
|
|
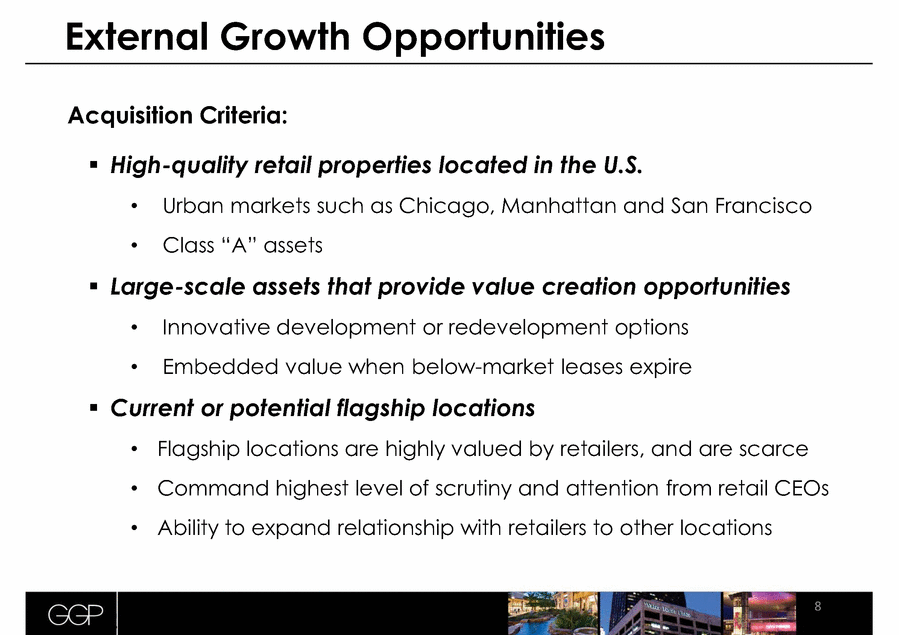
(a) Source: International Council of Shopping Centers (“ICSC”) (b) Green Street Advisors, Inc. 8 External Growth Opportunities Acquisition Criteria: High-quality retail properties located in the U.S. • Urban markets such as Chicago, Manhattan and San Francisco • Class “A” assets Large-scale assets that provide value creation opportunities • Innovative development or redevelopment options • Embedded value when below-market leases expire Current or potential flagship locations • Flagship locations are highly valued by retailers, and are scarce • Command highest level of scrutiny and attention from retail CEOs • Ability to expand relationship with retailers to other locations |
|
|
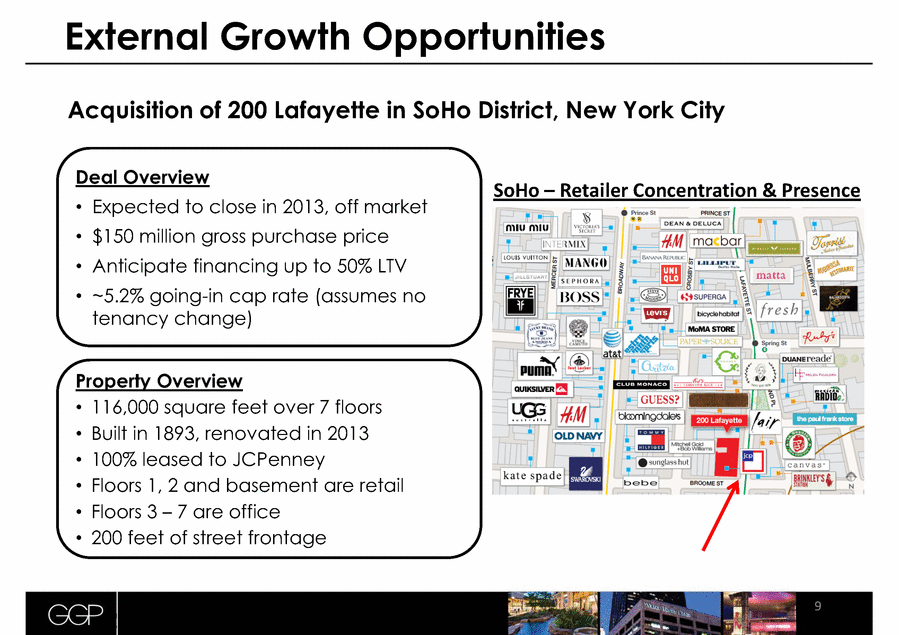
(a) Source: International Council of Shopping Centers (“ICSC”) (b) Green Street Advisors, Inc. 9 External Growth Opportunities Acquisition of 200 Lafayette in SoHo District, New York City Deal Overview • Expected to close in 2013, off market • $150 million gross purchase price • Anticipate financing up to 50% LTV • ~5.2% going-in cap rate (assumes no tenancy change) Property Overview • 116,000 square feet over 7 floors • Built in 1893, renovated in 2013 • 100% leased to JCPenney • Floors 1, 2 and basement are retail • Floors 3 – 7 are office • 200 feet of street frontage SoHo – Retailer Concentration & Presence |
|
|
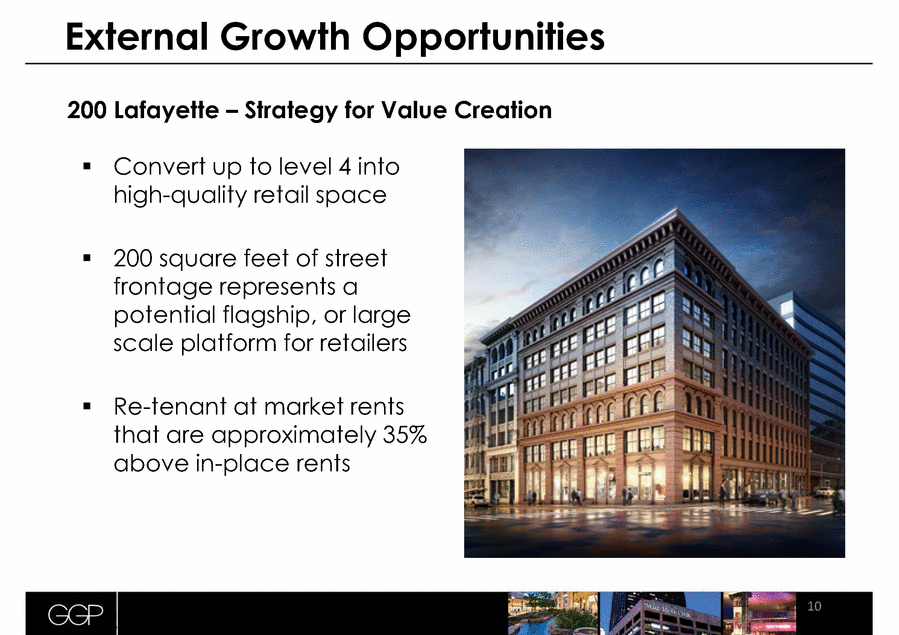
(a) Source: International Council of Shopping Centers (“ICSC”) (b) Green Street Advisors, Inc. 10 External Growth Opportunities Convert up to level 4 into high-quality retail space 200 square feet of street frontage represents a potential flagship, or large scale platform for retailers Re-tenant at market rents that are approximately 35% above in-place rents 200 Lafayette – Strategy for Value Creation |
|
|
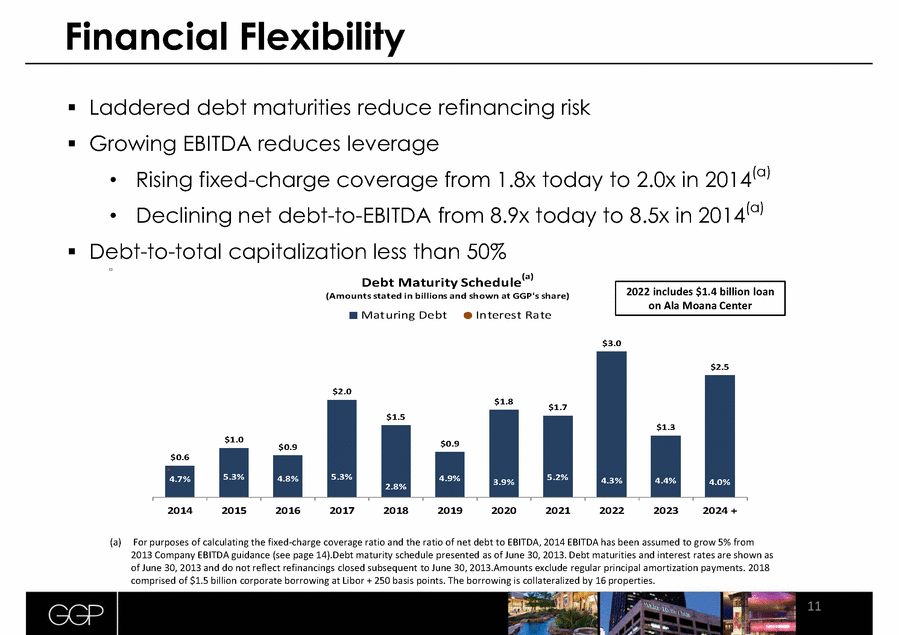
11 Financial Flexibility Laddered debt maturities reduce refinancing risk Growing EBITDA reduces leverage • Rising fixed-charge coverage from 1.8x today to 2.0x in 2014(a) • Declining net debt-to-EBITDA from 8.9x today to 8.5x in 2014(a) Debt-to-total capitalization less than 50% (a) For purposes of calculating the fixed-charge coverage ratio and the ratio of net debt to EBITDA, 2014 EBITDA has been assumed to grow 5% from 2013 Company EBITDA guidance (see page 14).Debt maturity schedule presented as of June 30, 2013. Debt maturities and interest rates are shown as of June 30, 2013 and do not reflect refinancings closed subsequent to June 30, 2013.Amounts exclude regular principal amortization payments. 2018 comprised of $1.5 billion corporate borrowing at Libor + 250 basis points. The borrowing is collateralized by 16 properties. $0.6 $1.0 $0.9 $2.0 $1.5 $0.9 $1.8 $1.7 $3.0 $1.3 $2.5 4.7% 5.3% 4.8% 5.3% 2.8% 4.9% 3.9% 5.2% 4.3% 4.4% 4.0% 0% 5% 10% 15% 20% 25% 30% 35% 40% 45% 50% $0.0 $0.5 $1.0 $1.5 $2.0 $2.5 $3.0 $3.5 $4.0 2014 2015 2016 2017 2018 2019 2020 2021 2022 2023 2024 + Debt Maturity Schedule (a) (Amounts stated in billions and shown at GGP's share) Maturing Debt Interest Rate 2022 includes $1.4 billion loan on Ala Moana Center |
|
|
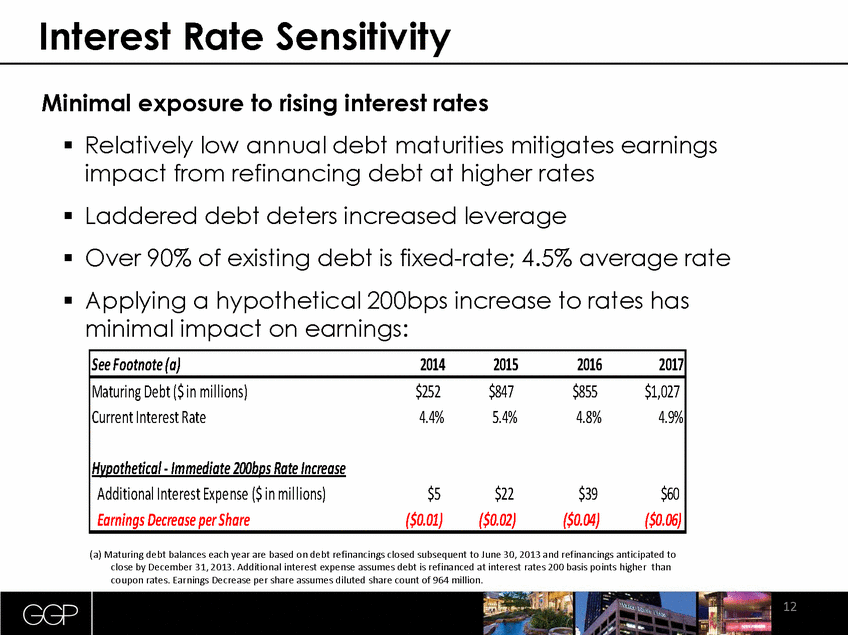
12 Interest Rate Sensitivity Minimal exposure to rising interest rates Relatively low annual debt maturities mitigates earnings impact from refinancing debt at higher rates Laddered debt deters increased leverage Over 90% of existing debt is fixed-rate; 4.5% average rate Applying a hypothetical 200bps increase to rates has minimal impact on earnings: See Footnote (a) 2014 2015 2016 2017 Maturing Debt ($ in millions) $252 $847 $855 $1,027 Current Interest Rate 4.4% 5.4% 4.8% 4.9% Hypothetical - Immediate 200bps Rate Increase Additional Interest Expense ($ in millions) $5 $22 $39 $60 Earnings Decrease per Share ($0.01) ($0.02) ($0.04) ($0.06) (a) Maturing debt balances each year are based on debt refinancings closed subsequent to June 30, 2013 and refinancings anticipated to close by December 31, 2013. Additional interest expense assumes debt is refinanced at interest rates 200 basis points higher than coupon rates. Earnings Decrease per share assumes diluted share count of 964 million. |
|
|
13 Sustainability Strong and growing commitment State-of-the-art energy monitoring systems, employment of hybrid energy sources, conservation of natural resources and waste recycling Public disclosure of sustainability priorities and programs available through newly issued sustainability report Respondent to annual survey conducted by Global Real Estate Sustainability Benchmark |
|
|
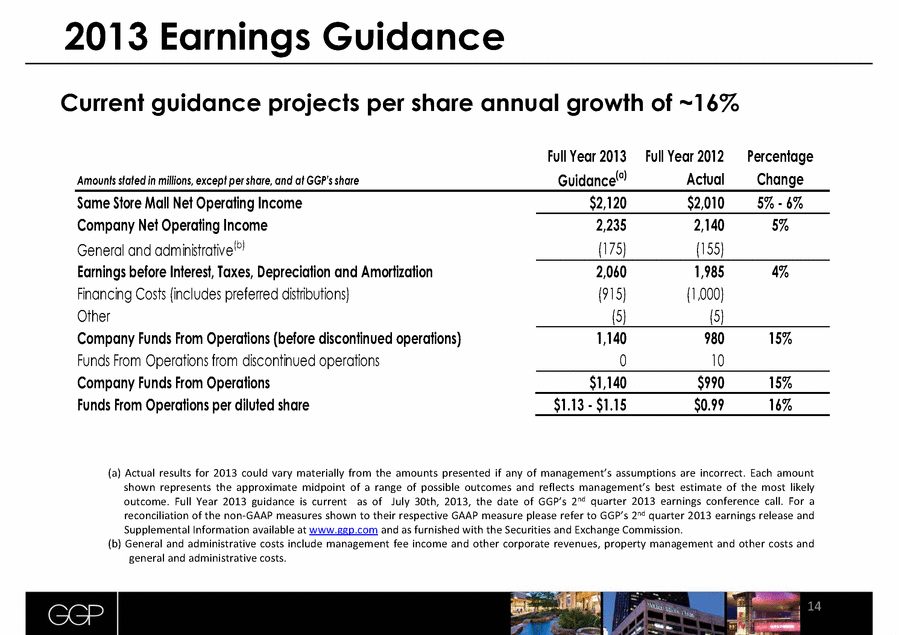
14 (a) Actual results for 2013 could vary materially from the amounts presented if any of management’s assumptions are incorrect. Each amount shown represents the approximate midpoint of a range of possible outcomes and reflects management’s best estimate of the most likely outcome. Full Year 2013 guidance is current as of July 30th, 2013, the date of GGP’s 2nd quarter 2013 earnings conference call. For a reconciliation of the non-GAAP measures shown to their respective GAAP measure please refer to GGP’s 2nd quarter 2013 earnings release and Supplemental Information available at www.ggp.com and as furnished with the Securities and Exchange Commission. (b) General and administrative costs include management fee income and other corporate revenues, property management and other costs and general and administrative costs. 2013 Earnings Guidance Current guidance projects per share annual growth of ~16% Full Year 2013 Full Year 2012 Percentage Guidance(a) Actual Change Same Store Mall Net Operating Income $2,120 $2,010 5% - 6% Company Net Operating Income 2,235 2,140 5% General and administrative(b) (175) (155) Earnings before Interest, Taxes, Depreciation and Amortization 2,060 1,985 4% Financing Costs (includes preferred distributions) (915) (1,000) Other (5) (5) Company Funds From Operations (before discontinued operations) 1,140 980 15% Funds From Operations from discontinued operations 0 10 Company Funds From Operations $1,140 $990 15% Funds From Operations per diluted share $1.13 - $1.15 $0.99 16% Amounts stated in millions, except per share, and at GGP's share |
|
|
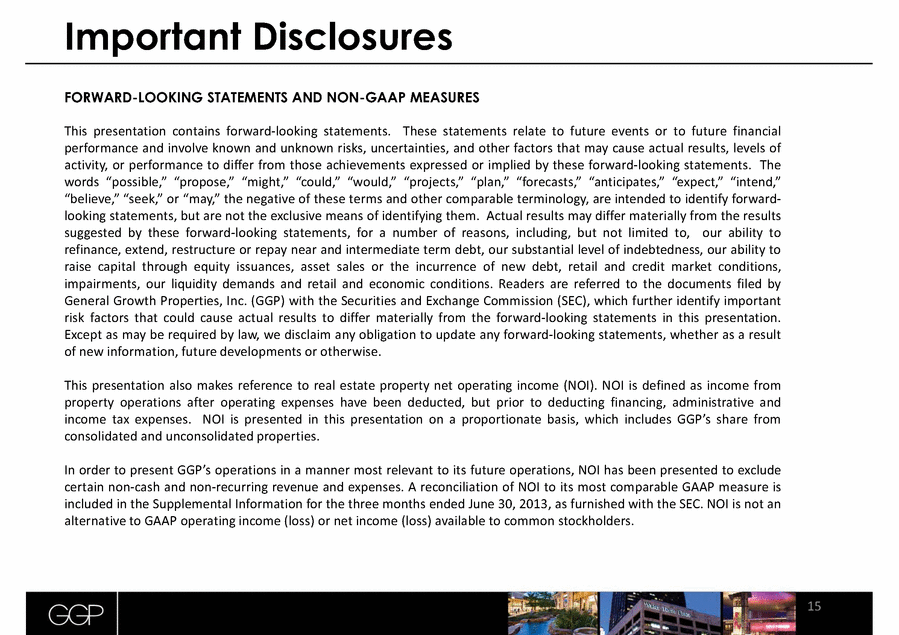
FORWARD-LOOKING STATEMENTS AND NON-GAAP MEASURES This presentation contains forward-looking statements. These statements relate to future events or to future financial performance and involve known and unknown risks, uncertainties, and other factors that may cause actual results, levels of activity, or performance to differ from those achievements expressed or implied by these forward-looking statements. The words “possible,” “propose,” “might,” “could,” “would,” “projects,” “plan,” “forecasts,” “anticipates,” “expect,” “intend,” “believe,” “seek,” or “may,” the negative of these terms and other comparable terminology, are intended to identify forward-looking statements, but are not the exclusive means of identifying them. Actual results may differ materially from the results suggested by these forward-looking statements, for a number of reasons, including, but not limited to, our ability to refinance, extend, restructure or repay near and intermediate term debt, our substantial level of indebtedness, our ability to raise capital through equity issuances, asset sales or the incurrence of new debt, retail and credit market conditions, impairments, our liquidity demands and retail and economic conditions. Readers are referred to the documents filed by General Growth Properties, Inc. (GGP) with the Securities and Exchange Commission (SEC), which further identify important risk factors that could cause actual results to differ materially from the forward-looking statements in this presentation. Except as may be required by law, we disclaim any obligation to update any forward-looking statements, whether as a result of new information, future developments or otherwise. This presentation also makes reference to real estate property net operating income (NOI). NOI is defined as income from property operations after operating expenses have been deducted, but prior to deducting financing, administrative and income tax expenses. NOI is presented in this presentation on a proportionate basis, which includes GGP’s share from consolidated and unconsolidated properties. In order to present GGP’s operations in a manner most relevant to its future operations, NOI has been presented to exclude certain non-cash and non-recurring revenue and expenses. A reconciliation of NOI to its most comparable GAAP measure is included in the Supplemental Information for the three months ended June 30, 2013, as furnished with the SEC. NOI is not an alternative to GAAP operating income (loss) or net income (loss) available to common stockholders. 15 Important Disclosures |
|
|
Michael Berman Executive Vice President and Chief Financial Officer michael.berman@ggp.com (312) 960-5044 Kevin Berry Vice President of Investor Relations kevin.berry@ggp.com (312) 960-5529 General Growth Properties, Inc. (NYSE: GGP) 110 North Wacker Drive Chicago, IL 60606 www.ggp.com 16 Contact Information |
|
|
17 |


