Attached files
| file | filename |
|---|---|
| 8-K - FORM 8-K - CINCINNATI FINANCIAL CORP | v355593_8k.htm |
Cincinnati Financial Corporation Steven J. Johnston, FCAS, MAAA, CFA, CERA President and Chief Executive Officer KBW Insurance Conference September 25, 2013 1
Nasdaq : CINF • This presentation contains forward - looking statements that involve risks and uncertainties. Please refer to our various filings with the U.S. Securities and Exchange Commission for factors that could cause results to materially differ from those discussed. • The forward - looking information in this presentation has been publicly disclosed, most recently on July 25, 2013, and should be considered to be effective only as of that date. Its inclusion in this document is not intended to be an update or reaffirmation of the forward - looking information as of any later date. • Reconciliations of non - GAAP measures are in our most recent quarterly earnings news release, which is available on the Investors page of our website cinfin.com . 2

Cincinnati Financial Profile • Among the 25 largest U.S. property casualty insurers – Rated A + Superior by A.M. Best • Increased shareholder dividend for 53 consecutive years – A record matched by only 9 other publicly traded companies • $ 3.5 billion 2012 premiums through select agencies in 39 states – Rank # 1 or # 2 in near ly 75% of agencies appointed more than five years Life 5% Commercial Lines 67% Personal Lines 25% Excess & Surplus 3% 3

Value Creation Focus Three performance drivers Combined ratio consistently within 95% to 100% Premium g rowth above industry average Investment income growth and equity portfolio total return Value for shareholders 4

Total Shareholder Return Cumulative total return through September 16, 2013, in percent 22.6 64.5 67.0 112.9 113.9 20.9 40.2 43.1 64.7 87.0 25.6 51.0 51.0 65.6 100.4 Since 12/31/12 Since 12/31/11 Since 12/31/2010 Since 12/31/2009 Since 12/31/2001 Cincinnati S&P 500 Index S&P P/C Index 5

Strategic Competitive Advantages Agent - Centered Model Field Focus Claims Service Financial Strength Ethical Behavior 6

Profitability Improvement Initiatives • Enhancing underwriting expertise and knowledge – Property loss mitigation efforts • Increasing specialized staff expertise • More property inspections • Greater use of wind and hail deductibles • Covering older roofs at actual cash value – Ongoing development of predictive modeling, pricing precision – Data management for better underwriting and pricing decisions • Technology is improving efficiencies, streamlining processing for agencies and the company 7

Greater Pricing Precision Is Improving Profit Margins Commercial Package Policy mid - 2013 renewal price increase averages by modeled pricing segments illustrates pricing precision effects Most adequate refers to policies that need less price increase based on pricing adequacy of expiring premium per pricing mode ls 0% 15% Most adequately priced Near (+ or -) price adequacy Least adequately priced 8

9 Drive Premium Growth • New agency appointments
• Expanding marketing and service capabilities • On pace to reach $5 billion target in 2015 Life E&S Personal Commercial Direct written premiums Average Annualized (In billions) Annual Growth Growth Since 1 - 1 - 12 $0.3 6% 5% 0.2 21% 24% $0.2 0.1 1.2 9% 11% 0.9 2.6 3.3 9% 11% Total $3.9 billion 2012 Actual $5.0 billion 2015 Projected

Steadily Increase Share of Agency Business 1.8% 5.4% 8.0% 16.1% 1 year or less 2-5 years 6-10 years 10 years or more Market share per agency reporting location by year appointed Based on 2012 standard market P&C agency written premiums (Excludes excess and surplus lines) 10

Cincinnati Financial Corporation Michael J. Sewell, CPA Chief Financial Officer, Senior Vice President and Treasurer KBW Insurance Conference September 25, 2013 11

Combined Ratio Reflects Improving Underwriting Profitability Trends 96.0% 86.1% 89.8% 89.1% 109.3% 96.1% 104.4% 93.9% Year 2011 Year 2012 YTD 6-12 YTD 6-13 Year 2011 Year 2012 YTD 6-12 YTD 6-13 Calendar Year basis - excl. cat. losses Calendar Year basis - incl. cat. losses 12

Invest for Income and Capital Appreciation Portfolio Mix at 06 - 30 - 13 Net Yield on Invested Assets 6% 76% 18% 2% 67% 31% Other Investments Bonds Common Stocks Other Investments Bonds Common Stocks Industry Cincinnati 4.39% 4.03% 4.02% 3.48% 4Q12 2Q13 4Q12 2Q13 Cincinnati Industry Source: SNL, statutory a ccounting b asis (Industry = U.S. Property Casualty) Yield decline: 36 basis points 54 basis points 13

Property Casualty Reserves Favorable Development for 24 Consecutive Years $3,498 $3,661 $3,811 $3,905 $3,813 2008 2009 2010 2011 2012 Reserve range at 12 - 31 - 12 Low end $ 3,598 High end $3,918 Carried at 67 th percentile Values shown are carried loss and loss expense reserves net of reinsurance Vertical bar represents reasonably likely range Calendar year development (Favorable) ($323) ($188) ($304) ($285) ($396) In millions Ex - cat development: (ratio to earned premiums) 9.8 % 9.3% 10.7 % 14
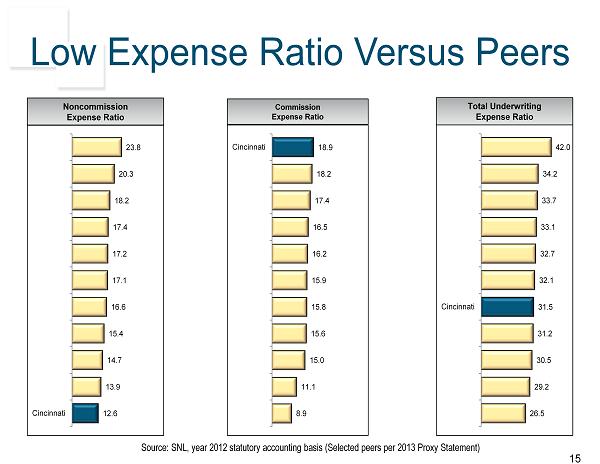
Low Expense Ratio Versus Peers Source: SNL, year 2012 statutory accounting basis (Selected peers per 2013 Proxy Statement) Commission Expense Ratio Noncommission Expense Ratio Total Underwriting Expense Ratio 26.5 29.2 30.5 31.2 31.5 32.1 32.7 33.1 33.7 34.2 42.0 Cincinnati 12.6 13.9 14.7 15.4 16.6 17.1 17.2 17.4 18.2 20.3 23.8 Cincinnati 8.9 11.1 15.0 15.6 15.8 15.9 16.2 16.5 17.4 18.2 18.9 Cincinnati 15

Increase Value for Shareholders Measured by Value Creation Ratio (VCR) -5% 0% 5% 10% 15% 20% 25% 2009 2010 2011 2012 6 mos 13 VCR - Investment Income & Other VCR - P&C Underwriting VCR - Bond Portfolio Gains (Losses) VCR - Equity Portfolio Gains 19.7% Target for the period 2013 - 2017: Annual VCR averaging 10% to 13% 11.1% 6.0 % 12.6% 6.4% 16
Why Invest in Cincinnati Financial • Potential for stock price appreciation based on long - term potential growth of earnings and book value • Clear strategy for profitable growth, proven record of execution • History of increasing dividend, attractive current yield • Solid capital position, high - quality balance sheet 17