Attached files
Table of Contents
As filed with the Securities and Exchange Commission on September 23, 2013.
Registration No. 333-
SECURITIES AND EXCHANGE COMMISSION
WASHINGTON, D.C. 20549
FORM S-1
REGISTRATION STATEMENT
UNDER
THE SECURITIES ACT OF 1933
MARCUS & MILLICHAP, INC.
(Exact Name of Registrant as Specified in Its Charter)
| Delaware | 6531 | 35-2478370 | ||
| (State or Other Jurisdiction of Incorporation or Organization) |
(Primary Standard Industrial Classification Code Number) |
(I.R.S. Employer Identification Number) |
23975 Park Sorrento, Suite 400
Calabasas, California 91302
(818) 212-2250
(Address, Including Zip Code, and Telephone Number, Including Area
Code, of Registrant’s Principal Executive Offices)
John J. Kerin
President and Chief Executive Officer
23975 Park Sorrento, Suite 400
Calabasas, California 91302
(818) 212-2250
(Name, Address Including Zip Code, and Telephone Number Including Area Code, of Agent for Service)
COPIES TO:
| John F. Seegal | Steven B. Stokdyk | |
| Brett Cooper | Latham & Watkins LLP | |
| Orrick, Herrington & Sutcliffe LLP | 355 South Grand Avenue | |
| 405 Howard Street | Los Angeles, California 90071 | |
| San Francisco, California 94105 (415) 773-5700 |
(213) 485-1234 |
Approximate date of commencement of proposed sale to the public:
As soon as practicable after the effective date of this Registration Statement.
If any of the securities being registered on this form are to be offered on a delayed or continuous basis pursuant to Rule 415 under the Securities Act of 1933, check the following box. ¨
If this form is filed to register additional securities for an offering pursuant to Rule 462(b) under the Securities Act, please check the following box and list the Securities Act registration statement number of the earlier effective registration statement for the same offering. ¨
If this form is a post-effective amendment filed pursuant to Rule 462(c) under the Securities Act, check the following box and list the Securities Act registration statement number of the earlier effective registration statement for the same offering. ¨
If this form is a post-effective amendment filed pursuant to Rule 462(d) under the Securities Act, check the following box and list the Securities Act registration statement number of the earlier effective registration statement for the same offering. ¨
Indicate by check mark whether the registrant is a large accelerated filer, an accelerated filer, a non-accelerated filer, or a smaller reporting company. See the definitions of “large accelerated filer,” “accelerated filer” and “smaller reporting company” in Rule 12b2 of the Exchange Act.
| Large accelerated filer | ¨ | Accelerated filer | ¨ | |||
| Non-accelerated filer | þ (Do not check if a smaller reporting company) | Smaller reporting company | ¨ | |||
CALCULATION OF REGISTRATION FEE
|
| ||||
| Title Of Each Class Of Securities To Be Registered |
Proposed Maximum Aggregate Offering Price (1)(2) |
Amount Of Registration Fee | ||
| Common Stock, par value $0.0001 |
$103,500,000 | $14,117.40 | ||
|
| ||||
|
| ||||
| (1) | Includes shares of Common Stock issuable upon exercise of the underwriters’ option to purchase additional shares. |
| (2) | Estimated solely for the purpose of computing the amount of the registration fee pursuant to Rule 457(o) under the Securities Act. |
The registrant hereby amends this registration statement on such date or dates as may be necessary to delay its effective date until the registrant shall file a further amendment which specifically states that this registration statement shall thereafter become effective in accordance with Section 8(a) of the Securities Act of 1933 or until this registration statement shall become effective on such date as the Commission, acting pursuant to said Section 8(a), may determine.
Table of Contents
The information in this preliminary prospectus is not complete and may be changed. We may not sell the securities until the registration statement filed with the Securities and Exchange Commission is effective. This preliminary prospectus is not an offer to sell these securities and it is not soliciting an offer to buy these securities in any jurisdiction where the offer or sale is not permitted.
Subject to Completion. Dated September 23, 2013.

Shares
Common Stock
$ per share
Marcus & Millichap, Inc. is offering shares of common stock and the selling stockholders named in this prospectus are offering shares.
This is an initial public offering of our common stock. Prior to this offering, there has been no public market for our common stock. We currently expect the initial public offering price will be between $ and $ per share. We have applied to list our common stock on the New York Stock Exchange, or the NYSE, under the symbol “MMI.”
Marcus & Millichap Company, or MMC, will exchange a portion of the shares of our common stock it owns for indebtedness of MMC held by some of MMC’s former and current stockholders, which we refer to, in such role, as the debt-for-equity exchange parties. The debt-for-equity exchange parties will then sell these shares pursuant to this offering along with the other selling stockholders. We will not receive any proceeds from the sale of the shares by the selling stockholders.
We are an “emerging growth company” under the federal securities laws. Investing in our common stock involves a high degree of risk. See “Risk Factors” beginning on page 10 of this prospectus to read about factors you should consider before buying shares of our common stock.
Neither the Securities and Exchange Commission nor any state securities commission has approved or disapproved of these securities or passed upon the adequacy or accuracy of this prospectus. Any representation to the contrary is a criminal offense.
| Per Share | Total | |||||||
| Initial price to public |
$ | $ | ||||||
| Underwriting discounts |
$ | $ | ||||||
| Proceeds, before expenses, to Marcus & Millichap, Inc. |
$ | $ | ||||||
| Proceeds, before expenses, to the selling stockholders |
$ | $ | ||||||
To the extent that the underwriters sell more than shares of common stock, the underwriters have the option to purchase up to an additional shares from us at the initial offering price less the underwriting discount.
The underwriters expect to deliver the shares against payment in New York, New York on or about , 2013.
Joint Book-Running Managers
| Citigroup | Goldman, Sachs & Co. |
Lead Manager
JMP Securities
Co-Manager
William Blair
Prospectus dated , 2013.
Table of Contents
![]()
Table of Contents
| 1 | ||||
| 10 | ||||
| 25 | ||||
| 26 | ||||
| 26 | ||||
| 27 | ||||
| 28 | ||||
| 29 | ||||
| 30 | ||||
| 36 | ||||
| Management’s Discussion and Analysis of Financial Condition and Results of Operations |
39 | |||
| 56 | ||||
| 62 | ||||
| 74 | ||||
| 87 | ||||
| 89 | ||||
| 93 | ||||
| 96 | ||||
| Material U.S. Federal Income Tax Consequences to Non-U.S. Holders |
98 | |||
| 102 | ||||
| 107 | ||||
| 107 | ||||
| 107 | ||||
| F-1 |
Through and including , 2013 (the 25th day after the date of this prospectus), all dealers effecting transactions in these securities, whether or not participating in this offering, may be required to deliver a prospectus. This is in addition to a dealer’s obligation to deliver a prospectus when acting as an underwriter and with respect to an unsold allotment or subscription.
We have not authorized anyone to provide any information or to make any representations other than those contained in this prospectus or in any free writing prospectuses we have prepared. We take no responsibility for, and can provide no assurance as to the reliability of, any other information that others may give you. This prospectus is an offer to sell only the shares offered hereby, but only under circumstances and in jurisdictions where it is lawful to do so. The information contained in this prospectus is current only as of its date.
Market, Industry and Other Data
Unless otherwise indicated, information contained in this prospectus concerning the commercial real estate industry and the markets in which we operate, including our general expectations and market position, market opportunity and market size, is based on information from various sources, on assumptions that we have made that are based on those data and other similar sources and on our knowledge of the commercial real estate market. These data involve a number of assumptions and limitations, and you are cautioned not to give undue weight to such estimates. While we believe our market position, market opportunity and market size information included in this prospectus is generally reliable, such information is inherently imprecise.
i
Table of Contents
This summary highlights important information contained elsewhere in this prospectus and does not contain all of the information that you should consider in making your investment decision. Before investing in our common stock, you should carefully read this entire prospectus, including our consolidated financial statements and the related notes included elsewhere in this prospectus and the information set forth under the headings “Risk Factors” and “Management’s Discussion and Analysis of Financial Condition and Results of Operations.” Immediately prior to the completion of this offering, Marcus & Millichap Company will complete a spin-off of its real estate investment services business and Marcus & Millichap Real Estate Investment Services, Inc. will become our wholly owned subsidiary. Unless the context requires otherwise, the words “Marcus & Millichap,” “Marcus & Millichap Real Estate Investment Services,” “MMREIS,” “we,” the “company,” “us” and “our” refer to Marcus & Millichap, Inc., Marcus & Millichap Real Estate Investment Services, Inc. and its other consolidated subsidiaries.
Our Company
Marcus & Millichap is a leading national brokerage firm specializing in commercial real estate investment sales, financing, research and advisory services. We have been the top commercial real estate investment broker in the United States based on the number of transactions over the last 10 years. We have more than 1,100 investment sales and financing professionals in 73 offices who provide investment brokerage and financing services to sellers and buyers of commercial real estate. We also offer market research, consulting and advisory services to our clients. In 2012, we closed more than 6,100 sales and financing transactions with total volume of approximately $22 billion.
We focus primarily on the private client segment, consisting of transactions with prices under $10 million. The private client segment consistently comprises over 80% of the total number of property transactions in the commercial real estate market. We devote our expertise and focus to the investment brokerage and financing business as opposed to other businesses, such as leasing or property management. Accordingly, our business model is unique from our national competitors, who focus primarily on the institutional real estate segment, and from our local and regional competitors, who lack a broad national platform. As the leading investment sales and financing firm in the private client market segment, we believe we are ideally positioned to capture significant growth opportunities.
We were founded in 1971 and are committed to building the leading national investment brokerage business. To achieve that goal, we underwrite, market and sell commercial real estate properties for private clients in a manner that maximizes value for sellers and provides buyers with the largest and most diverse inventory of commercial properties. Our business model is based on several key attributes: a focus on investment brokerage services, a critical mass of sales professionals providing consistent services and exclusive client representation, a national platform based on information sharing and powered by proprietary technology, a management team with investment brokerage experience, a financing team that is integrated with our investment sales force and research and advisory services tailored for our clients.
Our sales professionals are specialized by property type and by local market area, as we believe a focused expertise brings value to our clients. Our broad geographic coverage, property expertise, and significant relationships with both buyers and sellers provide connectivity and increase liquidity in our markets. By closing more transactions annually than any other firm, our sales professionals are able to provide clients with a broad and deep perspective on the investment real estate market locally, regionally and nationally.
We generate revenues by collecting brokerage commissions upon the sale and fees upon the financing of commercial properties and, in addition, by providing consulting and advisory services. In 2012, approximately 91% of our revenues were generated from real estate brokerage commissions, 6% from financing fees and 3% from other fees, including consulting and advisory services. Our revenues, Adjusted EBITDA and net income were $385.7 million, $59.7 million and $27.9 million, respectively, in 2012, compared to $274.7 million, $29.5
1
Table of Contents
million and $13.5 million, respectively, in 2011. Adjusted EBITDA is not a measure of our financial performance under U.S. GAAP. For a definition of Adjusted EBITDA and a reconciliation of Adjusted EBITDA to net income, see “Management’s Discussion and Analysis of Financial Condition and Results of Operations—Non-GAAP Financial Measure.”
Market Opportunity
The total value of U.S. commercial real estate assets was estimated to be $12 trillion at the end of 2012. Property sales in the commercial real estate sector for properties priced at $1 million and above reached over $340 billion, or approximately 37,000 transactions, in 2012. This was a 41% increase in dollar volume and 32% increase in the number of transactions over 2011, following a 32% increase in dollar volume and an 18% increase in the number of transactions over 2010.
Historically, the U.S. commercial real estate industry has tended to be cyclical. The commercial real estate market experienced a significant downturn from the 2007 peak to a trough in 2009, representing the most severe downturn in property sales since at least 1990. Since 2009, commercial property sales for transactions of $1 million and above have increased by 97% and dollar volume has increased by 235%. Such property sales in 2012, however, were still 16% below the 2007 peak in number of transactions and 32% below the peak in dollar volume. This cyclical upturn has been, and we believe will continue to be, primarily driven by attractive yields, improving property fundamentals and the availability and cost of financing.
Attractive Yields. According to Real Capital Analytics, average commercial real estate yields (capitalization rates) for the four major property types currently range from 6.1% to 7.8%, which compare favorably to alternative investments such as stocks and bonds. We believe these attractive yields are a key driver of improving capital inflows for commercial real estate investments.
Improving Property Fundamentals. Property fundamentals have improved since 2009, with multifamily properties in particular experiencing a strong recovery. We expect further increases in occupancy and rental rates in all four primary commercial real estate sectors of multifamily, retail, office and industrial properties.
Availability and Cost of Financing. The availability and low cost of debt financing has been a significant contributor to the recent improvement in the U.S. capital markets and the U.S. commercial real estate market. Low interest rates and improved access to capital are key factors fueling investment sales activity.
We divide the commercial real estate market into three major segments by investment size and focus primarily on the private client segment:
| • | Private client segment: properties with prices under $10 million; |
| • | Hybrid segment: properties with prices equal to or greater than $10 million and less than $20 million; and |
| • | Institutional segment: properties with prices of $20 million and above. |
We are the only firm with a national footprint that is also squarely focused on investment sales within the private client segment. The private client segment of properties with prices under $10 million has accounted for over 80% of commercial property sales by number of transactions for the last 10 years.
We have focused our business on this segment as we believe it represents the largest and most active market segment in the commercial real estate investment brokerage industry. Private clients, many of whom are individuals and partnerships, are impacted by life or partnership changes that often override market and macroeconomic conditions. Due to these personal and partnership drivers, properties in this segment exhibit a high turnover rate. Private clients often take advantage of rising prices to dispose of assets, refinance, acquire and/or exchange assets into new opportunities. The attractive financial results for property investment provide the opportunity for redeployment of capital, which supports a high number of sales transactions. Additionally, the
2
Table of Contents
private client segment is highly fragmented with a large number of buyers, sellers and properties in different geographic regions and sectors. It is also the most underserved market segment among the national full-service real estate investment brokerage firms, which have traditionally focused on institutional investors and corporate real estate owners and users. Most of our brokerage competition comes from local and regional brokers who lack a national platform and capability to serve private owners and investors across the country.
Our Competitive Strengths
We believe the following strengths provide us with a competitive advantage and opportunities for success:
National Platform Focused on Investment Brokerage. We are committed to building the leading national investment brokerage business. To achieve our goal, we focus on investment brokerage as opposed to other businesses such as leasing or property management. In addition, we combine proprietary technology and processes to market investment real estate with highly qualified sales professionals in 73 offices nationwide. Our commitment to specialization is also reflected in how we organize our sales professionals by property type and market area, further deepening the skills, relationships and market knowledge required for achieving the best results for our clients.
Market Leader in the Private Client Segment. We are the leading commercial real estate investment broker in the United States based on the number of transactions. We focus primarily on the private client segment of the market, consisting of transactions with prices under $10 million, which accounted for over 90% of our sales in 2012. This segment, representing the vast majority of the number of commercial properties in the United States, has high asset turnover rates due to personal circumstances and business reasons, such as death, divorce and changes in partnership and other personal or financial circumstances. The private client brokerage industry is highly fragmented and characterized by high barriers to entry. These barriers include the need for a large, specialized sales force prospecting private clients, the difficulty in identifying and establishing relationships with such investors and the challenge of serving their needs locally and nationally. For transactions in the $1 million to $10 million range nationally, the top 10 brokerage firms represented just 21% of commercial property sales in 2012. We believe our core business is the least covered segment by national firms, in addition to being significantly underserved by local and regional firms that lack a multi-market platform.
Integrated Platform for Real Estate Value Creation. We have built our business to maximize value for real estate investors through an integrated set of services geared toward our clients’ needs. We are committed to investment brokerage specialization, providing the largest sales force in the industry, fostering a culture and policy of information sharing on each asset we represent and using proprietary technology that facilitates real-time buyer-seller matching. We have one of the largest teams of financing professionals in the investment brokerage industry through our subsidiary, Marcus & Millichap Capital Corporation, or MMCC. MMCC provides financing expertise and access to debt capital by securing competitive loan pricing and terms for our clients. In 2012, MMCC closed more than 900 financings with an aggregate loan value of over $2 billion, making us a leading mortgage broker in the industry. Finally, our market research analyzes the latest local and national economic and real estate data, enabling our clients to make informed investment and financing decisions. These integrated services enable us to facilitate transactions for our clients across different property sectors and markets.
Management with Significant Investment Brokerage Experience. The majority of our managers are former senior sales professionals of the firm who now focus on management and do not compete with our sales force. As executives of the firm dedicated to hiring, training, developing and supporting our professionals, their investment brokerage background is extremely valuable. Almost all of our top sales professionals were hired without prior experience and were trained, developed and supported by our regional managers. Our comprehensive training and development programs rely greatly on the regional managers’ personal involvement. Their past experience as senior sales professionals plays a key role in helping our junior professionals establish technical and client service skills. Our regional managers also coach our sales professionals in setting up, managing and growing their business. We believe this management structure has helped the firm create a competitive advantage and achieve better results for our clients.
3
Table of Contents
Growth Strategy
We have a long track record of successful growth in our core business driven by opening new offices and by hiring, training and developing new sales and financing professionals. Since the implementation of our long-term growth plan in 1995, our revenue has increased sevenfold and we have grown from approximately 390 sales professionals in 22 offices to more than 1,100 sales and financing professionals in 73 offices. To drive our future growth, we continually seek to expand our national footprint and optimize the size, product segmentation and specialization of our team of sales and financing professionals. The key strategies of our growth plan include:
Increase Market Share in Our Core Business. The private client segment is highly fragmented, with the top 10 brokerage firms accounting for only 21% of 2012 sales in the $1 million to $10 million range, based on data from CoStar Group, Inc., or CoStar, and Real Capital Analytics. Despite our industry-leading market share of 7.8%, we believe there are opportunities to substantially enhance our position in the segment. We believe the largest opportunities are in private client multi-tenant office and industrial properties in which our 2012 market share was 2.8% and 0.7%, respectively. In addition, we believe there is still significant room for growth in multifamily and retail properties, where we had 2012 market share of 14.6% and 10.6%, respectively. We leverage our existing platform, relationships and brand recognition among private clients to grow through expanded marketing and coverage. Our growth plan includes the following components:
| • | Grow in Targeted Locations. Our plan targets specific markets and calls for both expansion of existing offices and opening additional offices. We have assigned key executives and managers to these markets and our recruiters have begun to hire additional experienced sales professionals. We have targeted markets based on population, employment, commercial real estate sales, inventory and competitive landscape. In addition, we have developed optimal office plans to capitalize on these factors by tailoring sales force size, coverage and composition by office and business segment. |
| • | Grow in Specialty Property Segments. We believe that specialty property segments, including hospitality, multifamily tax credit and affordable housing, student housing, manufactured housing, seniors housing and self-storage, offer significant room for growth. To take advantage of these opportunities, we are increasing our property type expertise by adding regional directors who can bring added management capacity, business development and sales professional support. |
| • | Increase Sales Professional Hiring. We grow our business by hiring, training and developing sales professionals. We have implemented several initiatives to increase both new and experienced sales professional hiring through our recruiting department, specialty directors and regional managers. |
Grow Financing Services. We are focused on growing our financing services provided through MMCC. Our mortgage brokerage business placed more than $2 billion of financings in 2012. We intend to execute this strategy by adding financing professionals in 16 offices that currently do not have an MMCC presence and enhancing our cross-selling training, education and internal branding to our sales professionals. We also plan to enhance MMCC’s service platform and expand our revenue sources by developing other services such as mezzanine financing, equity placement and conduit financing.
Expand Our Market Share of Larger Transactions. Our extensive relationships with private clients have enabled us to capture a greater portion of commercial real estate transactions in excess of $10 million and bridge the private and institutional capital markets in recent years. Our ability to connect private capital with institutional assets plays a major role in differentiating our services. In 2011, we introduced a division dedicated to serving major investors branded as Institutional Property Advisors, or IPA, in the multifamily sector. As a result, we rose from the 7th-ranked investment brokerage firm by dollar volume in the $25 million and above multifamily sector in 2010 to the 4th-ranked firm in 2012. This strategy has met with great success and market acceptance and provides a vehicle for further growth within the larger, institutional multifamily segment. This strategy also provides a model for expansion into institutional retail and office sectors.
4
Table of Contents
The Spin-Off
Prior to completion of this offering, MMC and the other stockholders of MMREIS will contribute all of the outstanding MMREIS shares to us, which we refer to as the Contribution, in exchange for our common stock. As a result, MMREIS will become our wholly owned subsidiary, and we will be owned by the former stockholders of MMREIS. MMC will then distribute to its shareholders, on a pro rata basis, at least 80% of its equity interest in us, which we refer to as the Distribution, and the stockholders of MMC will contribute all of their respective equity interests in us to a newly formed limited liability company.
MMC will undertake an exchange of our common stock for (i) MMC debt of approximately $24.0 million owed to two former MMC shareholders and (ii) MMC debt of approximately $25.5 million owed by Usonia Ventures, LLC, a wholly owned subsidiary of MMC, to George M. Marcus, which we refer to as the Debt-for-Equity Exchange. We refer to the former MMC shareholders and Mr. Marcus as the debt-for-equity exchange parties. It is expected that the debt-for-equity exchange parties will sell all of the stock that they receive in the Debt-for-Equity Exchange to the public in this offering along with the other selling stockholders. We refer to the Contribution, Debt-for-Equity Exchange and Distribution, collectively, as the Spin-Off. See “The Spin-Off.”
In addition, prior to the completion of this offering, we and MMC intend to enter into certain agreements that will provide the terms for ongoing relationship with MMC. For a description of these agreements, see “Certain Relationships and Related Transactions—Relationship with Marcus & Millichap Company.”
Emerging Growth Company Status
We currently are an “emerging growth company,” as defined in the Jumpstart Our Business Startups Act of 2012, or the JOBS Act, and are eligible to take advantage of certain exemptions from various reporting requirements that are applicable to other public companies that are not “emerging growth companies,” including, but not limited to, not being required to comply with the auditor attestation requirements of Section 404 of the Sarbanes Oxley Act of 2002, reduced disclosure obligations regarding executive compensation in our periodic reports and proxy statements and exemptions from the requirements of holding a non-binding advisory vote on executive compensation and stockholder approval of any golden parachute payments not previously approved. If we take advantage of any of these exemptions, we do not know if some investors will find our common stock less attractive as a result.
We have irrevocably elected to opt out of the extended transition period for complying with new or revised accounting standards pursuant to Section 107(b) of the JOBS Act, and therefore, we will be subject to the same new or revised accounting standards as other public companies that are not “emerging growth companies.”
We could remain an “emerging growth company” for up to five years, or until the earliest of (i) the last day of the first fiscal year in which our annual gross revenues exceed $1 billion, (ii) the date that we become a “large accelerated filer” as defined in Rule 12b-2 under the Securities Exchange Act of 1934, or the Exchange Act, which would occur if the market value of our common stock that is held by non-affiliates exceeds $700 million as of the last business day of our most recently completed second fiscal quarter, or (iii) the date on which we have issued more than $1 billion in non-convertible debt during the preceding three-year period.
5
Table of Contents
Risks Affecting Us
Our business is subject to a number of risks and uncertainties, including those described in the section entitled “Risk Factors” immediately following this prospectus summary. These risks include the following:
| • | General economic conditions and commercial real estate market conditions have had and may in the future have a negative impact on our business; |
| • | If we are unable to attract and retain qualified and experienced managers, sales and financing professionals, our growth may be limited and our business and operating results could suffer; |
| • | If we lose the services of our executive officers or certain other members of our senior management team, we may not be able to execute our business strategy; |
| • | Our business could be hurt if we are unable to retain our business philosophy and culture of information-sharing and efforts to retain our philosophy and culture could adversely affect our ability to maintain and grow our business; and |
| • | The concentration of sales among our top sales professionals could lead to greater or more concentrated losses if we are unable to retain them. |
Corporate Information
We were formed as a sole proprietorship in 1971, incorporated in California on August 26, 1976 as G. M. Marcus & Company, and we were renamed as Marcus & Millichap, Inc. in August 1978, Marcus & Millichap Real Estate Investment Brokerage Company in September 1985, and Marcus & Millichap Real Estate Investment Services, Inc., or MMREIS, in February 2007. In June 2013, MMC formed a holding company called Marcus & Millichap, Inc. in Delaware. Prior to the completion of this offering, the shareholders of MMREIS will contribute the shares of MMREIS for common stock of Marcus & Millichap, Inc., and MMREIS will become a wholly owned subsidiary of Marcus & Millichap, Inc. See “The Spin-Off.”
Our principal executive offices are located at 23975 Park Sorrento, Suite 400, Calabasas, California 91302. Our telephone number at this location is (818) 212-2250. Our website address is http://www.marcusmillichap.com. Information contained on our website is not a part of this prospectus and the inclusion of our website address in this prospectus is an inactive textual reference only.
The Marcus & Millichap logo and other trademarks or service marks of Marcus & Millichap appearing in this prospectus are the property of MMREIS. Trade names, trademarks and service marks of other companies appearing in this prospectus are the property of the respective holders.
6
Table of Contents
The Offering
| Common stock offered by Marcus & Millichap, Inc. |
shares |
| Common stock offered by the selling stockholders |
shares |
| Common stock to be outstanding after this offering |
shares |
| Use of proceeds |
We estimate that the net proceeds to us from this offering, after deducting underwriting discounts and estimated offering expenses, will be approximately $ million, assuming the shares are offered at $ per share, which is the midpoint of the estimated offering price range set forth on the cover page of this prospectus. |
| We expect to use the net proceeds to us from this offering for general corporate purposes, including capital expenditures and working capital to expand our markets and services and potential acquisition of real estate businesses or companies. We will not receive any proceeds from the sale of shares of our common stock by the selling stockholders. |
| Debt-for-Equity Exchange |
In connection with this offering, MMC will exchange a portion of its shares of our common stock being sold in this offering for indebtedness of MMC held by the debt-for-equity exchange parties. The debt-for-equity exchange parties will then sell these shares pursuant to this offering along with the other selling stockholders. |
| Underwriter’s option |
We have granted the underwriters a 30-day option to purchase up to additional shares of our common stock from us at the initial public offering price less the underwriting discount. |
| Risk factors |
You should carefully read and consider the information set forth under “Risk Factors” beginning on page 10 of this prospectus and all other information set forth in this prospectus before investing in our common stock. |
| Proposed NYSE ticker symbol |
MMI |
Unless we indicate otherwise or the context requires, all information in this prospectus:
| • | assumes (1) no exercise of the underwriters’ option to purchase additional shares of our common stock and (2) an initial public offering price of $ per share, the midpoint of the initial public offering price range indicated on the cover of this prospectus. |
| • | does not reflect shares reserved for issuance upon exercise of stock options or other equity awards that may be granted under our 2013 Omnibus Equity Incentive Plan and shares reserved for issuance under our 2013 Employee Stock Purchase Plan. |
7
Table of Contents
Summary Financial Information
The following table includes summary historical financial data of Marcus & Millichap Real Estate Investment Services, Inc., or MMREIS, and unaudited pro forma financial data of MMREIS which gives effect to this offering and certain other transactions. Prior to the Spin-Off, Marcus & Millichap, Inc. will not have engaged in any business or other activities, except in connection with its formation and in preparation for this offering and the Spin-Off. We have prepared this information using the consolidated historical financial statements of MMREIS for the three years ended December 31, 2012 and the six-month periods ended June 30, 2013 and 2012. The historical consolidated financial statements for each of the three years in the period ended December 31, 2012 have been audited by Ernst & Young LLP, independent registered public accounting firm. The historical consolidated financial statements for the six-month periods ended June 30, 2013 and 2012 and the pro forma financial statements for the six-month period ended June 30, 2013 and the year ended December 31, 2012 have not been audited. The unaudited pro forma financial data reflects our historical consolidated financial position and results of operations, as adjusted for: (i) the termination of a tax-sharing agreement between MMC and MMREIS; (ii) the modification of certain restricted stock awards and stock appreciation rights, or SARs, held by the MMREIS managing directors, and grants of replacement awards; (iii) the payment of quarterly preferred dividends in July 2013 in the amount of $6.5 million and in October 2013 in the amount of $ million to distribute MMREIS’s earnings for the quarters ended June 30 and September 30, 2013, respectively, to MMC; and (iv) the net proceeds of this offering of $ million, as if such transactions had occurred on January 1, 2012 for the statements of income and on June 30, 2013 for the balance sheet. The unaudited pro forma financial data is presented for illustrative purposes only and is not necessarily indicative of what our actual financial position or actual results of operations would have been had the transactions referred to above occurred on the applicable dates, nor does it purport to represent the future financial position or results of operations of our company. You should read the following summary financial data together with our financial statements and related notes, and “Management’s Discussion and Analysis of Financial Condition and Results of Operations,” which are included elsewhere in this prospectus.
| Historical | Pro Forma | |||||||||||||||||||||||||||
| Year Ended December 31, | Six Months Ended June 30, |
Year
Ended December 31, 2012 |
Six Months Ended June 30, 2013 |
|||||||||||||||||||||||||
| (Dollars in thousands, except per share data) | 2010 | 2011 | 2012 | 2012 | 2013 | |||||||||||||||||||||||
| Statements of Income Data: |
||||||||||||||||||||||||||||
| Revenues: |
||||||||||||||||||||||||||||
| Real estate brokerage commissions |
$ | 198,366 | $ | 245,333 | $ | 351,407 | $ | 133,409 | $ |
156,963 |
|
$ | $ | |||||||||||||||
| Financing fees |
10,917 | 16,522 | 21,132 | 8,218 | 11,888 | |||||||||||||||||||||||
| Other revenues |
8,652 | 12,850 | 13,177 | 5,223 | 5,990 | |||||||||||||||||||||||
|
|
|
|
|
|
|
|
|
|
|
|
|
|
|
|||||||||||||||
| Total revenues |
217,935 | 274,705 | 385,716 | 146,850 | 174,841 | |||||||||||||||||||||||
| Operating expenses: |
||||||||||||||||||||||||||||
| Cost of services |
124,272 | 162,478 | 230,248 | 84,709 | 102,677 | |||||||||||||||||||||||
| Selling, general, and administrative expense |
76,438 | 85,801 | 103,479 | 45,900 | 53,824 | |||||||||||||||||||||||
| Depreciation and amortization expense |
3,333 | 2,971 | 2,981 | 1,495 | 1,514 | |||||||||||||||||||||||
|
|
|
|
|
|
|
|
|
|
|
|
|
|
|
|||||||||||||||
| Total operating expenses |
204,043 | 251,250 | 336,708 | 132,104 | 158,015 | |||||||||||||||||||||||
|
|
|
|
|
|
|
|
|
|
|
|
|
|
|
|||||||||||||||
| Operating income |
13,892 | 23,455 | 49,008 | 14,746 | 16,826 | |||||||||||||||||||||||
| Other income, net |
959 | 350 | 433 | 283 | 249 | |||||||||||||||||||||||
|
|
|
|
|
|
|
|
|
|
|
|
|
|
|
|||||||||||||||
| Income before provision for income taxes |
14,851 | 23,805 | 49,441 | 15,029 | 17,075 | |||||||||||||||||||||||
| Provision for income taxes |
6,460 | 10,355 | 21,507 | 6,538 | 7,428 | |||||||||||||||||||||||
|
|
|
|
|
|
|
|
|
|
|
|
|
|
|
|||||||||||||||
| Net income |
$ | 8,391 | $ | 13,450 | $ | 27,934 | $ | 8,491 | $ | 9,647 | $ | $ | ||||||||||||||||
|
|
|
|
|
|
|
|
|
|
|
|
|
|
|
|||||||||||||||
| Pro forma net income per share |
$ | $ | ||||||||||||||||||||||||||
| Adjusted EBITDA (1) |
$ | 18,743 | $ | 29,486 | $ | 59,708 | $ | 18,634 | $ | 21,131 | $ | $ | ||||||||||||||||
8
Table of Contents
| (1) | Adjusted EBITDA is not a measurement of our financial performance under U.S. GAAP and should not be considered as an alternative to net income, operating income or any other measures derived in accordance with U.S. GAAP. For a definition of Adjusted EBITDA and a reconciliation of Adjusted EBITDA to net income, see “Management’s Discussion and Analysis of Financial Condition and Results of Operations—Non-GAAP Financial Measure.” |
| As of June 30, 2013 | ||||||||||||
| Actual | Pro Forma | Pro Forma As Adjusted (1) |
||||||||||
| (in thousands) | ||||||||||||
| Balance Sheet Data: |
||||||||||||
| Cash and cash equivalents |
$ | 19,362 | $ | $ | ||||||||
| Total assets |
48,020 | |||||||||||
| Long-term debt |
— | |||||||||||
| Total liabilities |
39,858 | |||||||||||
| (1) | Gives effect to this offering and the application of the net proceeds from the sale of shares of common stock by us in this offering at an assumed public offering price of $ (the midpoint of the price range set forth on the cover page of this prospectus). |
9
Table of Contents
Investing in our common stock involves a high degree of risk. You should carefully consider the risks and uncertainties described below and the other information in this prospectus before deciding whether to invest in our common stock. If any of the following risks actually occur, our business, financial condition or operating results could be materially adversely affected. This could cause the trading price of our common stock to decline, and you may lose part or all of your investment.
Risks Related to Our Business
General economic conditions and commercial real estate market conditions have had and may in the future have a negative impact on our business.
We may be negatively impacted by periods of economic slowdowns, recessions and disruptions in the capital markets; credit and liquidity issues in the capital markets, including international, national, regional and local markets; and corresponding declines in the demand for commercial real estate investment and related services. Historically, commercial real estate markets, and in particular the U.S. commercial real estate market, have tended to be cyclical and related to the flow of capital to the sector, the condition of the economy as a whole and to the perceptions and confidence of the market participants as to the relevant economic outlook. Cyclicality in the real estate markets may lead to cyclicality in our earnings and significant volatility in our stock price. Real estate markets may “lag” the broader economy. This means that even when underlying economic fundamentals improve in a given market, it may take additional time for these improvements to translate into strength in the real estate markets. The “lag” may be exacerbated when banks delay their resolution of commercial real estate assets whose values are less than their associated loans.
Negative economic conditions, changes in interest rates, credit and liquidity issues in the capital markets, disruptions in capital markets and/or declines in the demand for commercial real estate investment and related services in international or domestic markets or in significant markets in which we do business, have had and could have in the future a material adverse effect on our business, results of operations and/or financial condition. In particular, the commercial real estate market is directly impacted by the lack of debt and/or equity for commercial real estate transactions, increased interest rates and changes in monetary policies by the Federal Reserve, changes in the perception that commercial real estate is an accepted asset class for portfolio diversification, and slowdowns in economic activity that could cause residential and commercial tenant demand to decline, which would adversely affect the operation and income of commercial real estate properties.
These and other types of events could lead to a decline in transaction activity as well as a decrease in values, which would likely in turn lead to a reduction in brokerage commissions and financing fees relating to such transactions. These effects would likely cause us to realize lower revenues from our transaction service fees, including investment sales commissions, which fees usually are tied to the transaction value and are payable upon the successful completion of a particular transaction. Such declines in transaction activity and value would likely also significantly reduce our financing activities and revenues. For example, the disruptions and dislocations in the global credit markets during 2008 and 2009 created significant restrictions in the availability of credit, especially on transitional assets and in the secondary and tertiary markets. In turn, the volume and pace of commercial real estate transactions were significantly reduced, as were property values, which generally peaked in 2007 and fell through 2010.
Fiscal uncertainty as well as significant changes and volatility in the financial markets and business environment, and in the global political, security and competitive landscape, make it increasingly difficult for us to predict our revenue and earnings into the future. As a result, any revenue or earnings guidance or outlook which we might give may be overtaken by events or may otherwise turn out to be inaccurate.
If we are unable to attract and retain qualified and experienced managers, sales and financing professionals, our growth may be limited and our business and operating results could suffer.
Our most important asset is our people, and our continued success is highly dependent upon the efforts of our managers, sales and financing professionals. If these managers or sales and financing professionals leave our
10
Table of Contents
company, we will lose the substantial time and resources we have invested in training and developing those individuals and our business, financial condition and results of operations may suffer. Additionally, such events may have a disproportionate adverse effect on our operations if the most experienced sales and financing professionals do not remain with us or if these events occur in geographic areas where substantial amounts of our brokerage revenues are generated. Furthermore, if the commission structure changes in the market, our commission compensation may become relatively less attractive to sales professionals.
In addition, our competitors may attempt to recruit our sales and financing professionals. The exclusive independent contractor arrangements we have entered into or may enter into with our sales professionals may not prevent our sales professionals from departing and competing against us. We may not be able or attempt to renew these agreements prior to their expiration. Additionally, we currently do not have employment agreements with most key employees, and there is no assurance that we will be able to retain their services.
A component of our growth has also occurred through the recruiting, hiring, training and retention of key experienced sales and financing professionals. Any future growth through recruiting these types of professionals will be partially dependent upon the continued availability of qualified candidates fitting the culture of our firm at reasonable employment terms and conditions. However, individuals whom we would like to hire may not be available upon reasonable employment terms and conditions. In addition, the hiring of new personnel involves risks that the persons acquired will not perform in accordance with expectations and that business judgments concerning the value, strengths and weaknesses of persons acquired will prove incorrect.
If we lose the services of our executive officers or certain other members of our senior management team, we may not be able to execute our business strategy.
Our success depends in a large part upon the continued service of our senior management team, who are critical to our vision, strategic direction and culture. Our current long-term business strategy was developed in large part by our senior-level officers and depends in part on their skills and knowledge to implement, and also includes a focus on new growth and investment initiatives that may require additional management expertise to successfully execute our strategy. We may not be able to offset the impact on our business of the loss of the services of our senior management or other key officers or employees or recruit additional talent.
Our business could be hurt if we are unable to retain our business philosophy and culture of information-sharing and efforts to retain our philosophy and culture could adversely affect our ability to maintain and grow our business.
Our policy of information-sharing and matching properties with large pools of investors defines our business philosophy as well as the emphasis that we place on our clients, our people and our culture. Our status as a public company could adversely affect this culture. If we do not continue to develop and implement the right processes and tools to manage our changing enterprise and maintain this culture, our ability to compete successfully and achieve our business objectives could be impaired, which could negatively impact our business, financial condition and results of operations.
The concentration of sales among our top sales professionals could lead to greater or more concentrated losses if we are unable to retain them.
Our most successful sales professionals are responsible for a significant percentage of our revenues. They also serve as mentors and role models, as well as provide invaluable training for younger professionals, which is an integral part of our culture. This concentration of sales and value among our top sales professionals can lead to greater and more concentrated risk of loss if we are unable to retain them, and have a material adverse impact on our business and financial condition. Furthermore, many of our sales professionals work in teams. If a team leader or manager leaves our company, his or her team members may leave with the team leader.
11
Table of Contents
We may fail to successfully differentiate our brand from those of our competitors, which could adversely affect our revenues.
The value of our brand and reputation is one of our most important assets. An inherent risk in maintaining our brand is we may fail to successfully differentiate the scope and quality of our service and product offerings from those of our competitors, or we may fail to sufficiently innovate or develop improved products or services that will be attractive to our clients. Additionally, given the rigors of the competitive marketplace in which we operate, there is the risk we may not be able to continue to find ways to operate more productively and more cost-effectively, including by achieving economies of scale, or we will be limited in our ability to further reduce the costs required to operate on a nationally coordinated platform.
We have numerous significant competitors and potential future competitors, some of which may have greater resources than we do, and we may not be able to continue to compete effectively.
We compete in investment sales and financing within the commercial real estate industry. Our investment sales focus on the private client segment, which is highly fragmented. For example, according to CoStar and Real Capital Analytics, for sales between $1 million and $10 million, the top 20 investment brokerage firms only constituted 27% of the U.S. commercial real estate market in 2012. The fragmentation of our market makes it challenging to effectively gain market share. While we have a competitive advantage over other national firms in the private investor segment, we also face competition from local and regional service providers who have existing relationships with potential clients. Furthermore, transactions in the private investor segment are smaller than many other commercial real estate transactions. Although the brokerage commissions in this segment are generally a higher percentage of the sales price, the smaller size of the transactions requires us to close many more transactions to sustain revenues. If the commission structure or the velocity of transactions were to change, we could be disproportionately affected by changes compared to other companies that focus on larger transactions, institutional clients and other segments of the commercial real estate market.
There is no assurance that we will be able to continue to compete effectively or maintain our current fee arrangements with our private clients or margin levels or we will not encounter increased competition. The services we provide to our clients are highly competitive on a national, regional and local level. Depending on the geography, property type or service, we face competition from, including, but not limited to, commercial real estate service providers, in-house real estate departments, private owners and developers, commercial mortgage servicers, institutional lenders, research and consulting firms, and investment managers, some of whom are clients and many of whom may have greater financial resources than we do. In addition, future changes in laws and regulations could lead to the entry of other competitors. Many of our competitors are local, regional or national firms. Although most are substantially smaller than we are, some of these competitors are larger on a local, regional or national basis, and we believe more national firms are exploring entry into or expansion in the under $10 million private investor segment. We may face increased competition from even stronger competitors in the future due to a trend toward consolidation, especially in times of severe economic stress. We are also subject to competition from other large national and multi-national firms as well as regional and local firms that have similar service competencies to ours. Our existing and future competitors may choose to undercut our fees, increase the levels of compensation they are willing to pay to their employees and either recruit our employees or cause us to increase our level of compensation necessary to retain our own employees or recruit new employees. These occurrences could cause our revenue to decrease or negatively impact our target ratio of compensation-to-operating revenue, both of which could have an adverse effect on our business, financial condition and results of operations.
Our attempts to expand our services and businesses may not be successful and we may expend significant resources without corresponding returns.
We intend to expand our specialty groups, particularly multi-tenant retail, office, industrial and hospitality, as well as various niche segments, including multifamily tax credit, affordable housing, student housing, manufactured housing, seniors housing and self-storage. We also plan to grow our financing services provided through our subsidiary, Marcus & Millichap Capital Corporation, or MMCC. We expect to incur expenses relating to training, and expanding our markets and services. The planned expansion of services and platforms
12
Table of Contents
requires significant resources, and there can be no assurance we will compete effectively, hire or train a sufficient number of professionals to support the expansion, or operate these businesses profitably. We may incur significant expenses for these plans without corresponding returns, which would harm our results of operations.
If we experience significant growth in the future, such growth may be difficult to sustain and may place significant demands on our administrative, operational and financial resources.
If we experience significant growth in the future, such growth could place additional demands on our resources and increase our expenses, as we will have to commit additional management, operational and financial resources to maintain appropriate operational and financial systems to adequately support expansion. There can be no assurance we will be able to manage our expanding operations effectively or we will be able to maintain or accelerate our growth, and any failure to do so could adversely affect our ability to generate revenue and control our expenses, which could adversely affect our business, financial condition and results of operations.
Moreover, we may have to delay, alter or eliminate the implementation of certain aspects of our growth strategy due to events beyond our control, including, but not limited to, changes in general economic conditions and commercial real estate market conditions. Such delays or changes to our growth strategy may adversely affect our business.
Our brokerage operations are subject to geographic and commercial real estate market risks, which could adversely affect our revenues and profitability.
Our real estate brokerage offices are located in and around large metropolitan areas as well as mid-market regions throughout the United States. Local and regional economic conditions in these locations could differ materially from prevailing conditions in other parts of the country. We have more offices and realize more of our revenues in California, the Northeast (New York, Connecticut, Pennsylvania, and Washington DC), Florida, Texas and Northern Illinois than in other regions in the country. In 2012, we realized approximately 14%, 11%, 8% and 6% of our revenues from the Northeast, Florida, Texas and Northern Illinois, respectively. In particular, we are subject to risks related to the California economy and real estate markets, where we realized 34% of our sales in 2012. In addition to economic conditions, this geographic concentration means that California-specific legislation, taxes and regional disasters such as earthquakes could disproportionately affect us. A downturn in investment real estate demand or economic conditions in these regions could result in a further decline in our total gross commission income and profitability and have a material adverse effect on us.
If we are unable to retain existing clients and develop new clients, our financial condition may be adversely affected.
We are substantially dependent on long-term client relationships and on revenue received for services provided for them. Our listing agreements generally expire within six months and depend on the cooperation of the client during the pendency of the agreement, as is typical in the industry. In this competitive market, if we are unable to maintain these relationships or are otherwise unable to retain existing clients and develop new clients, our business, results of operations and/or financial condition may be materially adversely affected. The global economic downturn and continued weaknesses in the markets in which our clients and potential clients compete have led to a lower volume of transactions and fewer real estate clients generally, which makes it more difficult to maintain existing and establish new client relationships. These effects have moderated, but they could increase again in the wake of the continuing political and economic uncertainties in the United States and in other countries.
A change in the tax laws relating to like-kind exchanges could adversely affect our business and the value of our stock.
Section 1031 of the Internal Revenue Code of 1986, as amended, or the Code, provides for tax-free exchanges of real property for other real property. Legislation has been proposed on several occasions that would repeal or restrict the application of Section 1031. If tax-free exchanges under Section 1031 were to be limited or
13
Table of Contents
unavailable, our clients or prospective clients may decide not to purchase or sell property that they would have otherwise purchased or sold due to the tax consequences of the transaction, thus reducing the commissions we would have otherwise received. Any repeal or significant change in the tax rules pertaining to like-kind exchanges could have a substantial adverse impact on our business and the value of our stock.
Seasonal fluctuations in the investment real estate industry could adversely affect our business and make comparisons of our quarterly results difficult.
Our revenue and profits have historically tended to be significantly higher in the fourth quarter of each year than in the first quarter. This is a result of a general focus in the real estate industry on completing or documenting transactions by calendar-year-end and because certain expenses are constant through the year. Historically, we have reported relatively lower earnings in the first quarter and then increasingly larger earnings during each of the following three quarters. The seasonality of our business makes it difficult to determine during the course of the year whether planned results will be achieved, and thus to adjust to changes in expectations.
If we fail to maintain and protect our intellectual property, or infringe the intellectual property rights of third parties, our business could be harmed and we could incur financial penalties.
Our business depends, in part, on our ability to identify and protect proprietary information and other intellectual property (such as our service marks, client lists and information, business methods and research). Existing laws, or the application of those laws, may offer only limited protections for our intellectual property rights. We rely on a combination of trade secrets, confidentiality policies, non-disclosure and other contractual arrangements, and on copyright and trademark laws to protect our intellectual property rights. Our inability to detect unauthorized use or take appropriate or timely steps to enforce our rights may have an adverse effect on our business.
We cannot be sure the intellectual property we may use in the course of operating our business or the services we offer to clients do not infringe on the rights of third parties, and we may have infringement claims asserted against us or against our clients. These claims may harm our reputation, cost us money and prevent us from offering some services.
Confidential intellectual property is increasingly stored or carried on mobile devices, such as laptop computers, tablets and smart phones which makes inadvertent disclosure more of a risk in the event the mobile devices are lost or stolen and the information has not been adequately safeguarded or encrypted.
If we do not respond to technological changes or upgrade our technology systems, our growth prospects and results of operations could be adversely affected.
To remain competitive, we must continue to enhance and improve the functionality and features of our technological infrastructure. Although we currently do not have specific plans for any infrastructure upgrades that would require significant capital investment outside of the normal course of business, in the future we will need to improve and upgrade our technology, database systems and network infrastructure in order to allow our business to grow in both size and scope. Without such improvements, our operations might suffer from unanticipated system disruptions, slow performance or unreliable service levels, any of which could negatively affect our ability to provide rapid customer service. We may face significant delays in introducing new services, sales professional tools and enhancements. If competitors introduce new products and services using new technologies, our proprietary technology and systems may become less competitive, and our business may be harmed. In addition, the expansion and improvement of our systems and infrastructure may require us to commit substantial financial, operational and technical resources, with no assurance that our business will improve.
The Internet could devalue our information services and lead to reduced client relationships, which could reduce the demand for our services.
The dynamic nature of the Internet, which has substantially increased the availability and transparency of information relating to commercial real estate listings and transactions, could change the way commercial real
14
Table of Contents
estate transactions are done. This has occurred to some extent in the residential real estate market as online brokerage companies have eroded part of the market for traditional residential real estate brokerage firms. The proliferation of large amounts of data on the Internet could also devalue the information that we gather and disseminate as part of our business model and may harm certain aspects of our investment brokerage business in the event that principals of transactions prefer to transact directly with each other. The rapid dissemination and increasing transparency of information, particularly for public companies, increases the risks to our business that could result from negative media or announcements about ethics lapses or other operational problems, which could lead clients to terminate or reduce their relationships with us.
Interruption or failure of our information technology, communications systems or data services could hurt our ability to effectively provide our services, which could damage our reputation and harm our operating results.
Our business requires the continued operation of information technology and communication systems and network infrastructure. Our ability to conduct our national business may be adversely impacted by disruptions to these systems or infrastructure. Our information technology and communications systems are vulnerable to damage or disruption from fire, power loss, telecommunications failure, system malfunctions, computer viruses, natural disasters such as hurricanes, earthquakes and floods, acts of war or terrorism, or other events which are beyond our control. In addition, the operation and maintenance of these systems and networks is in some cases dependent on third-party technologies, systems and service providers for which there is no certainty of uninterrupted availability. Any of these events could cause system interruption, delays, and loss of critical data or intellectual property and may also disrupt our ability to provide services to or interact with our clients, and we may not be able to successfully implement contingency plans that depend on communication or travel. We have disaster recovery plans and backup systems to reduce the potentially adverse effect of such events, but our disaster recovery planning may not be sufficient and cannot account for all eventualities. A catastrophic event that results in the destruction or disruption of any of our data centers or our critical business or information technology systems could severely affect our ability to conduct normal business operations and, as a result, our future operating results could be adversely affected.
Our business relies significantly on the use of commercial real estate data. We produce much of this data internally, but a significant portion is purchased from third-party providers for which there is no certainty of uninterrupted availability. A disruption of our ability to provide data to our professionals and/or clients could damage our reputation, and our operating results could be adversely affected.
Failure to maintain the security of our information and technology networks, including personally identifiable and client information could adversely affect us.
Security breaches and other disruptions could compromise our information and expose us to liability, which could cause our business and reputation to suffer. In the ordinary course of our business, we collect and store sensitive data, including our proprietary business information and intellectual property, and that of our clients and personally identifiable information of our employees and contractors, in our data centers and on our networks. The secure processing, maintenance and transmission of this information is critical to our operations. Despite our security measures, our information technology and infrastructure may be vulnerable to attacks by hackers or breached due to employee error, malfeasance or other disruptions. A significant actual or potential theft, loss, fraudulent use or misuse of client, employee or other personally identifiable data, whether by third parties or as a result of employee malfeasance or otherwise, non-compliance with our contractual or other legal obligations regarding such data or a violation of our privacy and security policies with respect to such data could result in significant costs, fines, litigation or regulatory actions against us. Such an event could additionally disrupt our operations and the services we provide to clients, damage our reputation, and cause a loss of confidence in our services, which could adversely affect our business, revenues and competitive position. Additionally, we increasingly rely on third-party data storage providers, including cloud storage solution providers, resulting in less direct control over our data. Such third parties may also be vulnerable to security breaches and compromised security systems, which could adversely affect our reputation.
15
Table of Contents
In addition, we rely on the collection and use of personally identifiable information from clients to conduct our business. We disclose our information collection and dissemination practices in a published privacy statement on our websites, which we may modify from time to time. We may be subject to legal claims, government action, including under the Racketeer Influenced and Corrupt Organizations Act, or RICO, and damage to our reputation if we act or are perceived to be acting inconsistently with the terms of our privacy statement, client expectations or the law. In the event we or the vendors with which we contract to provide services on behalf of our clients were to suffer a breach of personally identifiable information, our customers could terminate their business with us. Further, we may be subject to claims to the extent individual employees or sales and financing professionals breach or fail to adhere to company policies and practices and such actions jeopardize any personally identifiable information. In addition, concern among potential buyers or sellers about our privacy practices could keep them from using our services or require us to incur significant expense to alter our business practices or educate them about how we use personally identifiable information.
A failure to appropriately deal with actual or perceived conflicts of interest could adversely affect our businesses.
Outside of our people, our reputation is one of our most important assets. As we have expanded the scope of our services, we increasingly have to address potential, actual or perceived conflicts of interest relating to the services we provide to our existing and potential clients. For example, conflicts may arise between our position as an advisor to both the buyer and seller in commercial real estate sales transactions or in instances when a potential buyer requests that we represent it in securing the necessary capital to acquire an asset we are selling for another client or when a capital source takes an adverse action against an owner client that we are advising in another matter. From time to time, we also advise or represent entities and parties affiliated with us in commercial real estate transactions which also involve clients unaffiliated with us. In this context, we may be subject to complaints or claims of a conflict of interest. While we believe we have attempted to adopt various policies, controls and procedures to address or limit actual or perceived conflicts, these policies and procedures may not be adequate or carry attendant costs and may not be adhered to by our employees. Appropriately dealing with conflicts of interest is complex and difficult and our reputation could be damaged and cause us to lose existing clients or fail to gain new clients if we fail, or appear to fail, to deal appropriately with conflicts of interest, which could have an adverse affect on our business, financial condition and results of operations.
If we acquire companies or significant groups of personnel in the future, we may experience high transaction and integration costs, the integration process may be disruptive to our business and the acquired businesses and/or personnel may not perform as we expect.
Our growth strategy may include future acquisitions of companies and/or people and may involve significant transaction-related expenses. Transaction-related expenditures include severance costs, lease termination costs, transaction costs, deferred financing costs, possible regulatory costs and merger-related costs, among others. We may also experience difficulties in integrating operations and accounting systems acquired from other companies. These challenges include the diversion of management’s attention from the regular operations of our business and the potential loss of our key clients, our key associates or those of the acquired operations, each of which could harm our financial condition and results of operation. We believe some acquisitions could initially have an adverse impact on revenues, expenses, operating income and net income. Acquisitions also frequently involve significant costs related to integrating people, information technology, accounting, reporting and management services and rationalizing personnel levels. If we are unable to fully integrate the accounting, reporting and other systems of the businesses we acquire, we may not be able to effectively manage them and our financial results may be materially affected. Moreover, the integration process itself may be disruptive to our business as it requires coordination of culture, people and geographically diverse organizations and implementation of new accounting and information technology systems.
In addition, acquisitions of businesses involve risks that the businesses acquired will not perform in accordance with expectations, that the expected synergies associated with acquisitions will not be achieved and that business judgments concerning the value, strengths and weaknesses of the people and the businesses acquired will prove incorrect, which could have an adverse affect on our business, financial condition and results of operations.
16
Table of Contents
Significant fluctuations in our revenues and net income may make it difficult for us to achieve steady earnings growth on a quarterly or an annual basis, which may make the comparison between periods difficult and may cause the price of our common stock to decline.
We have experienced and may continue to experience fluctuations in revenues and net income as a result of many factors, including, but not limited to, economic conditions, capital market disruptions, the timing of transactions, revenue mix and the timing of additional selling, general and administrative expenses to support growth initiatives. We provide many of our services pursuant to contracts that typically expire within six months and that are dependent on the client’s cooperation. Consequently, many of our clients can terminate or significantly reduce their relationships with us on very short notice for any reason.
We plan our capital and operating expenditures based on our expectations of future revenues and, if revenues are below expectations in any given quarter or year, we may be unable to adjust capital or operating expenditures in a timely manner to compensate for any unexpected revenue shortfall, which could have an immediate material adverse effect on our business, financial condition and results of operation.
We may face significant liabilities and/or damage to our professional reputation as a result of litigation allegations and negative publicity.
As a licensed real estate broker, we and our licensed professionals and brokers are subject to regulatory due diligence, disclosure and standard-of-care obligations. Failure to fulfill these obligations could subject us or our professionals and brokers to litigation from parties who attempted to or in fact financed, purchased or sold properties that we or they brokered, managed or had some other involvement. We could become subject to claims by those who either wished to participate or did participate in real estate transactions alleging that we did not fulfill our regulatory, contractual or other legal obligations. We also face conflicts of interest claims when we represent both the buyer and the seller in a transaction.
We depend on our business relationships and our reputation for integrity and high-caliber professional services to attract and retain clients across our overall business. As a result, allegations by private litigants or regulators, whether the ultimate outcome is favorable or unfavorable to us, as well as negative publicity and press speculation about us or our investment activities, whether or not valid, may harm our reputation and damage our business prospects. In addition, if any lawsuits were brought against us and resulted in a finding of substantial legal liability, it could materially, adversely affect our business, financial condition or results of operations or cause significant reputational harm to us, which could materially impact our business.
Some of these litigation risks may be mitigated by the commercial insurance we maintain in amounts we believe are appropriate. However, in the event of a substantial loss, our commercial insurance coverage and/or self-insurance reserve levels might not be sufficient to pay the full damages, or the scope of available coverage may not cover certain types of claims. Further, the value of otherwise valid claims we hold under insurance policies could become uncollectible in the event of the covering insurance company’s insolvency, although we seek to limit this risk by placing our commercial insurance only with highly-rated companies. Any of these events could negatively impact our business, financial condition or results of operations.
Employee or sales and financing professional misconduct, fraud, or theft, which is difficult to detect and deter, could harm us by impairing our ability to attract and retain clients and subjecting us to significant legal liability and reputational harm.
If our sales or financing professionals or other associates engage in misconduct, our business could be adversely affected. It is not always possible to deter misconduct, and the precautions we take to deter and prevent this activity may not be effective in all cases. If our employees or sales and financing professionals were to improperly use, disseminate or disclose information provided by our clients, we could be subject to regulatory sanctions and suffer serious harm to our reputation, financial position and current client relationships and our ability to attract future clients, could be significantly impaired, which could adversely affect our business, financial condition and results of operation. To the extent any loss or theft of funds substantially exceeds our insurance coverage, our business could be materially adversely affected.
17
Table of Contents
Many of our sales and financing professionals are independent contractors, not employees, and if federal or state law mandates that they be employees, our business would be adversely impacted.
Many of our sales and financing professionals are retained as independent contractors, and we are subject to the Internal Revenue Service regulations and applicable state law guidelines regarding independent contractor classification. These regulations and guidelines are subject to judicial and agency interpretation, and it could be determined that the independent contractor classification is inapplicable to any of our professionals. Further, if legal standards for classification of these professionals as independent contractors change or appear to be changing, it may be necessary to modify our compensation structure for these professionals in some or all of our markets, including by paying additional compensation or reimbursing expenses. If we are forced to classify these professionals as employees, we would also become subject to laws regarding employee classification and compensation, and to claims regarding overtime, minimum wage, and meal and rest periods. We could also incur substantial costs, penalties and damages due to future challenges by current or former professionals to our classification or compensation practices. Any of these outcomes could result in substantial costs to us, could significantly impair our financial condition and our ability to conduct our business as we choose, and could damage our reputation and impair our ability to attract clients and sales and financing professionals.
Our businesses, financial condition, results of operations and prospects could be adversely affected by new laws or regulations or by changes in existing laws or regulations or the application thereof. If we fail to comply with laws and regulations applicable to us, including in our role as a real estate broker or mortgage broker, we may incur significant financial penalties.
We are subject to numerous federal, state, local and non-U.S. laws and regulations specific to the services we perform in our business, as well as laws of broader applicability, such as tax, securities and employment laws. In general, the brokerage of real estate transactions requires us to maintain applicable licenses where perform these services. If we fail to maintain our licenses or conduct these activities without a license, or violate any of the regulations covering our licenses, we may be required to pay fines (including treble damages in certain states) or return commissions received or have our licenses suspended or revoked. We could also be subject to disciplinary or other actions in the future due to claimed noncompliance with these regulations, which could have a material adverse effect on our operations and profitability.
Our business is also governed by various legislation limiting the manner in which prospective clients may be contacted, including federal and state “Do Not Call” and “Do Not Fax” regulations. We may be subject to legal claims and governmental action if we are perceived to be acting in violation of these laws and regulations. We may also be subject to claims to the extent individual employees or sales professionals breach or fail to adhere to company policies and practices designed to maintain compliance with these laws and regulations. The penalties for violating this legislation can be material, and could result in changes in which we are able to contact prospective clients.
As the size and scope of commercial real estate transactions have increased significantly during the past several years, both the difficulty of ensuring compliance with numerous licensing regimes and the possible loss resulting from non-compliance have increased. New or revised legislation or regulations applicable to our business, both within and outside of the United States, as well as changes in administrations or enforcement priorities may have an adverse effect on our business, including increasing the costs of compliance or preventing us from providing certain types of services in certain jurisdictions or in connection with certain transactions or clients. We are unable to predict how any of these new laws, rules, regulations and proposals will be implemented or in what form, or whether any additional or similar changes to laws or regulations, including the interpretation or implementation thereof, will occur in the future. Any such action could affect us in substantial and unpredictable ways and could have an adverse effect on our businesses, financial condition, results of operations and prospects.
18
Table of Contents
We are an “emerging growth company,” and any decision on our part to comply only with certain reduced reporting and disclosure requirements applicable to emerging growth companies could make our common stock less attractive to investors.
We are an “emerging growth company,” as defined in the Jumpstart Our Business Startups Act of 2012, or the JOBS Act, and for as long as we continue to be an “emerging growth company,” we may choose to take advantage of exemptions from various reporting requirements applicable to other public companies but not to “emerging growth companies,” including, but not limited to, (i) not being required to have our independent registered public accounting firm audit our internal control over financial reporting under Section 404 of the Sarbanes-Oxley Act, which may increase the risk that weaknesses or deficiencies in the internal control over financial reporting go undetected, (ii) reduced disclosure obligations regarding executive compensation in our periodic reports and proxy statements, which may make it more difficult for investors and securities analysts to evaluate the company, and (iii) exemptions from the requirements of holding a nonbinding advisory vote on executive compensation and stockholder approval of any golden parachute payments not previously approved.
We could remain an “emerging growth company” for up to five years, although if the market value of our common stock that is held by non-affiliates exceeds $700 million as of any June 30 before that time, we would cease to be an “emerging growth company” as of the following December 31. We cannot predict if investors will find our common stock less attractive if we choose to rely on these exemptions. If some investors find our common stock less attractive as a result of any choices to reduce future disclosure, there may be a less active trading market for our common stock and our stock price may be more volatile.
We have irrevocably elected to opt out of the extended transition period for complying with new or revised accounting standards pursuant to Section 107(b) of the JOBS Act, and therefore, we will be subject to the same new or revised accounting standards as other public companies that are not “emerging growth companies.”
Risks Related to the Spin-Off
We may not achieve some or all of the expected benefits of the Spin-Off and this offering.
We may not be able to achieve the full strategic and financial benefits expected to result from the Spin-Off and this offering, or such benefits may be delayed or not occur at all. These benefits include the following:
| • | enabling us to raise significantly more funds in this offering by unburdening us from the business risks, financial risks and capital requirements of MMC’s other businesses, and allowing our management to focus on implementing our business strategies; |
| • | facilitating incentive compensation arrangements for employees and sales professionals more directly tied to our business performance, and enhancing hiring and retention by, among other things, improving the alignment of management and employee incentives with performance and growth objectives of our business; |
| • | providing greater ability for us to grow by opening new offices, expanding our presence in the markets in which we currently operate, acquiring new groups or firms, developing our institutional brokerage brand (IPA) and accelerating our international expansion; |
| • | enabling us to invest in the next series of proprietary real estate technology and brokerage tools to improve our productivity, analysis and marketing; |
| • | enabling us to upgrade our sales professionals’ training programs and management development program, and expand our branding and business development campaigns; and |
| • | creating an independent equity structure and providing publicly traded stock that will facilitate our ability to make future acquisitions utilizing our common stock. |
We may not achieve the anticipated benefits of the Spin-Off for a variety of reasons. In addition, the Spin-Off could adversely affect our operating results and financial condition since we will need to replicate or replace certain services previously provided to us by MMC and there is no assurance that we will be able to do so on similar or more favorable terms, or at all.
19
Table of Contents
Two of our directors may have actual or potential conflicts of interest because of their positions with MMC.
Following this offering, George M. Marcus and William A. Millichap will serve as co-chairmen of our board of directors and retain their positions as directors of MMC. In addition, Messrs. Marcus and Millichap may own MMC stock, options to purchase MMC stock or other MMC equity awards. Their position at MMC and the ownership of any MMC equity or equity awards creates, or may create the appearance of, conflicts of interest when these directors are faced with decisions that could have different implications for MMC than the decisions have for us.
Some of our directors will be participating in the Debt-for-Equity Exchange and therefore may have a conflict of interest in this offering.
In connection with this offering, MMC will exchange shares of the company’s common stock for MMC indebtedness held by the debt-for-equity exchange parties, including some of our directors. It is expected that the debt-for-equity exchange parties will then sell all of this common stock to the underwriters for cash. Consequently, some of our directors may have a conflict of interest by virtue of the fact that they will receive a portion of the proceeds from this offering in connection with the Debt-for-Equity Exchange.
To preserve the tax-free treatment of the Spin-Off to MMC and/or its shareholders, we may not be able to engage in certain transactions.
To preserve the tax-free treatment of the Spin-Off to MMC and/or its shareholders, under the tax matters agreement, we will be restricted from taking any action that could reasonably be expected to adversely affect such tax-free status for U.S. federal, state and local income tax purposes. During the time period ending two years after the date of the Distribution there will be specific restrictions on our undertaking of transactions which would, among other things, cause us to undergo a 50% or greater change in our stock ownership for purposes of Section 355(e) of the Code. These restrictions may limit our ability to pursue strategic transactions or engage in other transactions, to use our common stock to make acquisitions, and to raise equity capital, all of which transactions might increase the value of our business.
Risks Related to this Offering and Ownership of Our Common Stock
There is no existing market for our common stock and we do not know if one will develop, which could impede your ability to sell your shares and depress the market price of our common stock.
Prior to this offering, there has not been a public market for our common stock. We cannot predict the extent to which investor interest in the company will lead to the development of an active trading market on the NYSE or otherwise, or how liquid that market might become. If an active trading market does not develop, you may have difficulty selling any of our common stock that you buy. The initial public offering price for the common stock will be determined by negotiations between us and the representatives of the underwriters and may not be indicative of prices that will prevail in the open market following this offering. Consequently, you may not be able to sell our common stock at prices equal to or greater than the price you paid in this offering.
Our Co-Chairman and founder will control a significant interest in our stock after this offering, and the concentrated ownership of our common stock will prevent you and other stockholders from influencing significant decisions.
Immediately following the completion of this offering, Mr. Marcus, our Co-Chairman and founder, will own % of our outstanding common stock ( % if the underwriters exercise their option to purchase additional shares in full). Because Mr. Marcus will control a majority of the voting power of our outstanding common stock, he will be able to influence the outcome of corporate actions requiring stockholder approval, including the election and removal of directors, so long as he controls a significant portion of our common stock.
20
Table of Contents
If our Co-Chairman sells a controlling interest in our company to a third party in a private transaction, you may not realize any change-of-control premium on shares of our common stock and we may become subject to the control of a presently unknown third party.
Our Co-Chairman and controlling stockholder will have the ability, should he choose to do so, to sell some or all of the shares of our common stock that he controls in a privately negotiated transaction, which, if sufficient in size, could result in a change of control of our company. The ability of our Co-Chairman and controlling stockholder to privately sell the shares of our common stock that he controls, with no requirement for a concurrent offer to be made to acquire all of our common stock that will be publicly traded hereafter, could prevent you from realizing any change-of-control premium on your shares of our common stock that may otherwise accrue to entities controlled by our Co-Chairman on a private sale of our common stock. Additionally, if entities controlled by our Co-Chairman privately sell a significant equity interest in our company, we may become subject to the control of a presently unknown third party. Such third party may have conflicts of interest with those of other stockholders. Furthermore, if our Co-Chairman sells a controlling interest in our company to a third party, our commercial agreements and relationships could be impacted, all of which may adversely affect our ability to run our business as described herein and may have a material adverse effect on our operating results and financial condition.
We will incur incremental costs as a stand-alone public company that will affect our financial results.
We will need to replicate or replace certain functions, systems and infrastructure previously provided by MMC to which we will no longer have the same access after this offering. We may also need to make investments or hire additional employees to operate without the same access to MMC’s existing operational and administrative infrastructure. These initiatives may be costly to implement, and the amount of total costs could be materially higher than we anticipate.
MMC currently performs or supports many important corporate functions for our company. Our consolidated financial statements reflect charges for these services on an allocation basis. Following this offering, many of these services will be governed by our transition services agreement with MMC. Under the transition services agreement we will be able to use these MMC services for a fixed term established on a service-by-service basis. However, we generally will have the right to terminate a service earlier if we give notice to MMC. In addition, either party will be able to terminate the agreement due to a material breach of the other party, upon prior written notice, subject to limited cure periods.
We will pay MMC mutually agreed-upon fees for these services, which will be based on MMC’s costs of providing the services. However, since our transition services agreement was negotiated in the context of a parent-subsidiary relationship, the terms of the agreement, including the fees charged for the services, may be higher or lower than those that would be agreed to by parties bargaining at arm’s length for similar services and may be higher or lower than the costs reflected in the allocations in our historical financial statements. Third-party costs will be passed through to us at MMC’s or its affiliates’ cost. In addition, while these services are being provided to us by MMC, our operational flexibility to modify or implement changes with respect to such services or the amounts we pay for them will be limited.
We may not be able to replace these services or enter into appropriate third-party agreements on terms and conditions, including cost, comparable to those that we will receive from MMC under our transition services agreement. Additionally, after the agreement terminates, we may be unable to sustain the services at the same levels or obtain the same benefits as when we were receiving such services and benefits from MMC. When we begin to operate these functions separately, if we do not have our own adequate systems and business functions in place, or are unable to obtain them from other providers, we may not be able to operate our business effectively or at comparable costs, and our profitability may decline. In addition, we have historically received informal support from MMC, which may not be addressed in our transition services agreement. The level of this informal support will diminish or be eliminated following this offering.
21
Table of Contents
As a result of becoming a public company, we will be obligated to develop and maintain proper and effective internal control over financial reporting. These internal controls may not be determined to be effective, which may adversely affect investor confidence in our company and, as a result, the value of our common stock.
We will be required, pursuant to Section 404 of the Sarbanes-Oxley Act of 2002, to furnish a report by management on, among other things, the effectiveness of our internal control over financial reporting for the first fiscal year beginning after the effective date of this offering. This assessment will need to include disclosure of any material weaknesses identified by our management in our internal control over financial reporting, as well as a statement that our independent registered public accounting firm has issued an opinion on our internal control over financial reporting.
If we are unable to assert that our internal control over financial reporting is effective, or if our independent registered public accounting firm is unable to express an opinion on the effectiveness of our internal controls, investors could lose confidence in the accuracy and completeness of our financial reports, which could cause the price of our common stock to decline, and we may become subject to investigation or sanctions by the SEC. We will be required to disclose changes made in our internal control and procedures on a quarterly basis. However, our independent registered public accounting firm will not be required to formally attest to the effectiveness of our internal control over financial reporting pursuant to Section 404 until the later of the year following our first annual report required to be filed with the SEC or the date we are no longer an “emerging growth company,” as defined in the JOBS Act, if we take advantage of the exemptions contained in the JOBS Act. At such time, our independent registered public accounting firm may issue a report that is adverse in the event it is not satisfied with the level at which our controls are documented, designed or operating. Our remediation efforts may not enable us to avoid a material weakness in the future. In addition, to comply with the requirements of being a public company, we may need to undertake various actions, such as implementing new internal controls and procedures and hiring additional accounting or internal audit staff.
If securities analysts do not publish research or reports about our business or if they downgrade our company or our sector, the price of our common stock could decline.
The trading market for our common stock will depend in part on the research and reports that industry or financial analysts publish about us or our business. We do not control these analysts, nor can we assure that any analysts will continue to follow us and issue research reports. Furthermore, if one or more of the analysts who do cover us downgrades our company or our industry, or the stock of any of our competitors, the price of our common stock could decline. If one or more of these analysts ceases coverage of our company, we could lose visibility in the market, which in turn could cause the price of our common stock to decline.
Future sales or the perception of future sales of a substantial amount of our common stock may depress the price of shares of our common stock.
After the completion of this offering, there will be shares of our common stock available for future sale that were not sold in the offering. Future sales or the availability for sale of substantial amounts of our common stock in the public market could adversely affect the prevailing market price of our common stock and could impair our ability to raise capital through future sales of equity securities.
We may issue shares of our common stock or other securities from time to time as consideration for future acquisitions and investments. If any such acquisition or investment is significant, the number of shares of our common stock, or the number or aggregate principal amount, as the case may be, of other securities that we may issue may in turn be substantial. We may also grant registration rights covering those shares of our common stock or other securities in connection with any such acquisitions and investments.
We cannot predict the size of future issuances of our common stock or the effect, if any, that future issuances and sales of our common stock will have on the market price of our common stock. Sales of substantial amounts of our common stock (including shares of our common stock issued in connection with an acquisition), or the perception that such sales could occur, may adversely affect prevailing market prices for our common stock.
22
Table of Contents
The price of our common stock may fluctuate significantly and you could lose all or part of your investment.
Volatility in the market price of our common stock may prevent you from being able to sell your shares of common stock at or above the price you paid for them. The market price for our common stock could fluctuate significantly for various reasons, including quarterly and annual variations in our results and those of our competitors; changes to the competitive landscape; estimates and projections by the investment community; the arrival or departure of key personnel, especially the retirement or departure of key senior sales professionals and management; the introduction of new services by us or our competitors; acquisitions, strategic alliances or joint ventures involving us or our competitors; and general global and domestic economic, credit and liquidity issues, market or political conditions.
As a result of these factors, investors in our common stock may not be able to resell their shares at or above the initial public offering price or may not be able to resell them at all. These broad market and industry factors may materially reduce the market price of our common stock, regardless of our operating performance. In addition, price volatility may be greater if the public float and trading volume of our common stock is low.
Anti-takeover provisions in our charter documents and Delaware law could delay or prevent a change in control.
Our certificate of incorporation and by-laws may delay or prevent a merger or acquisition that a stockholder may consider favorable by permitting our board of directors to issue one or more series of preferred stock, requiring advance notice for stockholder proposals and nominations, providing for super-majority votes of stockholders for the amendment of the bylaws and certificate of incorporation, and placing limitations on convening stockholder meetings and not permitting written consents of stockholders. In addition, we are subject to provisions of the Delaware General Corporation Law that restrict certain business combinations with interested stockholders. These provisions may also discourage acquisition proposals or delay or prevent a change in control, which could harm the market price of our common stock.
We may not generate sufficient cash to pay dividends on our common stock, which may cause us to change our dividend policy and affect our stock price.
If we cannot operate our business to meet our financial expectations, our ability to pay dividends to you could be adversely affected. Any declaration and payment of future dividends to holders of our common stock will be at the sole discretion of our board of directors and will depend on many factors, including our financial condition, earnings, capital requirements, level of indebtedness, statutory and contractual restrictions applying to the payment of dividends and other considerations that our board of directors deems relevant. If the board determines that our financial conditions and other requirements have not been satisfied, we may not issue dividends and you may need to rely on an increase in the price of our common stock to profit from your investment.
We may issue shares of preferred stock in the future, which could make it difficult for another company to acquire us or could otherwise adversely affect holders of our common stock, which could depress the price of our common stock.
Our amended and restated certificate of incorporation will authorize us to issue one or more series of preferred stock. Our board of directors will have the authority to determine the preferences, limitations and relative rights of shares of preferred stock and to fix the number of shares constituting any series and the designation of such series, without any further vote or action by our stockholders. Our preferred stock could be issued with voting, liquidation, dividend and other rights superior to the rights of our common stock. The potential issuance of preferred stock may delay or prevent a change in control of us, discouraging bids for our common stock at a premium to the market price, and materially and adversely affect the market price and the voting and other rights of the holders of our common stock.
23
Table of Contents
You will suffer immediate and substantial dilution in the net tangible book value of the common stock you purchase.
Prior investors have paid substantially less per share than the price in this offering. The initial public offering price is substantially higher than the net tangible book value per share of the outstanding common stock after giving effect to this offering and related transactions. Accordingly, based on an assumed initial public offering price of $ per share (the midpoint of the offering price range set forth on the cover page of this prospectus), and after deducting estimated underwriting discounts and commissions and estimated offering expenses payable by us, and the application of the net proceeds from such sale as described in “Use of Proceeds,” and following the Debt-for-Equity Exchange substantially concurrently with the closing of the offering, purchasers of common stock in this offering will experience immediate and substantial dilution of approximately $ per share. Additionally, investors in our common stock will be further diluted in the event that the underwriters exercise their option to purchase additional shares.
24
Table of Contents
SPECIAL NOTE REGARDING FORWARD-LOOKING STATEMENTS
This prospectus includes forward-looking statements. We have based these forward-looking statements largely on our current expectations and projections about future events and financial trends affecting the financial condition of our business. Forward-looking statements should not be read as a guarantee of future performance or results, and will not necessarily be accurate indications of the times at, or by, which such performance or results will be achieved. Forward-looking statements are based on information available at the time those statements are made and/or management’s good faith belief as of that time with respect to future events, and are subject to risks and uncertainties that could cause actual performance or results to differ materially from those expressed in or suggested by the forward-looking statements. Important factors that could cause such differences include, but are not limited to:
| • | market trends in the commercial real estate market or the general economy; |
| • | our ability to attract and retain qualified managers, sales and financing professionals; |
| • | the effects of increased competition on our business; |
| • | our ability to successfully enter new markets or increase our market share; |
| • | our ability to successfully expand our services and businesses and to manage any such expansions; |
| • | our ability to retain existing clients and develop new clients; |
| • | our ability to keep pace with changes in technology; |
| • | any business interruption or technology failure and any related impact on our reputation; |
| • | changes in tax laws, employment laws or other government regulation affecting our business; and |
| • | other risk factors included under “Risk Factors” in this prospectus. |
In addition, in this prospectus, the words “believe,” “may,” “will,” “estimate,” “continue,” “anticipate,” “intend,” “expect,” “predict,” “potential” and similar expressions, as they relate to our company, our business and our management, are intended to identify forward-looking statements. In light of these risks and uncertainties, the forward-looking events and circumstances discussed in this prospectus may not occur and actual results could differ materially from those anticipated or implied in the forward-looking statements.
Forward-looking statements speak only as of the date of this prospectus. You should not put undue reliance on any forward-looking statements. We assume no obligation to update forward-looking statements to reflect actual results, changes in assumptions or changes in other factors affecting forward-looking information, except to the extent required by applicable laws. If we update one or more forward-looking statements, no inference should be drawn that we will make additional updates with respect to those or other forward-looking statements.
25
Table of Contents
We estimate that we will receive net proceeds of approximately $ from the sale by us of shares of our common stock in this offering ($ if the underwriters’ option to purchase additional shares is exercised in full), based on an assumed public offering price of $ per share (the midpoint of the price range set forth on the cover page of this prospectus) and after deducting the estimated underwriting discounts and commissions and offering expenses.
We expect to use the net proceeds of the offering payable to us for general corporate purposes, including capital expenditures and working capital to expand our markets and services and potential acquisition of real estate businesses or companies, although there are no current agreements with respect to any such transactions. Pending such uses, we intend to invest the net proceeds payable to us from the offering in interest-bearing, investment grade securities. We will not receive any of the proceeds from the sale of shares by the debt-for-equity exchange parties.
A $1.00 increase or decrease in the assumed initial public offering price of $ per share (the midpoint of the price range set forth on the cover page of this prospectus) would increase or decrease the net proceeds we receive from this offering by approximately $ million, assuming the number of shares offered by us, as set forth on the cover of this prospectus, remains the same. We may also increase or decrease the number of shares we are offering. An increase or decrease by 1.0 million shares in the number of shares offered by us would increase or decrease the net proceeds to us by $ million assuming the assumed initial public offering price of $ per share, the midpoint of the price range set forth on the cover of this prospectus, remains the same and after deducting the estimated underwriting discounts and commissions and offering expenses payable by us.
Prior to our initial public offering, we distributed substantially all of our net income to our parent in the form of cash dividends. Consistent with this past practice, we intend to pay a quarterly preferred dividend of $ million to MMC in October 2013 to distribute MMREIS’s earnings for the quarter ended September 30, 2013. Following this offering, we will not pay a regular dividend. We intend to evaluate our dividend policy in the future. Any declaration and payment of future dividends to holders of our common stock will be at the discretion of our board of directors and will depend on many factors, including our financial condition, earnings, cash flows, capital requirements, level of indebtedness, statutory and contractual restrictions applicable to the payment of dividends and other considerations that our board of directors deems relevant.
26
Table of Contents
The following table sets forth our capitalization as of June 30, 2013:
| • | on an actual basis; |
| • | on a pro forma basis after giving effect to the Spin-Off, including (i) the termination of the MMREIS tax-sharing agreement, (ii) the modification of certain restricted stock awards and SARs held by the MMREIS managing directors and grants of replacement awards and (iii) payment of quarterly preferred dividends in July 2013 in the amount of $6.5 million and in October 2013 in the amount of $ million to distribute MMREIS’s earnings for the quarters ended June 30 and September 30, 2013, respectively, to MMC; and |
| • | on a pro forma as adjusted basis after giving effect to this offering and the application of the net proceeds, from the sale of shares of common stock by us in this offering at an assumed public offering price of $ (the midpoint of the price range set forth on the cover page of this prospectus). |
| June 30, 2013 | ||||||||||||
| Actual | Pro Forma | Pro
Forma As Adjusted(1) |
||||||||||
| (Dollars in thousands) | ||||||||||||
| Cash and cash equivalents |
$ | 19,362 | $ | $ | ||||||||
|
|
|
|
|
|
|
|||||||
| Long-term debt, less current portion |
||||||||||||
| Stockholders’ equity (deficit): |
||||||||||||
| Series A Redeemable Preferred stock, $10.00 par value; 1,000 shares authorized; 1,000 shares issued and outstanding, actual; no shares issued and outstanding pro forma and pro forma, as adjusted |
10 | — | — | |||||||||
| Common stock $1.00 par value; 1,000,000 shares authorized; 234,489 shares issued and outstanding, actual; no shares issued and outstanding pro forma and pro forma as adjusted |
235 | — | — | |||||||||
| Common Stock $0.0001 par value; 150,000,000 shares authorized, no shares issued and outstanding, actual; shares issued and outstanding, pro forma; shares issued and outstanding, pro forma as adjusted(2) |
— | |||||||||||
| Additional paid-in capital |
1,514 | |||||||||||
| Stock notes receivable from employees |
(62 | ) | ||||||||||
| Retained earnings |
6,465 | |||||||||||
|
|
|
|||||||||||
| Total stockholders’ equity |
8,162 | |||||||||||
|
|
|
|
|
|
|
|||||||
| Total capitalization |
$ | 8,162 | $ | $ | ||||||||
|
|
|
|
|
|
|
|||||||
| (1) | Each $1.00 increase or decrease in the assumed initial public offering price of $ per share, which is the midpoint of the estimated offering price range set forth on the cover page of this prospectus, would increase or decrease, as applicable, the amount of additional paid-in capital, total stockholders’ equity and total capitalization by approximately $ million, assuming the number of shares offered by us, as set forth on the cover of this prospectus, remains the same, and after deducting the estimated underwriting discounts and commissions payable by us. |
| (2) | Excludes an additional shares reserved for issuance upon exercise of stock options or other equity awards that may be granted subsequent to June 30, 2013 under the 2013 Omnibus Equity Incentive Plan and shares reserved for issuance under the 2013 Employee Stock Purchase Plan. See “Management—2013 Omnibus Equity Incentive Plan” and “Management—2013 Employee Stock Purchase Plan.” |
27
Table of Contents
Our pro forma net tangible book value as of June 30, 2013 was approximately $ or $ per share of common stock. “Net tangible book value” per share represents the amount of total tangible assets reduced by the amount of total liabilities and divided by the total number of shares of common stock outstanding. After giving effect to the sale of the shares of common stock offered by us at an assumed initial public offering price of $ per share, and the adjustments described under the section entitled “Capitalization,” our pro forma net tangible book value as of June 30, 2013 would have been $ or $ per share of common stock. This represents an immediate increase in net tangible book value of $ per share to existing stockholders and an immediate dilution of $ per share to new investors. The following table illustrates this per share dilution:
| Assumed initial public offering price per share |
$ | |||||||
| Pro forma net tangible book value per share before the offering |
$ | |||||||
| Decrease in net tangible book value per share attributable to the Spin-Off |
||||||||
|
|
|
|||||||
| Increase in net tangible book value per share attributable to this offering |
||||||||
|
|
|
|||||||
| Pro forma net tangible book value after giving effect to this offering and the other transactions described above |
||||||||
|
|
|
|||||||
| Dilution per share to new public investors |
$ | |||||||
|
|
|
The following table summarizes on a pro forma basis, as of June 30, 2013, the differences between the existing stockholders and new investors with respect to the number of shares of common stock purchased from us, the total consideration paid to us and the average price per share paid.
| Shares Purchased | Total Consideration | Average Price Per Share |
||||||||||||||||
| Number |
Percent | Amount | Percent | |||||||||||||||
| Existing stockholders |
% | $ | % | $ | ||||||||||||||
| New investors |
||||||||||||||||||
|
|
|
|
|
|
|
|
||||||||||||
| Total |
100.0 | % | $ | 100.0 | % | |||||||||||||
|
|
|
|
|
|
|
|
||||||||||||
A $1.00 increase or decrease in the assumed initial public offering price of $ per share, the midpoint of the price range set forth on the cover of this prospectus, would increase or decrease pro forma net tangible book value by $ million, or $ per share, and would increase or decrease the dilution per share to purchasers in this offering by $ , based on the assumptions set forth above. An increase or decrease of 1,000,000 shares we are offering would increase or decrease our pro forma as adjusted net tangible book value by $ million, or $ per share, and decrease or increase dilution to investors in this offering by $ per share, assuming the initial public offering price per share remains the same.
28
Table of Contents
SELECTED HISTORICAL FINANCIAL AND OTHER DATA
The following selected financial data for each of the three years in the period ended December 31, 2012 are derived from the audited consolidated financial statements of Marcus & Millichap Real Estate Investment Services, Inc., or MMREIS. Prior to the Spin-Off, Marcus & Millichap, Inc. will not have engaged in any business or other activities, except in connection with its formation and in preparation for this offering and the Spin-Off. The financial data for the six-month periods ended June 30, 2013 and 2012 are derived from unaudited financial statements of MMREIS. The unaudited financial statements include all adjustments, consisting of normal recurring accruals, which we consider necessary for a fair presentation of the financial position and the results of operations for these periods. Operating results for the six months ended June 30, 2013 are not necessarily indicative of the results that may be expected for the entire year. The data should be read together with our financial statements and related notes, and “Management’s Discussion and Analysis of Financial Condition and Results of Operations,” which are included elsewhere in this prospectus.
| (In thousands) | Year Ended December 31, | Six Months Ended June 30, |
||||||||||||||||||
| 2010 | 2011 | 2012 | 2012 | 2013 | ||||||||||||||||
| Statements of Income Data: |
||||||||||||||||||||
| Revenues: |
||||||||||||||||||||
| Real estate brokerage commissions |
$ | 198,366 | $ | 245,333 | $ | 351,407 | $ | 133,409 | $ | 156,963 | ||||||||||
| Financing fees |
10,917 | 16,522 | 21,132 | 8,218 | 11,888 | |||||||||||||||
| Other revenues |
8,652 | 12,850 | 13,177 | 5,223 | 5,990 | |||||||||||||||
|
|
|
|
|
|
|
|
|
|
|
|||||||||||
| Total revenues |
217,935 | 274,705 | 385,716 | 146,850 | 174,841 | |||||||||||||||
| Operating expenses: |
||||||||||||||||||||
| Cost of services |
124,272 | 162,478 | 230,248 | 84,709 | 102,677 | |||||||||||||||
| Selling, general, and administrative expense |
76,438 | 85,801 | 103,479 | 45,900 | 53,824 | |||||||||||||||
| Depreciation and amortization expense |
3,333 | 2,971 | 2,981 | 1,495 | 1,514 | |||||||||||||||
|
|
|
|
|
|
|
|
|
|
|
|||||||||||
| Total operating expenses |
204,043 | 251,250 | 336,708 | 132,104 | 158,015 | |||||||||||||||
|
|
|
|
|
|
|
|
|
|
|
|||||||||||
| Operating income |
13,892 | 23,455 | 49,008 | 14,746 | 16,826 | |||||||||||||||
| Other income (expense), net |
959 | 350 | 433 | 283 | 249 | |||||||||||||||
|
|
|
|
|
|
|
|
|
|
|
|||||||||||
| Income before provision for income taxes |
14,851 | 23,805 | 49,441 | 15,029 | 17,075 | |||||||||||||||
| Provision for income taxes |
6,460 | 10,355 | 21,507 | 6,538 | 7,428 | |||||||||||||||
|
|
|
|
|
|
|
|
|
|
|
|||||||||||
| Net income |
$ | 8,391 | $ | 13,450 | $ | 27,934 | $ | 8,491 | $ | 9,647 | ||||||||||
|
|
|
|
|
|
|
|
|
|
|
|||||||||||
| Adjusted EBITDA (1) |
$ | 18,743 | $ | 29,486 | $ | 59,708 | $ | 18,634 | $ | 21,131 | ||||||||||
| Balance Sheet Data: |
||||||||||||||||||||
| Cash and cash equivalents |
$ | 4,932 | $ | 3,158 | $ | 3,107 | $ | 3,827 | $ | 19,362 | ||||||||||
| Total assets |
64,572 | 64,296 | 89,733 | 51,624 | 48,020 | |||||||||||||||
| Total liabilities |
42,873 | 44,139 | 68,103 | 29,753 | 39,858 | |||||||||||||||
| (1) | Adjusted EBITDA is not a measurement of our financial performance under U.S. GAAP and should not be considered as an alternative to net income, operating income or any other measures derived in accordance with U.S. GAAP. For a definition of Adjusted EBITDA and a reconciliation of Adjusted EBITDA to net income, see “Management’s Discussion and Analysis of Financial Condition and Results of Operations—Non-GAAP Financial Measure.” |
29
Table of Contents
UNAUDITED PRO FORMA CONSOLIDATED FINANCIAL STATEMENTS
The unaudited pro forma consolidated financial statements reflect the historical consolidated financial position of Marcus & Millichap Real Estate Investment Services, Inc., or MMREIS, at June 30, 2013 and the historical consolidated results of operations of MMREIS for the six-month period ended June 30, 2013 and the year ended December 31, 2012, as adjusted to give pro forma effect to (i) the termination of the MMREIS tax-sharing agreement; (ii) the modification of certain restricted stock awards and SARs held by the MMREIS managing directors, and grants of replacement awards, (iii) payment of quarterly preferred dividends in July 2013 in the amount of $6.5 million and in October 2013 in the amount of $ million to distribute MMREIS’s earnings for the quarters ended June 30 and September 30, 2013, respectively, to MMC, and (iv) the net proceeds of this offering of $ million.
In management’s opinion, the unaudited pro forma consolidated financial statements reflect certain adjustments that are necessary to present fairly our unaudited pro forma consolidated results of operations and our unaudited pro forma consolidated balance sheet as of and for the periods indicated. The pro forma adjustments give effect to events that are (i) directly attributable to the transactions described above, (ii) factually supportable; and, with respect to the statement of operations, (iii) expected to have a continuing impact on us. The pro forma adjustments are based on assumptions that management believes are reasonable given the best information currently available.
The unaudited pro forma consolidated financial statements are for illustrative and informational purposes only and are not intended to represent what our results of operations or financial position would have been had we operated as a standalone public company during the periods presented or if the transactions described below had actually occurred as of the dates indicated. The unaudited pro forma consolidated financial statements should not be considered indicative of our future results of operations or financial position as a standalone public company.
The following unaudited pro forma consolidated financial statements should be read together with our consolidated financial statements and related notes, and “Management’s Discussion and Analysis of Financial Condition and Results of Operations,” which are included elsewhere in this prospectus.
30
Table of Contents
Pro Forma Consolidated Balance Sheet
As of June 30, 2013
(In thousands, except share and per share amounts)
| Consolidated Historical |
Tax- Adjustments |
Stock Compensation Adjustments |
Preferred Dividend Adjustments |
Net Offering Proceeds |
Pro Forma | |||||||||||||||||||
| (A) | (B) | (C) | (D) | |||||||||||||||||||||
| Assets |
||||||||||||||||||||||||
| Current assets: |
||||||||||||||||||||||||
| Cash and cash equivalents |
$ | 19,362 | $ | — | $ | $ | $ | $ | ||||||||||||||||
| Commissions and notes receivable, net of allowance for doubtful accounts of $129 |
4,935 | — | ||||||||||||||||||||||
| Employee notes receivable |
141 | — | ||||||||||||||||||||||
| Prepaid expenses |
4,759 | — | ||||||||||||||||||||||
| Deferred tax assets, net |
— | 5,055 | ||||||||||||||||||||||
|
|
|
|
|
|
|
|
|
|
|
|
|
|||||||||||||
| Total current assets |
29,197 | 5,055 | ||||||||||||||||||||||
| Prepaid rent |
3,598 | — | ||||||||||||||||||||||
| Investments held in rabbi trust account |
3,669 | — | ||||||||||||||||||||||
| Property and equipment, net of accumulated depreciation of $17,126 |
7,592 | — | ||||||||||||||||||||||
| Due from affiliates |
— | — | ||||||||||||||||||||||
| Employee notes receivable |
228 | — | ||||||||||||||||||||||
| Deferred tax assets, net |
— | 6,371 | ||||||||||||||||||||||
| Other assets |
3,736 | — | ||||||||||||||||||||||
|
|
|
|
|
|
|
|
|
|
|
|
|
|||||||||||||
| Total assets |
$ | 48,020 | $ | 11,426 | $ | $ | $ | $ | ||||||||||||||||
|
|
|
|
|
|
|
|
|
|
|
|
|
|||||||||||||
| Liabilities and stockholders’ equity |
||||||||||||||||||||||||
| Current liabilities: |
||||||||||||||||||||||||
| Accounts payable and accrued expenses |
$ | 5,645 | $ | — | $ | $ | $ | $ | ||||||||||||||||
| Commissions payable |
11,907 | — | ||||||||||||||||||||||
| Due to affiliates |
2,914 | — | ||||||||||||||||||||||
| Accrued employee expenses |
6,251 | — | ||||||||||||||||||||||
|
|
|
|
|
|
|
|
|
|
|
|
|
|||||||||||||
| Total current liabilities |
26,717 | — | ||||||||||||||||||||||
| Deferred compensation and commissions |
8,337 | — | ||||||||||||||||||||||
| Notes payable to former stockholders |
— | — | ||||||||||||||||||||||
| SARs liability |
— | — | ||||||||||||||||||||||
| Income tax payable |
— | — | ||||||||||||||||||||||
| Other liabilities |
4,804 | — | ||||||||||||||||||||||
|
|
|
|
|
|
|
|
|
|
|
|
|
|||||||||||||
| Total liabilities |
39,858 | — | ||||||||||||||||||||||
| Commitments and contingencies |
||||||||||||||||||||||||
| Stockholders’ equity: |
||||||||||||||||||||||||
| Series A redeemable preferred stock, $10.00 par value: |
||||||||||||||||||||||||
| Authorized shares—1,000; issued and outstanding shares—1,000, $10.00 redemption value per share |
10 | — | ||||||||||||||||||||||
| Common stock, $1.00 par value: |
||||||||||||||||||||||||
| Authorized shares—1,000,000; issued and outstanding shares—234,489 |
235 | — | ||||||||||||||||||||||
| Additional paid-in capital |
1,514 | 11,426 | ||||||||||||||||||||||
| Stock notes receivable from employees |
(62 | ) | — | |||||||||||||||||||||
| Retained earnings (accumulated deficit) |
6,465 | — | ||||||||||||||||||||||
|
|
|
|
|
|
|
|
|
|
|
|
|
|||||||||||||
| Total stockholders’ equity |
8,162 | 11,426 | ||||||||||||||||||||||
|
|
|
|
|
|
|
|
|
|
|
|
|
|||||||||||||
| Total liabilities and stockholders’ equity |
$ | 48,020 | $11,426 | $ | $ | $ | $ | |||||||||||||||||
|
|
|
|
|
|
|
|
|
|
|
|
|
|||||||||||||
31
Table of Contents
Pro Forma Consolidated Statement of Income
for the Six Months Ended June 30, 2013
(In thousands, except per share amounts)
| Consolidated Historical |
Tax- Adjustments |
Stock Compensation Adjustments |
Pro Forma | |||||||||||||
| (E) | (F) | |||||||||||||||
| Revenues: |
||||||||||||||||
| Real estate brokerage commissions |
$ | 156,963 | $ | — | $ | $ | ||||||||||
| Financing fees |
11,888 | — | ||||||||||||||
| Other revenues |
5,990 | — | ||||||||||||||
|
|
|
|
|
|
|
|
|
|||||||||
| Total revenues |
174,841 | — | ||||||||||||||
| Operating expenses: |
||||||||||||||||
| Cost of services |
102,677 | — | ||||||||||||||
| Selling, general, and administrative expense |
53,824 | — | ||||||||||||||
| Depreciation and amortization expense |
1,514 | — | ||||||||||||||
|
|
|
|
|
|
|
|
|
|||||||||
| Total operating expenses |
158,015 | — | ||||||||||||||
|
|
|
|
|
|
|
|
|
|||||||||
| Operating income |
16,826 | — | ||||||||||||||
| Other income (expense), net |
249 | — | ||||||||||||||
|
|
|
|
|
|
|
|
|
|||||||||
| Income before provision for income taxes |
17,075 | — | ||||||||||||||
| Provision for income taxes |
7,428 | (189 | ) | |||||||||||||
|
|
|
|
|
|
|
|
|
|||||||||
| Net income (loss) |
$ | 9,647 | $ | 189 | $ | $ | ||||||||||
|
|
|
|
|
|
|
|
|
|||||||||
| Earnings per share (G) |
$ | |||||||||||||||
|
|
|
|||||||||||||||
32
Table of Contents
Pro Forma Consolidated Statement of Income
for the Year Ended December 31, 2012
(In thousands, except per share amounts)
| Historical | Tax- Adjustments |
Stock Compensation Adjustments |
Pro Forma | |||||||||||||
| (H) | (I) | |||||||||||||||
| Revenues: |
||||||||||||||||
| Real estate brokerage commissions |
$ | 351,407 | $ | — | $ | $ | ||||||||||
| Financing fees |
21,132 | — | ||||||||||||||
| Other revenues |
13,177 | — | ||||||||||||||
|
|
|
|
|
|
|
|
|
|||||||||
| Total revenues |
385,716 | — | ||||||||||||||
| Operating expenses: |
||||||||||||||||
| Cost of services |
230,248 | — | ||||||||||||||
| Selling, general, and administrative expense |
103,479 | — | ||||||||||||||
| Depreciation and amortization expense |
2,981 | — | ||||||||||||||
|
|
|
|
|
|
|
|
|
|||||||||
| Total operating expenses |
336,708 | — | ||||||||||||||
|
|
|
|
|
|
|
|
|
|||||||||
| Operating income |
49,008 | — | ||||||||||||||
| Other income (expense), net |
433 | — | ||||||||||||||
|
|
|
|
|
|
|
|
|
|||||||||
| Income before provision for income taxes |
49,441 | — | ||||||||||||||
| Provision for income taxes |
21,507 | 193 | ||||||||||||||
|
|
|
|
|
|
|
|
|
|||||||||
| Net income (loss) |
$ | 27,934 | $ | (193) | $ | $ | ||||||||||
|
|
|
|
|
|
|
|
|
|||||||||
| Earnings per share (J) |
$ | |||||||||||||||
|
|
|
|||||||||||||||
33
Table of Contents
Notes to Unaudited Pro Forma Consolidated Financial Statements
Note 1. Notes to Unaudited Pro Forma Consolidated Balance Sheet as of June 30, 2013
| (A) | Reflects the termination of the tax-sharing agreement between MMREIS and MMC as if such agreement had been terminated on June 30, 2013. Under the tax-sharing agreement, MMREIS provided for income taxes using an effective tax rate of 43.5%, with a related obligation to MMC. The pro forma adjustments reflect the assumption of current deferred tax assets, net of $5.1 million and noncurrent deferred tax assets, net of $6.4 million through a non-cash contribution from MMC at June 30, 2013. |
| (B) | Reflects modifications to MMREIS’s book value stock-based compensation award program that are expected to be made concurrent with the Spin-Off and this offering, as if such modifications had been made on June 30, 2013. The pro forma adjustments reflect (i) the assumption of a liability of approximately $ related to amounts frozen under the stock appreciation rights, or SARs, program through a non-cash deemed distribution to MMC; (ii) the assumption of a liability of approximately $ related to amounts payable to former MMREIS shareholders through a non-cash deemed distribution to MMC; (iii) a decrease in additional paid in capital of approximately $ attributable to grants of fully-vested stock-based compensation awards, and (iv) deferred tax assets totaling $ resulting from these items using a pro forma effective tax rate of %. The liabilities are based on agreements MMREIS has signed with current or former employees but where MMC has historically assumed these obligations. |
| (C) | Reflects the quarterly preferred dividends of $6.5 million and $ million to distribute MMREIS’s earnings for the quarters ended June 30 and September 30, 2013, respectively, to MMC as if such dividends had been paid on June 30, 2013. |
| (D) | Reflects the net proceeds of this offering of $ million. |
Note 2. Notes to Unaudited Pro Forma Consolidated Statement of Income for the six months ended June 30, 2013
| (E) | Reflects the termination of the tax-sharing agreement between MMREIS and MMC as if such agreement had been terminated on January 1, 2012. Under the tax-sharing agreement, MMREIS provided for income taxes using an effective tax rate of 43.5%, with a related obligation to MMC. The pro forma adjustments reflect MMREIS’s tax provision calculated as if it were a stand-alone taxpayer, subject to federal and state income tax as a subchapter C corporation, effective January 1, 2012 using an effective tax rate of approximately 42.4%. |
| (F) | Reflects modifications to MMREIS’s book value stock-based compensation award program and grants of new stock-based compensation awards that are expected to be made concurrent with this offering, as if such modifications and grants had been made on January 1, 2012. The pro forma adjustments reflect (i) the reversal of historical compensation expense of approximately $ million due to the assumed modification of these awards as of January 1, 2012; (ii) interest expense of approximately $ related to outstanding principal amounts payable to former MMREIS stockholders; and (iii) the resulting changes in income tax expense using a pro forma effective tax rate of 42.4%. |
| (G) | Pro forma earnings per share is computed by dividing pro forma net income for the six months ended June 30, 2013 of $ by pro forma weighted average shares outstanding subsequent to the Spin-Off of . |
34
Table of Contents
Note 3. Notes to Unaudited Pro Forma Consolidated Statement of Income for the year ended December 31, 2012
| (H) | Reflects the termination of the tax-sharing agreement between MMREIS and MMC, as if such agreement had been terminated on January 1, 2012. Under the tax-sharing agreement, MMREIS provided for income taxes using an effective tax rate of 43.5%, with a related obligation to MMC. The pro forma adjustments reflect MMREIS’s tax provision calculated as if it were a stand-alone taxpayer subject to federal and state income tax as a subchapter C corporation, effective January 1, 2012, using an effective tax rate of approximately 43.9%. |
| (I) | Reflects modifications to MMREIS’s book value stock-based compensation award program and grants of new stock-based compensation awards that are expected to be made concurrent with this offering, as if such modifications and grants had been made on January 1, 2012. The pro forma adjustments reflect (i) compensation expense of approximately $ related to vesting of restricted stock and SARs awards, and the modification to remove the formula settlement value; (ii) interest expense of approximately $ related to outstanding principal amounts payable to former MMREIS stockholders; (iii) compensation expense of approximately $ related to deferred stock units granted to MMREIS’s managing directors concurrent with this offering; and (iv) the resulting changes in income tax expense using a pro forma effective tax rate of 43.9%. |
| (J) | Pro forma earnings per share is computed by dividing pro forma net income for the year ended December 31, 2012 of $ by pro forma weighted average shares outstanding subsequent to the Spin-Off of . |
35
Table of Contents
Marcus & Millichap Real Estate Investment Services Inc., or MMREIS, our operating company, was incorporated in 1976 and, prior to the completion of this offering, is a majority owned subsidiary of Marcus & Millichap Company, or MMC. In preparation for the spin-off of its real estate investment services business, or the Spin-Off, MMC formed Marcus & Millichap, Inc., or Marcus & Millichap, in June 2013.
Prior to the completion of this offering, the following steps will be taken to effect the Spin-Off:
| • | MMC will contribute its approximately 88% interest in the MMREIS common stock and 100% of the MMREIS preferred stock to Marcus & Millichap in exchange for Marcus & Millichap common stock. The remaining shareholders of MMREIS will simultaneously contribute their MMREIS common stock to Marcus & Millichap in exchange for Marcus & Millichap common stock. We refer to MMC’s and the remaining MMREIS shareholders’ contributions as the Contribution. As a result, MMREIS will become a wholly-owned subsidiary of Marcus & Millichap, and the former shareholders of MMREIS will become the shareholders of Marcus & Millichap. |
| • | MMC will undertake an exchange of Marcus & Millichap common stock that it currently owns for (i) MMC debt of approximately $24.0 million owed to two former MMC shareholders as a result of the redemption or purchase of their shares of MMC in 2001 and 2008 and (ii) MMC debt of approximately $25.5 million owed by Usonia Ventures, LLC, a wholly owned subsidiary of MMC, to George M. Marcus since 2009, which we refer to as the Debt-for-Equity Exchange; provided that in all events, MMC will distribute at least 80% of our stock to its stockholders in the distribution described below. It is expected that the former MMC shareholders and Mr. Marcus will sell all of the stock that they receive in the Debt-for-Equity Exchange to the public in this offering as selling stockholders. The underwriters are expected to close this offering on the same day as the closing of the Debt-for-Equity Exchange. |
| • | MMC will distribute to its shareholders, on a pro rata basis, % of the shares of Marcus & Millichap common stock, which we refer to as the Distribution, and the shareholders of MMC will contribute all of their respective shares of Marcus & Millichap common stock to a newly formed limited liability company in exchange for membership interests in such limited liability company. |
As part of the Spin-Off, we and MMC will enter into certain agreements, including a tax matters agreement governing the parties’ respective rights, responsibilities and obligations with respect to taxes, and a transition services agreement, pursuant to which certain MMC employees will provide certain services to us for a limited period of time, including, but not limited to, the sharing of costs relating to certain insurance coverages and health plans, legal services and information technology management. For more information regarding the agreements we will enter into with MMC, see “Certain Relationships and Related Transactions—Relationship with Marcus & Millichap Company.”
36
Table of Contents
The following chart reflects our organizational structure prior to the Spin-Off and this offering:
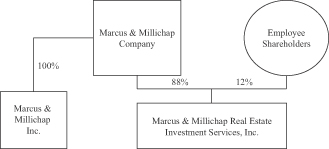
The following chart reflects our organizational structure following the Spin-Off and this offering:
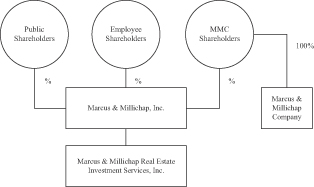
We and MMC are undertaking the Spin-Off for several corporate business purposes, including the following:
| • | enabling us to raise significantly more funds in this offering by unburdening us from the business risks, financial risks and capital requirements of MMC’s other businesses, and allowing our management to focus on implementing our business strategies; |
| • | facilitating incentive compensation arrangements for employees and sales professionals more directly tied to our business performance, and enhancing hiring and retention by, among other things, improving the alignment of management and employee incentives with performance and growth objectives of our business; |
| • | reducing MMC’s leverage and debt service requirements through the Debt-for-Equity Exchange, thereby providing MMC with greater funding capacity and opportunities for growth going forward; |
| • | providing greater ability for us to grow by opening new offices, expanding our presence in the markets in which we currently operate, acquiring new groups or firms, developing our institutional brokerage brand (IPA) and accelerating our international expansion; |
| • | enabling us to invest in the next series of proprietary real estate technology and brokerage tools to improve our productivity, analysis and marketing; |
| • | enabling us to upgrade our sales professionals’ training programs and management development program, and expand our branding and business development campaigns; and |
| • | creating an independent equity structure and providing publicly traded stock that will facilitate our ability to make future acquisitions utilizing our common stock. |
37
Table of Contents
In conjunction with this offering and the termination of the tax-sharing agreement between MMREIS and MMC, certain liabilities and legal obligations of MMREIS, including (i) liabilities for stock appreciation rights, or SARs, and restricted stock plan awards held by certain MMREIS key employees, and (ii) notes payable to certain former shareholders of MMREIS in settlement of SARs and restricted stock awards which were redeemed by MMREIS upon the termination of employment by these former shareholders, that had been previously assumed by MMC will be transferred back to MMREIS. In addition, MMREIS will be allocated deferred income tax assets and liabilities that originated from MMREIS transactions prior to the termination of the tax-sharing agreement. The net impact of these transactions, which are expected to result in the assumption of a net liability by MMREIS, will be reflected as a reduction in stockholders’ equity and shown in the pro forma capitalization table. See the “Unaudited Pro Forma Consolidated Financial Statements—Notes to Unaudited Pro Forma Consolidated Financial Statements.”
38
Table of Contents
MANAGEMENT’S DISCUSSION AND ANALYSIS OF
FINANCIAL CONDITION AND RESULTS OF OPERATIONS
The following discussion and analysis should be read together with the consolidated financial statements and the accompanying notes included elsewhere in this prospectus. Immediately prior to the completion of this offering, Marcus & Millichap Company will complete a spin-off of its real estate investment services business pursuant to which Marcus & Millichap Real Estate Investment Services, Inc. will become our wholly owned subsidiary, which we refer to herein as the “Spin-Off.” As used in this section, unless the context otherwise requires, “Marcus & Millichap,” “Marcus & Millichap Real Estate Investment Service,” “MMREIS,” “we,” “us,” “our” and “company” refer to Marcus & Millichap, Inc., or Marcus & Millichap Real Estate Investment Services, Inc. This discussion and analysis contains forward-looking statements. See “Special Note Regarding Forward-Looking Statements” and “Risk Factors” for a discussion of risks and uncertainties associated with such forward-looking statements. Actual results could differ materially from those anticipated or implied in any forward-looking statements.
Overview
We are a leading national brokerage firm specializing in commercial real estate investment sales, financing, research and advisory services. We have been the top commercial real estate investment broker in the United States based on the number of investment transactions over the last 10 years, based on data from CoStar and Real Capital Analytics. We have more than 1,100 investment sales and financing professionals in 73 offices who provide investment brokerage and financing services to sellers and buyers of commercial real estate. We also offer market research, consulting and advisory services to our clients. In 2012, we closed more than 6,100 sales, financing and other transactions with total volume of approximately $22 billion. For the six months ended June 30, 2013, we closed more than 2,500 sales, financing and other transactions with total volume of approximately $8.3 billion.
We generate revenues by collecting real estate brokerage commissions upon the sale and fees upon the financing of commercial properties and, in addition, by providing consulting and advisory services. Real estate brokerage commissions are typically based upon the value of the property, and financing fees are typically based upon the size of the loan. In 2012, approximately 91% of our revenues were generated from real estate brokerage commissions, 6% from financing fees and 3% from other fees, including consulting and advisory services. For the six months ended June 30, 2013, approximately 90% of our revenues were generated from real estate brokerage commissions, 7% from financing fees and 3% from other fees, including consulting and advisory services.
Factors Affecting Our Business
Our business and our operating results, financial condition and liquidity are significantly affected by the number and size of commercial real estate sales and financing transactions. The number and volume of these transactions is affected by general trends in the economy and real estate industry, particularly including:
| • | Economic and commercial real estate market conditions. Our business is dependent on economic conditions and the demand for commercial real estate and related services in the markets in which we operate. Changes in the economy on a national, regional or local basis can have a positive or negative impact on our business. Fluctuations in acquisition and disposition activity, as well as general commercial real estate investment activity, can impact commissions for arranging such transactions, as well as impacting fees for arranging financing for acquirers and property owners that are seeking to recapitalize their existing properties. In each period discussed, the number of commercial real estate transactions for both the industry and us has increased. |
| • | Credit and liquidity in the financial markets. Since real estate purchases are often financed with debt, credit and liquidity issues in the financial markets have a direct impact on flow of capital to the commercial real estate markets as well as transaction activity and prices. For the periods discussed, credit availability and liquidity were favorable after having been significantly limited in 2008 and 2009. |
39
Table of Contents
| • | Demand for investment in commercial real estate. The willingness of private investors to invest in commercial real estate is affected by factors beyond our control, including the performance of real estate assets when compared with the performance of other investments. |
| • | Fluctuations in interest rates. Changes in interest rates as well as steady and protracted movements of interest rates in one direction (increases or decreases) could adversely or positively affect the operation and income of commercial real estate properties, as well as the demand from investors for commercial real estate investments. In particular, increased interest rates may cause prices to decrease due to the increased costs of obtaining financing and could lead to decreases in purchase and sale activities, thereby reducing the amounts of investment sales and loan originations. In contrast, decreased interest rates will generally decrease the costs of obtaining financing which could lead to increases in purchase and sales activities. For the periods discussed, interest rates generally remained low and have not fluctuated significantly. |
Operating Segments
An operating segment is defined as a component of an enterprise that engages in business activities from which it may earn revenues and incur expenses whose separate financial information is available and is evaluated regularly by our chief operating decision maker, or CODM, to perform resource allocations and performance assessments. Our CODM is our Chief Executive Officer and Chief Financial Officer. Our CODM reviews financial information presented on an office-by-office basis for purposes of making operating decisions, assessing financial performance and allocating resources. Based on the evaluation of our financial information, our management believes that our offices represent individual operating segments with similar economic characteristics that meet the criteria for aggregation into a single reportable segment for financial statement purposes. Our financing operations also represent an individual operating segment, which does not meet the thresholds to be presented as a separate reportable segment.
Key Financial Measures and Indicators
Revenues
Our revenues are primarily generated from our real estate investment sales business. In addition to real estate brokerage commissions, we generate revenues from financing fees and from other revenues, which are primarily comprised of consulting and advisory fees.
| • | Real estate brokerage commissions. We earn real estate brokerage commissions by acting as a broker for commercial real estate owners seeking to sell or investors seeking to buy properties. Revenues from real estate brokerage commissions are recognized at the earlier of the close of escrow or the transfer of title between the seller and buyer. |
| • | Financing fees. We earn financing fees by securing financing on purchase transactions as well as by refinancing our clients’ existing mortgage debt. We recognize financing fee revenues at the time the loan closes and we have no remaining significant obligations for performance in connection with the transaction. |
| • | Other revenues. Other revenues include fees generated from consulting and advisory services performed by our investment sales professionals, as well as referral fees from other real estate brokers. Revenues from these services are recognized as they are performed and completed. |
Substantially all of our transactions are success based, with a small percentage including retainer fees (such retainer fees are credited against a success-based fee upon the closing of a transaction) and/or breakage fees. Transactions that are terminated before completion will sometimes generate breakage fees, which are usually calculated as a set amount or a percentage of the fee we would have received had the transaction closed. The amount and timing of all of the fees paid vary by the type of transaction and are generally negotiated on a transaction-by-transaction basis.
40
Table of Contents
Operating Expenses
Our operating expenses consist of cost of services, selling, general and administrative expenses and depreciation and amortization expenses. The significant components of our expenses are further described below.
| • | Cost of services. The majority of our cost of services expense is commission expense. Commission expenses are directly attributable to providing services to our clients for investment sales and mortgage brokerage services. Most of our transaction professionals are independent contractors and are paid commissions; however, there are some who are initially paid a salary and as such, these expenses also include employee-related compensation, employer taxes and benefits. In addition, some of our most senior investment sales professionals have the ability to earn additional commissions after meeting certain annual revenue thresholds. These additional commissions are recognized as cost of services in the period in which they are earned. Payment of a portion of these additional commissions are deferred for a period of three years and paid at the beginning of the fourth calendar year. Cost of services also includes referral fees paid to other real estate brokers. |
| • | Selling, general & administrative expenses. The largest expense component within selling, general and administrative expenses is personnel expenses for our management team and support staff. In addition, these costs include facilities costs (excluding depreciation and amortization), staff related expenses, sales, marketing, legal, telecommunication, network, data sources and other administrative expenses. Also included in selling, general and administrative are expenses related to stock-based compensation to key employees. |
Historically, we have issued stock options and stock appreciation rights, or SARs, to key employees through a book value, stock-based compensation award program. The program gave certain employees the option to acquire unvested restricted stock and issued an equivalent number of unvested SARs, typically in exchange for a note receivable. Awards under the program typically vested over a three to five-year period, and could be redeemed or repurchased upon the occurrence of certain events, including termination of employment. Compensation expense was recognized over the vesting term based upon the formula settlement value of the awards.
In conjunction with this offering, we expect to (i) accelerate the vesting of all unvested restricted stock and SARs, (ii) remove the formula settlement value for the restricted stock, (iii) freeze the SARs at the existing liability amount and (iv) grant deferred stock units, or DSUs, to replace beneficial ownership in the SARs, all of which will be fully vested but subject to sales restrictions that lapse over a period of continued employment. To the extent the stock is no longer restricted and replacement awards are fully vested, we will recognize an immediate compensation charge concurrent with this offering of $ million, net of future income tax benefits of $ million, assuming an offering price at the midpoint of the initial public offering price range set forth on the cover page of this prospectus. In addition, as a result of the removal of the formula settlement value, the modification of the unvested restricted stock will result in the awards being classified as equity awards. Subsequent to the completion of this offering, we will issue stock-based compensation awards to our officers and directors pursuant to the 2013 Omnibus Equity Incentive Plan.
As a result of the Spin-Off and this offering, we will no longer be a privately-owned company and our costs for such items as insurance, accounting and legal advice will increase relative to our historical costs for such services. We will also incur costs which we have not previously incurred for directors fees, increased directors and officers insurance, investor relations fees, expenses for compliance with the Sarbanes-Oxley Act and new rules implemented by the Securities and Exchange Commission and the New York Stock Exchange, and various other costs of a public company.
| • | Depreciation and amortization expense. Depreciation and amortization expense consists of depreciation and amortization recorded on our leasehold improvements, furniture, fixture, and equipment |
41
Table of Contents
| assets. Depreciation is provided over estimated useful lives ranging from three to seven years for owned assets or over the lesser of the asset estimated useful lives or the related lease term for leased assets. |
Other Income and Expenses, Net
Other income primarily consists of gains or losses, net on our deferred compensation plan assets, interest income and other non-operating gains or losses.
Provision for Income Taxes
For the years ended December 31, 2012, 2011 and 2010 and the six months ended June 30, 2012 and 2013, our provision for income taxes was based on a tax-sharing agreement between us and MMC, which stipulates an effective annual tax rate of 43.5%. We anticipate filing as a stand-alone tax entity for tax purposes in the future. When we file as a stand-alone tax entity our future taxable income will be subject to the applicable U.S. federal and state and local tax rates in the jurisdictions in which the taxable income is generated. The change to a stand-alone entity for tax purposes may result in material changes to our income tax provision in future years. We will also need to provide for deferred income taxes which may result in the recognition of significant deferred tax assets and/or liabilities within our consolidated balance sheet. For information on our pro forma deferred income taxes and effective tax rate as a stand-alone tax entity, see “Unaudited Pro Forma Combined Financial Statements.”
Jumpstart Our Business Startups Act
On April 5, 2012, the Jumpstart Our Business Startups Act, or the JOBS Act, was signed into law. The JOBS Act contains provisions that, among other things, reduce certain reporting requirements for an “emerging growth company.”
Subject to certain conditions set forth in the JOBS Act, if as an “emerging growth company” we choose to rely on such exemptions, we may not be required to, among other things, (i) provide an auditor’s attestation report on our system of internal controls over financial reporting pursuant to Section 404 of the Sarbanes-Oxley Act, (ii) provide all of the compensation disclosure that may be required of non-emerging growth public companies under the Dodd-Frank Wall Street Reform and Consumer Protection Act, (iii) comply with any requirement that may be adopted by the PCAOB regarding mandatory audit firm rotation or a supplement to the auditor’s report providing additional information about the audit and the financial statements (auditor discussion and analysis) and (iv) disclose certain executive compensation-related items such as the correlation between executive compensation and performance and comparisons of the Chief Executive Officer’s compensation to median employee compensation. These exemptions will apply for a period of five years following the completion of our initial public offering or until we no longer meet the requirements of being an “emerging growth company,” upon the earlier of (i) the first fiscal year after our annual gross revenues are $1 billion or more, (ii) the date on which we have, during the previous three-year period, issued more than $1 billion in non-convertible debt securities, and (iii) the date on which we are deemed to be a “large accelerated filer” as defined in the Exchange Act.
We have irrevocably elected to opt out of the extended transition period for complying with new or revised accounting standards pursuant to Section 107(b) of the JOBS Act, and therefore, we will be subject to the same new or revised accounting standards as other public companies that are not “emerging growth companies.”
Results of Operations
Following is a discussion of our results of operations for the six months ended June 30, 2012 and 2013 and the years ended December 31, 2010, 2011 and 2012. The tables included in the period comparisons below provide summaries of our results of operations. The period-to-period comparisons of financial results are not necessarily indicative of future results.
42
Table of Contents
We regularly review a number of key metrics to evaluate our business, measure our performance, identify trends affecting our business, formulate financial projections and make strategic decisions. Such key metrics include the following:
| Year Ended December 31, |
Six Months Ended June 30, |
|||||||||||||||||||
| Real Estate Brokerage Commissions |
2010 | 2011 | 2012 | 2012 | 2013 | |||||||||||||||
| Average Number of Sales Professionals |
1,084 | 968 | 982 | 973 | 1,082 | |||||||||||||||
| Average Number of Transactions per |
2.7 | 3.3 | 4.3 | 1.8 | 1.9 | |||||||||||||||
| Average Commission per Transaction |
$ | 68,355 | $ | 77,686 | $ | 83,075 | $ | 77,744 | $ | 77,018 | ||||||||||
| Average Transaction Size |
$ | 2,907,184 | $ | 3,551,433 | $ | 3,760,741 | $ | 3,384,424 | $ | 3,440,436 | ||||||||||
| Total Number of Transactions |
2,902 | 3,158 | 4,230 | 1,716 | 2,038 | |||||||||||||||
| Total Sales Volume (in millions) |
$ | 8,437 | $ | 11,215 | $ | 15,908 | $ | 5,808 | $ | 7,012 | ||||||||||
| Year Ended December 31, |
Six Months Ended June 30, |
|||||||||||||||||||
| Financing Fees |
2010 | 2011 | 2012 | 2012 | 2013 | |||||||||||||||
| Average Number of Financing Professionals |
46 | 48 | 58 | 57 | 68 | |||||||||||||||
| Average Number of Transactions per |
9.8 | 15.5 | 15.7 | 6.9 | 8.1 | |||||||||||||||
| Average Fee per Transaction |
$ | 24,206 | $ | 22,267 | $ | 23,170 | $ | 21,073 | $ | 21,691 | ||||||||||
| Average Transaction Size |
$ | 2,189,658 | $ | 2,394,282 | $ | 2,417,818 | $ | 2,217,179 | $ | 2,138,292 | ||||||||||
| Total Number of Transactions |
451 | 742 | 912 | 390 | 548 | |||||||||||||||
| Total Dollar Volume (in millions) |
$ | 988 | $ | 1,777 | $ | 2,205 | $ | 865 | $ | 1,172 | ||||||||||
Six Months Ended June 30, 2012 Compared to Six Months Ended June 30, 2013
| Six Months Ended June 30, 2012 |
Percentage of Revenue |
Six Months Ended June 30, 2013 |
Percentage of Revenue |
Total Dollar Change |
Total Percentage Change |
|||||||||||||||||||
| (Dollars in thousands) |
||||||||||||||||||||||||
| Revenues: |
||||||||||||||||||||||||
| Real estate brokerage commissions |
$ | 133,409 | 90.8 | % | $ | 156,963 | 89.8 | % | $ | 23,554 | 17.7 | % | ||||||||||||
| Financing fees |
8,218 | 5.6 | 11,888 | 6.8 | 3,670 | 44.7 | ||||||||||||||||||
| Other revenues |
5,223 | 3.6 | 5,990 | 3.4 | 767 | 14.7 | ||||||||||||||||||
|
|
|
|
|
|
|
|
|
|
|
|
|
|||||||||||||
| Total revenues |
146,850 | 100.0 | 174,841 | 100.0 | 27,991 | 19.1 | ||||||||||||||||||
| Operating expenses: |
||||||||||||||||||||||||
| Cost of services |
84,709 | 57.7 | 102,677 | 58.7 | 17,968 | 21.2 | ||||||||||||||||||
| Selling, general, and administrative expense |
45,900 | 31.3 | 53,824 | 30.8 | 7,924 | 17.3 | ||||||||||||||||||
| Depreciation and amortization expense |
1,495 | 1.0 | 1,514 | 0.9 | 19 | 1.3 | ||||||||||||||||||
|
|
|
|
|
|
|
|
|
|
|
|
|
|||||||||||||
| Total operating expenses |
132,104 | 90.0 | 158,015 | 90.4 | 25,911 | 19.6 | ||||||||||||||||||
|
|
|
|
|
|
|
|
|
|
|
|
|
|||||||||||||
| Operating income |
14,746 | 10.0 | 16,826 | 9.6 | 2,080 | 14.1 | ||||||||||||||||||
| Other income (expense), net |
283 | 0.2 | 249 | 0.1 | (34 | ) | (12.0 | ) | ||||||||||||||||
|
|
|
|
|
|
|
|
|
|
|
|
|
|||||||||||||
| Income before provision for income taxes |
15,029 | 10.2 | 17,075 | 9.7 | 2,046 | 13.6 | ||||||||||||||||||
| Provision for income taxes |
6,538 | 4.4 | 7,428 | 4.2 | 890 | 13.6 | ||||||||||||||||||
|
|
|
|
|
|
|
|
|
|
|
|
|
|||||||||||||
| Net income |
$ | 8,491 | 5.8 | % | $ | 9,647 | 5.5 | % | $ | 1,156 | 13.6 | % | ||||||||||||
|
|
|
|
|
|
|
|
|
|
|
|
|
|||||||||||||
| Adjusted EBITDA (1) |
$ | 18,634 | 12.7 | % | $ | 21,131 | 12.1 | % | $ | 2,497 | 13.4 | % | ||||||||||||
| (1) | Adjusted EBITDA is not a measurement of our financial performance under U.S. GAAP and should not be considered as an alternative to net income, operating income or any other measures derived in accordance |
43
Table of Contents
| with U.S. GAAP. For a definition of Adjusted EBITDA and a reconciliation of Adjusted EBITDA to net income, see “—Non-GAAP Financial Measure.” |
Revenues. Our total revenues were $174.8 million for the six months ended June 30, 2013 compared to $146.9 million for the same period in 2012, an increase of $28.0 million, or 19.1%. Total revenues increased primarily as a result of increases in real estate brokerage commissions, which contributed 84.1% of the total increase, as well as increases in financing fees and other revenues. The six months ended June 30, 2013 also included the impacts of the fiscal cliff and the associated uncertainty surrounding the potential impacts to the U.S. tax code, which resulted in transactions being accelerated into the three months ended December 31, 2012 that may have otherwise occurred during the first six months of 2013.
| • | Real estate brokerage commissions. Revenues from real estate brokerage commissions increased from $133.4 million for the six months ended June 30, 2012 to $157.0 million in the same period of 2013, an increase of $23.6 million or 17.7%. The increase was primarily driven by an increase in the number of investment sales transactions during the six months ended June 30, 2013 as compared to the same period in 2012. |
| • | Financing fees. Revenues from financing fees increased from $8.2 million for the six months ended June 30, 2012 to $11.9 million for the six months ended June 30, 2013, an increase of $3.7 million or 44.7%. The increase was primarily driven by a 40.5% increase in the number of loan transactions due to an increase in the number of financing professionals combined with an increase in their productivity levels during the six months ended June 30, 2013 as compared to the same period in 2012. |
| • | Other revenues. Other revenues increased from $5.2 million for the six months ended June 30, 2012 to $6.0 million for the six months ended June 30, 2013, an increase of $0.8 million or 14.7%. The increase was primarily driven by an increase in fees generated from advisory services during the six months ended June 30, 2013 as compared to the same period in 2012. |
Total operating expenses. Our total operating expenses were $158.0 million for the six months ended June 30, 2013 compared to $132.1 million for the same period in 2012, an increase of $25.9 million, or 19.6%. Expenses increased primarily due to an increase in cost of services which is primarily commissions paid to our investment sales professionals and compensation-related costs related to our financing activities. Selling, general and administrative costs increased as well, as described below.
| • | Cost of services. Cost of services for the six months ended June 30, 2013 increased approximately $18.0 million, or 21.2%, to $102.7 million from $84.7 million for the same period in 2012. The increase was primarily due to increased commission expenses driven by the increased revenues noted above and to a lesser extent an increase in the proportion of transactions closed by our senior sales agents that are paid higher commission rates. |
| • | Selling, general and administrative expense. Selling, general and administrative expense for the six months ended June 30, 2013 increased $7.9 million, or 17.3%, to $53.8 million from $45.9 million for the same period in 2012. The increase was primarily due to (i) a $3.6 million increase in staff salaries, wages and related benefits expenses driven by an increase in our average headcount to support our salesforce, including hiring of national and regional specialty directors and research staff to directly support our more senior agents, (ii) a $2.2 million increase in sales promotional expenses, driven by an increase in our annual sales recognition event due to an increase in the number of qualifiers based on the previous calendar year’s sales performance, and (iii) a $0.7 million increase in professional fees primarily driven by an increase in accounting and third party consulting services fees in preparation of being a public company. |
| • | Depreciation and amortization expense. There were no significant changes in depreciation and amortization expenses or other expenses in the six months ended June 30, 2013 as compared to the six months ended June 30, 2012. |
Other income/expense, net. Other income/expense, net was not significant for the six months ended June 30, 2013 or the six months ended June 30, 2012.
44
Table of Contents
Provision for income taxes. Income tax expense totaled $7.4 million for the six months ended June 30, 2013 as compared to $6.5 million in the same period in 2012, an increase of $0.9 million or 13.6%. The increase was attributable to the higher pre-tax income during the six months ended June 30, 2013 as compared to 2012. During the six months ended June 30, 2013 and 2012, our income tax expense was based on a tax-sharing agreement between us and MMC. As specified by the agreement, our effective tax rate was 43.5% for the six months ended June 30, 2013 and 2012. Subsequent to the completion of this offering, we anticipate our effective tax rate as a stand-alone tax entity to be approximately 41.0%.
Year Ended December 31, 2012 Compared to Year Ended December 31, 2011
| Year Ended December 31, 2011 |
Percentage of Revenue |
Year Ended December 31, 2012 |
Percentage of Revenue |
Total Dollar Change |
Total Percentage Change |
|||||||||||||||||||
| (Dollars in thousands) |
||||||||||||||||||||||||
| Revenues: |
||||||||||||||||||||||||
| Real estate brokerage commissions |
$ | 245,333 | 89.3 | % | $ | 351,407 | 91.1 | % | $ | 106,074 | 43.2 | % | ||||||||||||
| Financing fees |
16,522 | 6.0 | 21,132 | 5.5 | 4,610 | 27.9 | ||||||||||||||||||
| Other revenues |
12,850 | 4.7 | 13,177 | 3.4 | 327 | 2.5 | ||||||||||||||||||
|
|
|
|
|
|
|
|
|
|
|
|
|
|||||||||||||
| Total revenues |
274,705 | 100.0 | 385,716 | 100.0 | 111,011 | 40.4 | ||||||||||||||||||
| Operating expenses: |
||||||||||||||||||||||||
| Cost of services |
162,478 | 59.1 | 230,248 | 59.7 | 67,770 | 41.7 | ||||||||||||||||||
| Selling, general, and administrative expense |
85,801 | 31.2 | 103,479 | 26.8 | 17,678 | 20.6 | ||||||||||||||||||
| Depreciation and amortization expense |
2,971 | 1.1 | 2,981 | 0.8 | 10 | 0.3 | ||||||||||||||||||
|
|
|
|
|
|
|
|
|
|
|
|
|
|||||||||||||
| Total operating expenses |
251,250 | 91.5 | 336,708 | 87.3 | 85,458 | 34.0 | ||||||||||||||||||
|
|
|
|
|
|
|
|
|
|
|
|
|
|||||||||||||
| Operating income |
23,455 | 8.5 | 49,008 | 12.7 | 25,553 | 108.9 | ||||||||||||||||||
| Other income, net |
350 | 0.1 | 433 | 0.1 | 83 | 23.7 | ||||||||||||||||||
|
|
|
|
|
|
|
|
|
|
|
|
|
|||||||||||||
| Income before provision for income taxes |
23,805 | 8.7 | 49,441 | 12.8 | 25,636 | 107.7 | ||||||||||||||||||
| Provision for income taxes |
10,355 | 3.8 | 21,507 | 5.6 | 11,152 | 107.7 | ||||||||||||||||||
|
|
|
|
|
|
|
|
|
|
|
|
|
|||||||||||||
| Net income |
$ | 13,450 | 4.9 | % | $ | 27,934 | 7.2 | % | $ | 14,484 | 107.7 | % | ||||||||||||
|
|
|
|
|
|
|
|
|
|
|
|
|
|||||||||||||
| Adjusted EBITDA (1) |
$ | 29,486 | 10.7 | % | $ | 59,708 | 15.5 | % | $ | 30,222 | 102.5 | % | ||||||||||||
| (1) | Adjusted EBITDA is not a measurement of our financial performance under U.S. GAAP and should not be considered as an alternative to net income, operating income or any other measures derived in accordance with U.S. GAAP. For a definition of Adjusted EBITDA and a reconciliation of Adjusted EBITDA to net income, see “—Non-GAAP Financial Measure.” |
Revenues. Our total revenues were $385.7 million in 2012 compared to $274.7 million in 2011, an increase of $111.0 million, or 40.4%. Total revenues increased primarily as a result of increases in real estate brokerage commissions, which contributed 95.6% of the total increase, as well as increases in financing fees and other revenues. The year ended December 31, 2012 also included the impacts of the anticipated fiscal cliff, and the associated uncertainty surrounding the potential impacts to the U.S. tax code, which resulted in transactions being accelerated into 2012 that may have otherwise occurred during 2013.
| • | Real estate brokerage commissions. Revenues from real estate brokerage commissions increased from $245.3 million in 2011 to $351.4 million in 2012, an increase of $106.1 million or 43.2%. The increase was due to a combination of a 33.9% increase in the number of investment sales transactions and a 6.9% increase in the average commission size in 2012 as compared to the prior year. |
| • | Financing fees. Revenues from financing fees increased from $16.5 million in 2011 to $21.1 million in 2012, an increase of $4.6 million or 27.9%. The increase was driven by a combination of a 22.9% |
45
Table of Contents
| increase in the number of loan transactions and a 4.1% increase in the average loan commission size in 2012 as compared to the prior year. |
| • | Other revenues. Other revenues did not change significantly in 2012 as compared to the prior year. |
Total operating expenses. Our total operating expenses were $336.7 million in 2012 compared to $251.2 million in 2011, an increase of $85.5 million, or 34.0%. Expenses increased primarily due to an increase in cost of services which is primarily commissions paid to our investment sales professionals and compensation-related costs related to our mortgage brokerage activities. Selling, general and administrative costs increased as well, as described below.
| • | Cost of services. Cost of services in 2012 increased approximately $67.8 million, or 41.7%, to $230.2 million from $162.5 million in 2011. The increase was primarily due to increased commission expenses driven by the increased revenues noted above. Cost of services as a percentage of total revenues was consistent in 2012 and 2011. |
| • | Selling, general and administrative expense. Selling, general and administrative expense in 2012 increased $17.7 million, or 20.6%, to $103.5 million from $85.8 million in the prior year. The increase was due to a $7.5 million increase in management performance compensation driven by our strong 2012 operating results, a $5.9 million increase in staff salaries, wages and related benefits expenses driven by an increase in our average headcount in support of our salesforce, which includes the recruitment of national and regional specialty directors who support our more senior agents, a $4.6 million increase in stock based compensation expenses due to appreciation of the SARs and other equity awards as well as an increase in sales promotional activities. These increases were partially offset by a $3.4 million decrease in legal costs and accruals in 2012 as compared to the prior year driven by increased insurance recoveries from previous year’s legal matters, an increase in the number of legal matters managed by our in-house legal department and an overall decrease in legal activity. |
| • | Depreciation and amortization expense. There were no significant changes in depreciation and amortization expenses in 2012 as compared to 2011. |
Other income/expense, net. Other income/expense, net was not significant in 2012 or 2011.
Provision for income taxes. Income tax expense totaled $21.5 million in 2012 as compared to $10.4 million in the prior year, an increase of $11.2 million or 107.7%. The increase was attributable to the higher pre-tax income in 2012 as compared to 2011. In 2012 and 2011, our income tax expense was based on a tax-sharing agreement between us and MMC. As specified by the agreement, our effective tax rate was 43.5% in 2012 and 2011.
46
Table of Contents
Year Ended December 31, 2011 Compared to Year Ended December 31, 2010
| Year Ended December 31, 2010 |
Percentage of Revenue |
Year Ended December 31, 2011 |
Percentage of Revenue |
Total Dollar Change |
Total Percentage Change |
|||||||||||||||||||
| (Dollars in thousands) |
||||||||||||||||||||||||
| Revenues: |
||||||||||||||||||||||||
| Real estate brokerage commissions |
$ | 198,366 | 91.0 | % | $ | 245,333 | 89.3 | % | $ | 46,967 | 23.7 | % | ||||||||||||
| Financing fees |
10,917 | 5.0 | 16,522 | 6.0 | 5,605 | 51.3 | ||||||||||||||||||
| Other revenues |
8,652 | 4.0 | 12,850 | 4.7 | 4,198 | 48.5 | ||||||||||||||||||
|
|
|
|
|
|
|
|
|
|
|
|
|
|||||||||||||
| Total revenues |
217,935 | 100.0 | 274,705 | 100.0 | 56,770 | 26.0 | ||||||||||||||||||
| Operating expenses: |
||||||||||||||||||||||||
| Cost of services |
124,272 | 57.0 | 162,478 | 59.1 | 38,206 | 30.7 | ||||||||||||||||||
| Selling, general, and administrative expense |
76,438 | 35.1 | 85,801 | 31.2 | 9,363 | 12.2 | ||||||||||||||||||
| Depreciation and amortization expense |
3,333 | 1.5 | 2,971 | 1.1 | (362 | ) | -10.9 | |||||||||||||||||
|
|
|
|
|
|
|
|
|
|
|
|
|
|||||||||||||
| Total operating expenses |
204,043 | 93.6 | 251,250 | 91.5 | 47,207 | 23.1 | ||||||||||||||||||
|
|
|
|
|
|
|
|
|
|
|
|
|
|||||||||||||
| Operating income |
13,892 | 6.4 | 23,455 | 8.5 | 9,563 | 68.8 | ||||||||||||||||||
| Other income (expense), net |
959 | 0.4 | 350 | 0.1 | (609 | ) | -63.5 | |||||||||||||||||
|
|
|
|
|
|
|
|
|
|
|
|
|
|||||||||||||
| Income before provision for income taxes |
14,851 | 6.8 | 23,805 | 8.7 | 8,954 | 60.3 | ||||||||||||||||||
| Provision for income taxes |
6,460 | 3.0 | 10,355 | 3.8 | 3,895 | 60.3 | ||||||||||||||||||
|
|
|
|
|
|
|
|
|
|
|
|
|
|||||||||||||
| Net income |
$ | 8,391 | 3.9 | % | $ | 13,450 | 4.9 | % | $ | 5,059 | 60.3 | % | ||||||||||||
|
|
|
|
|
|
|
|
|
|
|
|
|
|||||||||||||
| Adjusted EBITDA (1) |
$ | 18,743 | 8.6 | % | $ | 29,486 | 10.7 | % | $ | 10,743 | 57.3 | % | ||||||||||||
| (1) | Adjusted EBITDA is not a measurement of our financial performance under U.S. GAAP and should not be considered as an alternative to net income, operating income or any other measures derived in accordance with U.S. GAAP. For a definition of Adjusted EBITDA and a reconciliation of Adjusted EBITDA to net income, see “—Non-GAAP Financial Measure.” |
Revenues. Our total revenues were $274.7 million in 2011 compared to $217.9 million in 2010, an increase of $56.8 million, or 26.0%. Total revenues increased primarily as a result of increases in real estate brokerage commissions, which contributed 82.7% of the total increase, as well as increases in financing fees and other revenues.
| • | Real estate brokerage commissions. Revenues from real estate brokerage commissions increased from $198.4 million in 2010 to $245.3 million in 2011, an increase of $47.0 million or 23.7%. The increase was driven by a combination of a 13.7% increase in the average commission size and an 8.8% increase in the number of investment sales transactions in 2011 as compared to 2010. |
| • | Financing fees. Revenues from financing fees increased from $10.9 million in 2010 to $16.5 million in 2011, an increase of $5.6 million or 51.3%. The increase was driven by a 64.5% increase in the number of loan transactions, partially offset by a decrease of 8.0% in the average loan commission size in 2011 as compared to 2010. |
| • | Other revenues. Other revenues increased from $8.7 million in 2010 to $12.9 million in 2011, an increase of $4.2 million or 48.5%. The increase was due to a combination of a 24.9% increase in the number of other service transactions and an 18.9% increase in the average fee size in 2011 as compared to 2010. |
Total operating expenses. Our total operating expenses were $251.3 million in 2011 compared to $204.0 million in 2010, an increase of $47.2 million, or 23.1%. Expenses increased primarily due to an increase in cost
47
Table of Contents
of services which is primarily commissions paid to our investment sales professionals and compensation-related costs related to our mortgage brokerage activities. Selling, general and administrative costs increased as well, as described below.
| • | Cost of services. The cost of services in 2011 increased approximately $38.2 million, or 30.7%, to $162.5 million from $124.3 million in 2010. The increase was primarily due to increased commission expenses structure and an increase in the proportion of transactions closed by our senior sales agents that are paid higher commission rates. |
| • | Selling, general and administrative expense. Selling, general and administrative expense in 2011 increased $9.4 million, or 12.2%, to $85.8 million from $76.4 million in 2010. The increase was primarily due to a $10.4 million increase in management performance compensation driven by our strong 2011 operating results, a $1.6 million increase in stock based compensation expenses due to an increase in the value of the SARs and other equity awards as well as an increase in sales promotional expenses. These increases were partially offset by a $1.3 million decrease in facilities expenses driven by the right-sizing of our office space as well as decreases in legal and other administrative costs in 2011 as compared to 2010 due to an increase in the number of legal matters managed by our in-house legal department. |
| • | Depreciation and amortization expense. There were no significant changes in depreciation and amortization expense in 2011 as compared to 2010. |
Other income/expense, net. Other income/expense, net was not significant in 2011 or 2010.
Provision for income taxes. Income tax expense totaled $10.4 million in 2011 as compared to $6.5 million in 2010, an increase of $3.9 million or 60.3%. The increase was attributable to the higher pre-tax income in 2011 as compared to 2010. In 2011 and 2010, our income tax expense was based on a tax-sharing agreement between us and MMC. As specified by the agreement, our effective tax rate was 43.5% in 2011 and 2010.
Seasonality
Our real estate brokerage commissions and financing fees are seasonal, which can affect an investor’s ability to compare our financial condition and results of operation on a quarter-by-quarter basis. Historically, this seasonality has caused our revenue, operating income, net income and cash flows from operating activities to be lower in the first six months of the year and higher in the second half of the year, particularly in the fourth quarter. The concentration of earnings and cash flows in the last six months of the year, particularly in the fourth quarter, is due to an industry-wide focus of clients to complete transactions towards the end of the calendar year. In addition, our operating margins are typically lower during the second half of each year due to our commission structure for some of our senior sales agents. These senior sales agents are on a graduated commission schedule that resets annually in which higher commissions are paid for higher sales volumes.
The following unaudited quarterly consolidated statements of operations for each of the quarters in 2011 and 2012 and the first and second quarters of 2013 have been prepared on a basis consistent with our audited annual financial statements and include, in the opinion of management, all normal recurring adjustments necessary for the fair statement of the financial information contained in these statements. The period-to-period comparison of financial results is not necessarily indicative of future results and should be read together with our annual financial statements and the related notes included elsewhere in this prospectus.
48
Table of Contents
| Three Months Ended | ||||||||||||||||||||||||||||||||||||||||
| March 31, 2011 |
June 30, 2011 |
September 30, 2011 |
December 31, 2011 |
March 31, 2012 |
June 30, 2012 |
September 30, 2012 |
December 31, 2012 |
March 31, 2013 |
June 30, 2013 |
|||||||||||||||||||||||||||||||
| (Dollars in thousands) | ||||||||||||||||||||||||||||||||||||||||
| Revenues: |
||||||||||||||||||||||||||||||||||||||||
| Real estate brokerage commissions |
$ | 46,181 | $ | 58,499 | $ | 65,889 | $ | 74,764 | $ | 56,927 | $ | 76,482 | $ | 82,620 | $ | 135,378 | $ | 61,198 | $ | 95,765 | ||||||||||||||||||||
| Financing fees |
2,966 | 4,015 | 4,461 | 5,080 | 3,456 | 4,762 | 5,195 | 7,719 | 5,014 | 6,874 | ||||||||||||||||||||||||||||||
| Other revenues |
2,281 | 2,064 | 2,396 | 6,109 | 2,286 | 2,937 | 3,413 | 4,541 | 3,158 | 2,832 | ||||||||||||||||||||||||||||||
|
|
|
|
|
|
|
|
|
|
|
|
|
|
|
|
|
|
|
|
|
|||||||||||||||||||||
| Total revenues |
51,428 | 64,578 | 72,746 | 85,953 | 62,669 | 84,181 | 91,228 | 147,638 | 69,370 | 105,471 | ||||||||||||||||||||||||||||||
| Operating expenses: |
||||||||||||||||||||||||||||||||||||||||
| Cost of services |
28,639 | 37,827 | 43,376 | 52,636 | 35,945 | 48,764 | 54,194 | 91,345 | 41,221 | 61,456 | ||||||||||||||||||||||||||||||
| Selling, general, and administrative expense |
21,523 | 19,079 | 21,359 | 23,840 | 22,309 | 23,591 | 25,007 | 32,572 | 24,732 | 29,092 | ||||||||||||||||||||||||||||||
| Depreciation and amortization expense |
784 | 768 | 740 | 679 | 731 | 764 | 732 | 754 | 760 | 754 | ||||||||||||||||||||||||||||||
|
|
|
|
|
|
|
|
|
|
|
|
|
|
|
|
|
|
|
|
|
|||||||||||||||||||||
| Total operating expenses |
50,946 | 57,674 | 65,475 | 77,155 | 58,985 | 73,119 | 79,933 | 124,671 | 66,713 | 91,302 | ||||||||||||||||||||||||||||||
|
|
|
|
|
|
|
|
|
|
|
|
|
|
|
|
|
|
|
|
|
|||||||||||||||||||||
| Operating income |
482 | 6,904 | 7,271 | 8,798 | 3,684 | 11,062 | 11,295 | 22,967 | 2,657 | 14,169 | ||||||||||||||||||||||||||||||
| Other income (expense), net |
145 | 200 | (217 | ) | 222 | 283 | — | 41 | 109 | 242 | 7 | |||||||||||||||||||||||||||||
|
|
|
|
|
|
|
|
|
|
|
|
|
|
|
|
|
|
|
|
|
|||||||||||||||||||||
| Income before provision for income taxes |
627 | 7,104 | 7,054 | 9,020 | 3,967 | 11,062 | 11,336 | 23,076 | 2,899 | 14,176 | ||||||||||||||||||||||||||||||
| Provision for income taxes |
273 | 3,090 | 3,068 | 3,924 | 1,726 | 4,812 | 4,931 | 10,038 | 1,261 | 6,167 | ||||||||||||||||||||||||||||||
|
|
|
|
|
|
|
|
|
|
|
|
|
|
|
|
|
|
|
|
|
|||||||||||||||||||||
| Net income |
$ | 354 | $ | 4,014 | $ | 3,986 | $ | 5,096 | $ | 2,241 | $ | 6,250 | $ | 6,405 | $ | 13,038 | $ | 1,638 | $ | 8,009 | ||||||||||||||||||||
|
|
|
|
|
|
|
|
|
|
|
|
|
|
|
|
|
|
|
|
|
|||||||||||||||||||||
The increase in real estate brokerage commissions and related cost of services for the quarter ended December 31, 2012 reflects the impact of what was anticipated to be a fiscal cliff, and the associated uncertainty surrounding the potential impacts to the U.S. tax code. As a result, a significant number of anticipated 2013 transactions were accelerated and closed in the fourth quarter of 2012. We do not expect a similar acceleration of transactions in the fourth quarter of 2013.
Non-GAAP Financial Measure
In this prospectus, we include a non-GAAP financial measure, adjusted earnings before interest income/expense, taxes, depreciation and amortization and stock-based compensation, or Adjusted EBITDA. We define Adjusted EBITDA as net income before (i) interest income/expense, (ii) income tax expense, (iii) depreciation and amortization and (iv) stock-based compensation expense. We use Adjusted EBITDA in our business operations to, among other things, evaluate the performance of its business, develop budgets and measure our performance against those budgets. We also believe that analysts and investors use Adjusted EBITDA as supplemental measures to evaluate our overall operating performance. However, Adjusted EBITDA has material limitations as an analytical tool and should not be considered in isolation, or as a substitute for analysis of our results as reported under U.S. GAAP. We find Adjusted EBITDA as a useful tool to assist in evaluating performance because it eliminates items related to capital structure and taxes and non-cash stock-based compensation charges. In light of the foregoing limitations, we do not rely solely on Adjusted EBITDA as a performance measure and also consider our U.S. GAAP results. Adjusted EBITDA is not a measurement of our financial performance under U.S. GAAP and should not be considered as an alternative to net income, operating income or any other measures derived in accordance with U.S. GAAP. Because Adjusted EBITDA is not calculated in the same manner by all companies, it may not be comparable to other similarly titled measures used by other companies.
49
Table of Contents
A reconciliation of Adjusted EBITDA to the most directly comparable GAAP financial measure, net income, is as follows:
| Year
Ended December 31, |
Six
Months Ended June 30, |
|||||||||||||||||||
| (Dollars in thousands) | 2010 | 2011 | 2012 | 2012 | 2013 | |||||||||||||||
| Net income |
$ | 8,391 | $ | 13,450 | $ | 27,934 | $ | 8,491 | $ | 9,647 | ||||||||||
| Add: |
||||||||||||||||||||
| Interest income (expense) |
(687 | ) | (141 | ) | (162 | ) | (73 | ) | (84 | ) | ||||||||||
| Provision for income taxes |
6,460 | 10,355 | 21,507 | 6,538 | 7,428 | |||||||||||||||
| Depreciation and amortization |
3,333 | 2,971 | 2,981 | 1,495 | 1,514 | |||||||||||||||
| Stock-based compensation |
1,246 | 2,851 | 7,448 | 2,183 | 2,626 | |||||||||||||||
|
|
|
|
|
|
|
|
|
|
|
|||||||||||
| Adjusted EBITDA |
$ | 18,743 | $ | 29,486 | $ | 59,708 | $ | 18,634 | $ | 21,131 | ||||||||||
|
|
|
|
|
|
|
|
|
|
|
|||||||||||
Liquidity and Capital Resources
Our primary sources of liquidity are cash on hand and cash flows from operations. In the future, we intend to fund our operating cash requirements entirely through cash flows from our operating activities. Although we have historically funded our operations through our operating cash flows, there can be no assurance that we can continue to meet our cash requirements entirely through our operations. In addition, we may determine that obtaining debt financing to be advantageous to our business in the future.
Cash Flows
| Year
Ended December 31, |
Six
Months Ended June 30, |
|||||||||||||||||||
| (Dollars in thousands) | 2010 | 2011 | 2012 | 2012 | 2013 | |||||||||||||||
| Net cash provided by operating activities |
$ | 4,112 | $ | 17,816 | $ | 35,354 | $ | 10,885 | $ | 44,302 | ||||||||||
| Net cash used in investing activities |
(1,076 | ) | (2,671 | ) | (4,637 | ) | (2,128 | ) | (1,598 | ) | ||||||||||
| Net cash used in financing activities |
(2,570 | ) | (16,919 | ) | (30,768 | ) | (8,088 | ) | (26,449 | ) | ||||||||||
|
|
|
|
|
|
|
|
|
|
|
|||||||||||
| Net increase (decrease) in cash and cash equivalents |
466 | (1,774 | ) | (51 | ) | 669 | 16,255 | |||||||||||||
| Cash and cash equivalents at beginning of period |
4,466 | 4,932 | 3,158 | 3,158 | 3,107 | |||||||||||||||
|
|
|
|
|
|
|
|
|
|
|
|||||||||||
| Cash and cash equivalents at end of period |
$ | 4,932 | $ | 3,158 | $ | 3,107 | $ | 3,827 | $ | 19,362 | ||||||||||
|
|
|
|
|
|
|
|
|
|
|
|||||||||||
Prior to June 30, 2013, the majority of the cash generated and used in our operations was held in bank accounts with one financial institution that were included in a sweep arrangement with MMC. Pursuant to a treasury management service agreement with that financial institution, the cash was swept daily into MMC’s money market account. We collected interest income from MMC at the same interest rate MMC earned on the money market account. Historically, other than for a two-week period around MMC’s March 31 fiscal year end, we had a receivable from MMC for the cash that was swept. When the sweep arrangement was not in effect, during the week before and the week after March 31, our cash balances remained in our bank account. As of June 30, 2013, the sweep arrangement with MMC was permanently terminated.
Operating Activities
Cash flows from operating activities were $44.3 million for the six months ended June 30, 2013, compared to $10.9 million for the six months ended June 30, 2012. The increase in cash flows from operating activities was primarily due to a $32.3 million increase in net working capital and a higher net income of $1.2 million during the six months ended June 30, 2013 compared to the six months ended June 30, 2012. The net working capital changes were principally due to a $49.2 million increase due to affiliates primarily driven by the termination of the cash sweep arrangement discussed above, partially offset by a decrease in accounts payable and accrued expenses and accrued employee expenses primarily due to timing of payments, including an increase in bonus payments during the six months ended June 30, 2013 compared to the same period in 2012.
Cash flows from operating activities were $35.4 million in 2012, as compared to $17.8 million in 2011 and $4.1 million in 2010. The increase in cash flows from operating activities in 2012 as compared to 2011 was
50
Table of Contents
primarily due to the higher net income in 2012 and higher noncash charges, primarily stock based compensation. The increase in cash flows from operating activities in 2011 as compared to 2010 was primarily due to reductions in working capital and the higher net income in 2011 as compared to 2010.
Investing Activities
Cash flows used for investing activities were $1.6 million for the six months ended June 30, 2013, as compared to $2.1 million for the six months ended June 30, 2012. The decrease in cash flows used in investing activities for the six months ended June 30, 2013, as compared to the six months ended June 30, 2012 was primarily due to a $0.9 million increase in employee notes receivable collections, net of issuances, partially offset by a $0.4 million increase in investment in information technology, computer equipment and furniture.
Cash flows used for investing activities were $4.6 million in 2012, as compared to $2.7 million in 2011 and $1.1 million in 2010. The increase in cash flows used for investing activities in 2012 as compared to 2011 was primarily due to increased investment in information technology, computer equipment, leasehold improvements and furniture. The increase in cash flows used for investing activities in 2011 as compared to 2010 was primarily due to increased investment in information technology, leasehold improvements and furniture. In 2013, we anticipate total capital expenditures of approximately $5.0 million. 2013 capital expenditures are primarily expected to be for leasehold improvements, furniture and equipment.
Financing Activities
Cash flows used for financing activities were $26.4 million for the six months ended June 30, 2013, as compared to $8.0 million for the six months ended June 30, 2012. The increase in cash flows used for financing activities was primarily due to higher dividend payments to MMC during the six months ended June 30, 2013 as compared to the six months ended June 30, 2012 and payments of initial public offering costs during the six months ended June 30, 2013 with no such comparable costs during the six months ended June 30, 2012.
Cash flows used for financing activities were $30.8 million in 2012, as compared to $16.9 million in 2011 and $2.6 million in 2010. The increase in cash flows used for financing activities in 2012 as compared to 2011 was primarily due to higher dividend payments to MMC in 2012. The increase in cash flows used for financing activities in 2011 as compared to 2010 was primarily due to higher dividend payments to MMC in 2011.
During 2012, 2011, and 2010, we paid dividends totaling $30.8 million, $16.5 million, and $2.0 million, respectively, to MMC pursuant to our agreement with our Series A Preferred stockholders. MMC holds 100% of our Series A Preferred shares. These shares will be converted into common shares of stock upon completion of our initial public offering.
Prior to our initial public offering, we distributed substantially all of our net income to our parent in the form of cash dividends. Following this offering, we will not pay a regular dividend. We intend to evaluate our dividend policy in the future. Any declaration and payment of future dividends to holders of our common stock will be at the discretion of our board of directors and will depend on many factors, including our financial condition, earnings, cash flows, capital requirements, level of indebtedness, statutory and contractual restrictions applicable to the payment of dividends and other considerations that our board of directors deems relevant.
Commitments
The following table summarizes our contractual and other cash commitments and obligations at December 31, 2012 (dollars in thousands):
| 2013 | 2014 | 2015 | 2016 | 2017 | Thereafter | |||||||||||||||||||
| Future minimum lease payments under non-cancelable operating leases |
$ | 10,770 | $ | 9,581 | $ | 8,021 | $ | 5,088 | $ | 1,665 | $ | 1,629 | ||||||||||||
| Future minimum lease payments under capital leases |
305 | 186 | 86 | 9 | — | — | ||||||||||||||||||
|
|
|
|
|
|
|
|
|
|
|
|
|
|||||||||||||
| Total contractual obligations |
$ | 11,075 | $ | 9,767 | $ | 8,107 | $ | 5,097 | $ | 1,665 | $ | 1,629 | ||||||||||||
|
|
|
|
|
|
|
|
|
|
|
|
|
|||||||||||||
51
Table of Contents
MMC has a line of credit agreement under which we, along with many other entities controlled by MMC are a guarantor. At December 31, 2012 and June 30, 2013, MMC was in compliance with all debt covenants under the terms of the line of credit agreement. We will be released from any guarantee and other obligations under the agreement when the Spin-Off is completed.
Off Balance Sheet Arrangements
We do not have any off balance sheet arrangements at this time.
Critical Accounting Policies; Use of Estimates
We prepare our financial statements in accordance with U.S. generally accepted accounting principles. In applying many of these accounting principles, we make assumptions, estimates and/or judgments that affect the reported amounts of assets, liabilities, revenues and expenses in our consolidated financial statements. We base our estimates and judgments on historical experience and other assumptions that we believe are reasonable under the circumstances. These assumptions, estimates and/or judgments, however, are often subjective and our actual results may change negatively based on changing circumstances or changes in our analyses. If actual amounts are ultimately different from our estimates, the revisions are included in our results of operations for the period in which the actual amounts become known. We believe the following critical accounting policies could potentially produce materially different results if we were to change underlying assumptions, estimates and/or judgments. See the “Notes to Consolidated Financial Statements” for a summary of our significant accounting policies.
Revenue Recognition
We generate real estate brokerage commissions by acting as a broker for real estate owners or investors seeking to buy or sell commercial properties. Revenues from real estate brokerage commissions are recognized when there is persuasive evidence of an arrangement, all services have been provided, the price is fixed and determinable and collectability is reasonably assured, which typically happens upon close of escrow.
Financing fees are generated from securing financing on purchase transactions as well as fees earned from refinancing our clients’ existing mortgage debt. Financing fee revenues are recognized at the time the loan closes and there are no remaining significant obligations for performance in connection with the transaction.
Other revenues include fees generated from consulting and advisory services, as well as referral fees from other real estate brokers. Revenues from these services are recognized as they are performed and completed.
Stock-Based Compensation
MMREIS has historically issued stock options and stock appreciation rights, or SARs, to key employees through a book value, stock-based compensation award program. The program allows for employees to exercise stock options in exchange for shares of unvested restricted common stock. The program also allows employees to exercise options through the issuance of notes receivable, which are recourse to the employee.
The grant price and repurchase price of stock-based awards at the grant date and repurchase date are fixed as determined by a valuation formula using book value, as defined by the agreements between MMREIS and the employees. The stock awards generally vest over a three to five-year period. Under these plans, MMREIS retains the right to repurchase shares if certain events occur, which includes termination of employment. In these circumstances, the plan document provides for repurchase proceeds to be settled in the form of a note payable to (former) shareholders or cash, which is settled over a fixed period.
While MMREIS has entered into the agreements to repurchase the stock and settle the SARs held by employees upon termination of their employment (subject to certain conditions as specified in the agreements), MMC has historically assumed the obligation to make payments to the former shareholders. While MMREIS recognizes the compensation expense associated with these share-based payment arrangements, the liability has historically been assumed by MMC through a deemed contribution, which then has paid the former shareholders over time. The accounting for the stock options and SARs awards, including MMC’s assumption of MMREIS repurchase obligations, is discussed below.
52
Table of Contents
Restricted Common Stock
Since stock options only allow the grantee the right to acquire shares of unvested restricted common stock at book value, which is determined on an annual basis, MMREIS accounts for the stock options and the related unvested restricted stock, as a single instrument, with a single service period. The service period begins on the option grant date, and extends through the exercise and subsequent vesting period of the restricted stock. The unvested restricted common stock is accounted for in accordance with ASC 718, Share-Based Payments. Increases or decreases in the formula settlement value of unvested restricted stock subsequent to the grant date, are recorded as increases or decreases, respectively, to compensation expense, with decreases limited to the book value of the stock on the date of grant.
As MMC has assumed our obligation with respect to any appreciation in the value of the underlying vested awards in excess of the employees’ exercise price, MMC is deemed to make a capital contribution to our additional paid-in capital equal to the amount of compensation expense recorded, net of the applicable taxes. Based on the tax-sharing agreement between us and MMC, the tax deduction on the compensation expense recorded by us is allocated to MMC. MMC records the liability related to the appreciation in the value of the underlying stock in its consolidated financial statements. To the extent of any depreciation in the value of the underlying vested awards (limited to the amount of any appreciation previously recorded from the employees’ original exercise price), compensation expense is reduced and MMC is deemed to receive a capital distribution.
Stock Appreciation Rights
SARs to employees are accounted for in accordance with ASC 718. Similar to the vested stock, compensation expense related to the SARs is to be recorded in each period and is equal to the appreciation in the formula-settlement value of vested SARs at the end of each reporting period-end from the prior reporting period-end.
As MMC has assumed our obligation with respect to any appreciation in the value of the vested SARs, MMC is deemed to make a capital contribution to our additional paid-in capital equal to the amount of compensation expense recorded, net of the applicable taxes. Based on the tax-sharing agreement entered between us and MMC, the tax deduction on the compensation expense recorded by us is allocated to MMC. MMC records the liability related to the appreciation in the value of the underlying stock in its consolidated financial statements. To the extent of any depreciation in the value of the vested SARs (limited to the amount of any appreciation previously recorded), compensation expense is reduced and MMC is deemed to receive a capital distribution.
Amendments to Restricted Stock and SARs
In conjunction with this offering, the vesting of all unvested restricted stock and all unvested SARs will be accelerated. The SARs will be frozen at the liability amount, calculated as of March 31, 2013, which will be paid out to each participant in installments upon retirement or departure under the terms of the existing program. The frozen SAR account balances will be credited with interest on an annual basis. To replace beneficial ownership in the SARs, the difference between the book value liability and the fair value of the awards will be granted to plan participants in the form of deferred stock units, or DSUs, which would be fully vested upon receipt but will be settled in actual stock at a rate of 20% per year if the participant remains employed by the company during that period (or otherwise all unsettled shares of stock upon termination of employment will be settled five years from the termination date). In addition, the formula settlement value of all outstanding shares of stock held by the plan participants will be removed, but all such shares of stock will be subject to sales restrictions that lapse at a rate of 20% per year for five years if the participant remains employed by the company. Additionally, in the event of death or termination of employment after reaching the age of 67, 100% of the DSUs will be settled and 100% of the shares of stock will be released from the resale restriction. Further, 100% of the shares of stock will be released from the resale restriction upon the consummation of a change of control of the company.
The modification will be accounted for as a probable-to-probable modification in accordance with ASC 718. Total compensation cost to be recognized at the time of the modification will be equal to (i) the unrecognized portion of compensation cost associated with the original awards, and (ii) the incremental cost resulting from the
53
Table of Contents
modification. The incremental compensation cost from the modification will be the excess of (a) the fair value of the modified awards based upon the initial public offering price of the stock, and (b) the calculated value of the awards prior to the modification based upon the formula settlement value. The fair value of the deferred stock units will be determined based upon an independent third-party appraisal and will consider the sales restrictions in accordance with ASC 718. In addition, as a result of the removal of the formula settlement value, the modification of the unvested restricted stock will result in the awards being classified as equity awards.
The modification and grant of replacement awards will result in an immediate one-time compensation charge of approximately $ million, net of future income tax benefits of $ million, assuming an offering price at the midpoint of the initial public offering price range set forth on the cover page of this prospectus. No compensation cost related to the awards will be recognized in subsequent periods as the unvested restricted stock and deferred stock units meet the criteria to be accounted for as equity awards and will be fully vested at the modification and grant date.
2013 Omnibus Equity Incentive Plan
In conjunction with this offering, and subsequent to the completion of this offering, we may issue additional equity awards to our employees, directors or others pursuant to our 2013 Omnibus Equity Incentive Plan, or the 2013 Plan. The company will recognize the cost of future equity-based awards based upon their fair values on a straight-line basis over the requisite service period, which is generally the vesting period of the awards. For awards to the company’s employees, including its independent directors, the fair value is determined as the grant date stock price. For awards with periodic vesting, we recognize the related expense on a straight-line basis over the requisite service period for the entire award, subject to periodic adjustments to ensure that the cumulative amount of expense recognized through the end of any reporting period is at least equal to the portion of the grant date value of the award that has vested through that date. Share-based payments are included in general and administrative expense in the accompanying consolidated statements of operations.
Income Taxes
For the years ended December 31, 2012, 2011 and 2010 our income tax expense was based on a tax-sharing agreement between us and MMC which stipulates an effective annual tax rate of 43.5%. In addition, all deferred tax assets and liabilities are recorded by MMC. We anticipate filing as a stand-alone tax entity in the future. When we file as a stand-alone tax entity we will account for income taxes under the asset and liability method. Deferred tax assets and liabilities will be recognized for future tax consequences attributable to differences between the financial statement carrying amounts of existing assets and liabilities and their respective tax bases, and for tax losses and tax credit carryforwards, if any. Deferred tax assets and liabilities will be measured using tax rates expected to apply to taxable income in the years in which those temporary differences are expected to be recovered or settled. The effect on deferred tax assets and liabilities of a change in tax rates will be recognized as income in the period of the tax rate change. In assessing the realizability of deferred tax assets, we will consider whether it is more likely than not that some portion or all of the deferred tax assets will not be realized.
In addition, once we file as a stand-alone tax entity our effective tax rate will be sensitive to several factors including changes in the mix of our geographic profitability. We will evaluate our estimated tax rate on a quarterly basis to reflect changes in: (i) our geographic mix of income, (ii) legislative actions on statutory tax rates and (iii) tax planning for jurisdictions affected by double taxation. We will continually seek to develop and implement potential strategies and/or actions that would reduce our overall effective tax rate.
Recent Accounting Pronouncements
Fair Value Measurement
In May 2011, the FASB issued ASU 2011-04, “Fair Value Measurement (Topic 820).” The amendments in this ASU change the wording used to describe the requirements for measuring fair value and for disclosing information about fair value measurements. For public companies, the ASU should be applied prospectively for interim and annual periods beginning after December 15, 2011. The requirements of this ASU were adopted during fiscal 2012, and they did not have a material impact on our financial statements.
54
Table of Contents
Quantitative and Qualitative Disclosures about Market Risk
Our financial instruments, which are exposed to concentrations of credit risk, consist primarily of short-term cash investments. Due to the nature of our business and the manner in which we conduct our operations, we believe we do not face any material interest rate risk, foreign currency exchange rate risk, equity price risk or other market risk.
55
Table of Contents
Overview of the Commercial Real Estate Investment Industry
The total value of U.S. commercial real estate assets was estimated to be $12 trillion at the end of 2012 based on data provided by CoStar and Real Capital Analytics. Property sales in the commercial real estate sector for the four major categories of multifamily, retail, office and industrial properties priced at $1 million and above reached over $340 billion, or approximately 37,000 transactions, in 2012. This was a 41% increase in dollar volume and 32% increase in the number of transactions over 2011, following a 32% increase in dollar volume and an 18% increase in the number of transactions over 2010. However, property sales in 2012 were still 16% below the 2007 peak in the number of transactions and 32% below the peak in dollar volume. The following graphs show the total number of transactions and dollar volume of transactions in the commercial real estate industry from 2003 to 2012:
U.S. Commercial Real Estate Transactions, 2003-2012*
Total Transactions
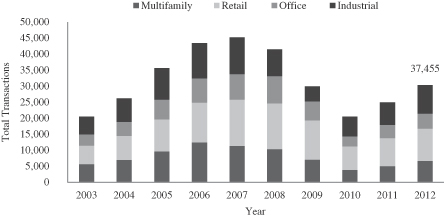
Total Dollar Volume
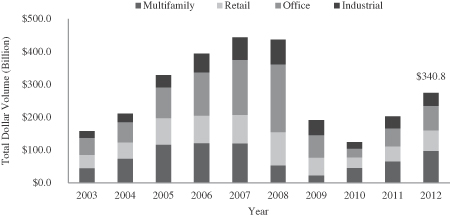
| * | Includes sales $1 million and greater. Sources: CoStar Group, Inc. and Real Capital Analytics. |
We divide the commercial real estate market into three major segments by investment size:
| • | Private client segment: properties with prices under $10 million; |
56
Table of Contents
| • | Hybrid segment: properties with prices equal to or greater than $10 million and less than $20 million; and |
| • | Institutional segment: properties with prices of $20 million and above. |
Private client segment transactions generally involve high net worth individuals, partnerships and private funds. Hybrid segment transactions primarily involve larger private investors. Institutional segment transactions tend to be dominated by pension funds, insurance companies, private equity firms, endowments and real estate investment trusts, or REITs. As illustrated in the chart below, the private client segment represents the vast majority of property transactions.
U.S. Commercial Real Estate Transactions by Segment, 2003-2012*
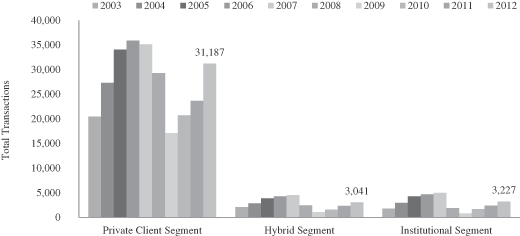
| * | Includes multifamily, retail, office and industrial sales $1 million and greater. Sources: CoStar Group, Inc. and Real Capital Analytics. |
The table below shows the number and volume of transactions by property price segment as well as the estimated commission pool for each segment.
Commercial Real Estate Transaction Breakdown, 2012*
| Segment |
Transactions | Percentage of Transactions |
Volume (Billions) |
Percentage of Volume |
Estimated Commission Pool (Billions) |
Estimated Percentage of Commission Pool |
||||||||||||||||||
| Private client |
31,187 | 83 | % | $ | 91 | 27 | % | $ | 3.5 | 60 | % | |||||||||||||
| Hybrid |
3,041 | 8 | 42 | 12 | 0.8 | 14 | ||||||||||||||||||
| Institutional |
3,227 | 9 | 207 | 61 | 1.5 | 26 | ||||||||||||||||||
|
|
|
|
|
|
|
|
|
|
|
|
|
|||||||||||||
| Total |
37,455 | 100 | % | $ | 340 | 100 | % | $ | 5.8 | 100 | % | |||||||||||||
|
|
|
|
|
|
|
|
|
|
|
|
|
|||||||||||||
| * | Sources (other than commissions): CoStar Group, Inc. and Real Capital Analytics. Commission data is based on our estimate of average industry commission rates as follows: Private Client Segment—3.8%; Hybrid Segment—1.9%; Institutional Segment—0.7%. Commission rates are typically inversely correlated with property value and subject to individual negotiation with clients. |
The commercial real estate market experienced a significant downturn from the 2007 peak to a trough in 2009, representing the most severe downturn in property sales since at least 1990, the earliest period for which data is available. Since 2009, commercial property sales have increased by 97% and dollar volume has increased by 235%, returning to transaction and volume levels in 2012 close to those achieved in 2004. This cyclical upturn has been,
57
Table of Contents
and we believe will continue to be, primarily driven by attractive yields, improving property fundamentals and the availability and cost of financing, based on data from CoStar, Real Capital Analytics and Rosen Consulting Group.
Growth in the Commercial Real Estate Industry
Historically, the U.S. commercial real estate industry has tended to be cyclical and closely correlated with the flow of capital into the sector, the condition of the economy as a whole, the perceptions and confidence of market participants as to the economic outlook, supply/demand balance, changes to tax laws and regulatory factors. Employment growth or contraction in particular exhibits a strong correlation with demand for various types of commercial space, and vacancy rates tend to move up and down with a natural lag behind employment and construction cycles. Changes in interest rates, credit and liquidity issues and disruptions in capital markets are all factors that may also affect the industry.
Attractive Yields. According to Real Capital Analytics, average commercial real estate yields (capitalization rates) by the four major property types currently range from 6.1% to 7.8%, which compare favorably to alternative investments such as stock and bonds, as shown below. We believe these attractive yields are a key driver of improving capital inflows for commercial real estate investments.
Average Yields as of June 28, 2013*
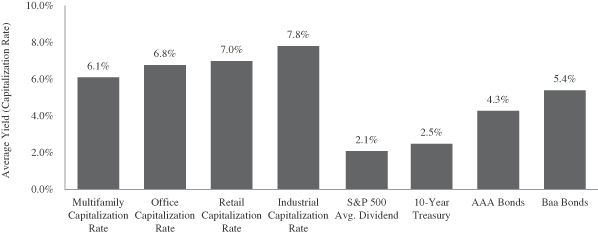
| * | Average real estate yields are for transactions of $2.5 million and above. Sources: Real Capital Analytics and Bloomberg. |
Improving Property Fundamentals. Property fundamentals have improved since 2009, with multifamily properties in particular experiencing a strong recovery, according to Rosen Consulting Group. We believe the recovery in the multifamily sector has been driven by a falling home ownership rate, strong renter demographics and shifting consumer preferences toward renting. Recovery in other major sectors, particularly in retail and office properties, has been more gradual, mirroring the slow pace of the economic recovery, which we believe is largely due to corporate cost reduction and lingering economic and political uncertainties. We expect further increases in occupancy and rental rates despite expectations of continued moderate job growth.
| Growth in Rental Rate | ||||||||||||||||||||||||||||
| Property Type |
2009 (actual) |
2010 (actual) |
2011 (actual) |
2012 (actual) |
2013 (projected) |
2014 (projected) |
2015 (projected) |
|||||||||||||||||||||
| Multifamily |
-4.1 | % | 2.3 | % | 4.8 | % | 3.0 | % | 2.8 | % | 2.6 | % | 2.8 | % | ||||||||||||||
| Retail |
0.2 | % | 0.4 | % | 1.4 | % | 1.8 | % | 2.2 | % | 2.6 | % | 2.9 | % | ||||||||||||||
| Office |
-8.1 | % | -1.0 | % | 0.9 | % | 2.1 | % | 2.9 | % | 3.3 | % | 3.8 | % | ||||||||||||||
| Industrial |
-21.9 | % | -5.5 | % | 0.1 | % | 3.5 | % | 4.1 | % | 4.2 | % | 4.3 | % | ||||||||||||||
58
Table of Contents
| Occupancy Rate | ||||||||||||||||||||||||||||
| Property Type |
2009 (actual) |
2010 (actual) |
2011 (actual) |
2012 (actual) |
2013 (projected) |
2014 (projected) |
2015 (projected) |
|||||||||||||||||||||
| Multifamily |
91.9 | % | 93.4 | % | 94.5 | % | 95.1 | % | 95.1 | % | 95.2 | % | 95.0 | % | ||||||||||||||
| Retail |
91.3 | % | 91.2 | % | 91.5 | % | 91.9 | % | 92.2 | % | 92.4 | % | 92.7 | % | ||||||||||||||
| Office |
82.3 | % | 82.4 | % | 83.3 | % | 84.0 | % | 84.7 | % | 85.2 | % | 85.8 | % | ||||||||||||||
| Industrial |
89.6 | % | 89.7 | % | 90.8 | % | 91.7 | % | 92.5 | % | 93.0 | % | 93.2 | % | ||||||||||||||
Source: Rosen Consulting Group.
Availability and Cost of Financing. The availability and low cost of debt financing has been a significant contributor to the recent improvement in the U.S. capital markets and the U.S. commercial real estate market. Low interest rates and improved access to capital are key factors fueling investment sales activity. Since the 2009 credit freeze, commercial banks, life insurance companies and commercial mortgage backed securities, or CMBS, lenders have returned to the commercial real estate finance market in varying degrees. The graph below shows long-term decrease in government, corporate and commercial mortgage yields:
Historical Cost of Financing
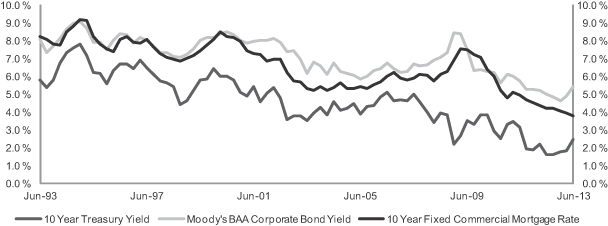
Source: Economy.com
59
Table of Contents
The mortgage financing volume for new sales of $1 million or more in the four major commercial property types (multifamily, retail, office and industrial) is estimated to have reached approximately $191 billion in 2012, based on data from CoStar and Real Capital Analytics. This compares to $36 billion in 2009 and a cyclical peak of $341 billion in 2007. This growth is driven by the degree to which transactions are facilitated with new financing as opposed to assumed debt and/or seller financing, average loan-to-value ratios accepted by lenders, and increased property values. The mortgage refinancing market is expected to remain active over the next several years, with approximately $1.84 trillion of commercial real estate debt maturing from 2013 through 2018, as shown below.
Commercial Real Estate Debt Maturities by Lender Type*
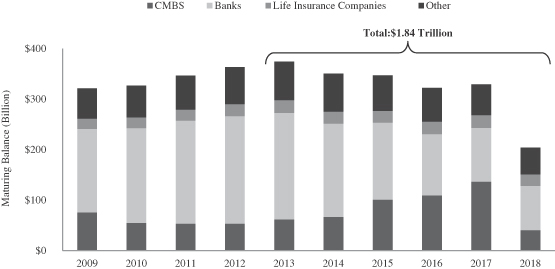
| * | Estimated for 2013 through 2018. Source: Foresight Analytics |
Private Client Segment
The private client segment consistently accounts for over 80% of commercial property sales by number of transactions. Private clients, many of whom are high net worth individuals, partnerships and private funds, are impacted by life changes, partnership break ups, retirement planning, inheritance and other factors that result in buying and selling commercial real estate. In many cases, these factors override market and macroeconomic conditions. These entrepreneurial investors are also nimble and often take advantage of rising prices to dispose of assets, refinance, acquire and/or exchange assets into new opportunities. We have focused our business on this segment as we believe it represents the largest and most active market segment in the commercial real estate investment brokerage industry for the following reasons:
| • | In addition to being the largest market segment, the properties in this segment exhibit a high turnover rate due to personal and partnership drivers. We expect these drivers to continue in the coming years in connection with the transfer of wealth from one generation to the next. |
| • | The segment features the highest commission rates and lowest property marketing expenses. |
| • | It is the most underserved market segment among the national full-service real estate investment brokerage firms, which have traditionally focused on institutional investors and corporate real estate owners and users. |
| • | It is a highly fragmented market with a large number of buyers, sellers and properties in different geographic regions and sectors. |
| • | The majority of brokerage competition comes from local and regional brokers who lack a national platform and capability to serve private owners and investors across the country. |
60
Table of Contents
| • | The attractive financial results for property investment, particularly in the multifamily market, provide the opportunity for move up equity (owners seeking to trade to higher quality and/or larger assets) and redeployment of capital, both of which support a high number of sales transactions. |
Investment Sales Brokerage Competitive Landscape. Investment sales brokerage competition in the private client segment is highly fragmented. In 2012, the top 10 investment sales brokerage firms accounted for only 21% of transactions of greater than $1 million and less than $10 million, and the top 20 firms accounted for only 27%. This segment is predominately characterized by local and regional brokerage firms, and national, residential brokerage firms. The range of competitors highlights the uniqueness of our business model, as we are the only firm with a national footprint that is also squarely focused on investment sales within the private client segment. Based on data from CoStar and Real Capital Analytics, we led the segment with 2,141 transactions or 7.8% market share in 2012, nearly double that of our closest competitor.
2012 U.S. Investment Brokerage Ranking – Private Client Segment*
Multifamily, Retail, Office and Industrial Sectors (by number of sales)
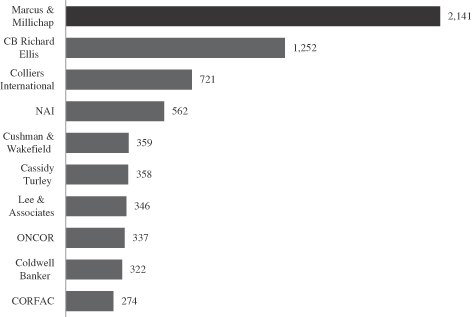
| * | Includes multifamily, retail, office and industrial sales from $1 million to $10 million in which the brokerage firms represented the seller. Sources: CoStar Group, Inc. and Real Capital Analytics. |
We believe that many property investors and capital providers benefit from a consolidation of provider relationships covering sales, financing and portfolio strategy and market analysis on a national or regional basis. Key advantages of consolidated national service provider relationships are consistent analysis, market information, access to a broad pool of investors, access to a large inventory of product and, most importantly, reliable, consistent execution across markets. This consolidation improves efficiency by providing more investment options and a single point of contact and execution for the investor. We believe we are ideally positioned to further expand our market leadership through our growth strategy in the private client sector as well as additional market segments.
61
Table of Contents
Overview
Marcus & Millichap is a leading national brokerage firm specializing in commercial real estate investment sales, financing, research and advisory services. We have been the top broker in the United States based on the number of investment transactions over the last 10 years, based on data from CoStar and Real Capital Analytics. We have more than 1,100 investment sales and financing professionals in 73 offices who provide investment brokerage and financing services to sellers and buyers of commercial real estate. We also offer market research, consulting and advisory services to developers, lenders, owners and investors. In 2012, we closed more than 6,100 sales and financing transactions with total volume of approximately $22 billion.
We focus primarily on the private client segment, consisting of transactions with prices under $10 million. The private client segment consistently comprises over 80% of the total number of property transactions in the commercial real estate market.
We were founded in 1971 and are committed to building the leading national investment brokerage business. To achieve that goal, we underwrite, market and sell commercial real estate properties for our private clients in a manner that maximizes value for sellers and provides buyers with the largest and most diverse inventory of commercial properties. Our business model is based on several key attributes: a focus on investment brokerage services, a critical mass of sales professionals providing consistent services and exclusive client representation, a national platform based on information sharing and powered by proprietary technology, a management team with investment brokerage experience, a financing team that is integrated with our investment sales force and research and advisory services tailored for our clients.
We devote our expertise and focus to the investment brokerage and financing business as opposed to other businesses, such as leasing or property management. Accordingly, our business model is unique from our national competitors, who focus primarily on the institutional real estate segment, and from our local and regional competitors, who lack a broad national platform. As the leading investment sales and financing firm in our segment, we believe we are ideally positioned to capture significant growth opportunities in our market.
Our sales professionals are specialized by property type and by local market area, as we believe a focused expertise brings value to our clients. Our model and footprint provide an unparalleled level of connectivity to the marketplace. We operate 59 offices in 46 major markets, which we define as metropolitan areas with a population of at least 1 million, and 14 offices in mid-market locations, which we define as metropolitan areas with a population of less than 1 million. Our broad geographic coverage, property expertise, and significant relationships with both buyers and sellers provide connectivity and increase liquidity in our markets. By closing more transactions annually than any other firm (based on data from CoStar and Real Capital Analytics), our sales professionals are able to provide clients with a broad and deep perspective on the investment real estate market locally, regionally and nationally.
We generate revenues by collecting commissions upon the sale and financing of commercial properties. These fees consist of commissions collected upon the sale of an asset, based upon the value of the property, and fees collected by our financing subsidiary from the placement of loans. In 2012, approximately 91% of our revenues were generated from real estate brokerage commissions, 6% from financing fees and 3% from other fees, including consulting and advisory services.
62
Table of Contents
The following tables show our investment sales and financing transactions in 2012 by property type and investor segment:
Marcus & Millichap Investment Sales and Financing Transactions by Property Type (2012)
| Property Type | Transactions | Volume (Billion) |
Percent of Total Transactions |
|||||||||
| Multifamily |
2,859 | $ | 11.8 | 46.5 | % | |||||||
| Retail |
2,022 | 5.5 | 32.9 | |||||||||
| Office |
366 | 1.3 | 6.0 | |||||||||
| Industrial |
181 | 0.7 | 2.9 | |||||||||
| Land |
155 | 0.3 | 2.5 | |||||||||
| Self-Storage |
116 | 0.5 | 1.9 | |||||||||
| Hospitality |
105 | 0.4 | 1.7 | |||||||||
| Seniors Housing |
78 | 0.8 | 1.3 | |||||||||
| Manufactured Housing |
61 | 0.2 | 1.0 | |||||||||
| Mixed - Use / Other |
206 | 0.5 | 3.3 | |||||||||
|
|
|
|
|
|
|
|||||||
| Total |
6,149 | $ | 22.0 | 100.0 | % | |||||||
|
|
|
|
|
|
|
|||||||
Marcus & Millichap Investment Sales and Financing Transactions by Investor Segment (2012)
| Private Client Segment | Institutional Segment |
|||||||||||||||||||
| < $1 Million | $1 - $10 Million | Hybrid Segment | Total | |||||||||||||||||
| Transactions |
||||||||||||||||||||
| Investment Sales |
1,477 | 3,377 | 243 | 140 | 5,237 | |||||||||||||||
| MMCC - Financing |
334 | 550 | 21 | 7 | 912 | |||||||||||||||
|
|
|
|
|
|
|
|
|
|
|
|||||||||||
| Total |
1,811 | 3,927 | 264 | 147 | 6,149 | |||||||||||||||
|
|
|
|
|
|
|
|
|
|
|
|||||||||||
| Dollar Volume (Billions) |
||||||||||||||||||||
| Investment Sales |
$ | 0.8 | $ | 10.1 | $ | 3.2 | $ | 5.7 | $ | 19.8 | ||||||||||
| MMCC - Financing |
0.2 | 1.5 | 0.3 | 0.2 | 2.2 | |||||||||||||||
|
|
|
|
|
|
|
|
|
|
|
|||||||||||
| Total |
$ | 1.0 | $ | 11.6 | $ | 3.5 | $ | 5.9 | $ | 22.0 | ||||||||||
|
|
|
|
|
|
|
|
|
|
|
|||||||||||
Competitive Strengths
We believe the following strengths provide us with a competitive advantage and opportunities for success:
National Platform Focused on Investment Brokerage. We are committed to building the leading national investment brokerage business. To achieve our goal, we focus on investment brokerage as opposed to other businesses such as leasing or property management. In addition, we combine proprietary technology and processes to market investment real estate with highly qualified sales professionals in 73 offices nationwide. Our commitment to specialization is also reflected in how we organize our sales professionals by property type and market area, further deepening the skills, relationships and market knowledge required for achieving the best results for our clients.
Market Leader in the Private Client Segment. We are the leading commercial real estate investment broker in the United States based on the number of transactions. We focus primarily on the private client segment of the market, consisting of transactions with prices under $10 million, which accounted for over 90% of our sales in 2012. This segment, representing the vast majority of the number of commercial properties in the United States, has high asset turnover rates due to personal circumstances and business reasons, such as death, divorce and changes in partnership and other personal or financial circumstances. The private client brokerage industry is highly fragmented and characterized by high barriers to entry. These barriers include the need for a large, specialized sales force prospecting private clients, the difficulty in identifying and establishing relationships with such investors and the challenge of serving their needs locally and nationally. For transactions in the $1 million
63
Table of Contents
to $10 million range nationally, the top 10 brokerage firms represented just 21% of commercial property sales in 2012. We believe our core business is the least covered segment by national firms, in addition to being significantly underserved by local and regional firms that lack a multi-market platform.
Integrated Platform for Real Estate Value Creation. We have built our business to maximize value for real estate investors through an integrated set of services geared toward our clients’ needs. Within investment sales, we are committed to investment brokerage specialization, providing the largest sales force in the industry, fostering a culture and policy of information sharing on each asset we represent and using proprietary technology that facilitates real-time buyer-seller matching. Our investment sales organization underwrites, positions and markets investment real estate to the largest pool of qualified buyers. We coordinate proactive marketing campaigns that access the investor relationships and resources of the entire firm, far beyond the capabilities of an individual listing agent. These efforts produce wide exposure to investors who we identify as high-probability bidders for each asset.
We have one of the largest teams of financing professionals in the investment brokerage industry through Marcus & Millichap Capital Corporation, or MMCC. MMCC provides financing expertise and access to debt capital by securing competitive loan pricing and terms for our clients. In 2012, MMCC closed more than 900 financings with an aggregate loan value of over $2 billion, making us a leading mortgage broker in the industry. Finally, our market research analyzes the latest local and national economic and real estate trends, enabling our clients to make informed investment and financing decisions. These integrated services enable us to facilitate transactions for our clients across different property sectors and markets.
Management with Significant Investment Brokerage Experience. The majority of our managers are former senior sales professionals of the firm who now focus on management and do not compete with our sales force. As executives of the firm dedicated to hiring, training, developing and supporting our professionals, their investment brokerage background is extremely valuable. Almost all of our top sales professionals were hired without prior experience and were trained, developed and supported by our regional managers. Our comprehensive training and development programs rely greatly on the regional managers’ personal involvement. Their past experience as senior sales professionals plays a key role in helping our junior professionals establish technical and client service skills. Our regional managers also coach our sales professionals in setting up, managing and growing their business. We believe this management structure has helped the firm create a competitive advantage and achieve better results for our clients.
Growth Strategy
We have a long track record of successful growth in our core business driven by opening new offices and by hiring, training and developing new sales and financing professionals. Since the implementation of our long-term growth plan in 1995, our revenue has increased sevenfold and we have grown from approximately 390 sales professionals in 22 offices to more than 1,100 sales and financing professionals in 73 offices. To drive our future growth, we continually seek to expand our national footprint and optimize the size, product segmentation and specialization of our team of sales and financing professionals. The key strategies of our growth plan include:
Increase Market Share in Our Core Business. The private client segment is highly fragmented, with the top 10 brokerage firms accounting for only 21% of 2012 sales in the $1 million to $10 million range, based on data from CoStar and Real Capital Analytics. Despite our industry-leading market share of 7.8%, we believe there are opportunities to substantially enhance our position in the segment. We believe the largest opportunities are in private client multi-tenant office and industrial properties in which our 2012 market share was 2.8% and 0.7%, respectively. In addition, we believe there is still significant room for growth in multifamily and retail properties, where we had 2012 market share of 14.6% and 10.6%, respectively. We leverage our existing platform, relationships and brand recognition among private clients to grow through expanded marketing and coverage. Our growth plan includes the following components:
| • | Grow in Targeted Locations. Our plan targets specific markets and calls for both expansion of existing offices and opening additional offices. We have assigned key executives and managers to these markets and our recruiters have begun to hire additional experienced sales professionals. We have targeted |
64
Table of Contents
| markets based on population, employment, commercial real estate sales, inventory and competitive landscape. In addition, we have developed optimal office plans to capitalize on these factors by tailoring sales force size, coverage and composition by office and business segment. We expect this intensified focus on target markets, coupled with new marketing campaigns, reassigned geographic boundaries and team development, to result in significant growth. Recent initiatives have shown that concentrated efforts can produce marked results. For example, a recent initiative to grow our New York office sales force led to an increase in business volume and made it our top grossing office in 2012. In Milwaukee, one of our mid-market offices, we increased our sales force, generating a more than 450% revenue increase from 2010 to 2012. |
| • | Grow in Specialty Property Segments. We believe that specialty property segments, including hospitality, multifamily tax credit and affordable housing, student housing, manufactured housing, seniors housing and self-storage, offer significant room for growth. To take advantage of these opportunities, we are increasing our property type expertise by adding regional directors who can bring added management capacity, business development and sales professional support. These executives will work with our regional and group managers to increase sales professional hiring, training, development and redeployment, and to execute various branding and marketing campaigns to expand our presence in key property segments. |
| • | Increase Sales Professional Hiring. We grow our business by hiring, training and developing sales professionals. We have implemented several initiatives to increase both new and experienced sales professional hiring through our recruiting department, specialty directors and regional managers. Our new sales professionals are trained in all aspects of real estate fundamentals and client service through formal training and apprenticeship programs. As these sales professionals mature, we continue to provide best practices and specialty training. When hiring more experienced sales professionals, we have focused on cultural fit. We believe this model creates a high level of teamwork, as well as operational and client service consistency. |
Grow Financing Services. We are focused on growing our financing services provided through MMCC. Our mortgage brokerage business placed more than $2 billion of financings in 2012, and we are taking steps that we believe will substantially increase our internal loan business capture rate from 4.7% of buy-side investment sales in 2012. We intend to execute this strategy by adding financing professionals in 16 offices that currently do not have an MMCC presence and enhancing our cross-selling training, education and internal branding. We also plan to enhance MMCC’s service platform and expand our revenue sources by developing other services such as mezzanine financing, equity placement and conduit financing.
Expand Our Market Share of Larger Transactions. Our extensive relationships with private clients have enabled us to capture a greater portion of commercial real estate transactions in excess of $10 million and bridge the private and institutional capital markets in recent years. Our ability to connect private capital with institutional assets plays a major role in differentiating our services. In 2011, we introduced a division dedicated to serving major investors branded as Institutional Property Advisors, or IPA, in the multifamily sector. As a result, we rose from the 7th-ranked investment brokerage firm by dollar volume in the $25 million and above multifamily sector in 2010 to the 4th-ranked firm in 2012. This strategy has met with great success and market acceptance and provides a vehicle for further growth within the larger, institutional multifamily segment. This strategy also provides a model for expansion into institutional retail and office sectors.
Our Company
We provide investment brokerage and financing services to investors of all types and sizes of commercial real estate assets. We are a leading national investment brokerage company primarily focused on private clients transacting in the under $10 million price range. This is the largest and most active market segment and comprised over 80% of total U.S. commercial property sales over the last ten years. We have offices across the United States, with more than 1,100 sales professionals in 59 offices in major metropolitan markets and 14 offices in mid-market locations, which are in secondary and smaller metropolitan areas. We leverage our
65
Table of Contents
relationships with investors and use proprietary marketing tools to match properties with qualified buyers. Our financing professionals obtain competitive debt financing for buyers of our properties and owners who need to refinance or restructure their positions. The following graph shows our transactions in investment sales and financing from 2003 to 2012:
Investment Sales and Financing Transactions, 2003-2012
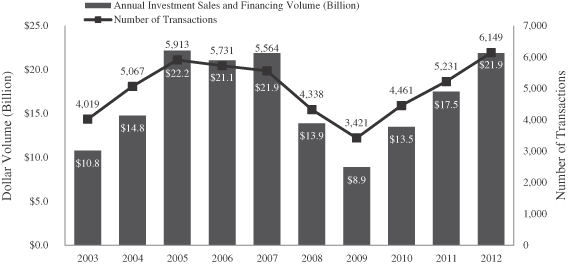
Company History. We opened our first office in Palo Alto, California in 1971, and expanded our Northern California footprint and established a presence in Arizona, Colorado and Texas in the late 1970s. During the 1980s, we opened offices in Southern California and the Midwest. In 1995, we established our long-term growth plan and began our full national expansion. Our revenues grew quickly through 2006 with a compound annual growth rate of 22% from 1995 to 2006. In 2007, the credit markets began to show signs of distress resulting in a shortage of liquidity in some financing markets, including real estate. Beginning in late 2008, the credit crisis and recession greatly affected the commercial real estate industry, resulting in a dramatic revenue decline. Despite the severity of the market downturn, we maintained all of our offices and services, enabling us to take advantage of the market recovery and resume our growth quickly thereafter. As the real estate and financing markets recovered after 2009, our transaction volume has grown significantly.
66
Table of Contents
Geographic Locations. We have offices across the United States in 37 states, with more than 1,100 sales professionals in 59 offices in major metropolitan markets and 14 offices in mid-market locations. Set forth below is a map reflecting the geographic location of our offices as of August 26, 2013.

Our Services. We offer two primary services to our clients: commercial real estate investment brokerage and financing.
Commercial Real Estate Investment Brokerage. Our primary business and source of revenue is the representation of commercial property owners as their exclusive investment broker in the sale of their properties. Commissions from investment sales accounted for approximately 91% of our revenues in 2012. Sales are generated by maintaining relationships with property owners, providing market information and trends to them during their investment or “hold” period and being selected as their representative when they decide to sell or exchange their commercial property with a similar asset. We collect commissions upon the sale of each asset based on a percentage of property value. These commission percentages are typically inversely correlated with property value and thus are generally higher for smaller transactions. Our sales professionals also represent buyers in fulfilling their investment real estate acquisition needs; however, the vast majority of our investment sales business is generated from our exclusive representation of sellers.
67
Table of Contents
Our core business concentration is aligned with the largest market segment as illustrated in the charts below. These charts show the number of transactions by investor segment in 2012 and the number of multifamily, retail, office and industrial property sales in 2012 for properties priced at $1 million or greater in the commercial real estate industry:
Number of Transactions by Investor Segment in 2012*
| Marcus & Millichap | Commercial Real Estate Industry | |

|
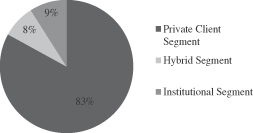
| |
| * | Includes multifamily, retail, office and industrial sales $1 million and greater. Sources: CoStar Group, Inc. and Real Capital Analytics. |
In 2012, we closed 5,237 investment sales transactions in a broad range of commercial property types, with a total transaction value of approximately $20 billion. In the last 10 years, we have closed more transactions than any other firm, based on data from CoStar and Real Capital Analytics. We have significantly diversified our business beyond our historical focus on multifamily properties. The following table shows the various property types included in our sales transactions in 2012:
Marcus & Millichap Investment Sales Transactions by Property Type (2012)
| Property Type |
Transactions | Volume (Billion) |
Percent of Total Transactions |
|||||||||
| Multifamily |
2,257 | $ | 10.5 | 43.1 | % | |||||||
| Retail |
1,816 | 5.0 | 34.7 | |||||||||
| Office |
334 | 1.1 | 6.4 | |||||||||
| Industrial |
177 | 0.7 | 3.4 | |||||||||
| Land |
155 | 0.3 | 3.0 | |||||||||
| Self-Storage |
99 | 0.5 | 1.8 | |||||||||
| Hospitality |
97 | 0.4 | 1.9 | |||||||||
| Seniors Housing |
76 | 0.7 | 1.5 | |||||||||
| Manufactured Housing |
51 | 0.1 | 1.0 | |||||||||
| Mixed-use / Other |
175 | 0.5 | 3.2 | |||||||||
|
|
|
|
|
|
|
|||||||
| Total |
5,237 | $ | 19.8 | 100.0 | % | |||||||
We are building on our track record of growth by expanding our coverage of various property types. These include self-storage, hospitality, seniors housing, multifamily tax credit and affordable housing and manufactured housing, where we are already a leading broker but have significant room for additional growth due to market size and opportunity. We are also expanding our specialty group management and support infrastructure, specialized branding and business development customized to each of these segments and intensifying our recruiting efforts, which we believe will result in increased business in the various property types.
We underwrite, value, position and market properties to reach the largest and most qualified pool of buyers. We offer our clients the industry’s largest team of investment sales professionals operating with a culture and policy of information sharing, powered by our proprietary system, MNet, which enables real-time buyer-seller matching. We use a proactive marketing campaign that leverages the investor relationships of our entire sales force, direct marketing and a suite of proprietary web-based tools that connects each asset with the right buyer
68
Table of Contents
pool. We strive to maximize value for the seller by generating high demand for each asset. Our approach also provides a diverse, consistently underwritten inventory of investment real estate for buyers. When a client engages one of our sales professionals, he or she is engaging an entire system, structure and organization committed to maximizing value for our clients.
Financing. MMCC is a leading broker of debt financing for commercial properties in the under $10 million market segment. MMCC has approximately 60 financing professionals in 32 offices, the most among national investment sales brokerage firms. It generates revenue in the form of financing fees collected from the placement of loans from banks, insurance companies, agencies and commercial mortgage backed securities, or CMBS, conduits. MMCC’s financing fees vary by loan amount. In 2012, MMCC completed more than 900 financing transactions with a value of $2.2 billion and accounted for 6% of our revenues. MMCC’s size, market reach and business volume enables us to establish long-term relationships and special programs with various capital sources. This in turn improves MMCC’s value proposition to borrowers seeking competitive financing rates and terms. MMCC is not limited to promoting in-house or exclusive capital sources and seeks the most competitive financing solution for each client’s specific needs and circumstances. It places loans for refinancing not involving a sale as well as acquisition financing for individual assets and portfolios. MMCC’s revenues are divided nearly equally between placing acquisition financing and refinancing.
MMCC is fully integrated with our investment sales force under the supervision of our regional managers, which promotes cross selling, information sharing, business referrals and better client service. By leveraging our national network of sales professionals, we are able to provide clients with the latest property markets and capital markets information and partner with national and regional lenders to secure loan packages that meet our clients’ financial objectives. Approximately half of MMCC’s revenue is generated through the firm’s investment sales force and half is generated through direct marketing to borrowers.
In the future, we plan to expand the MMCC business to include mezzanine financing, raising and placing equity and conduit financing. To do this, we intend to hire experienced individuals and capital markets teams in these areas and establish relationships with capital sources that specialize in these segments.
Other Services: Research and Advisory. Our research and advisory services are designed to assist clients in forming their investment strategy and making buy-sell-hold decisions. Our research is fully integrated with our sales professionals’ client dialogue, client relationship development and maintenance and transaction execution. Our advisory services are coordinated with both our sales and financing professionals and are designed to provide customized analysis and increase customer loyalty and long-term transaction volume.
Our research division produces more than 900 publications per year and has become a leading source of information for the industry as well as the general business media. We provide research on 13 commercial property segments, covering multifamily, retail, office, industrial, capital markets/financing, single-tenant net lease, seniors housing, student housing, self-storage, hospitality, medical office, manufactured housing and tax credit low income housing. We are regularly quoted in regional and national publications and media, and deliver content directly to the real estate investment community through print, electronic publications and video. This research includes analysis and forecasting of the economy, capital markets, real estate fundamentals, investment, pricing and yield trends, and is designed to assist investors in their strategy formation and decisions relating to specific assets, helping our sales professionals develop and maintain relationships with clients.
We also provide a wide range of advisory and consulting services to developers, lenders, owners, real estate investment trusts, high net worth individuals, pension fund advisors and other institutions. Our advisory services include opinion of value, operating and financial performance benchmarking analysis, specific asset buy-sell strategies, market and submarket analysis and ranking, portfolio strategies by property type, market strategy, and development and redevelopment feasibility studies.
Competition
We compete in investment brokerage and financing within the commercial real estate industry on a national, regional and local basis. Competition is based on a number of critical factors, including the quality and expertise of our sales and financing professionals, our execution skills, agent support, brand recognition and our business
69
Table of Contents
reputation. We primarily compete with other brokerage and financing firms that seek investment brokerage and financing business from real estate owners and investors and, to a lesser extent, in-house real estate departments, owners who may transact without using a brokerage firm, direct lenders, consulting firms and investment managers, some of which may have greater financial resources than we do. Our relative competitive position also varies across geographies, property types and services. In investment sales, our competitors on a national level include CBRE Group, Inc., Colliers International, NAI, Cushman &Wakefield, Cassidy Turley, Lee & Associates, ONCOR, Coldwell Banker, CORFAC, HFF, Inc. and Jones Lang LaSalle. Our major financing competitors include HFF, Inc., CBRE Group, Inc., Jones Lang LaSalle, Johnson Capital, Berkadia Commercial Mortgage LLC, Grandbridge Real Estate Capital, and NorthMarq Capital, LLC. The investment sales firms mainly focus on larger sales and institutional investors and are not heavily concentrated in our main area of focus, which is the under $10 million private client market. However, there is cross over and competition between us and these firms. There are also numerous local and regional competitors in our markets, as well as competitors specializing in certain property segments.
Competition to attract and retain qualified professionals is also intense in each of our markets. We offer what we believe to be competitive compensation and support programs to our professionals. Our ability to continue to compete effectively will depend on retaining, motivating and appropriately compensating our professionals.
Employees and Sales and Financing Professionals
As of June 30, 2013, we had 1,193 sales and financing professionals who are exclusive independent contractors. We also had 513 employees as of June 30, 2013, consisting of 30 financing professionals, 14 in marketing, 18 in research and 451 in sales management and support and general and administrative functions. We believe our employee relations are good.
Many of the company’s sales and financing professionals are classified as independent contractors under state and IRS guidelines. As such, the company generally does not pay for the professional’s expenses or benefits or withhold payroll taxes. They are paid from the commissions earned by the company upon the closing of a transaction, and do not earn a salary from which taxes are withheld. Almost all of the sales professionals hold applicable real estate broker licenses and execute a “Salespersons Agreement” setting out the relationship between the professional and the company. Each professional is obligated to provide brokerage services exclusively to the company, and is provided access to the company’s information technology, research and other support and business forms. Each professional generally reports on their activities to either the local company manager, or in some cases to product specialty managers.
Organization
Our sales and financing professionals are located in offices throughout the United States, each led by a regional manager with previous investment brokerage experience and an active brokerage license. We have 42 regional managers, who are responsible for hiring, developing and deploying sales professionals, managing regional and mid-market offices, and supervising MMCC originators and support staff in their region. We also have five group managers who oversee regional managers and multiple offices; group managers hire, develop, and support our regional managers and provide additional leadership and support for our sales force. Finally, our management structure includes national specialty directors who lead each property segment. Our national specialty directors develop our national and local brand in each property sector, develop major accounts and coordinate multi-market assignments on behalf of large clients.
Sales Professionals
Traditionally, our growth has been driven by hiring, training and developing new sales professionals. Our new sales professionals are trained in our technical and client service standards through a comprehensive program starting with pre-training, formal training and apprenticeship programs. While continuing to improve the hiring, training and developing of new sales professionals remains a major priority, we have also expanded our hiring strategy to include more experienced sales professionals who fit our culture and values. Over the past
70
Table of Contents
several years, experienced sales professionals, including some top performers previously with national competitors, have joined the firm and have become productive members of our team. As sales professionals mature, we continue with specialized training and best practices sessions by tenure, which are conducted by senior management, regional managers, leading sales professionals and our national specialty directors. The goal of this rigorous approach to training is to continually improve our team’s skill set and client services. Our sales force conducts business the same way across the country to deliver a high level of consistency, professionalism and reliability to our clients who often buy and sell investments in variety of locations and/or property types.
As of June 30, 2013, approximately 28% of our sales professionals have been with the company for less than one year, 19% have been with us for one to three years, 12% for three to five years, and 41% for more than five years. Our sales professionals receive a percentage of the commission received by the company. As sales professionals become more senior, they receive a larger percentage of the commission based on tenure and production. Depending on the price of the property, a portion of the sales professional’s commission may be deferred for three years.
Seasonality
A significant portion of our revenue is seasonal, which can affect an investor’s ability to compare our financial condition and results of operations on a quarter-by-quarter basis. Historically, this seasonality has caused our revenue, income and cash flow from operating activities to be lowest in the first quarter of the calendar year, stronger during the second and third quarters and highest in the fourth quarter of the calendar year. The concentration of earnings and cash flows in the later part of the year is due to a number of factors, including clients’ focus on completing transactions towards the end of the calendar year, tax considerations and anticipated changes in legislation. This has historically resulted in lower profits or a loss in the first quarter, with revenue and profitability improving in each subsequent quarter.
Technology
We have a long-standing tradition of technological orientation, innovation and advancement. Our efforts include the development of proprietary applications designed to make the process of matching buyer and sellers faster and more efficient as well as state-of-the art communication technology, infrastructure, internet presence and electronic marketing.
We have a proprietary internal marketing system, MNet, which allows our professionals to share listing information with investors across the country. MNet is an integrated tool that contains our entire national property inventory, which allows sales professionals to search for properties based on investors’ acquisition criteria. This system is an essential part of connecting buyers and sellers through our national platform. Our policies require information sharing among our sales professionals, and the MNet system automates the process of matching each property we represent to the largest pool of qualified buyers tracked by our national sales force. A part of MNet called Buyer Needs enables our sales professionals to register the investment needs of various buyers which are then matched to our available inventory on a real-time basis.
We have also developed a proprietary system for automating the production of property marketing materials and launching marketing campaigns, which we call iMpact. iMpact allows our sales professionals to input data into a listing proposal or marketing package, automatically imports property information, data on comparable properties and other information, and then dynamically populates our e-marketing, print, and Internet media. This system allows sales professionals to rapidly create professionally branded and designed materials for marketing properties on behalf of our clients in an efficient and timely manner.
Marketing and Branding
Our 42 years of investment brokerage specialization and concentration in the private client segment have established our brand as the leading broker of investment real estate as well as a trusted source of market research and financing solutions. In recent years, the company has also garnered recognition among larger private investors and institutions due to our integrated platform and capability of linking private and institutional
71
Table of Contents
capital. We continue to strengthen and broaden the firm’s name recognition and credibility by executing a variety of marketing and branding strategies. Locally, our offices engage in numerous events, direct mail campaigns, investor symposiums and participation in real estate conferences and organizations for various market segments. Our regional managers and agents develop long-term client relationships and promote the firm’s brand through these vehicles.
In addition, we frequently have featured speaking roles in key regional and national industry events, and produce over 900 research reports, semi-monthly economic and real estate market briefs and semi-annual market overview videocasts. All of this content is tailored and disseminated by property type to our clients and the real estate investment community. Our transactional and market research expertise result in significant print, television and online media coverage including all major real estate publications as well as local market and major national news outlets. This creates significant exposure and name recognition for the firm. Nationally, our specialty group and capital markets executives actively participate in various trade organizations, many of which focus on specific property sectors and provide an effective vehicle for client relationship development and branding. The firm takes a proactive stance with its marketing program through multiple channels including our website, timely e-mail and print marketing, as well as agent-driven personal client interactions.
Intellectual Property
We hold various trademarks and trade names, which include the “Marcus & Millichap” name. Although we believe our intellectual property plays a role in maintaining our competitive position in a number of the markets that we serve, we do not believe we would be materially, adversely affected by expiration or termination of our trademarks or trade names or the loss of any of our other intellectual property rights other than the Marcus & Millichap name. With respect to the Marcus & Millichap name, we maintain trademark registrations for these service marks.
In addition to trade names, we have developed proprietary technologies for the provision of real estate investment services, such as MNet and iMpact. We also offer proprietary research to clients through our research division. While we seek to secure our rights under applicable intellectual property protection laws in these and any other proprietary assets that we use in our business, we do not believe any of these other items of intellectual property are material to our business in the aggregate.
Government Regulation
We are subject to various real estate regulations. The company is licensed as a mortgage broker and a real estate broker in 44 states. We are licensed broker in each state where we have an office, as well as where we frequently do business. We are also subject to numerous other federal, state and local laws and regulations that contain general standards for and prohibitions on the conduct of real estate brokers and sales associates, including agency duties, collection of commissions, telemarketing and advertising and consumer disclosures.
Legal Proceedings
We are involved in claims and legal actions arising in the ordinary course of our business. Such litigation and other proceedings may include, but are not limited to, actions relating to intellectual property, commercial relationships, standard brokerage disputes like the alleged failure to disclose physical or environmental defects or property expenses or contracts, the alleged inadequate disclosure of matters relating to the transaction like the relationships among the parties to the transaction, potential claims or losses pertaining to the asset, vicarious liability based upon conduct of individuals or entities outside of our control, general fraud claims, conflicts of interest claims, employment law claims, including claims challenging the classification of our sales professionals as independent contractors, and claims alleging violations of state consumer fraud statutes.
While the results of such claims and legal actions cannot be predicted with certainty, we do not believe based on information currently available to us that the final outcome of these proceedings will have a material adverse effect on our consolidated financial position, results of operations or cash flows. We carry standard errors and omissions insurance designed to cover certain acts of broker malpractice.
72
Table of Contents
Facilities
Our principal executive offices are located in Calabasas, California, where we lease approximately 10,400 square feet under a lease that expires in May 2017.
We also lease offices (typically less than 12,000 square feet) in various geographic locations throughout the United States, primarily for sales and financing professionals and support personnel. We believe that our current facilities are adequate to meet our needs through the end of 2014; however, as we continue to expand in various mid-market locations and grow our market share in existing metropolitan areas, we may need to lease additional space.
73
Table of Contents
Executive Officers and Directors
The names and ages of our executive officers and directors as of September 23, 2013 are as follows:
| Name |
Age |
Position(s) | ||||
| John J. Kerin |
58 | President, Chief Executive Officer and Director | ||||
| Martin E. Louie |
52 | Chief Financial Officer | ||||
| Gene A. Berman |
59 | Executive Vice President | ||||
| William E. Hughes |
64 | Senior Vice President, Marcus & Millichap Capital Corporation | ||||
| Hessam Nadji |
48 | Chief Strategy Officer | ||||
| George M. Marcus |
72 | Co-Chairman and Director | ||||
| William A. Millichap |
70 | Co-Chairman and Director | ||||
| Norma J. Lawrence |
58 | Director Nominee | ||||
| George T. Shaheen |
69 | Director Nominee | ||||
| Don C. Watters |
70 | Director Nominee | ||||
| Nicholas F. McClanahan |
68 | Director Nominee | ||||
| (1) | Member of Audit Committee |
| (2) | Member of Compensation Committee |
| (3) | Member of Nominating and Corporate Governance Committee |
Executive Officers
John J. Kerin has served as President and Chief Executive Officer since 2010 and as a director since June 2013. Prior to his appointment as President and CEO, Mr. Kerin was a senior vice president and managing director from 1996 to 2010, responsible for the operations of 18 offices nationwide. Mr. Kerin joined the firm as a sales professional in 1981, ranking among the top 10 sales professionals nationwide in 1985 and 1986, and was promoted to senior investment associate in 1987. In 1987, Mr. Kerin became the regional manager of the Los Angeles office, where he succeeded in making it one of the top-producing offices in the firm. He was elected first vice president in 1994 and promoted to managing director in 1996. Mr. Kerin received a B.A. in Communications from Loyola Marymount University.
Martin E. Louie has served as Chief Financial Officer since 2010. Prior to becoming Chief Financial Officer, Mr. Louie was first vice president of finance beginning in 2009, and vice president of finance from 2006 to 2009. Mr. Louie has served as a senior financial executive with worldwide responsibilities for various companies, including Sony Pictures Entertainment, The Walt Disney Co., Infineon Technologies and West Marine. In those roles, he was responsible for accounting, strategic planning, financial planning and analysis, treasury and investor relations. Prior to that, Mr. Louie, who is a CPA, was with KPMG. Mr. Louie received a B.A. in economics from the University of California, Los Angeles and an MBA in finance from the University of Southern California.
Gene A. Berman has served as an executive vice president of Marcus & Millichap since 2010. He has also served as a group managing director since 2005, overseeing the firm’s offices in the Northeast, Southeast and Texas. Mr. Berman began his career with Marcus & Millichap in 1982 as a sales professional and was named senior investment associate in 1987. He became a Regional Manager in 1996, was named a vice president in 1997 and first vice president in 2001. He was promoted to senior vice president in 2002 and managing director in 2005. Mr. Berman received an A.B. in Communications from the University of Southern California and a J.D. from Southwestern University School of Law in Los Angeles.
William E. Hughes has served as a senior vice president of our subsidiary Marcus & Millichap Capital Corporation, or MMCC, since 2000. He became a Managing Director of Marcus & Millichap in 2008.
74
Table of Contents
Mr. Hughes is responsible for managing MMCC’s operations on a national basis. He joined Marcus & Millichap in 1996 and has a diversified background in real estate finance, financial consulting and modeling, project feasibility, leasing, construction management and real estate development. Prior to joining the company, Mr. Hughes held various senior executive roles with several financial and real estate investment firms. He received a B.S. in Business Administration from the University of Southern California.
Hessam Nadji has served as Chief Strategy Officer since September 2013. Mr. Nadji previously served as senior vice president from 1997 to September 2013. Mr. Nadji works with the senior management team in setting and executing the company’s long-term strategy and oversees all national specialty groups, as well as Research and Advisory Services. The national specialty groups provide client services, coordinate major account development and deliver specialized support to the company’s sales force within each property segment. Mr. Nadji joined the company in 1996 as vice president of research, became a senior vice president in 1997 and was appointed managing director in April 2000. Prior to joining the company, Mr. Nadji was senior vice president and national director of research and information services for Grubb & Ellis Co. He received a B.S. in information management and computer science from City University in Seattle.
Directors
George M. Marcus is our founder and has served as our chairman since 1971. Mr. Marcus is also the founder, CEO and chairman of Marcus & Millichap Company, our current parent company, and the chairman of various companies affiliated with Marcus & Millichap Company, including SummerHill Homes and Pacific Urban Residential. Mr. Marcus is also the founder and chairman of Essex Property Trust, a public multifamily real estate investment trust. Mr. Marcus was also one of the original directors of Plaza Commerce Bank and Greater Bay Bancorp, both of which were formerly publicly held financial institutions. From 2000 to 2012, Mr. Marcus was a member of the Board of Regents of The University of California. He is a member of the Real Estate Roundtable, the Bay Area Council and the Policy Advisory Board of the University of California at Berkeley—Center for Real Estate and Urban Economics. He received a B.A. in economics from San Francisco State University and is also a graduate of the Harvard Business School of Owners/Presidents Management Program and the Georgetown University Leadership Program. He has extensive knowledge of the Company, over 35 years of experience working in the real estate industry and significant experience serving on boards of other public companies.
William A. Millichap has served as our co-chairman since 2000 and also acts in an advisory capacity to the company. Mr. Millichap served as our president from 1986 to 2000. Mr. Millichap has also served as a board member and managing director of Marcus & Millichap Company since 1985, and was president of Marcus & Millichap Company from 1986 to 2000. He was also the managing partner of Marcus & Millichap Venture Partners. Mr. Millichap also served on the board of directors of Essex Property Trust from 1994 to 2009, and LoopNet, Inc. from 1999 to 2008. In addition, Mr. Millichap was one of the founders of San Jose National Bank and The Mid Peninsula Bank of Commerce, where he served on the board of directors. Mr. Millichap served on the board of directors of the National Multi Housing Council and is a member of the International Council of Shopping Centers, the Urban Land Institute and the National Venture Capital Association. Mr. Millichap received a B.S. in Economics from the University of Maryland and served as an officer in the United States Navy. Mr. Millichap, co-founder of Marcus and Millichap Company, has substantial business and real estate industry expertise due to various leadership roles. He has extensive knowledge of the Company, over 35 years of experience working the real estate industry, and significant experience serving on boards of other public companies.
Director Nominees
Norma J. Lawrence is a nominee to our board of directors and will join the board prior to the completion of this offering. Ms. Lawrence served as a partner in the audit department of KPMG LLP where she specialized in real estate. Ms. Lawrence was with KPMG from 1979 through 2012 and she was a member of the National Association of Real Estate Investment Trusts, the Pension Real Estate Association, the National Council of Real
75
Table of Contents
Estate Investment Fiduciaries, the California Society of Certified Public Accountants, and the American Institute of Certified Public Accountants. She also was a member of the Organization of Women Executives, the Valley Development Forum, and the Los Angeles Chapter of Construction Financial Management Association. Ms. Lawrence received a B.A. in mathematics and an M.B.A. in finance and accounting from the University of California, Los Angeles. Ms. Lawrence possesses particular knowledge and expertise in accounting, capital structure and financial matters in the real estate industry.
George T. Shaheen is a nominee to our board of directors and will join the board prior to the completion of this offering. Mr. Shaheen currently serves as chairman of the board of Korn/Ferry International, an international executive search and consulting firm. He also serves on the board of directors of NetApp, Inc., 24-7, Inc., PRA International, and Univita. He is a member of the strategic advisory board of Genstar Capital. From December 2006 until July 2009, Mr. Shaheen was the chief executive officer and chairman of the board of Entity Labs, Ltd. Mr. Shaheen was the chief executive officer of Siebel Systems, Inc., a CRM software company, from April 2005 until the sale of the company in January 2006. From October 1999 to April 2001, he served as the chief executive officer and chairman of the board of Webvan Group, Inc. Mr. Shaheen was previously the chief executive officer and global managing partner of Andersen Consulting, which later became Accenture, from 1988 to 1999. He has served as an IT Governor of the World Economic Forum and as a member of the board of advisors for the Northwestern University Kellogg Graduate School of Management. He has also served on the board of trustees of Bradley University. Mr. Shaheen received a B.S. in marketing and an M.B.A. in management from Bradley University. Mr. Shaheen has extensive experience as a senior executive and director of numerous companies, and he possesses significant business and leadership knowledge and experience.
Don C. Watters is a nominee to our board of directors and will join the board prior to the completion of this offering. Mr. Watters is a director emeritus of McKinsey & Company, the global management consulting firm, where he continues to lead training programs for consultants. During his 28 years with McKinsey & Company, Mr. Watters served primarily Fortune 500 sized private sector clients in over a dozen different industries on issues of strategy, organization and operations. He served on the board of directors of Merant PLC, a publicly-traded company based in the United Kingdom from the late 1990’s to 2004. Additionally, Mr. Watters was on the advisory board of Cunningham Communication, Inc. Mr. Watters has served on the board of directors of numerous non-profit organizations, including the San Jose Ballet, the Tech Museum of Innovation, the American Leadership Forum Silicon Valley, the American Leadership Forum National, United Way Silicon Valley, and the Bay Area Garden Railway Society. He is on the advisory board of the Markkula Center for Applied Ethics at Santa Clara University. Mr. Watters received a B.S. in engineering from the University of Michigan and an M.B.A. from Stanford University. Mr. Watters possesses substantial knowledge and experience in strategic planning, organization, operations and leadership of complex organizations.
Nicholas F. McClanahan is a nominee to our board of directors and will join the board prior to the completion of this offering. Mr. McClanahan served as managing director of strategic relationships at Accretive Advisor Inc. from September 2010 to February 2012. From April 1971 through April 2006, Mr. McClanahan worked at Merrill Lynch & Co. in various positions including as executive vice president of Merrill Lynch Canada and managing director of Merrill Lynch Private Banking Group from 2003 to 2005. Mr. McClanahan received a B.B.A. in finance from Florida Atlantic University and is a graduate of the Securities Industry Institute executive education program at The Wharton School at the University of Pennsylvania. Mr. McClanahan possesses particular knowledge and experience in finance, capital structure, strategic planning, management and investment.
Composition of our Board of Directors
Upon the closing of this offering, we expect to have seven to nine directors. Under the listing requirements and rules of the NYSE, independent directors must comprise a majority of a listed company’s board of directors within a specified period of the completion of this offering.
76
Table of Contents
Our board of directors will be divided into three classes effective upon the closing of the offering. The Class I directors, , will serve an initial term until the 2014 Annual Meeting of Stockholders, the Class II directors, , will serve an initial term until the 2015 Annual Meeting of Stockholders, and the Class III directors, , will serve an initial term until the 2016 Annual Meeting of Stockholders. Each class will be elected for three-year terms following its respective initial term.
Our board of directors has undertaken a review of its composition, the composition of its committees and the independence of each director. Based upon information requested from and provided by each director concerning his or her background, employment and affiliations, including family relationships, our board of directors has determined that , representing of our directors, do not have a relationship that would interfere with the exercise of independent judgment in carrying out the responsibilities of a director and that each of these directors is “independent,” as that term is defined under the applicable rules and regulations of the SEC and the listing requirements and rules of the NYSE. In making this determination, our board of directors considered the current and prior relationships that each non-employee director has with our company and all other facts and circumstances our board of directors deemed relevant in determining their independence, including the beneficial ownership of our capital stock by each non-employee director.
Director Compensation
Prior to the completion of this offering, our board of directors intends to adopt a director compensation policy. Upon completion of this offering, each independent director will receive fees for their services as follows:
| • | Board of Directors Member—$ per year |
| • | Chairman of the Board—$ per year |
| • | Chair of Audit Committee—$ per year |
| • | Chair of Compensation Committee—$ per year |
| • | Chair of Nominating and Corporate Governance Committee—$ per year |
Committees of the Board of Directors
Audit Committee. Our audit committee currently consists of , and . Our board of directors has affirmatively determined that each of such directors meets the definition of “independent director” for purposes of the NYSE rules and the independence requirements of the Exchange Act. Our board of directors intends to name as the member of our audit committee who qualifies as an “audit committee financial expert” under the applicable SEC rules and regulations and has determined that is “financially literate” as that term is defined by the NYSE corporate governance requirements. Our audit committee will be responsible for:
| • | reviewing and approving the selection of our independent registered public accounting firm, and approving the audit and non-audit services to be performed by our independent registered public accounting firm; |
| • | monitoring the integrity of our financial statements and our compliance with legal and regulatory requirements as they relate to financial statements or accounting matters; |
| • | reviewing the adequacy and effectiveness of our internal control policies and procedures; |
| • | discussing the scope and results of the audit with the independent registered public accounting firm and reviewing with management and the independent registered public accounting firm our interim and year-end operating results; and |
| • | preparing the audit committee report that the SEC requires in our annual proxy statement. |
Compensation Committee. Our compensation committee currently consists of , and . Our board of directors has affirmatively determined that each of such directors meets the definition of
77
Table of Contents
“independent director” for purposes of the NYSE rules and the independence requirements of the Exchange Act. Our compensation committee will be responsible for:
| • | overseeing our compensation policies, plans and benefit programs; |
| • | reviewing and approving for our executive officers: annual base salary, annual incentive bonus, including the specific goals and amount, equity compensation, employment agreements, severance arrangements and change in control arrangements, and any other benefits, compensation or arrangements; |
| • | preparing the compensation committee report that the SEC requires to be included in our annual proxy statement; and |
| • | administering our equity compensation plans. |
Nominating and Corporate Governance Committee. Our nominating and corporate governance committee currently consists of , and . Our board of directors has affirmatively determined that each of such directors meets the definition of “independent director” for purposes of the NYSE rules and the independence requirements of the Exchange Act. Our nominating and corporate governance committee will be responsible for:
| • | identifying, evaluating and recommending to the board of directors for nomination candidates for membership on the board of directors; |
| • | preparing and recommending to our board of directors corporate governance guidelines and policies; and |
| • | identifying, evaluating and recommending to the board of directors the chairmanship and membership of each committee of the board. |
Compensation Committee Interlocks and Insider Participation
The members of the compensation committee of our board of directors are currently , and . None of , or has at any time been an officer or employee of the company or any subsidiary of the company.
During 2012, none of our executive officers served as a member of the compensation committee of another entity, in which any of such entities’ executive officers served on our board of directors; none of our executive officers served as a director of another entity, in which any of such entities’ executive officers served on our board of directors; and none of our executive officers served as a member of the compensation committee of another entity, in which any of such entities’ executive officers served as one of the directors of our board of directors.
78
Table of Contents
Executive Compensation
2012 Summary Compensation Table
The following table sets forth information regarding the compensation awarded to, earned by, or paid to each of our Chief Executive Officer and the two most highly compensated executive officers other than our principal executive officer during each of the years ended December 31, 2012. Throughout this prospectus, these three officers are referred to as our named executive officers. As an emerging growth company, we have opted to comply with the executive compensation disclosure rules applicable to “smaller reporting companies” as such term is defined in the rules promulgated under the Securities Act.
| Name and Principal Position |
Salary ($) |
Bonus ($) (1) |
Stock Awards ($) |
Option Awards ($) |
Non-Equity Incentive Plan Compensation |
Change in Pension Value and Nonqualified Deferred Compensation Earnings ($)(2) |
All Other Compensation ($) (3) |
Total ($) |
||||||||||||||||||||||||
| John J. Kerin, President and Chief Executive Officer |
$ | 400,000 | $ | 1,500,000 | $ | — | $ | — | $ | — | $ | 1,342,442 | $ | 36,024 | $ | 3,278,466 | ||||||||||||||||
| Gene A. Berman, Executive Vice President |
$ | 300,000 | $ | 843,487 | $ | — | $ | — | $ | — | $ | 662,505 | $ | 30,007 | $ | 1,835,999 | ||||||||||||||||
| Hessam Nadji, Chief Strategy Officer |
$ | 250,000 | $ | 625,000 | $ | — | $ | — | $ | — | $ | 442,592 | $ | 41,936 | $ | 1,359,528 | ||||||||||||||||
| (1) | The bonus performance periods run from April 1 to March 31 of each year. The bonus for fiscal year ended 2012, as reported above, reflects an allocation of 25% of the bonus for the period April 1, 2011 through March 31, 2012 and 75% of the bonus for the period April 1, 2012 through March 31, 2013. The total bonus amounts for April 1, 2012 through March 31, 2013 were as follows: Mr. Kerin ($1,600,000), Mr. Berman ($900,000) and Mr. Nadji ($650,000). The total bonus amounts for April 1, 2011 through March 31, 2012 were as follows: Mr. Kerin ($1,200,000), Mr. Berman ($673,949) and Mr. Nadji ($550,000). The bonuses payable to the executives are discretionary. See “Employment Agreement with John J. Kerin” below for additional information on the calculation of his annual bonus. |
| (2) | As set forth in the below table, the amounts in this column reflect (1) the earnings for calendar year 2012 on each executive’s nonqualified deferred compensation account and (2) the aggregate increase in “appreciation value” for executive’s stock appreciation rights, or SARs. The SARs are cash-settled awards that constitute nonqualified deferred compensation because such awards are only payable upon death, disability or mutual termination and, therefore, lack a option-like feature. Upon a payment event, the appreciation value on the vested portion of the SARs is paid to the executive in 10 annual installments, with the first installment due within 30 days after the end of year in which the termination occurs or, in some cases, within 30 days after the event giving rise to the redemption. Upon a termination other than for cause or a resignation other than by mutual agreement, the executive only receives 75% of the appreciation value on the vested portion. In the event of a sale of the company, the executive officer receives the appreciation value on the same schedule as other shareholders. Appreciation value is an adjusted book value (as defined in the relevant SARs award agreement) of the company on the last day of the year before the termination of employment (or the closing date for a sale of the company) less the adjusted book value of the company on the date of grant (i.e., the grant date value). |
79
Table of Contents
| Named Executive Officer |
Nonqualified Deferred Compensation Plan Earnings* |
Increased Value of SARs from 1/1/2012 to 12/31/2012 |
Aggregate Value of SARs as of 12/31/2012 |
|||||||||
| John J. Kerin |
$ | 163,171 | $ | 1,179,271 | $ | 7,740,833 | ||||||
| Gene A. Berman |
$ | 25,015 | $ | 637,490 | $ | 1,168,724 | ||||||
| Hessam Nadji |
$ | — | $ | 442,592 | $ | 2,939,936 | ||||||
| * | See Note 10 in the “Consolidated Financial Statements—Notes to Consolidated Financial Statements” for a discussion of the method of calculating earnings on amounts in the Nonqualified Deferred Compensation Plan. |
Stock Appreciation Rights Details by Named Executive Officer
| Named Executive Officer |
Vested | Unvested | Grant Date Value |
Vesting Schedule | ||||||||||
| John J. Kerin |
4,114 | — | $ | 20.38 | ||||||||||
| 2,057 | — | $ | 19.43 | |||||||||||
| 1,850 | 925 | $ | 22.53 | 1/3 of the SARs vest on April 15 of each of 2011-2013. | ||||||||||
| Gene A. Berman |
250 | — | $ | 21.24 | ||||||||||
| 750 | — | $ | 19.39 | |||||||||||
| 800 | 200 | $ | 19.54 | 1/5 of the SARs vest on April 15 of each of 2009-2013. | ||||||||||
| 600 | 400 | $ | 19.53 | 1/5 of the SARs vest on April 15 of each of 2010-2014 | ||||||||||
| 334 | 166 | $ | 22.53 | 1/3 of the SARs vest on April 15 of each of 2011-2013. | ||||||||||
| 667 | 1,333 | $ | 23.21 | 1/3 of the SARs vest on April 15 of each of 2012-2014. | ||||||||||
| Hessam Nadji |
1,180 | — | $ | 19.78 | ||||||||||
| 1,350 | — | $ | 21.96 | |||||||||||
| 637 | 318 | $ | 22.53 | 1/3 of the SARs vest on April 15 of each of 2011-2013. | ||||||||||
| (3) | The following table reflects the breakout of the items included in the “All Other Compensation” column: |
| Kerin | Berman | Nadji | ||||||||||
| Auto Benefit |
$ | 25,208 | $ | 24,440 | $ | 25,539 | ||||||
| Health Insurance |
10,528 | 5,279 | 16,109 | |||||||||
| Life Insurance |
288 | 288 | 288 | |||||||||
|
|
|
|
|
|
|
|||||||
| Total |
$ | 36,024 | $ | 30,007 | $ | 41,936 | ||||||
|
|
|
|
|
|
|
|||||||
Outstanding Equity Awards at Fiscal Year End
The following table shows all outstanding equity awards held by each of our named executive officers at December 31, 2012.
| Option Awards | Stock Awards | |||||||||||||||||||||||||
| Name |
Number of Securities Underlying Unexercised Options (#) Exercisable |
Number of Securities Underlying Unexercised Options (#) Unexercisable |
Equity Incentive Plan Awards: Number of Securities Underlying Unexercised Unearned Options (#) |
Option Exercise Price ($) |
Option Expiration Date |
Number of Shares or Units of Stock That Have Not Vested (#) |
Market Value of Shares or Units of Stock That Have Not Vested ($) (1) |
Equity Incentive Plan Awards: Number of Unearned Shares, Units or Other Rights That Have Not Vested (#) |
Equity Incentive Plan Awards: Market or Payout Value of Unearned Shares, Units or Other Rights That Have Not Vested ($) |
|||||||||||||||||
| John J. Kerin |
925 | (2) | $ | 237,884 | — | — | ||||||||||||||||||||
| Gene A. Berman |
200 | (3) | $ | 47,960 | — | — | ||||||||||||||||||||
| 400 | (4) | $ | 89,423 | — | — | |||||||||||||||||||||
| 166 | (5) | $ | 42,690 | — | — | |||||||||||||||||||||
| 1,333 | (6) | $ | 278,396 | — | — | |||||||||||||||||||||
| Hessam Nadji |
318 | (7) | $ | 81,779 | — | — | ||||||||||||||||||||
| (1) | Amounts listed are unvested amounts calculated according to underlying shareholder documents. |
80
Table of Contents
| (2) | The awards were granted on July 1, 2010 and 1/3 of the shares subject to the award vest on April 15 of each of 2011–2013. |
| (3) | The awards were granted on September 1, 2008 and 1/5 of the shares subject to the award vest on April 15 of each of 2009–2013. |
| (4) | The awards were granted on April 1, 2009 and 1/5 of the shares subject to the award vest on April 15 of each of 2010–2014. |
| (5) | The awards were granted on January 18, 2011 and 1/3 of the shares subject to the award vest on April 15 of each of 2011–2013. |
| (6) | The awards were granted on July 28, 2011 and 1/3 of the shares subject to the awards vest on April 15 of each of 2012–2014 |
| (7) | The awards were granted on January 18, 2011 and 1/3 of the shares subject to the award vest on April 15 of each of 2011–2013. |
Employment Agreement with John J. Kerin
We entered into an employment agreement with John J. Kerin, our President and Chief Executive Officer, dated as of July 1, 2010, as amended. The employment agreement has no specific term and constitutes at-will employment. In addition to a current annual base salary of $400,000, Mr. Kerin is eligible to receive an annual discretionary incentive of up to 4% of our fiscal year-end pre-tax profit, up to a maximum of four times the base salary actually paid to Mr. Kerin during the fiscal year. Mr. Kerin also received 2,775 options and 2,775 SARs, one third of each vesting annually, beginning on April 15, 2011. The employment agreement also contains non-competition and non-disclosure provisions.
2013 Omnibus Equity Incentive Plan
The 2013 Omnibus Equity Incentive Plan, or the 2013 Plan, will become effective following our initial public offering. The 2013 Plan will provide for the grant of incentive stock options, within the meaning of Section 422 of the Code, to our employees and any of our subsidiary corporations’ employees, and for the grant of nonstatutory stock options, stock appreciation rights, restricted stock, restricted stock units, performance units and performance shares to our employees, independent contractors, directors and consultants and our subsidiary corporations’ employees and consultants.
The following is a summary of terms of the 2013 Plan.
Authorized Shares. The maximum aggregate number of shares that may be issued under the 2013 Plan is shares of our common stock. In addition, the number of shares available for issuance under the 2013 Plan will be annually increased on the first day of each of our fiscal years beginning with the 2015 fiscal year, by an amount equal to the least of:
| • | shares of our common stock; |
| • | 3% of the outstanding shares of our common stock as of the last day of the immediately preceding fiscal year; and |
| • | such other amount as our board of directors may determine. |
Shares issued pursuant to awards under the 2013 Plan that we repurchase or that are otherwise forfeited will become available for future grant under the 2013 Plan on the same basis as the award initially counted against the share reserve. In addition, to the extent that an award is paid out in cash rather than shares, such cash payment will not reduce the number of shares available for issuance under the 2013 Plan.
Award Limitations. The following limits apply to any awards granted under the 2013 Plan:
| • | Options and stock appreciation rights—no employee or independent contractor shall be granted within any fiscal year one or more options or stock appreciation rights, which in the aggregate cover more than |
81
Table of Contents
| 500,000 shares; provided, however, that in connection with an employee or independent contractor’s initial service as an employee or independent contractor, an employee or independent contractor’s aggregate limit may be increased by 1,000,000 shares; |
| • | Restricted stock and restricted stock units—no employee or independent contractor shall be granted within any fiscal year one or more awards of restricted stock or restricted stock units, which in the aggregate cover more than 500,000 shares; provided, however, that in connection with an employee or independent contractor’s initial service as an employee or independent contractor, an employee or independent contractor’s aggregate limit may be increased by 1,000,000 shares; and |
| • | Performance units and performance shares—no employee or independent contractor shall receive performance units or performance shares having a grant date value (assuming maximum payout) greater than $2 million dollars or covering more than 500,000 shares, whichever is greater; provided, however, that in connection with an employee or independent contractor’s initial service as an employee or independent contractor, an employee or independent contractor may receive performance units or performance shares having a grant date value (assuming maximum payout) of up to an additional amount equal to $5 million dollars or covering up to 1,000,000 shares, whichever is greater. An individual may only have one award of performance units or performance shares for a performance period. |
Plan Administration. The 2013 Plan will be administered by the Board, which, at its discretion or as legally required, may delegate such administration to the compensation committee and/or one or more additional committees. In the case of awards intended to qualify as “performance-based compensation” within the meaning of Code Section 162(m), the compensation committee will consist of two or more “outside directors” within the meaning of Code Section 162(m).
Subject to the provisions of the 2013 Plan, the administrator has the power to determine the terms of awards, including the recipients, the exercise price, if any, the number of shares subject to each award, the fair market value of a share of our common stock, the vesting schedule applicable to the awards, together with any vesting acceleration, and the form of consideration, if any, payable upon exercise of the award and the terms of the award agreement for use under the 2013 Plan. The administrator also has the authority, subject to the terms of the 2013 Plan, to amend existing awards, to prescribe rules and to construe and interpret the 2013 Plan and awards granted thereunder.
Stock Options. The administrator may grant incentive and/or nonstatutory stock options under the 2013 Plan; provided that incentive stock options are only granted to employees. The exercise price of such options must equal at least the fair market value of our common stock on the date of grant. The term of an option may not exceed years; provided, however, that an incentive stock option held by a participant who owns more than 10% of the total combined voting power of all classes of our stock, or any related corporations, may not have a term in excess of 5 years and must have an exercise price of at least 110% of the fair market value of our common stock on the grant date. The administrator will determine the methods of payment of the exercise price of an option, which may include cash, shares or other property acceptable to the administrator. Subject to the provisions of the 2013 Plan, the administrator determines the remaining terms of the options (e.g., vesting). After the termination of service of an employee, independent contractor, director or consultant, the participant may exercise his or her option, to the extent vested as of such date of termination, for the period of time stated in his or her option agreement. Generally, if termination is due to death or disability, the option will remain exercisable for twelve months. In all other cases, the option will generally remain exercisable for three months following the termination of service. However, in no event may an option be exercised later than the expiration of its term.
Stock Appreciation Rights. Stock appreciation rights may be granted under the 2013 Plan. Stock appreciation rights allow the recipient to receive the appreciation in the fair market value of our common stock between the exercise date and the date of grant. Subject to the provisions of the 2013 Plan, the administrator determines the terms of stock appreciation rights, including when such rights vest and become exercisable and whether to settle such awards in cash or with shares of our common stock, or a combination thereof, except that the per share exercise price for the shares to be issued pursuant to the exercise of a stock appreciation right will be no less than 100% of the fair market value per share on the date of grant. The specific terms will be set forth in an award agreement.
82
Table of Contents
Restricted Stock. Restricted stock may be granted under the 2013 Plan. Restricted stock awards are grants of shares of our common stock that are subject to various restrictions, including restrictions on transferability and forfeiture provisions. Shares of restricted stock will vest and the restrictions on such shares will lapse, in accordance with terms and conditions established by the administrator. Such terms may include, among other things, vesting upon the achievement of specific performance goals determined by the administrator and/or continued service. The administrator, in its sole discretion, may accelerate the time at which any restrictions will lapse or be removed. Recipients of restricted stock awards generally will have voting and cash dividend rights with respect to such shares upon grant without regard to vesting, unless the administrator provides otherwise. Shares of restricted stock that do not vest for any reason will be forfeited by the recipient and will revert to us. The specific terms will be set forth in an award agreement.
Restricted Stock Units. Restricted stock units may be granted under the 2013 Plan, which may include deferred stock units and the right to dividend equivalents, as determined in the discretion of the administrator. Each restricted stock unit granted is a bookkeeping entry representing an amount equal to the fair market value of one share of our common stock. The administrator determines the terms and conditions of restricted stock units including the vesting criteria, which may include achievement of specified performance criteria or continued service, and the form and timing of payment. The administrator, in its sole discretion, may accelerate the time at which any restrictions will lapse or be removed. The administrator determines in its sole discretion whether an award will be settled in stock, cash or a combination of both. The specific terms will be set forth in an award agreement.
Performance Units / Performance Shares. Performance units and performance shares may be granted under the 2013 Plan. Performance units and performance shares are awards that will result in a payment to a participant only if performance goals established by the administrator are achieved and any other applicable vesting provisions are satisfied. The administrator will establish organizational or individual performance goals in its discretion, which, depending on the extent to which they are met, will determine the number and/or the value of performance units and performance shares to be paid out to participants. For purposes of such awards, the performance goals may be one or more of the following, as determined by the administrator: (i) sales or non-sales revenue; (ii) return on revenues; (iii) operating income; (iv) income or earnings including operating income; (v) income or earnings before or after taxes, interest, depreciation and/or amortization; (vi) income or earnings from continuing operations; (vii) net income; (viii) pre-tax income or after-tax income; (ix) net income excluding amortization of intangible assets, depreciation and impairment of goodwill and intangible assets and/or excluding charges attributable to the adoption of new accounting pronouncements; (x) raising of financing or fundraising; (xi) project financing; (xii) revenue backlog; (xiii) power purchase agreement backlog; (xiv) gross margin; (xv) operating margin or profit margin; (xvi) capital expenditures, cost targets, reductions and savings and expense management; (xvii) return on assets (gross or net), return on investment, return on capital, or return on shareholder equity; (xviii) cash flow, free cash flow, cash flow return on investment (discounted or otherwise), net cash provided by operations, or cash flow in excess of cost of capital; (xix) performance warranty and/or guarantee claims; (xx) stock price or total stockholder return; (xxi) earnings or book value per share (basic or diluted); (xxii) economic value created; (xxiii) pre-tax profit or after-tax profit; (xxiv) strategic business criteria, consisting of one or more objectives based on meeting specified market penetration or market share, geographic business expansion, objective customer satisfaction or information technology goals; (xxv) objective goals relating to divestitures, joint ventures, mergers, acquisitions and similar transactions; (xxvi) construction projects consisting of one or more objectives based upon meeting project completion timing milestones, project budget, site acquisition, site development, or site equipment functionality; (xxvii) objective goals relating to staff management, results from staff attitude and/or opinion surveys, staff satisfaction scores, staff safety, staff accident and/or injury rates, headcount, performance management, completion of critical staff training initiatives; (xxviii) objective goals relating to projects, including project completion timing milestones, project budget; (xxix) key regulatory objectives; and (xxx) enterprise resource planning. After the grant of a performance unit or performance share, the administrator, in its sole discretion, may reduce or waive any performance objectives or other vesting provisions for such performance units or performance shares. Performance units shall have an initial dollar value established by the administrator prior to the grant date. Performance shares shall have an initial value equal to the fair market value of our common stock on the grant date. The administrator, in its sole discretion, may pay earned performance units or performance shares in the form of cash, in shares or in some combination thereof. The specific terms will be set forth in an award agreement.
83
Table of Contents
Transferability of Awards. Unless the administrator provides otherwise, the 2013 Plan generally does not allow for the transfer of awards and only the recipient of an option or stock appreciation right may exercise such an award during his or her lifetime.
Certain Adjustments. In the event of certain corporate events or changes in our capitalization, to prevent diminution or enlargement of the benefits or potential benefits available under the 2013 Plan, the administrator will make adjustments to one or more of the number and class of shares that may be delivered under the 2013 Plan and/or the number, class and price of shares covered by each outstanding award and the numerical share limits contained in the 2013 Plan. In the event of a proposed winding up, liquidation or dissolution of the company, the administrator will notify participants as soon as practicable and all awards will terminate immediately prior to the consummation of such proposed transaction.
Merger or Change in Control. The 2013 Plan provides that in the event of a merger or change in control (other than a winding up, dissolution or liquidation), as defined under the 2013 Plan, each outstanding award will be treated as the administrator determines (including assumed, substituted or cancelled), except that if a successor corporation or its parent or subsidiary does not assume or substitute an equivalent award for any outstanding award, then such award will fully vest, all restrictions on such award will lapse, all performance goals or other vesting criteria applicable to such award will be deemed achieved at 100% of target levels and such award will become fully exercisable, if applicable, for a specified period prior to the transaction. The award will then terminate upon the expiration of the specified period of time.
Plan Amendment, Termination. The Board has the authority to amend, suspend or terminate the 2013 Plan provided such action does not impair the existing rights of any participant. The 2013 Plan will automatically terminate in 2023 unless we terminate it sooner.
2013 Employee Stock Purchase Plan
The 2013 Employee Stock Purchase Plan, or the ESPP, is planned to become effective following our initial public offering. The ESPP will provide for participation by our executive officers and all other employees. In general, we intend to make offerings under the ESPP that qualify under Section 423 of the Code, but may make offerings that are not intended to qualify under Section 423 of the Code to the extent deemed advisable for designated subsidiaries outside the United States. Additionally, we may make separate offerings under the ESPP, each of which may have different terms, but each separate offering will be intended to comply with the requirements of Section 423 of the Code. The following summary of terms of the ESPP is based on the terms of the ESPP as approved by the Board, but the terms are not final until approved by the stockholders.
A total of shares of our common stock will be made available for sale under the ESPP. In addition, the ESPP will provide for annual increases in the number of shares available for issuance under the ESPP on the first day of each fiscal year beginning with the 2015 fiscal year, equal to the least of:
| • | shares of our common stock; |
| • | 1% of the outstanding shares of our common stock on the first day of such fiscal year; and |
| • | such other amount as the Board may determine. |
The Board or its committee has full and exclusive authority to interpret the terms of the ESPP and determine eligibility.
All of our employees are eligible to participate if they are customarily employed by us or any participating subsidiary for more than 20 hours per week and more than 5 months in any calendar year. However, an employee may not be granted rights to purchase stock under the ESPP if such employee:
| • | immediately after the grant would own stock possessing 5% or more of the total combined voting power or value of all classes of our capital stock; or |
| • | holds rights to purchase stock under all our employee stock purchase plans that would accrue at a rate that exceeds $25,000 worth of our stock for each calendar year. |
84
Table of Contents
The ESPP is intended to qualify under Section 423 of the Code and provides for consecutive, non-overlapping 6-month offering periods. The offering periods generally start on the first trading day on or after May 15 and November 15 of each year. The first offering period will commence on the first trading day on or after the May 15 or November 15 so designated as the start of the first offering period by the administrator. The administrator may, in its discretion, modify the terms of future offering periods.
The ESPP permits participants to purchase common stock through payroll deductions of up to 15% of their eligible compensation, which includes a participant’s regular and recurring straight time gross earnings, payments for overtime and shift premium, exclusive of payments for incentive compensation, bonuses and other similar compensation. A participant may purchase a maximum of 1,250 shares of common stock during each 6-month offering period.
Amounts deducted and accumulated by the participant are used to purchase shares of our common stock at the end of each 6-month offering period. The purchase price of the shares will initially be 85% of the lower of the fair market value of our common stock on the first trading day of the offering period or on the last day of the offering period; provided, however, the administrator may reduce the discount prior to the commencement of any offering period. Participants may end their participation at any time during an offering period and will be paid their accrued payroll deductions that have not yet been used to purchase shares of common stock. Participation ends automatically upon termination of employment with us or any subsidiary corporation.
A participant may not transfer rights granted under the ESPP other than by will, the laws of descent and distribution or as otherwise provided under the ESPP.
In the event of a merger or change of control, as defined under the ESPP, a successor corporation may assume or substitute each outstanding purchase right. If the successor corporation refuses to assume or substitute for the outstanding purchase rights, the offering period then in progress will be shortened, and a new exercise date will be set. The plan administrator will notify each participant in writing that the exercise date has been changed and that the participant’s option will be exercised automatically on the new exercise date unless the participant has already withdrawn from the offering period.
The ESPP will automatically terminate in 2023, unless we terminate it sooner. In addition, the Board has the authority to amend, suspend or terminate the ESPP, except that, subject to certain exceptions described in the ESPP, no such action may adversely affect any outstanding rights to purchase stock under the ESPP.
Limitation of Liability and Indemnification Matters
Our amended and restated certificate of incorporation, which will be in effect upon the completion of this offering, contains provisions that limit the liability of our directors for monetary damages to the fullest extent permitted by Delaware law. Consequently, our directors will not be personally liable to us or our stockholders for monetary damages for any breach of fiduciary duties as directors, except liability for:
| • | any breach of the director’s duty of loyalty to us or our stockholders; |
| • | any act or omission not in good faith or that involves intentional misconduct or a knowing violation of law; |
| • | unlawful payments of dividends or unlawful stock repurchases or redemptions as provided in Section 174 of the Delaware General Corporation Law; or |
| • | any transaction from which the director derived an improper personal benefit. |
Our amended and restated certificate of incorporation and amended and restated bylaws to be in effect upon the completion of this offering provide that we are required to indemnify our directors and officers, in each case to the fullest extent permitted by Delaware law. Our amended and restated bylaws also provide that we are obligated to advance expenses incurred by a director or officer in advance of the final disposition of any action or proceeding, and permit us to secure insurance on behalf of any officer, director, employee or other agent for any liability arising out of his or her actions in that capacity regardless of whether we would otherwise be permitted to indemnify him or her under the provisions of Delaware law. We expect to enter into agreements to indemnify
85
Table of Contents
our directors, executive officers and other employees as determined by our board of directors. With specified exceptions, these agreements will provide for indemnification for related expenses including, among other things, attorneys’ fees, judgments, fines and settlement amounts incurred by any of these individuals in any action or proceeding. We believe that these bylaw provisions and indemnification agreements are necessary to attract and retain qualified persons as directors and officers. We also maintain directors’ and officers’ liability insurance.
The limitation of liability and indemnification provisions in our amended and restated certificate of incorporation and amended and restated bylaws may discourage stockholders from bringing a lawsuit against our directors and officers for breach of their fiduciary duty. They may also reduce the likelihood of derivative litigation against our directors and officers, even though an action, if successful, might benefit us and other stockholders. Further, a stockholder’s investment may be adversely affected to the extent that we pay the costs of settlement and damage awards against directors and officers as required by these indemnification provisions. At present, there is no pending litigation or proceeding involving any of our directors, officers or employees for which indemnification is sought, and we are not aware of any threatened litigation that may result in claims for indemnification.
86
Table of Contents
PRINCIPAL AND SELLING STOCKHOLDERS
The following table sets forth information regarding the beneficial ownership of our common stock as of , 2013 and as adjusted to reflect the sale of the common stock offered by us under this prospectus by:
| • | each of our directors, director nominees and named executive officers; |
| • | all directors, director nominees and executive officers as a group; |
| • | each person who is known to own beneficially more than 5% of our common stock; and |
| • | each of the selling stockholders. |
In accordance with SEC rules, each listed person’s beneficial ownership includes:
| • | all shares the stockholder actually owns beneficially or of record; |
| • | all shares over which the stockholder has or shares voting or investment power; and |
| • | all shares the stockholder has the right to acquire within 60 days. |
MMC will exchange a portion of the shares of our common stock it owns for indebtedness of MMC held by some of MMC’s former and current stockholders, which we refer to, in such role, as the debt-for-equity exchange parties. The debt-for-equity exchange parties will then sell the shares to the underwriters for cash as selling stockholders in this offering. This debt-for-equity exchange will occur on the settlement date of this offering immediately prior to the settlement of the debt-for-equity exchange parties’ sale of the shares to the underwriters. See “Underwriting—The Debt-for-Equity Exchange.”
Unless otherwise indicated, all shares are or will be owned directly, and the indicated person has or will have sole voting and investment power. Except as otherwise noted, the address of each person listed in the table is c/o Marcus & Millichap, Inc., 23975 Park Sorrento, Suite 400, Calabasas, California 91302.
The applicable percentage of ownership for each stockholder is based on shares of common stock outstanding as of , 2013. The amounts in the table do not include DSUs to be issued to executive officers and certain of the other selling stockholders in connection with this offering since the shares issuable upon settlement of the DSUs cannot be received within 60 days from , 2013. See “Certain Relationships and Related Transactions” for more information about the DSUs to be granted to our named executive officers and Mr. Millichap.
| Shares Beneficially Owned Prior to Offering(1) |
Number of Shares |
Shares Beneficially Owned After Offering(2) |
||||||||||||
| Name and Address |
Number | Percent | Offered | Number | Percent | |||||||||
| Selling Stockholders |
||||||||||||||
| George M. Marcus(3) |
% | % | ||||||||||||
| William A. Millichap(4) |
% | % | ||||||||||||
| Donald A. Lorenz and related entities(5) |
% | % | ||||||||||||
| The Lucas Family Trust, dated |
% | % | ||||||||||||
| The Kerin Family Trust dated |
% | % | ||||||||||||
| Hessam Nadji |
% | % | ||||||||||||
| Paul S. Mudrich |
||||||||||||||
| Gene Allen Berman, Trustee |
% | % | ||||||||||||
| Alan L. and Pamela J. Pontius |
% | % | ||||||||||||
| The William E. Hughes, Jr., |
% | % | ||||||||||||
| Steven R. Chaben |
% | % | ||||||||||||
| Kent R. Williams |
% | % | ||||||||||||
| Martin E. Louie |
% | % | ||||||||||||
87
Table of Contents
| Shares Beneficially Owned Prior to Offering(1) |
Number of Shares |
Shares Beneficially Owned After Offering(2) |
||||||||||||
| Name and Address |
Number | Percent | Offered | Number | Percent | |||||||||
| Directors, Director Nominees and Executive Officers |
||||||||||||||
| John J. Kerin(7) |
% | % | ||||||||||||
| Gene A. Berman(8) |
% | % | ||||||||||||
| Hessam Nadji |
% | % | ||||||||||||
| George M. Marcus(3) |
% | % | ||||||||||||
| William A. Millichap(4) |
* | % | ||||||||||||
| Norma J. Lawrence |
% | % | ||||||||||||
| George T. Shaheen |
% | % | ||||||||||||
| Don C. Watters |
% | % | ||||||||||||
| Nicholas F. McClanahan |
% | % | ||||||||||||
| All directors, director nominees and executive officers as a group (11 persons) |
% | % | ||||||||||||
| * | Less than one percent of the outstanding shares of common stock. |
| (1) | Reflects shares owned after the Spin-Off. |
| (2) | Assumes the issuance of shares offered hereby. Does not include any shares that may be issued pursuant to the underwriters’ option to purchase additional shares. |
| (3) | Comprised of shares acquired from MMC in exchange for an aggregate of approximately $ million of outstanding indebtedness of MMC (based on the midpoint of the price range on the cover of this prospectus) pursuant to the Debt-for-Equity Exchange. |
| (4) | Comprised of shares acquired from MMC in exchange for an aggregate of approximately $ million of outstanding indebtedness of MMC (based on the midpoint of the price range on the cover of this prospectus) pursuant to the Debt-for-Equity Exchange. |
| (5) | Comprised of (i) shares of common stock held by The Donald and Beverly Lorenz Living Trust for which Mr. Lorenz shares voting and dispositive power, (ii) shares of common stock held by the Donald A. Lorenz 2012 Dynasty Trust for which Mr. Lorenz has voting and dispositive power, (iii) shares of common stock held by the Beverly J. Lorenz 2012 Dynasty Trust for which Beverly J. Lorenz, Mr. Lorenz’s spouse, has voting and dispositive power, and (iv) shares of common stock held by Lorenz Capital Assets. L.P. for which Mr. Lorenz has voting and dispositive power. Such shares were acquired from MMC in exchange for an aggregate of approximately $ million of outstanding indebtedness of MMC (based on the midpoint of the price range on the cover of this prospectus) pursuant to the Debt-for-Equity Exchange. |
| (6) | Voting and investment power over the shares held by The Lucas Family Trust, dated November 10, 2006 is exercised by Mr. Gary R. and Mrs. Susanne Yeung Lucas, its co-trustees. |
| (7) | Voting and investment power over the shares held by The Kerin Family Trust dated January 5, 2001 is exercised by Mr. John J. and Mrs. Mary Kerin, its co-trustees. |
| (8) | Voting and investment power over the shares held by the Gene Allen Berman Trust Dated 5/9/06 is exercised by Mr. Gene Allen Berman, its trustee. |
| (9) | Voting and investment power over the shares held by the Alan L. and Pamela J. Pontius Revocable Intervivos Trust Dated September 22, 1999 is exercised by Mr. and Mrs. Pontius, its co-trustees. |
| (10) | Voting and investment power over the shares held by the The William E. Hughes, Jr., Revocable Trust Dated August 26, 2005 is exercised by Mr. William E. Hughes, Jr., its trustee. |
88
Table of Contents
CERTAIN RELATIONSHIPS AND RELATED TRANSACTIONS
Relationship with Marcus & Millichap Company
The following are certain related party transactions between MMC and us. Prior to the Spin-Off, MMC is our majority shareholder and is controlled by George M. Marcus, our co-Chairman. Under a shared services arrangement with MMC, MMC provides services and office space to us. In 2012, 2011 and 2010, we paid $770,119, $862,256 and $477,167, respectively, to MMC pursuant to this arrangement. This arrangement will be replaced by a transition services agreement between us and MMC to become effective upon the completion of this offering. The transition services agreement will grant us the right to continue to use some of MMC’s services and resources related to our corporate functions, including employee benefits administration, corporate legal services, and accounting systems management. We will pay MMC mutually agreed-upon fees for these services, which will be based on MMC’s costs of providing the transition services, without any markup. Under the agreement, we will be able to use MMC’s services for a fixed term established on a service-by-service basis, which may be extended by mutual written agreement. We may terminate the agreement or any of the specified services for any reason with 60 days prior written notice to MMC. We will not have any obligation to continue to use MMC’s services after the term. Generally, each party will indemnify the other party and their respective directors, officers, employees and agents against losses resulting from the transition services, except to the extent of the service provider’s gross negligence or intentional misconduct, not to exceed the amount of fees paid to the service provider.
MMC also procures insurance and other miscellaneous services for us. In 2012, 2011 and 2010, we paid $3,928,218, $3,643,853 and $3,726,976, respectively. We will procure our own insurance and these other services directly upon the completion of this offering.
We occasionally represent MMC or its affiliates in sales and financing transactions and receive commissions and financing fees from MMC or its affiliates for these transactions. In 2012, 2011, and 2010, MMC and its affiliates paid us $426,291, $321,591, and $606,481, respectively, in real estate brokerage commissions and financing fees, net of expenses.
We lease our office in Palo Alto, covering approximately 12,000 square feet, from MMC under a lease that expires in April 2015. In 2012, 2011 and 2010, we paid $277,980, $277,980 and $278,756, respectively, to MMC under this lease.
In September 2011, we and some of our subsidiaries entered into a guaranty in connection with a credit agreement by and among MMC and various financial institutions. As guarantors, we have unconditionally guaranteed the payment and performance of the obligations of MMC and related expenses. We expect to be released from the guaranty in connection with the Spin-Off and this offering.
In connection with the Spin-Off, we will enter into a contribution agreement with the shareholders of MMREIS, including MMC, the majority shareholder of MMREIS. Pursuant to the contribution agreement, MMC will contribute its approximately 88% interest in the MMREIS common stock and 100% of the MMREIS preferred stock to us, and the remaining MMREIS shareholders will contribute all of their shares of MMREIS common stock, constituting all of the outstanding capital stock of MMREIS, to us, in exchange for shares of our common stock. As a result, MMREIS will become our wholly owned subsidiary. MMC and the other MMREIS shareholders will provide customary representations and warranties regarding authority, ownership of shares, accredited investor status and securities laws compliance.
Tax matters agreement
Allocation of taxes. We intend to enter into a tax matters agreement with MMC immediately prior to the completion of this offering that will govern the parties’ respective rights, responsibilities and obligations with respect to tax liabilities and benefits, tax attributes, the preparation and filing of tax returns, the control of audits and other tax proceedings and other matters regarding taxes. In general, under the agreement:
| • | MMC will be responsible for all income taxes of the MMC affiliated group (and any related interest, penalties or audit adjustments and including those taxes attributable to our business) allocable to any tax |
89
Table of Contents
| period ending on or before the last date on which we qualify as a member of the affiliated group (as defined in Section 1504 of the Code) of which MMC is the common parent (the “Deconsolidation Date”) (or the portion of a period before the Deconsolidation Date in the case of a tax period beginning before and ending after the Deconsolidation Date). In this regard, MMC will be responsible for any income taxes resulting from gain from any deferred intercompany transactions or excess loss account that arises as a result of the Distribution. MMC and its subsidiaries other than us and our subsidiaries will be responsible for all taxes other than income taxes that they incur for all periods. |
| • | We will be responsible for income taxes (and any related interest, penalties or audit adjustments) attributable to us and our subsidiaries for any tax period beginning after the Deconsolidation Date (or the portion of a period after the Deconsolidation Date in the case of a tax period beginning before and ending after the Deconsolidation Date). We and our subsidiaries will also be responsible for all taxes other than income taxes that we incur for all periods. |
We and MMC are required to cooperate in good faith in apportioning any tax attributes between us and MMC. We will not make payments to MMC, and MMC will not make payments to us, in consideration for such tax attributes.
MMC will be responsible for preparing and filing any income tax returns with respect to the MMC affiliated group, including us and our subsidiaries, for periods through the Deconsolidation Date. We will be responsible for preparing and filing any income tax returns with respect to our affiliated group for any tax period beginning after the Deconsolidation Date and for tax returns other than income tax returns for all periods.
MMC will generally have exclusive authority to control tax contests related to any income tax returns covering periods prior to the Deconsolidation Date. We will have exclusive authority to control tax contests with respect to tax returns relating to taxes for which we or our subsidiaries have the payment responsibility under the agreement.
Preservation of the tax-free status of the MMC Contribution, the Debt-for-Equity Exchange and the Distribution. We and MMC intend that MMC’s contribution of its MMREIS common stock and preferred stock to us, which we refer to as the MMC Contribution, the Debt-for-Equity Exchange and the Distribution will qualify as a “reorganization” pursuant to which no gain or loss will be recognized by us, MMC, or the MMC shareholders for federal income tax purposes under Sections 355, 368(a)(1)(D) and related provisions of the Code.
MMC has received a private letter ruling from the IRS to the effect that, among other things, the MMC Contribution, the Debt-for-Equity Exchange and the Distribution will qualify as a transaction that is tax-free for U.S. federal income tax purposes under Sections 355, 368(a)(1)(D) and related provisions of the Code. In addition, MMC will receive an opinion of counsel regarding the tax-free status of these transactions.
We and MMC will be prohibited from taking any action, or failing to take any action, (i) where such action or failure to act is inconsistent with any representation made in obtaining the IRS private letter ruling or the opinion of counsel referred to above or (ii) which adversely affects or could reasonably be expected to adversely affect the tax-free status of the MMC Contribution, the Debt-for-Equity Exchange or the Distribution. In addition, during the time period ending two years after the date of the Distribution, we and MMC and our respective affiliates will be precluded from ceasing to be engaged in the active trades or businesses relied upon in obtaining the IRS private letter ruling. During this same period we will be precluded from taking any action or actions which, in the aggregate, have the effect of causing or permitting one or more persons to acquire a fifty percent or greater interest in us, as determined under Section 355 of the Code (unless we obtain a letter ruling from the IRS or an opinion of counsel acceptable to MMC that such actions will not affect the tax-free treatment of the MMC Contribution, the Debt-for-Equity Exchange or the Distribution). This last-mentioned restriction could have the effect of precluding us from undertaking stock issuances or acquisitions that would otherwise be advantageous to us and our stockholders.
We will agree to indemnify MMC and its affiliates against any and all tax-related liabilities incurred by them relating to the MMC Contribution, the Debt-for-Equity Exchange or the Distribution to the extent caused by
90
Table of Contents
a breach of our tax-related restrictions described in the preceding paragraph. This indemnification provision will apply even if MMC has permitted us to take an action that would otherwise have been prohibited under such restrictions. Likewise, MMC will indemnify us and our affiliates against all tax-related liabilities incurred by us or our affiliates relating to the MMC Contribution, the Debt-for-Equity Exchange or the Distribution to the extent caused by a breach of MMC’s tax-related restrictions.
Separation agreement
We intend to enter into a separation agreement with MMC immediately prior to the completion of this offering that will govern the relationship between MMC and us following this offering.
Transfer of Equity Interests and Cooperation. The separation agreement provides that, prior to the Distribution, we and MMC must cooperate and take all actions required to carry out the intent of the Contribution and the Distribution.
Further assurances. Each of the parties will agree to cooperate with the other party and use commercially reasonable best efforts to take or to cause to be taken all actions, and to do, or to cause to be done, all things reasonably necessary, proper or advisable under applicable law, regulations and agreements to consummate and make effective the transactions contemplated by the separation agreement.
Indemnification. Generally, each party will indemnify, defend and hold harmless the other party and its subsidiaries (and each of their affiliates) and their respective officers, employees and agents from and against any and all losses relating to, arising out of or resulting from: (i) liabilities assumed by the indemnifying party and (ii) any breach by the indemnifying party or its subsidiaries of the separation agreement and the other agreements described in this section (unless such agreement provides for separate indemnification). The separation agreement also specifies procedures with respect to claims subject to indemnification.
Mutual releases. Generally, each of MMC and us will release the other party from any and all liabilities. The liabilities released include liabilities arising under any contract or agreement, existing or arising from any acts or events occurring or failing to occur or any conditions existing before the completion of this offering.
Insurance. Our directors and officers will obtain coverage under a directors’ and officers’ insurance program to be established by us at our expense and will not continue to be covered under MMC’s existing insurance program after such time. After the expiration of the current policies, we will arrange for our own insurance policies and will not benefit from any of MMC’s or its affiliates’ insurance policies that may provide any such coverage. The agreement will also set forth procedures for the administration of insured claims and will allocate the right to claim coverage and control over the prosecution and defense of claims.
Term. Following the completion of this offering, the separation agreement will continue unless terminated by us and MMC.
Agreements with Management
Buy-Sell Agreements
We have entered into buy-sell agreements with each of our executive officers—John J. Kerin, Martin E. Louie, Gene A. Berman, William E. Hughes, and Hessam Nadji. These buy-sell agreements restrict the executive officers’ rights to transfer or dispose of their shares by requiring the company’s prior written consent. Under the agreements, we have a right of first offer to purchase the shares. If the executive officers terminate their employment for reasons other than death, disability or by mutual agreement, they are required to sell all shares of our stock they hold, though we are not required to purchase such shares. The buy-sell agreements also contain certain covenants, including non-solicitation and non-competition provisions restricting the executive officers for
91
Table of Contents
three years after any repurchase of shares they hold. The buy-sell agreements will be terminated upon the consummation of this offering and the executive officer’s execution of the sale restriction agreement in the form filed as an exhibit to the registration statement of which this prospectus is a part.
Compensation Arrangements with Management
For information about compensation arrangements with our management, see “Management—Executive Compensation.”
IPO Related Equity Grants
In conjunction with this offering, the vesting of all unvested restricted stock and all unvested SARs, including those held by our executive officers, will be accelerated. The SARs will be frozen at the liability amount calculated as of March 31, 2013, which will be paid out to each executive officer in installments upon retirement or departure under the terms of the existing program. The frozen SAR account balance will be credited with interest on an annual basis. To replace the beneficial ownership in the SARs, the difference between the book value liability and the fair value of the awards, which will be based on our enterprise value as of the effectiveness of this offering, will be granted to the executive officers effective upon the closing of this offering, in the form of deferred stock units, or DSUs.
We intend to grant our executive officers DSUs as follows: DSUs with a cash value of $ million to John J. Kerin; DSUs with a cash value of $ million to Martin E. Louie; DSUs with a cash value of $ million to Gene A. Berman; DSUs with a cash value of $ million to William E. Hughes; and DSUs with a cash value of $ million to Hessam Nadji. The DSUs will be fully vested upon receipt but will be settled in actual stock at a rate of 20% per year if the executive officer remains employed by the company during that period (or otherwise all unsettled shares of stock upon termination of employment will be settled five years from the termination date). In addition, the formula settlement value of all outstanding shares of stock held by our executive officers will be removed, but all such shares of stock will be subject to sales restrictions that lapse at a rate of 20% per year for five years if the executive officer remains employed by the company. Additionally, in the event of death or termination of employment after reaching the age of 67, 100% of the DSUs will be settled and 100% of the shares of stock will be released from the resale restriction. Further, 100% of the shares of stock will be released from the resale restriction upon the consummation of a change of control of the company.
We also will grant DSUs with a cash value of $1 million to William A. Millichap, our Co-Chairman, effective as of the closing of this offering, which will be fully vested upon receipt but will be settled in actual stock at a rate of 20% per year.
Policies and Procedures for Related Party Transactions
Our board of directors intends to adopt a written related person transaction policy to set forth the policies and procedures for the review and approval or ratification of related person transactions. This policy will cover any transaction, arrangement or relationship, or any series of similar transactions, arrangements or relationships in which we were or are to be a participant, the amount involved exceeds $120,000 and a related person had or will have a direct or indirect material interest, including, without limitation, purchases of goods or services by or from the related person or entities in which the related person has a material interest, indebtedness, guarantees of indebtedness or employment by us of a related person.
92
Table of Contents
The following is a description of the material terms of our amended and restated certificate of incorporation and amended and restated bylaws as each will be in effect as of the completion of this offering, and of specific provisions of Delaware law. The following description is intended as a summary only and is qualified in its entirety by reference to our amended and restated certificate of incorporation, our amended and restated bylaws and the Delaware General Corporation Law, or DGCL.
General
Pursuant to our certificate of incorporation, our capital stock will consist of 175,000,000 authorized shares, of which 150,000,000 shares, par value $0.0001 per share, will be designated as “common stock,” and 25,000,000 shares, par value $0.0001 per share, will be designated as “preferred stock.” There will be no shares of preferred stock outstanding immediately following this offering. Upon the effectiveness of our amended and restated certificate of incorporation following the closing of this offering, we will only have one class of common stock.
Common Stock
Immediately prior to the completion of this offering, there will be shares of common stock outstanding, held of record by 11 stockholders. There will be shares of common stock outstanding (assuming no exercise of the underwriters’ option to purchase additional shares), after giving effect to the sale of the shares offered hereby.
The holders of common stock are entitled to one vote for each share held of record on all matters submitted to a vote of the stockholders. Subject to preferences that may be applicable to any outstanding preferred stock, holders of common stock are entitled to receive ratably such dividends as may be declared by the board of directors out of funds legally available for that purpose. See “Dividend Policy.” In the event of liquidation, dissolution or winding up of the company, the holders of common stock are entitled to share ratably in all assets remaining after payment of liabilities, subject to the prior distribution rights of any outstanding preferred stock. The common stock has no preemptive or conversion rights or other subscription rights. The outstanding shares of common stock are, and the shares of common stock to be issued upon completion of this offering will be, fully paid and non-assessable.
Preferred Stock
After the closing of this offering, the board of directors will have the authority, without further action by the stockholders, to issue up to 25,000,000 shares of preferred stock, $0.0001 par value per share, in one or more series. The board of directors will also have the authority to designate the rights, preferences, privileges and restrictions of each such series, including dividend rights, dividend rates, conversion rights, voting rights, terms of redemption, redemption prices, liquidation preferences and the number of shares constituting any series.
The issuance of preferred stock may have the effect of delaying, deferring or preventing a change in control of the company without further action by the stockholders. The issuance of preferred stock with voting and conversion rights may also adversely affect the voting power of the holders of common stock. In certain circumstances, an issuance of preferred stock could have the effect of decreasing the market price of the common stock. As of the closing of the offering, no shares of preferred stock will be outstanding. We currently have no plans to issue any shares of preferred stock.
Anti-Takeover Effects of Delaware Law and Our Certificate of Incorporation and Bylaws
Our amended and restated certificate of incorporation and our amended and restated bylaws, which will be in effect upon the completion of this offering, will contain certain provisions that could have the effect of delaying, deterring or preventing another party from acquiring control of us. These provisions and certain provisions of Delaware law, which are summarized below, are expected to discourage coercive takeover practices and inadequate takeover bids. These provisions are also designed, in part, to encourage persons seeking
93
Table of Contents
to acquire control of us to negotiate first with our board of directors. We believe that the benefits of increased protection of our potential ability to negotiate more favorable terms with an unfriendly or unsolicited acquirer outweigh the disadvantages of discouraging a proposal to acquire us.
Undesignated Preferred Stock
As discussed above, our board of directors will have the ability to issue preferred stock with voting or other rights or preferences that could impede the success of any attempt to change control of us. These and other provisions may have the effect of deterring hostile takeovers or delaying changes in control or management of our company.
Limits on Ability of Stockholders to Act by Written Consent or Call a Special Meeting
Our amended and restated certificate of incorporation will provide that our stockholders may not act by written consent, which may lengthen the amount of time required to take stockholder actions. As a result, a holder controlling a majority of our capital stock would not be able to amend our bylaws or remove directors without holding a meeting of our stockholders called in accordance with our bylaws.
In addition, our amended and restated bylaws will provide that special meetings of the stockholders may be called only by the chairperson of the board, the Chief Executive Officer or our board of directors. Stockholders may not call a special meeting, which may delay the ability of our stockholders to force consideration of a proposal or for holders controlling a majority of our capital stock to take any action, including the removal of directors.
Requirements for Advance Notification of Stockholder Nominations and Proposals
Our amended and restated bylaws will establish advance notice procedures with respect to stockholder proposals and the nomination of candidates for election as directors, other than nominations made by or at the direction of our board of directors or a committee of our board of directors. These provisions may have the effect of precluding the conduct of certain business at a meeting if the proper procedures are not followed. These provisions may also discourage or deter a potential acquirer from conducting a solicitation of proxies to elect the acquirer’s own slate of directors or otherwise attempting to obtain control of our company.
Board Classification
Upon the closing of the offering, our board of directors will be divided into three classes, one class of which is elected each year by our stockholders. The directors in each class will serve three-year terms. For more information on the classified board, see “Management—Board of Directors.” A third party may be discouraged from making a tender offer or otherwise attempting to obtain control of us as it is it more difficult and time-consuming for stockholders to replace a majority of the directors on a classified board.
No Cumulative Voting
Our amended and restated certificate of incorporation and amended and restated bylaws will not permit cumulative voting in the election of directors. Cumulative voting allows a stockholder to vote a portion or all of its shares for one or more candidates for seats on the board of directors. Without cumulative voting, a minority stockholder may not be able to gain as many seats on our board of directors as the stockholder would be able to gain if cumulative voting were permitted. The absence of cumulative voting makes it more difficult for a minority stockholder to gain a seat on our board of directors to influence our board’s decision regarding a takeover.
Amendment of Charter and Bylaws Provisions
The amendment of the above provisions of our amended and restated certificate of incorporation will require approval by holders of at least two thirds of our outstanding capital stock entitled to vote generally in the
94
Table of Contents
election of directors. The amendment of our bylaws will require approval by the holders of at least two thirds of our outstanding capital stock entitled to vote generally in the election of directors.
Delaware Anti-Takeover Statute
We are subject to the provisions of Section 203 of the DGCL regulating corporate takeovers. In general, Section 203 prohibits a publicly held Delaware corporation from engaging, under certain circumstances, in a business combination with an interested stockholder for a period of three years following the date the person became an interested stockholder unless:
| • | prior to the date of the transaction, our board of directors approved either the business combination or the transaction which resulted in the stockholder becoming an interested stockholder; |
| • | upon completion of the transaction that resulted in the stockholder becoming an interested stockholder, the interested stockholder owned at least 85% of the voting stock of the corporation outstanding at the time the transaction commenced, calculated as provided under Section 203; or |
| • | at or subsequent to the date of the transaction, the business combination is approved by our board of directors and authorized at an annual or special meeting of stockholders, and not by written consent, by the affirmative vote of at least two-thirds of the outstanding voting stock which is not owned by the interested stockholder. |
Generally, a business combination includes a merger, asset or stock sale, or other transaction resulting in a financial benefit to the interested stockholder. An interested stockholder is a person who, together with affiliates and associates, owns or, within three years prior to the determination of interested stockholder status, did own 15% or more of a corporation’s outstanding voting stock. We expect the existence of this provision to have an anti-takeover effect with respect to transactions our board of directors does not approve in advance. We anticipate that Section 203 may also discourage attempts that might result in a premium over the market price for the shares of common stock held by stockholders.
The provisions of Delaware law and the provisions of our amended and restated certificate of incorporation and amended and restated bylaws, as amended upon the completion of this offering, could have the effect of discouraging others from attempting hostile takeovers and, as a consequence, they might also inhibit temporary fluctuations in the market price of our common stock that often result from actual or rumored hostile takeover attempts. These provisions might also have the effect of preventing changes in our management. It is possible that these provisions could make it more difficult to accomplish transactions that stockholders might otherwise deem to be in their best interests.
Transfer Agent and Registrar
Upon the completion of this offering, the transfer agent and registrar for our common stock will be American Stock Transfer & Trust Company, LLC. The transfer agent and registrar’s address is 6201 15th Avenue, Brooklyn, New York 11219, and its telephone number is (718) 921-8206.
95
Table of Contents
SHARES ELIGIBLE FOR FUTURE SALE
Prior to this offering, there has been no market for our common stock. Future sales of substantial amounts of common stock in the public market could adversely affect prevailing market prices. Since the shares of stock not sold in this offering are subject to contractual and legal restrictions on resale, sales of substantial amounts of our common stock in the public market after the restrictions lapse could adversely affect the prevailing market price and our ability to raise equity capital in the future.
Upon completion of the offering, we will have outstanding shares of common stock. Of these shares, the shares sold in the offering (plus any shares issued upon exercise of the underwriters’ option to purchase additional shares) will be freely tradable without restriction under the Securities Act, unless purchased by our “affiliates” as that term is defined in Rule 144 under the Securities Act, which generally includes officers, directors or 10% stockholders.
The remaining shares outstanding are “restricted securities” within the meaning of Rule 144 under the Securities Act. These shares may be sold in the public market only if registered or if they qualify for an exemption from registration under Rules 144 or 701 promulgated under the Securities Act, which are summarized below. Sales of these shares in the public market, or the availability of such shares for sale, could adversely affect the market price of the common stock.
Our stockholders have entered into lock-up agreements generally providing that they will not offer, sell, contract to sell or grant any option to purchase or otherwise dispose of our common stock or any securities exercisable for or convertible into our common stock owned by them for a period of 180 days after the effective date of the registration statement filed pursuant to this offering without the prior written consent of Citigroup Global Markets Inc. and Goldman, Sachs & Co. As a result of these contractual restrictions, notwithstanding possible earlier eligibility for sale under the provisions of Rules 144 and 701, shares subject to lock-up agreements will not be salable until such agreements expire or are waived by the designated underwriters’ representative. Taking into account the lock-up agreements, and assuming Citigroup Global Markets Inc. and Goldman, Sachs & Co. do not release stockholders from these agreements, the following shares will be eligible for sale in the public market at the following times:
| • | Beginning on the effective date of this prospectus, only the shares sold in the offering will be immediately available for sale in the public market. |
| • | Beginning 180 days after the effective date, approximately shares will be eligible for sale pursuant to Rule 701 and approximately additional shares will be eligible for sale pursuant to Rule 144, of which all but shares are held by affiliates. |
In general, under Rule 144 as currently in effect, and beginning after the expiration of the lock-up agreements (180 days after the effective date) of a person (or persons whose shares are aggregated) who has beneficially owned restricted securities for at least one year would be entitled to sell within any three-month period a number of shares that does not exceed the greater of: (i) one percent of the number of shares of common stock then outstanding (which will equal approximately shares immediately after the offering); or (ii) the average weekly trading volume of the common stock during the four calendar weeks preceding the sale. Sales under Rule 144 are also subject to certain manner of sale provisions and notice requirements and to the availability of current public information about us. Under Rule 144, a person who is not deemed to have been an affiliate of ours at any time during the three months preceding a sale, and who has beneficially owned the shares proposed to be sold for at least one year, is entitled to sell such shares without complying with the manner of sale, public information, volume limitation or notice provisions of Rule 144.
As a result of the lock-up agreements, all of our employees holding common stock or stock options may not sell shares acquired upon exercise until 180 days after the effective date. Beginning 180 days after the effective date, any of our employees, officers, director or consultants who purchased shares pursuant to a written compensatory plan or contract may be entitled to rely on the resale provisions of Rule 701. Rule 701 permits affiliates to sell their Rule 701 shares under Rule 144 without complying with the holding period requirements of Rule 144. Rule 701 further provides that non-affiliates may sell such shares in reliance on Rule 144 without
96
Table of Contents
having to comply with the holding period, public information, volume limitation or notice provisions of Rule 144. In addition, we intend to file registration statements under the Securities Act as promptly as possible after the effective date of the registration statement of which this prospectus is a part to register shares to be issued pursuant to our employee benefit plans. As a result, any options exercised under the Stock Plan or any other benefit plan after the effectiveness of such registration statement will also be freely tradable in the public market, except that shares held by affiliates will still be subject to the volume limitation, manner of sale, notice and public information requirements of Rule 144 unless otherwise resalable under Rule 701. As of June 30, 2013, there were no outstanding options. See “Risk Factors—Future sales or the perception of future sales of a substantial amount of our common stock may depress the price of shares of our common stock” and “Management—2013 Omnibus Equity Incentive Plan.”
97
Table of Contents
MATERIAL U.S. FEDERAL INCOME TAX CONSEQUENCES TO NON-U.S. HOLDERS
The following discussion is a summary of the material U.S. federal income tax consequences to non-U.S. holders (as defined below) of the purchase, ownership and disposition of our common stock issued pursuant to this offering, but does not purport to be a complete analysis of all potential tax effects. The effects of other U.S. federal tax laws, such as estate and gift tax laws, and any applicable state, local or foreign tax laws are not discussed. This discussion is based on the Internal Revenue Code of 1986, as amended (the “Code”), Treasury Regulations promulgated thereunder, judicial decisions, and published rulings and administrative pronouncements of the U.S. Internal Revenue Service (“IRS”) in effect as of the date of this offering. These authorities may change or be subject to differing interpretations. Any such change may be applied retroactively in a manner that could adversely affect a non-U.S. holder of our common stock. We have not sought and will not seek any rulings from the IRS regarding the matters discussed below. There can be no assurance the IRS or a court will not take a contrary position regarding the tax consequences of the purchase, ownership and disposition of our common stock.
This discussion is limited to non-U.S. holders that hold our common stock as a “capital asset” within the meaning of Section 1221 of the Code (property held for investment). This discussion does not address all U.S. federal income tax consequences relevant to a non-U.S. holder’s particular circumstances, including the impact of the unearned income Medicare contribution tax. In addition, it does not address consequences relevant to non-U.S. holders subject to particular rules, including, without limitation:
| • | U.S. expatriates and certain former citizens or long-term residents of the United States; |
| • | persons subject to the alternative minimum tax; |
| • | persons holding our common stock as part of a hedge, straddle or other risk reduction strategy or as part of a conversion transaction or other integrated investment; |
| • | banks, insurance companies, and other financial institutions; |
| • | real estate investment trusts or regulated investment companies; |
| • | brokers, dealers or traders in securities; |
| • | “controlled foreign corporations,” “passive foreign investment companies,” and corporations that accumulate earnings to avoid U.S. federal income tax; |
| • | S corporations, partnerships or other entities or arrangements treated as partnerships for U.S. federal income tax purposes; |
| • | tax-exempt organizations or governmental organizations; |
| • | persons deemed to sell our common stock under the constructive sale provisions of the Code; |
| • | persons who hold or receive our common stock pursuant to the exercise of any employee stock option or otherwise as compensation; and |
| • | tax-qualified retirement plans. |
If a partnership (or other entity treated as a partnership for U.S. federal income tax purposes) holds our common stock, the tax treatment of a partner in the partnership will depend on the status of the partner, the activities of the partnership and certain determinations made at the partner level. Accordingly, partnerships holding our common stock and the partners in such partnerships should consult their tax advisors regarding the U.S. federal income tax consequences to them.
THIS DISCUSSION IS FOR INFORMATION PURPOSES ONLY AND IS NOT INTENDED AS TAX ADVICE. INVESTORS SHOULD CONSULT THEIR TAX ADVISORS WITH RESPECT TO THE APPLICATION OF THE U.S. FEDERAL INCOME TAX LAWS TO THEIR PARTICULAR SITUATIONS AS WELL AS ANY TAX CONSEQUENCES OF THE PURCHASE, OWNERSHIP AND
98
Table of Contents
DISPOSITION OF OUR COMMON STOCK ARISING UNDER THE U.S. FEDERAL ESTATE OR GIFT TAX LAWS OR UNDER THE LAWS OF ANY STATE, LOCAL OR NON-U.S. TAXING JURISDICTION OR UNDER ANY APPLICABLE INCOME TAX TREATY.
Definition of a Non-U.S. Holder
For purposes of this discussion, a “non-U.S. holder” is any beneficial owner of our common stock that is neither a “U.S. person” nor a partnership for United States federal income tax purposes. A U.S. person is any of the following:
| • | an individual who is a citizen or resident of the United States; |
| • | a corporation (or other entity taxable as a corporation for U.S. federal income tax purposes) created or organized under the laws of the United States, any state thereof, or the District of Columbia; |
| • | an estate, the income of which is subject to U.S. federal income tax regardless of its source; or |
| • | a trust that (1) is subject to the primary supervision of a U.S. court and the control of one or more United States persons (within the meaning of Section 7701(a)(30) of the Code), or (2) has made a valid election under applicable Treasury Regulations to continue to be treated as a United States person. |
Distributions
Any distributions of cash or property on our common stock will constitute dividends for U.S. federal income tax purposes to the extent paid from our current or accumulated earnings and profits, as determined under U.S. federal income tax principles. Amounts not treated as dividends for U.S. federal income tax purposes will constitute a return of capital and first be applied against and reduce a non-U.S. holder’s adjusted tax basis in its common stock, but not below zero. Any excess will be treated as capital gain and will be treated as described below in the section relating to the sale or disposition of our common stock.
Subject to the discussion below on backup withholding and foreign accounts, dividends paid to a non-U.S. holder of our common stock that are not effectively connected with the non-U.S. holder’s conduct of a trade or business within the United States will be subject to U.S. federal withholding tax at a rate of 30% of the gross amount of the dividends (or such lower rate specified by an applicable income tax treaty).
Non-U.S. holders will be entitled to a reduction in or an exemption from withholding on dividends as a result of either (a) an applicable income tax treaty or (b) the non-U.S. holder holding our common stock in connection with the conduct of a trade or business within the United States and dividends being paid in connection with that trade or business. To claim such a reduction in or exemption from withholding, the non-U.S. holder must provide the applicable withholding agent with a properly executed (a) IRS Form W-8BEN claiming an exemption from or reduction of the withholding tax under the benefit of an income tax treaty between the United States and the country in which the non-U.S. holder resides or is established, or (b) IRS Form W-8ECI stating that the dividends are not subject to withholding tax because they are effectively connected with the conduct by the non-U.S. holder of a trade or business within the United States, as may be applicable. These certifications must be provided to the applicable withholding agent prior to the payment of dividends and must be updated periodically. Non-U.S. holders that do not timely provide the applicable withholding agent with the required certification, but that qualify for a reduced rate under an applicable income tax treaty, may obtain a refund of any excess amounts withheld by timely filing an appropriate claim for refund with the IRS.
Subject to the discussion below on backup withholding and foreign accounts, if dividends paid to a non-U.S. holder are effectively connected with the non-U.S. holder’s conduct of a trade or business within the United States (and, if required by an applicable income tax treaty, the non-U.S. holder maintains a permanent establishment in the United States to which such dividends are attributable), then, although exempt from U.S. federal withholding tax (provided the non-U.S. holder provides appropriate certification, as described above), the non-U.S. holder will be subject to U.S. federal income tax on such dividends on a net income basis at the regular
99
Table of Contents
graduated U.S. federal income tax rates. In addition, a non-U.S. holder that is a corporation may be subject to a branch profits tax at a rate of 30% (or such lower rate specified by an applicable income tax treaty) on its effectively connected earnings and profits for the taxable year that are attributable to such dividends, as adjusted for certain items. Non-U.S. holders should consult their tax advisors regarding their entitlement to benefits under any applicable income tax treaty.
Sale or Other Taxable Disposition
Subject to the discussions below on backup withholding and foreign accounts, a non-U.S. holder will not be subject to U.S. federal income tax on any gain realized upon the sale or other disposition of our common stock unless:
| • | the gain is effectively connected with the non-U.S. holder’s conduct of a trade or business within the United States (and, if required by an applicable income tax treaty, the non-U.S. holder maintains a permanent establishment in the United States to which such gain is attributable); |
| • | the non-U.S. holder is a nonresident alien individual present in the United States for 183 days or more during the taxable year of the disposition and certain other requirements are met; or |
| • | our common stock constitutes a U.S. real property interest (“USRPI”) by reason of our status as a U.S. real property holding corporation (a “USRPHC”) for U.S. federal income tax purposes. |
Gain described in the first bullet point above will generally be subject to U.S. federal income tax on a net income basis at the regular graduated U.S. federal income tax rates. A non-U.S. holder that is a foreign corporation also may be subject to a branch profits tax at a rate of 30% (or such lower rate specified by an applicable income tax treaty) of a portion of its effectively connected earnings and profits for the taxable year, as adjusted for certain items.
A non-U.S. holder described in the second bullet point above will be subject to U.S. federal income tax at a rate of 30% (or such lower rate specified by an applicable income tax treaty) on any gain derived from the disposition, which may be offset by certain U.S. source capital losses of the non-U.S. holder (even though the individual is not considered a resident of the United States) provided the non-U.S. holder has timely filed U.S. federal income tax returns with respect to such losses.
With respect to the third bullet point above, we believe we are not currently and do not anticipate becoming a USRPHC. Because the determination of whether we are a USRPHC depends on the fair market value of our USRPIs relative to the fair market value of our other business assets and our non-U.S. real property interests, however, there can be no assurance we are not a USRPHC or will not become one in the future. Even if we are or were to become a USRPHC, gain arising from the sale or other taxable disposition by a non-U.S. holder of our common stock will not be subject to U.S. federal income tax if such class of stock is “regularly traded,” as defined by applicable Treasury Regulations, on an established securities market, and such non-U.S. holder owned, actually or constructively, 5% or less of such class of our stock throughout the shorter of the five-year period ending on the date of the sale or other disposition or the non-U.S. holder’s holding period for such stock.
Non-U.S. holders should consult their tax advisors regarding potentially applicable income tax treaties that may provide for different rules.
Information Reporting and Backup Withholding
Subject to the discussion below on foreign accounts, a non-U.S. holder will not be subject to backup withholding with respect to payments of dividends on our common stock we make to the non-U.S. holder, provided the applicable withholding agent does not have actual knowledge or reason to know such holder is a United States person and the holder certifies its non-U.S. status, such as by providing a valid IRS Form W-8BEN or W-8ECI, or other applicable certification. However, information returns will be filed with the IRS in connection with any dividends on our common stock paid to the non-U.S. holder, regardless of whether any tax was actually withheld.
100
Table of Contents
Copies of these information returns may also be made available under the provisions of a specific treaty or agreement to the tax authorities of the country in which the non-U.S. holder resides or is established.
Information reporting and backup withholding may apply to the proceeds of a sale of our common stock within the United States, and information reporting may (although backup withholding generally will not) apply to the proceeds of a sale of our common stock outside the United States conducted through certain U.S.-related financial intermediaries, in each case, unless the beneficial owner certifies under penalty of perjury that it is a non-U.S. holder on IRS Form W-8BEN or other applicable form (and the payor does not have actual knowledge or reason to know that the beneficial owner is a U.S. person) or such owner otherwise establishes an exemption.
Backup withholding is not an additional tax. Any amounts withheld under the backup withholding rules may be allowed as a refund or a credit against a non-U.S. holder’s U.S. federal income tax liability, provided the required information is timely furnished to the IRS.
Additional Withholding Tax on Payments Made to Foreign Accounts
Withholding taxes may be imposed under the Foreign Account Tax Compliance Act (“FATCA”) on certain types of payments made to non-U.S. financial institutions and certain other non-U.S. entities. Specifically, a 30% withholding tax may be imposed on dividends on, or gross proceeds from the sale or other disposition of, our common stock paid to a “foreign financial institution” or a “non-financial foreign entity” (each as defined in the Code), unless (1) the foreign financial institution undertakes certain diligence and reporting obligations, (2) the non-financial foreign entity either certifies it does not have any “substantial United States owners” (as defined in the Code) or furnishes identifying information regarding each substantial United States owner, or (3) the foreign financial institution or non-financial foreign entity otherwise qualifies for an exemption from these rules. If the payee is a foreign financial institution and is subject to the diligence and reporting requirements in (1) above, it must (a) enter into an agreement with the U.S. Department of the Treasury requiring, among other things, that it undertake to identify accounts held by certain “specified United States persons” or “United States-owned foreign entities” (each as defined in the Code), annually report certain information about such accounts, and withhold 30% on payments to non-compliant foreign financial institutions and certain other account holders or (b) if it is in a jurisdiction that has an intergovernmental agreement with the United States (an “IGA”), comply with such IGA.
The withholding provisions described above will generally apply to payments of dividends made on or after July 1, 2014 and to payments of gross proceeds from a sale or other disposition of stock on or after January 1, 2017. These withholding provisions will apply to certain foreign pass-thru payments received through foreign financial institutions on the later of January 1, 2017 and the date that final regulations defining the term “foreign pass-thru payments” are issued. Because we may not know the extent to which a distribution is a dividend for U.S. federal income tax purposes at the time it is made, for purposes of these withholding rules we may treat the entire distribution as a dividend. Prospective investors should consult their tax advisors regarding these withholding provisions.
101
Table of Contents
The company, the selling stockholders and Citigroup Global Markets Inc. and Goldman, Sachs & Co., as representatives of the underwriters named below have entered into an underwriting agreement with respect to the shares being offered. Subject to certain conditions, each underwriter has severally agreed to purchase the number of shares indicated in the following table. Citigroup Global Markets Inc. and Goldman, Sachs & Co. are the representatives of the underwriters.
| Underwriters |
Number of Shares | |
| Citigroup Global Markets Inc. |
||
| Goldman, Sachs & Co. |
||
| JMP Securities LLC |
||
| William Blair & Company, L.L.C. |
||
|
| ||
| Total |
||
|
|
The underwriters are committed to take and pay for all of the shares being offered, if any are taken, other than the shares covered by the option described below unless and until this option is exercised.
The underwriters have an option to buy up to an additional shares from the companyto cover sales by the underwriters of a greater number of shares than the total number set forth in the table above. They may exercise that option for 30 days. If any shares are purchased pursuant to this option, the underwriters will severally purchase shares in approximately the same proportion as set forth in the table above.
The following tables show the per share and total underwriting discounts and commissions to be paid to the underwriters by the company and the selling stockholders. Such amounts are shown assuming both no exercise and full exercise of the underwriters’ option to purchase additional shares.
Paid by the Company
| No Exercise | Full Exercise | |||||||
| Per Share |
$ | $ | ||||||
| Total |
$ | $ | ||||||
Paid by the Selling Stockholders
| No Exercise | Full Exercise | |||||||
| Per Share |
$ | $ | ||||||
| Total |
$ | $ | ||||||
Shares sold by the underwriters to the public will initially be offered at the initial public offering price set forth on the cover of this prospectus. Any shares sold by the underwriters to securities dealers may be sold at a discount of up to $ per share from the initial public offering price. After the initial offering of the shares, the representatives may change the offering price and the other selling terms. The offering of the shares by the underwriters is subject to receipt and acceptance and subject to the underwriters’ right to reject any order in whole or in part.
The company and its officers, directors, and holders of substantially all of the company’s common stock have agreed with the underwriters, subject to certain exceptions, not to dispose of or hedge any of their common stock or securities convertible into or exchangeable for shares of common stock during the period from the date of this prospectus continuing through the date days after the date of this prospectus, except with the prior written consent of the representatives. This agreement does not apply to any existing employee benefit plans. See “Shares Eligible for Future Sale” for a discussion of certain transfer restrictions.
At our request, the underwriters have reserved up to 5% of the shares for sale at the initial public offering price to persons who are directors, officers, or who are otherwise associated with us through a directed share program. The number of shares available for sale to the general public will be reduced by the number of directed
102
Table of Contents
shares purchased by participants in the program. Except for certain of our officers and directors who have entered into lock-up agreements as contemplated in the immediately preceding paragraph, each person buying shares through the directed share program has agreed that, for a period of 30 days from the date of this prospectus, he or she will not, without the prior written consent of Citigroup Global Markets Inc. and Goldman, Sachs & Co., dispose of or hedge any shares or any securities convertible into or exchangeable for our common stock with respect to shares purchased in the program. For certain officers and directors purchasing shares through the directed share program, the lock-up agreements contemplated in the immediately preceding paragraph shall govern with respect to their purchases. Citigroup Global Markets Inc. and Goldman, Sachs & Co. in their sole discretion may release any of the securities subject to these lock-up agreements at any time, which, in the case of officers and directors, shall be with notice. Any directed shares not purchased will be offered by the underwriters to the general public on the same basis as all other shares offered. We have agreed to indemnify the underwriters against certain liabilities and expenses, including liabilities under the Securities Act, in connection with the sales of the directed shares.
Prior to the offering, there has been no public market for the shares. The initial public offering price has been negotiated among the company and the representatives. Among the factors to be considered in determining the initial public offering price of the shares, in addition to prevailing market conditions, will be the company’s historical performance, estimates of the business potential and earnings prospects of the company, an assessment of the company’s management and the consideration of the above factors in relation to market valuation of companies in related businesses.
We intend to list the common stock on the New York Stock Exchange under the symbol “MMI.” In order to meet one of the requirements for listing the common stock on the NYSE, the underwriters have undertaken to sell lots of 100 or more shares to a minimum of 400 beneficial holders.
In connection with the offering, the underwriters may purchase and sell shares of common stock in the open market. These transactions may include short sales, stabilizing transactions and purchases to cover positions created by short sales. Short sales involve the sale by the underwriters of a greater number of shares than they are required to purchase in the offering, and a short position represents the amount of such sales that have not been covered by subsequent purchases. A “covered short position” is a short position that is not greater than the amount of additional shares for which the underwriters’ option described above may be exercised. The underwriters may cover any covered short position by either exercising their option to purchase additional shares or purchasing shares in the open market. In determining the source of shares to cover the covered short position, the underwriters will consider, among other things, the price of shares available for purchase in the open market as compared to the price at which they may purchase additional shares pursuant to the option described above. “Naked” short sales are any short sales that create a short position greater than the amount of additional shares for which the option described above may be exercised. The underwriters must cover any such naked short position by purchasing shares in the open market. A naked short position is more likely to be created if the underwriters are concerned that there may be downward pressure on the price of the common stock in the open market after pricing that could adversely affect investors who purchase in the offering. Stabilizing transactions consist of various bids for or purchases of common stock made by the underwriters in the open market prior to the completion of the offering.
The underwriters may also impose a penalty bid. This occurs when a particular underwriter repays to the underwriters a portion of the underwriting discount received by it because the representatives have repurchased shares sold by or for the account of such underwriter in stabilizing or short covering transactions.
Purchases to cover a short position and stabilizing transactions, as well as other purchases by the underwriters for their own accounts, may have the effect of preventing or retarding a decline in the market price of the company’s stock, and together with the imposition of the penalty bid, may stabilize, maintain or otherwise affect the market price of the common stock. As a result, the price of the common stock may be higher than the price that otherwise might exist in the open market. The underwriters are not required to engage in these activities and may end any of these activities at any time. These transactions may be effected on NYSE in the over-the-counter market or otherwise.
103
Table of Contents
The Debt-for-Equity Exchange
It is expected that William A. Millichap, George M. Marcus, and entities affiliated with Donald A. Lorenz, which we refer to, in such role, as the debt-for-equity exchange parties, will enter into a debt-for-equity exchange agreement with MMC. Under the debt-for-equity exchange agreement, subject to certain conditions, the debt-for-equity exchange parties, as principals for their own account, will exchange debt obligations of MMC held by the debt-for-equity exchange parties or their affiliates for the shares of our common stock to be sold by the debt-for-equity exchange parties in this offering. The debt-for-equity exchange parties will then sell the shares to the underwriters for cash. This debt-for-equity exchange will occur on the settlement date of this offering immediately prior to the settlement of the debt-for-equity exchange parties’ sale of the shares to the underwriters.
The aggregate principal amount of indebtedness to be exchanged by the debt-for-equity parties pursuant to the Debt-for-Equity Exchange is $ . The number of shares to be received by the debt-for-equity exchange parties in exchange for such indebtedness will be determined by dividing the total aggregate principal amount of such indebtedness by the initial public offering price per share, less the underwriting discount. The debt-for-equity exchange parties will acquire and sell the shares as principals for their own account, rather than on MMC’s behalf. If MMC and the debt-for-equity exchange parties enter into the debt-for-equity exchange agreement, as described above, the debt-for-equity exchange parties will become the owner of our shares of common stock they acquire in the Debt-for-Equity Exchange, regardless of whether this offering is completed. The debt-for-equity exchange parties, as selling stockholders, and not MMC, will receive the net proceeds from the sale of the shares sold by the debt-for-equity exchange parties in this offering.
European Economic Area
In relation to each Member State of the European Economic Area which has implemented the Prospectus Directive (each, a Relevant Member State), each underwriter has represented and agreed that with effect from and including the date on which the Prospectus Directive is implemented in that Relevant Member State (the Relevant Implementation Date) it has not made and will not make an offer of shares to the public in that Relevant Member State prior to the publication of a prospectus in relation to the shares which has been approved by the competent authority in that Relevant Member State or, where appropriate, approved in another Relevant Member State and notified to the competent authority in that Relevant Member State, all in accordance with the Prospectus Directive, except that it may, with effect from and including the Relevant Implementation Date, make an offer of shares to the public in that Relevant Member State at any time:
| (a) | to legal entities which are authorised or regulated to operate in the financial markets or, if not so authorised or regulated, whose corporate purpose is solely to invest in securities; |
| (b) | to any legal entity which has two or more of (1) an average of at least 250 employees during the last financial year; (2) a total balance sheet of more than €43,000,000 and (3) an annual net turnover of more than €50,000,000, as shown in its last annual or consolidated accounts; |
| (c) | to fewer than 100 natural or legal persons (other than qualified investors as defined in the Prospectus Directive) subject to obtaining the prior consent of the representatives for any such offer; or |
| (d) | in any other circumstances which do not require the publication by the company of a prospectus pursuant to Article 3 of the Prospectus Directive. |
For the purposes of this provision, the expression an “offer of shares to the public” in relation to any shares in any Relevant Member State means the communication in any form and by any means of sufficient information on the terms of the offer and the shares to be offered so as to enable an investor to decide to purchase or subscribe the shares, as the same may be varied in that Relevant Member State by any measure implementing the Prospectus Directive in that Relevant Member State and the expression Prospectus Directive means Directive 2003/71/EC and includes any relevant implementing measure in each Relevant Member State.
104
Table of Contents
United Kingdom
Each underwriter has represented and agreed that:
| (a) | it has only communicated or caused to be communicated and will only communicate or cause to be communicated an invitation or inducement to engage in investment activity (within the meaning of Section 21 of the FSMA) received by it in connection with the issue or sale of the shares in circumstances in which Section 21(1) of the FSMA would not, if the company was not an “authorised person,” apply to the company; and |
| (b) | it has complied and will comply with all applicable provisions of the FSMA with respect to anything done by it in relation to the shares in, from or otherwise involving the United Kingdom. |
Hong Kong
The shares may not be offered or sold by means of any document other than (i) in circumstances which do not constitute an offer to the public within the meaning of the Companies Ordinance (Cap.32, Laws of Hong Kong), or (ii) to “professional investors” within the meaning of the Securities and Futures Ordinance (Cap.571, Laws of Hong Kong) and any rules made thereunder, or (iii) in other circumstances which do not result in the document being a “prospectus” within the meaning of the Companies Ordinance (Cap.32, Laws of Hong Kong), and no advertisement, invitation or document relating to the shares may be issued or may be in the possession of any person for the purpose of issue (in each case whether in Hong Kong or elsewhere), which is directed at, or the contents of which are likely to be accessed or read by, the public in Hong Kong (except if permitted to do so under the laws of Hong Kong) other than with respect to shares which are or are intended to be disposed of only to persons outside Hong Kong or only to “professional investors” within the meaning of the Securities and Futures Ordinance (Cap. 571, Laws of Hong Kong) and any rules made thereunder.
Singapore
This prospectus has not been registered as a prospectus with the Monetary Authority of Singapore. Accordingly, this prospectus and any other document or material in connection with the offer or sale, or invitation for subscription or purchase, of the shares may not be circulated or distributed, nor may the shares be offered or sold, or be made the subject of an invitation for subscription or purchase, whether directly or indirectly, to persons in Singapore other than (i) to an institutional investor under Section 274 of the Securities and Futures Act, Chapter 289 of Singapore (the “SFA”), (ii) to a relevant person, or any person pursuant to Section 275(1A), and in accordance with the conditions, specified in Section 275 of the SFA or (iii) otherwise pursuant to, and in accordance with the conditions of, any other applicable provision of the SFA.
Where the shares are subscribed or purchased under Section 275 by a relevant person which is: (a) a corporation (which is not an accredited investor) the sole business of which is to hold investments and the entire share capital of which is owned by one or more individuals, each of whom is an accredited investor; or (b) a trust (where the trustee is not an accredited investor) whose sole purpose is to hold investments and each beneficiary is an accredited investor, shares, debentures and units of shares and debentures of that corporation or the beneficiaries’ rights and interest in that trust shall not be transferable for 6 months after that corporation or that trust has acquired the shares under Section 275 except: (1) to an institutional investor under Section 274 of the SFA or to a relevant person, or any person pursuant to Section 275(1A), and in accordance with the conditions, specified in Section 275 of the SFA; (2) where no consideration is given for the transfer; or (3) by operation of law.
Japan
The securities have not been and will not be registered under the Financial Instruments and Exchange Law of Japan (the Financial Instruments and Exchange Law) and each underwriter has agreed that it will not offer or sell any securities, directly or indirectly, in Japan or to, or for the benefit of, any resident of Japan (which term as used herein means any person resident in Japan, including any corporation or other entity organized under the laws of Japan), or to others for re-offering or resale, directly or indirectly, in Japan or to a resident of Japan, except pursuant to an exemption from the registration requirements of, and otherwise in compliance with, the Financial Instruments and Exchange Law and any other applicable laws, regulations and ministerial guidelines of Japan.
105
Table of Contents
Other
The underwriters do not expect sales to discretionary accounts to exceed five percent of the total number of shares offered.
The company and the selling stockholders estimate that their share of the total expenses of the offering, excluding underwriting discounts and commissions, will be approximately $ .
The company and the selling stockholders have agreed to indemnify the several underwriters against certain liabilities, including liabilities under the Securities Act of 1933.
The underwriters and their respective affiliates are full service financial institutions engaged in various activities, which may include sales and trading, commercial and investment banking, advisory, investment management, investment research, principal investment, hedging, market making, brokerage and other financial and non-financial activities and services. Some of the underwriters and their respective affiliates have provided, and may in the future provide, a variety of these services to the issuer and to persons and entities with relationships with the issuer, for which they received or will receive customary fees and expenses.
In the ordinary course of their various business activities, the underwriters and their respective affiliates, officers, directors and employees may purchase, sell or hold a broad array of investments and actively trade securities, derivatives, loans, commodities, currencies, credit default swaps and other financial instruments for their own account and for the accounts of their customers, and such investment and trading activities may involve or relate to assets, securities and/or instruments of the issuer (directly, as collateral securing other obligations or otherwise) and/or persons and entities with relationships with the issuer. The underwriters and their respective affiliates may also communicate independent investment recommendations, market color or trading ideas and/or publish or express independent research views in respect of such assets, securities or instruments and may at any time hold, or recommend to clients that they should acquire, long and/or short positions in such assets, securities and instruments.
106
Table of Contents
The validity of the common stock offered hereby will be passed upon for us by Orrick, Herrington & Sutcliffe LLP, San Francisco, California. Certain legal matters in connection with this offering will be passed upon for the underwriters by Latham & Watkins LLP, Los Angeles, California.
The consolidated financial statements of Marcus & Millichap Real Estate Investment Services, Inc. as of December 31, 2012 and 2011, and for each of the three years in the period ended December 31, 2012 appearing in this prospectus and registration statement have been audited by Ernst & Young LLP, an independent registered public accounting firm, as set forth in their report thereon appearing elsewhere herein, and are included in reliance upon such report given upon the authority of such firm as experts in accounting and auditing.
WHERE YOU CAN FIND MORE INFORMATION
We have filed with the SEC a registration statement on Form S-1 under the Securities Act with respect to this offering of our common stock. This prospectus, which constitutes a part of the registration statement, does not contain all of the information set forth in the registration statement, some items of which are contained in exhibits to the registration statement as permitted by the rules and regulations of the SEC. For further information with respect to us and our common stock, we refer you to the registration statement, including the exhibits and the financial statements and notes filed as a part of the registration statement. Statements contained in this prospectus concerning the contents of any contract or any other documents are not necessarily complete. If a contract or document has been filed as an exhibit to the registration statement, please see the copy of the contract or document that has been filed. Each statement in this prospectus relating to a contract or document filed as an exhibit is qualified in all respects by the filed exhibit. The exhibits to the registration statement should be referenced for the complete contents of these contracts and documents. You may obtain copies of this information by mail from the Public Reference Section of the SEC, 100 F Street, N.E., Washington, D.C. 20549, at prescribed rates. You may obtain information on the operation of the public reference rooms by calling the SEC at 1-800-SEC-0330. The SEC also maintains an Internet website that contains reports, proxy statements and other information about issuers, like us, that file electronically with the SEC. The address of that website is www.sec.gov.
As a result of this offering, we will become subject to the information and reporting requirements of the Securities Exchange Act and, in accordance with this law, will file periodic reports, proxy statements and other information with the SEC. These periodic reports, proxy statements and other information will be available for inspection and copying at the SEC’s public reference facilities and the website of the SEC referred to above.
107
Table of Contents
INDEX TO CONSOLIDATED FINANCIAL STATEMENTS
| Marcus & Millichap Real Estate Investment Services, Inc. |
||||
| F-2 | ||||
| F-3 | ||||
| F-4 | ||||
| F-5 | ||||
| F-6 | ||||
| F-8 |
F-1
Table of Contents
Report of Independent Registered Public Accounting Firm
The Board of Directors and Stockholders
Marcus & Millichap Real Estate Investment Services, Inc.
We have audited the accompanying consolidated balance sheets of Marcus & Millichap Real Estate Investment Services, Inc. and Subsidiaries (the Company) as of December 31, 2012 and 2011, and the related consolidated statements of income, stockholders’ equity, and cash flows for each of the three years in the period ended December 31, 2012. These financial statements are the responsibility of the Company’s management. Our responsibility is to express an opinion on these financial statements based on our audits.
We conducted our audits in accordance with the standards of the Public Company Accounting Oversight Board (United States). Those standards require that we plan and perform the audit to obtain reasonable assurance about whether the financial statements are free of material misstatement. We were not engaged to perform an audit of the Company’s internal control over financial reporting. Our audits included consideration of internal control over financial reporting as a basis for designing audit procedures that are appropriate in the circumstances, but not for the purpose of expressing an opinion on the effectiveness of the Company’s internal control over financial reporting. Accordingly, we express no such opinion. An audit also includes examining, on a test basis, evidence supporting the amounts and disclosures in the financial statements, assessing the accounting principles used and significant estimates made by management, and evaluating the overall financial statement presentation. We believe that our audits provide a reasonable basis for our opinion.
In our opinion, the financial statements referred to above present fairly, in all material respects, the consolidated financial position of Marcus & Millichap Real Estate Investment Services, Inc. and Subsidiaries at December 31, 2012 and 2011, and the consolidated results of their operations and their cash flows for each of the three years in the period ended December 31, 2012, in conformity with U.S. generally accepted accounting principles.
Ernst & Young LLP
San Francisco, California
June 14, 2013
F-2
Table of Contents
MARCUS & MILLICHAP REAL ESTATE INVESTMENT SERVICES, INC. AND SUBSIDIARIES
(dollar amounts in thousands, except share and per share amounts)
| June
30, 2013 |
December 31, | |||||||||||
| 2012 | 2011 | |||||||||||
| (unaudited) | ||||||||||||
| Assets |
||||||||||||
| Current assets: |
||||||||||||
| Cash and cash equivalents |
$ | 19,362 | $ | 3,107 | $ | 3,158 | ||||||
| Commissions receivable, net of allowance for doubtful accounts of $129 at June 30, 2013 and December 31, 2012, and $143 at December 31, 2011 |
4,935 | 5,764 | 2,150 | |||||||||
| Employee notes receivable |
141 | 807 | 322 | |||||||||
| Prepaid expenses and other current assets |
4,759 | 2,903 | 2,259 | |||||||||
|
|
|
|
|
|
|
|||||||
| Total current assets |
29,197 | 12,581 | 7,889 | |||||||||
| Prepaid rent |
3,598 | 2,855 | 2,958 | |||||||||
| Investments held in rabbi trust account |
3,669 | 2,905 | 2,408 | |||||||||
| Property and equipment, net of accumulated depreciation of $17,126, $17,917 and $15,654 at June 30, 2013, December 31, 2012 and 2011, respectively |
7,592 | 6,688 | 5,298 | |||||||||
| Due from affiliates |
— | 60,389 | 40,505 | |||||||||
| Employee notes receivable |
228 | 350 | 587 | |||||||||
| Other assets |
3,736 | 3,965 | 4,651 | |||||||||
|
|
|
|
|
|
|
|||||||
| Total assets |
$ | 48,020 | $ | 89,733 | $ | 64,296 | ||||||
|
|
|
|
|
|
|
|||||||
| Liabilities and stockholders’ equity |
||||||||||||
| Current liabilities: |
||||||||||||
| Accounts payable and accrued expenses |
$ | 5,645 | $ | 14,350 | $ | 7,559 | ||||||
| Commissions payable |
11,907 | 22,584 | 13,580 | |||||||||
| Due to affiliates |
2,914 | — | — | |||||||||
| Accrued employee expenses |
6,251 | 17,519 | 9,688 | |||||||||
|
|
|
|
|
|
|
|||||||
| Total current liabilities |
26,717 | 54,453 | 30,827 | |||||||||
| Deferred compensation and commissions |
8,337 | 9,121 | 6,626 | |||||||||
| Other liabilities |
4,804 | 4,529 | 6,686 | |||||||||
|
|
|
|
|
|
|
|||||||
| Total liabilities |
39,858 | 68,103 | 44,139 | |||||||||
| Commitments and contingencies (Note 11) |
||||||||||||
| Stockholders’ equity: |
||||||||||||
| Series A redeemable preferred stock, $10.00 par value: |
||||||||||||
| Authorized shares – 1,000; issued and outstanding shares – 1,000 at June 30, 2013, December 31, 2012 and 2011; $10.00 redemption value per share at June 30, 2013, December 31, 2012 and 2011 |
10 | 10 | 10 | |||||||||
| Common stock, $1.00 par value: |
||||||||||||
| Authorized shares – 1,000,000; issued and outstanding shares –234,489, 233,739 and 230,239 at June 30, 2013, December 31, 2012 and 2011, respectively |
235 | 234 | 230 | |||||||||
| Additional paid-in capital |
1,514 | 24,718 | 20,423 | |||||||||
| Stock notes receivable from employees |
(62 | ) | (150 | ) | (146 | ) | ||||||
| Retained earnings (accumulated deficit) |
6,465 | (3,182 | ) | (360 | ) | |||||||
|
|
|
|
|
|
|
|||||||
| Total stockholders’ equity |
8,162 | 21,630 | 20,157 | |||||||||
|
|
|
|
|
|
|
|||||||
| Total liabilities and stockholders’ equity |
$ | 48,020 | $ | 89,733 | $ | 64,296 | ||||||
|
|
|
|
|
|
|
|||||||
See accompanying notes.
F-3
Table of Contents
MARCUS & MILLICHAP REAL ESTATE INVESTMENT SERVICES, INC. AND SUBSIDIARIES
CONSOLIDATED STATEMENTS OF INCOME
(dollar amounts in thousands)
| Six Months Ended June 30, |
Year Ended December 31, | |||||||||||||||||||
| 2013 | 2012 | 2012 | 2011 | 2010 | ||||||||||||||||
| (unaudited) | ||||||||||||||||||||
| Revenues: |
||||||||||||||||||||
| Real estate brokerage commissions |
$ | 156,963 | $ | 133,409 | $ | 351,407 | $ | 245,333 | $ | 198,366 | ||||||||||
| Financing fees |
11,888 | 8,218 | 21,132 | 16,522 | 10,917 | |||||||||||||||
| Other revenues |
5,990 | 5,223 | 13,177 | 12,850 | 8,652 | |||||||||||||||
|
|
|
|
|
|
|
|
|
|
|
|||||||||||
| Total revenues |
174,841 | 146,850 | 385,716 | 274,705 | 217,935 | |||||||||||||||
| Operating expenses: |
||||||||||||||||||||
| Cost of services |
102,677 | 84,709 | 230,248 | 162,478 | 124,272 | |||||||||||||||
| Selling, general, and administrative expense |
53,824 | 45,900 | 103,479 | 85,801 | 76,438 | |||||||||||||||
| Depreciation and amortization expense |
1,514 | 1,495 | 2,981 | 2,971 | 3,333 | |||||||||||||||
|
|
|
|
|
|
|
|
|
|
|
|||||||||||
| Total operating expenses |
158,015 | 132,104 | 336,708 | 251,250 | 204,043 | |||||||||||||||
|
|
|
|
|
|
|
|
|
|
|
|||||||||||
| Operating income |
16,826 | 14,746 | 49,008 | 23,455 | 13,892 | |||||||||||||||
| Other income, net |
249 | 283 | 433 | 350 | 959 | |||||||||||||||
|
|
|
|
|
|
|
|
|
|
|
|||||||||||
| Income before provision for income taxes |
17,075 | 15,029 | 49,441 | 23,805 | 14,851 | |||||||||||||||
| Provision for income taxes |
7,428 | 6,538 | 21,507 | 10,355 | 6,460 | |||||||||||||||
|
|
|
|
|
|
|
|
|
|
|
|||||||||||
| Net income |
$ | 9,647 | $ | 8,491 | $ | 27,934 | $ | 13,450 | $ | 8,391 | ||||||||||
|
|
|
|
|
|
|
|
|
|
|
|||||||||||
See accompanying notes.
F-4
Table of Contents
MARCUS & MILLICHAP REAL ESTATE INVESTMENT SERVICES, INC. AND SUBSIDIARIES
CONSOLIDATED STATEMENTS OF STOCKHOLDERS’ EQUITY
(dollar amounts in thousands)
| Series A Redeemable Preferred Stock |
Common Stock | Additional Paid-In Capital |
Stock Notes Receivable From Employees |
Retained Earnings (Accumulated Deficit) |
Total | |||||||||||||||||||||||||||
| Shares | Amount | Shares | Amount | |||||||||||||||||||||||||||||
| Balance as of December 31, 2009 |
1,000 | $ | 10 | 230,592 | $ | 230 | $ | 18,037 | $ | (29 | ) | $ | (3,675 | ) | $ | 14,573 | ||||||||||||||||
| Net income |
— | — | — | — | — | — | 8,391 | 8,391 | ||||||||||||||||||||||||
| Preferred dividends declared and paid |
— | — | — | — | — | — | (2,000 | ) | (2,000 | ) | ||||||||||||||||||||||
| Deemed capital contribution from Parent |
— | — | — | — | 704 | — | — | 704 | ||||||||||||||||||||||||
| Issuance of restricted stock |
— | — | 3,750 | 4 | 82 | (86 | ) | — | — | |||||||||||||||||||||||
| Payments on stock notes receivable from employees |
— | — | — | — | — | 33 | — | 33 | ||||||||||||||||||||||||
| Canceled and repurchased shares |
— | — | (155 | ) | — | (3 | ) | — | — | (3 | ) | |||||||||||||||||||||
|
|
|
|
|
|
|
|
|
|
|
|
|
|
|
|
|
|||||||||||||||||
| Balance as of December 31, 2010 |
1,000 | 10 | 234,187 | 234 | 18,820 | (82 | ) | 2,716 | 21,698 | |||||||||||||||||||||||
| Net income |
— | — | — | — | — | — | 13,450 | 13,450 | ||||||||||||||||||||||||
| Preferred dividends declared and paid |
— | — | — | — | — | — | (16,526 | ) | (16,526 | ) | ||||||||||||||||||||||
| Deemed capital contribution from Parent |
— | — | — | — | 1,610 | — | — | 1,610 | ||||||||||||||||||||||||
| Issuance of restricted stock |
— | — | 6,462 | 6 | 157 | (163 | ) | — | — | |||||||||||||||||||||||
| Payments on stock notes receivable from employees |
— | — | — | — | — | 56 | — | 56 | ||||||||||||||||||||||||
| Canceled and repurchased shares |
— | — | (10,410 | ) | (10 | ) | (164 | ) | 43 | — | (131 | ) | ||||||||||||||||||||
|
|
|
|
|
|
|
|
|
|
|
|
|
|
|
|
|
|||||||||||||||||
| Balance as of December 31, 2011 |
1,000 | 10 | 230,239 | 230 | 20,423 | (146 | ) | (360 | ) | 20,157 | ||||||||||||||||||||||
| Net income |
— | — | — | — | — | — | 27,934 | 27,934 | ||||||||||||||||||||||||
| Preferred dividends declared and paid |
— | — | — | — | — | — | (30,756 | ) | (30,756 | ) | ||||||||||||||||||||||
| Deemed capital contribution from Parent |
— | — | — | — | 4,209 | — | — | 4,209 | ||||||||||||||||||||||||
| Issuance of restricted stock |
— | — | 3,500 | 4 | 86 | (90 | ) | — | — | |||||||||||||||||||||||
| Payments on stock notes receivable from employees |
— | — | — | — | — | 86 | — | 86 | ||||||||||||||||||||||||
|
|
|
|
|
|
|
|
|
|
|
|
|
|
|
|
|
|||||||||||||||||
| Balance as of December 31, 2012 |
1,000 | 10 | 233,739 | 234 | 24,718 | (150 | ) | (3,182 | ) | 21,630 | ||||||||||||||||||||||
| Net income (unaudited) |
— | — | — | — | — | — | 9,647 | 9,647 | ||||||||||||||||||||||||
| Preferred dividends declared and paid (unaudited) |
— | — | — | — | (24,718 | ) | — | — | (24,718 | ) | ||||||||||||||||||||||
| Deemed capital contribution from Parent (unaudited) |
— | — | — | — | 1,494 | — | — | 1,494 | ||||||||||||||||||||||||
| Issuance of restricted stock (unaudited) |
— | — | 750 | 1 | 20 | (21 | ) | — | — | |||||||||||||||||||||||
| Payments on stock notes receivable from employees (unaudited) |
— | — | — | — | — | 109 | — | 109 | ||||||||||||||||||||||||
|
|
|
|
|
|
|
|
|
|
|
|
|
|
|
|
|
|||||||||||||||||
| Balance as of June 30, 2013 (unaudited) |
1,000 | $ | 10 | 234,489 | $ | 235 | $ | 1,514 | $ | (62 | ) | $ | 6,465 | $ | 8,162 | |||||||||||||||||
|
|
|
|
|
|
|
|
|
|
|
|
|
|
|
|
|
|||||||||||||||||
See accompanying notes.
F-5
Table of Contents
MARCUS & MILLICHAP REAL ESTATE INVESTMENT SERVICES, INC. AND SUBSIDIARIES
CONSOLIDATED STATEMENTS OF CASH FLOWS
(in thousands)
| Six Months Ended June 30, |
Year Ended December 31, | |||||||||||||||||||
| 2013 | 2012 | 2012 | 2011 | 2010 | ||||||||||||||||
| (unaudited) | ||||||||||||||||||||
| Operating activities |
||||||||||||||||||||
| Net income |
$ | 9,647 | $ | 8,491 | $ | 27,934 | $ | 13,450 | $ | 8,391 | ||||||||||
| Adjustments to reconcile net income to net cash provided by operating activities: |
||||||||||||||||||||
| Depreciation and amortization expense |
1,514 | 1,495 | 2,981 | 2,971 | 3,333 | |||||||||||||||
| (Recovery of) provision for bad debt expense |
(97 | ) | 180 | 157 | 311 | 469 | ||||||||||||||
| Stock-based compensation, net of taxes |
1,494 | 1,233 | 4,209 | 1,610 | 704 | |||||||||||||||
| Other non-cash items |
(30 | ) | (3 | ) | 19 | 35 | 56 | |||||||||||||
| Changes in operating assets and liabilities: |
||||||||||||||||||||
| Commissions receivable |
830 | (145 | ) | (3,614 | ) | 738 | (1,454 | ) | ||||||||||||
| Prepaid expenses and other current assets |
(204 | ) | (169 | ) | (644 | ) | (460 | ) | (430 | ) | ||||||||||
| Prepaid rent |
(743 | ) | 386 | 103 | 668 | 2,142 | ||||||||||||||
| Investments in rabbi trust account |
(765 | ) | (297 | ) | (497 | ) | 240 | 950 | ||||||||||||
| Other assets |
326 | (95 | ) | 530 | (1,694 | ) | 1,543 | |||||||||||||
| Due to (from) affiliates |
63,303 | 14,116 | (19,884 | ) | (1,513 | ) | (15,267 | ) | ||||||||||||
| Accounts payable and accrued expenses |
(8,537 | ) | (2,855 | ) | 6,791 | 3,239 | (1,095 | ) | ||||||||||||
| Commissions payable |
(10,678 | ) | (4,149 | ) | 9,004 | (5,511 | ) | 2,741 | ||||||||||||
| Accrued employee expenses |
(11,270 | ) | (5,481 | ) | 7,831 | 686 | 5,395 | |||||||||||||
| Deferred compensation and commissions |
(784 | ) | (778 | ) | 2,495 | 899 | (2,063 | ) | ||||||||||||
| Other liabilities |
296 | (1,044 | ) | (2,061 | ) | 2,147 | (1,303 | ) | ||||||||||||
|
|
|
|
|
|
|
|
|
|
|
|||||||||||
| Net cash provided by operating activities |
44,302 | 10,885 | 35,354 | 17,816 | 4,112 | |||||||||||||||
| Investing activities |
||||||||||||||||||||
| Payments on employee notes receivable |
1,096 | 405 | 458 | 550 | 251 | |||||||||||||||
| Issuances of employee notes receivable |
(306 | ) | (546 | ) | (706 | ) | (310 | ) | (467 | ) | ||||||||||
| Purchase of property and equipment |
(2,420 | ) | (2,022 | ) | (4,563 | ) | (3,083 | ) | (922 | ) | ||||||||||
| Proceeds from sale of property and equipment |
32 | 35 | 174 | 172 | 62 | |||||||||||||||
|
|
|
|
|
|
|
|
|
|
|
|||||||||||
| Net cash used in investing activities |
(1,598 | ) | (2,128 | ) | (4,637 | ) | (2,671 | ) | (1,076 | ) | ||||||||||
| Financing activities |
||||||||||||||||||||
| Payments on obligations under capital leases |
(21 | ) | (77 | ) | (98 | ) | (318 | ) | (600 | ) | ||||||||||
| Payments of initial public offering costs |
(1,819 | ) | — | — | — | — | ||||||||||||||
| Dividends paid to Parent |
(24,718 | ) | (8,097 | ) | (30,756 | ) | (16,526 | ) | (2,000 | ) | ||||||||||
| Repayment of stock notes receivable from employees |
109 | 86 | 86 | 56 | 33 | |||||||||||||||
| Repurchase of shares |
— | — | — | (131 | ) | (3 | ) | |||||||||||||
|
|
|
|
|
|
|
|
|
|
|
|||||||||||
| Net cash used in financing activities |
(26,449 | ) | (8,088 | ) | (30,768 | ) | (16,919 | ) | (2,570 | ) | ||||||||||
|
|
|
|
|
|
|
|
|
|
|
|||||||||||
| Net increase (decrease) in cash and cash equivalents |
16,255 | 669 | (51 | ) | (1,774 | ) | 466 | |||||||||||||
| Cash and cash equivalents at beginning of period |
3,107 | 3,158 | 3,158 | 4,932 | 4,466 | |||||||||||||||
|
|
|
|
|
|
|
|
|
|
|
|||||||||||
| Cash and cash equivalents at end of period |
$ | 19,362 | $ | 3,827 | $ | 3,107 | $ | 3,158 | $ | 4,932 | ||||||||||
|
|
|
|
|
|
|
|
|
|
|
|||||||||||
See accompanying notes.
F-6
Table of Contents
MARCUS & MILLICHAP REAL ESTATE INVESTMENT SERVICES, INC. AND SUBSIDIARIES
CONSOLIDATED STATEMENTS CASH FLOWS (continued)
(in thousands)
| Six Months Ended June 30, |
Year Ended December 31, | |||||||||||||||||||
| 2013 | 2012 | 2012 | 2011 | 2010 | ||||||||||||||||
| (unaudited) | ||||||||||||||||||||
| Supplemental disclosures of cash flow information |
||||||||||||||||||||
| Interest paid during the period |
$ | — | $ | 3 | $ | 4 | $ | 12 | $ | 35 | ||||||||||
|
|
|
|
|
|
|
|
|
|
|
|||||||||||
| Income taxes paid to Parent |
$ | 11,640 | $ | 6,479 | $ | 17,880 | $ | 9,440 | $ | — | ||||||||||
|
|
|
|
|
|
|
|
|
|
|
|||||||||||
| Supplemental disclosures of noncash investing and financing activities |
||||||||||||||||||||
| Deferred offering costs |
$ | 168 | $ | — | $ | — | $ | — | $ | — | ||||||||||
|
|
|
|
|
|
|
|
|
|
|
|||||||||||
| Issuance of restricted stock for notes receivable |
$ | 21 | $ | 90 | $ | 90 | $ | 163 | $ | 86 | ||||||||||
|
|
|
|
|
|
|
|
|
|
|
|||||||||||
| Assets acquired under capital lease |
$ | — | $ | — | $ | — | $ | 121 | $ | — | ||||||||||
|
|
|
|
|
|
|
|
|
|
|
|||||||||||
| Deemed capital contribution from Parent |
$ | 1,494 | $ | 1,233 | $ | 4,209 | $ | 1,610 | $ | 704 | ||||||||||
|
|
|
|
|
|
|
|
|
|
|
|||||||||||
See accompanying notes.
F-7
Table of Contents
MARCUS & MILLICHAP REAL ESTATE INVESTMENT SERVICES, INC. AND SUBSIDIARIES
NOTES TO CONSOLIDATED FINANCIAL STATEMENTS
(dollar amounts in thousands)
1. Organization and Accounting Policies
Marcus & Millichap Real Estate Investment Services, Inc. (the Company) is a brokerage firm specializing in commercial real estate investment sales, financing, research, and advisory services. The Company is majority-owned by Marcus & Millichap Company (the Parent or MMC). Substantially all of the Company’s preferred and common stock outstanding at June 30, 2013, December 31, 2012 and 2011 was held by MMC and its affiliates or officers and employees of the Company.
Basis of Presentation
The Company participates in a tax sharing agreement and a shared services arrangement and other transactions with the Parent. Accordingly, the accompanying consolidated financial statements may not reflect the consolidated financial position, results of operations, and cash flows that would have been achieved if the Company had operated as an unaffiliated company.
Unaudited Consolidated Interim Financial Information
The consolidated balance sheet as of June 30, 2013, the consolidated statements of income and the consolidated statements of cash flows for the six months ended June 30, 2012 and 2013 and the consolidated statement of stockholders’ equity for the six months ended June 30, 2013 are unaudited. The unaudited interim financial statements have been prepared on the same basis as the annual financial statements and, in management’s opinion, reflect all adjustments, consisting only of normal recurring adjustments, necessary to state fairly our financial position as of June 30, 2013 and the consolidated results of operations and cash flows for the six months ended June 30, 2012 and 2013. The financial data and other information disclosed in these notes to the consolidated financial statements related to the six month periods are unaudited. The results of the six months ended June 30, 2013 are not necessarily indicative of the results to be expected for the year ending December 31, 2013.
Consolidation
The accompanying consolidated financial statements include the accounts of the Company and its wholly owned subsidiaries. All significant intercompany balances and transactions have been eliminated in consolidation.
Cash and Cash Equivalents
The Company considers cash and cash equivalents to include short-term, highly liquid investments with maturities of three months or less when purchased. At June 30, 2013, December 31, 2012 and 2011, a significant portion of the balance of cash and cash equivalents was held with three financial institutions.
Management believes the likelihood of realizing material losses from the excess of cash balances over federally insured limits is remote.
Prior to June 30, 2013, the majority of the cash generated and used in the Company’s operations was held in bank accounts with one financial institution that were included in a sweep arrangement with MMC. Pursuant to a treasury management service agreement with that financial institution, the cash was swept daily into MMC’s money market account. The Company collected interest income from MMC at the same interest rate as MMC earned on the money market account. Historically, other than for a 2-week period around MMC’s March 31 fiscal year end, the Company had a receivable from MMC for the cash that was swept. When the sweep arrangement was not in effect, during the week before and the week after March 31, the Company’s cash balances remained in the Company’s bank accounts. As of June 30, 2013, the sweep arrangement with MMC was permanently terminated.
F-8
Table of Contents
MARCUS & MILLICHAP REAL ESTATE INVESTMENT SERVICES, INC. AND SUBSIDIARIES
NOTES TO CONSOLIDATED FINANCIAL STATEMENTS
(dollar amounts in thousands)
Commissions Receivable and Allowance for Doubtful Accounts
Commissions receivable consist primarily of commissions earned for which payment has not yet been received as well as current receivables from agents. The Company establishes an allowance for doubtful accounts based on the specific-identification of potentially uncollectible accounts.
Other Assets
Other assets consist primarily of commission notes receivable, notes receivable from agents and lease deposits.
In connection with real estate brokerage activities, the Company may accept a portion of its commission in the form of a note receivable. Such notes bore interest at an average rate of approximately 5% in fiscal years 2012 and 2011 and are generally due in one to five years.
The notes receivable from agents, along with interest, are collected from future commissions. Any cash receipts on notes are applied first to unpaid principal balance prior to any income being recognized.
The Company establishes an allowance for doubtful accounts based on the specific-identification of potentially uncollectible accounts or commissions notes receivable in accordance with ASC 310. Additionally, accounts and commissions notes receivable that are not specifically identified as being impaired are reviewed for impairment in accordance with ASC 450 based on consideration of historical experience.
Property and Equipment
Property and equipment are stated at cost less accumulated depreciation and amortization. The Company uses the straight-line method for depreciation and amortization. Depreciation is provided over estimated useful lives ranging from three to seven years. Furniture and equipment acquired under capital leases are amortized over the lesser of their estimated useful lives or the related lease term.
The Company leases equipment under capital lease arrangements. The assets and liabilities under capital lease are recorded at the lesser of the present value of aggregate future minimum lease payments, including estimated bargain purchase options, or the fair value of the asset under lease. Assets under capital lease are depreciated using the straight-line method over the lesser of the estimated useful life of the asset or the term of the lease.
The Company evaluates its fixed assets for impairment whenever events or changes in circumstances indicate that the carrying amount of an asset may not be recoverable. The Company believes the carrying amount of property and equipment is recoverable and, therefore, no impairment loss has been recorded for the six months ended June 30, 2013 or for the years ended December 31, 2012, 2011 and 2010.
Deferred Offering Costs
Deferred offering costs, consisting of legal, accounting and other fees and costs relating to the initial public offering, are capitalized and included in prepaid expenses and other current assets in the consolidated balance sheets. The deferred offering costs will be offset against the initial public offering proceeds upon the closing of the initial public offering. There were $1,987 (unaudited) of capitalized deferred offering costs as of June 30, 2013 and no similar costs as of December 31, 2012 or December 31, 2011.
F-9
Table of Contents
MARCUS & MILLICHAP REAL ESTATE INVESTMENT SERVICES, INC. AND SUBSIDIARIES
NOTES TO CONSOLIDATED FINANCIAL STATEMENTS
(dollar amounts in thousands)
Deferred Rent Obligation
Some of the Company’s operating leases contain periods of free or reduced rent or contain predetermined fixed increases in the minimum rent amount during the lease term. For these leases, the Company recognizes rent expense on a straight-line basis over the term of the lease, generally about seven years, including periods of free rent, and records the difference between the amount charged to rent expense and the rent paid as a deferred rent obligation. As of June 30, 2013 and December 31, 2012 and 2011, deferred rent totaled $3,851 (unaudited), $3,170 and $2,760, respectively, and is included in other liabilities and accounts payables and accrued expenses in the accompanying consolidated balance sheets.
Revenue Recognition
The Company generates real estate brokerage commissions by acting as a broker for real estate owners or investors seeking to buy or sell commercial properties. Revenues from real estate brokerage commissions are recognized when there is persuasive evidence of an arrangement, all services have been provided, the price is fixed and determinable and collectability is reasonably assured.
The Company generates financing fees from securing financing on purchase transactions as well as fees earned from refinancing our clients’ existing mortgage debt. Financing fee revenues are recognized at the time the loan closes and there are no remaining significant obligations for performance in connection with the transaction.
Other revenues include fees generated from consulting and advisory services, as well as referral fees from other real estate brokers. Revenues from these services are recognized as they are performed and completed.
Advertising Costs
Advertising costs are expensed as incurred. Advertising expense for six months ended June 30, 2013 and 2012 was $475 (unaudited) and $374 (unaudited), respectively. Advertising expense for the years ended December 31, 2012, 2011 and 2010 was $702, $525 and $439, respectively. Advertising costs are included in selling, general, and administrative expense in the accompanying consolidated statements of income.
Income Taxes
The Company is part of a consolidated federal income tax return and a combined unitary California tax return that are filed by the Parent. The Company and the Parent have entered into a tax-sharing agreement whereby the Company provides for income taxes in its consolidated statements of income using an effective tax rate of 43.5% for the six months ended June 30, 2013 and 2012 and the years ended December 31, 2012, 2011 and 2010, applied to pretax income. The amount derived represents a receivable or obligation of the Company from (to) the Parent that the Company generally settles on a current basis. In addition, all deferred tax assets and liabilities are recorded by the Parent. At June 30, 2013, December 31, 2012 and 2011, amounts due to the Parent under the tax-sharing agreement totaled $8,054 (unaudited), $11,133 and $4,266, respectively.
The Company is subject to the provisions of Financial Accounting Standards Board (FASB) Accounting Standards Codification (ASC) 740, Income Taxes, where FASB Interpretation No. 48, Accounting for Uncertainty in Income Taxes, is primarily codified. It defines the threshold for recognizing the benefits of tax return positions in the financial statements as “more likely than not” to be sustained by the taxing authority and requires measurement of a tax position meeting the more-likely-than-not criterion, based on the largest benefit that is more than 50% likely to be realized. Management has analyzed the Company’s inventory of tax positions
F-10
Table of Contents
MARCUS & MILLICHAP REAL ESTATE INVESTMENT SERVICES, INC. AND SUBSIDIARIES
NOTES TO CONSOLIDATED FINANCIAL STATEMENTS
(dollar amounts in thousands)
taken with respect to all applicable income tax issues for all open tax years (in each respective jurisdiction), and has concluded that no uncertain tax positions are required to be recognized in the Company’s consolidated financial statements.
Stock-Based Compensation
The Company has historically issued stock options and stock appreciation rights, or SARs, to key employees through a book value, stock-based compensation award program. The program allows for employees to exercise stock options in exchange for shares of unvested restricted common stock. The program also allows employees to exercise options through the issuance of notes receivable, which are recourse to the employee.
The grant price and repurchase price of stock-based awards at the grant date and repurchase date are fixed as determined by a valuation formula using book value, as defined by the agreements between the Company and the employees. The stock awards generally vest over a three to five-year period. Under these plans, the Company retains the right to repurchase shares, if certain events occur, which includes termination of employment. In these circumstances, the plan document provides for repurchase proceeds to be settled in the form of a note payable to (former) shareholders or cash, which is settled over a fixed period.
While the Company has entered into the agreements to repurchase the stock and settle the SARs held by employees upon termination of their employment (subject to certain conditions as specified in the agreements), MMC has historically assumed the obligation to make payments to the former shareholders. While the Company recognizes the compensation expense associated with these share-based payment arrangements, the liability has historically been assumed by MMC through a deemed contribution, who then has paid the former shareholders over time. The accounting for the stock options and SARs awards, including MMC’s assumption of our repurchase obligations, is discussed below.
Restricted Common Stock
Since stock options only allow the grantee the right to acquire shares of unvested restricted common stock at book value, which is determined on an annual basis, the Company accounts for the stock options and the related unvested restricted stock, as a single instrument, with a single service period. The service period begins on the option grant date, and extends through the exercise and subsequent vesting period of the restricted stock. The unvested restricted common stock is accounted for in accordance with ASC 718, Share-Based Payments. Increases or decreases in the formula settlement value of unvested restricted stock subsequent to the grant date, are recorded as increases or decreases, respectively, to compensation expense, with decreases limited to the book value of the stock on the date of grant.
As MMC has assumed the Company’s obligation with respect to any appreciation in the value of the underlying vested awards in excess of the employees’ exercise price, MMC is deemed to make a capital contribution to the Company’s additional paid-in capital equal to the amount of compensation expense recorded, net of the applicable taxes. Based on the tax-sharing agreement between the Company and MMC, the tax deduction on the compensation expense recorded by the Company is allocated to MMC. MMC records the liability related to the appreciation in the value of the underlying stock in its consolidated financial statements. To the extent of any depreciation in the value of the underlying vested awards (limited to the amount of any appreciation previously recorded from the employees’ original exercise price), compensation expense is reduced and MMC is deemed to receive a capital distribution.
F-11
Table of Contents
MARCUS & MILLICHAP REAL ESTATE INVESTMENT SERVICES, INC. AND SUBSIDIARIES
NOTES TO CONSOLIDATED FINANCIAL STATEMENTS
(dollar amounts in thousands)
Stock Appreciation Rights
SARs to employees are accounted for in accordance with ASC 718. Similar to the vested stock, compensation expense related to the SARs is to be recorded in each period and is equal to the appreciation in the formula-settlement value of vested SARs at the end of each reporting period-end from the prior reporting period-end.
As MMC has assumed the Company’s obligation with respect to any appreciation in the value of the vested SARs, MMC is deemed to make a capital contribution to the Company’s additional paid-in capital equal to the amount of compensation expense recorded, net of the applicable taxes. Based on the tax-sharing agreement entered between the Company and MMC, the tax deduction on the compensation expense recorded by the Company is allocated to MMC. MMC records the liability related to the appreciation in the value of the underlying stock in its consolidated financial statements. To the extent of any depreciation in the value of the vested SARs (limited to the amount of any appreciation previously recorded), compensation expense is reduced and MMC is deemed to receive a capital distribution.
Fair Value of Financial Instruments
The accounting guidance for fair value measurements applies to all financial assets and financial liabilities that are being measured and reported on a fair value basis. Under the accounting guidance, the Company makes fair value measurements that are classified and disclosed in one of the following three categories:
Level 1: Unadjusted quoted prices in active markets that are accessible at the measurement date for identical, unrestricted assets or liabilities;
Level 2: Quoted prices in markets that are not active, or inputs which are observable, either directly or indirectly, for substantially the full term of the asset or liability, or
Level 3: Inputs reflect management’s best estimate of what market participants would use in pricing the asset or liability at the measurement date. Consideration is given to the risk inherent in the valuation technique and the risk inherent in the inputs to the model.
The fair values of the Company’s financial instruments, including such items in the consolidated financial statement captions as cash and cash equivalents, commissions and notes receivable, due from (to) affiliates, accounts payable and accrued expenses, and commissions payable, approximate their carrying values based on their nature, terms, and interest rates, which approximate current fair value market rates and are considered to be in the Level 1 classification.
Investments held in a rabbi trust account are considered to be in the Level 1 classification.
Recent Accounting Pronouncements
Fair Value Measurement
In May 2011, the FASB issued ASU 2011-04, “Fair Value Measurement (Topic 820)”. The amendments in this ASU change the wording used to describe the requirements for measuring fair value and for disclosing information about fair value measurements. For public companies, the ASU should be applied prospectively for interim and annual periods beginning after December 15, 2011. The requirements of this ASU were adopted during 2012, and they did not have a material impact on the Company’s consolidated financial statements.
Concentration of Credit Risk
Financial instruments that potentially subject the Company to a concentration of credit risk principally consist of cash, due from affiliate, and receivables. Cash is placed with high-credit quality financial institutions.
F-12
Table of Contents
MARCUS & MILLICHAP REAL ESTATE INVESTMENT SERVICES, INC. AND SUBSIDIARIES
NOTES TO CONSOLIDATED FINANCIAL STATEMENTS
(dollar amounts in thousands)
The Company historically has not experienced any losses in its cash and cash equivalent or due from affiliate. The Company maintains allowances for estimated credit losses based on management’s assessment of the likelihood of collection. As of June 30, 2013, December 31, 2012 and December 31, 2011, no individual customer accounted for 10% or more of commissions and notes receivable. For the six months ended June 30, 2013 and 2012, and for the years ended December 31, 2012, 2011 and 2010, no individual customer represented 10% or more of total revenues.
Use of Estimates
The preparation of consolidated financial statements in conformity with United States generally accepted accounting principles (GAAP) requires management to make estimates and assumptions that affect the reported amounts of assets and liabilities and the related disclosures at the date of the consolidated financial statements and the reported amounts of revenues and expenses during the reporting period. Actual results could differ from those estimates.
Segments
ASC 280, “Segment Reporting” (“ASC 280”), establishes standards for reporting information on operating segments in interim and annual financial statements. An operating segment is defined as a component of an enterprise that engages in business activities from which it may earn revenues and incur expenses whose separate financial information is available and is evaluated regularly by the Chief Operating Decision Maker (CODM) or decision making group, to perform resource allocations and performance assessments. The CODM is the Chief Executive Officer and Chief Financial Officer. The CODM reviews financial information presented on an office-by-office basis for purposes of making operating decisions, assessing financial performance and allocating resources. Based on the evaluation of the Company’s financial information, management believes that the Company’s offices represent individual operating segments with similar economic characteristics that meet the criteria for aggregation into a single reportable segment for financial statement purposes. The Company’s financing operations also represent an individual operating segment, which does not meet the thresholds to be presented as a separate reportable segment.
2. Commissions Receivable
Commissions receivable consist of the following:
| June
30, 2013 |
December 31, | |||||||||||
| 2012 | 2011 | |||||||||||
| (unaudited) | ||||||||||||
| Commissions due from buyer/seller |
$ | 3,941 | $ | 5,205 | $ | 1,936 | ||||||
| Due from sales agents |
1,123 | 688 | 357 | |||||||||
| Less allowance for doubtful accounts |
(129 | ) | (129 | ) | (143 | ) | ||||||
|
|
|
|
|
|
|
|||||||
| $ | 4,935 | $ | 5,764 | $ | 2,150 | |||||||
|
|
|
|
|
|
|
|||||||
F-13
Table of Contents
MARCUS & MILLICHAP REAL ESTATE INVESTMENT SERVICES, INC. AND SUBSIDIARIES
NOTES TO CONSOLIDATED FINANCIAL STATEMENTS
(dollar amounts in thousands)
The following table presents the changes in the allowance for doubtful accounts:
| June
30, 2013 |
December 31, | |||||||||||
| 2012 | 2011 | |||||||||||
| (unaudited) | ||||||||||||
| Balance at beginning of period |
$ | (129 | ) | $ | (143 | ) | $ | (198 | ) | |||
| Provision for losses on commissions receivable |
— | — | (5 | ) | ||||||||
| Write-off of uncollectible commissions receivable |
— | 14 | 60 | |||||||||
|
|
|
|
|
|
|
|||||||
| Balance at end of period |
$ | (129 | ) | $ | (129 | ) | $ | (143 | ) | |||
|
|
|
|
|
|
|
|||||||
The Company derives its revenues from a broad range of real estate investors, owners, and users in the United States, none of which individually represents a significant concentration of credit risk. The Company performs ongoing credit evaluations of its customers and debtors and requires collateral on a case-by-case basis.
3. Property and Equipment
Property and equipment consist of the following:
| June
30, 2013 |
December 31, | |||||||||||
| 2012 | 2011 | |||||||||||
| (unaudited) | ||||||||||||
| Computer software and hardware equipment |
$ | 6,255 | $ | 6,211 | $ | 4,488 | ||||||
| Furniture, fixtures, and equipment |
18,463 | 18,394 | 16,464 | |||||||||
| Less accumulated depreciation and amortization |
(17,126 | ) | (17,917 | ) | (15,654 | ) | ||||||
|
|
|
|
|
|
|
|||||||
| $ | 7,592 | $ | 6,688 | $ | 5,298 | |||||||
|
|
|
|
|
|
|
|||||||
Depreciation expense for property and equipment for the six months ended June 30, 2013 and 2012 was $1,514 (unaudited) and $1,495 (unaudited), respectively. Depreciation expense for the years ended December 31, 2012, 2011 and 2010 was $2,981, $2,971 and $3,333, respectively.
Furniture, fixtures and equipment with a net book value of $63 (unaudited), $160 and $545, are recorded under capital leases as of June 30, 2013, December 31, 2012 and 2011, respectively. The related depreciation of these assets is included in depreciation expense.
Payments for certain improvements to the Company’s leased office space are recorded as prepaid rent. Amortization of prepaid rent is recorded over the lease term as an increase to rent expense using the straight-line method.
F-14
Table of Contents
MARCUS & MILLICHAP REAL ESTATE INVESTMENT SERVICES, INC. AND SUBSIDIARIES
NOTES TO CONSOLIDATED FINANCIAL STATEMENTS
(dollar amounts in thousands)
4. Other Assets
Other assets consist of the following:
| June
30, 2013 |
December 31, | |||||||||||
| 2012 | 2011 | |||||||||||
| (unaudited) | ||||||||||||
| Commission notes receivable |
$ | 720 | $ | 739 | $ | 465 | ||||||
| Due from sales agents |
405 | 376 | 366 | |||||||||
| Agent recruiting receivable |
1,563 | 1,766 | 2,859 | |||||||||
| Security deposits and other |
1,048 | 1,084 | 961 | |||||||||
|
|
|
|
|
|
|
|||||||
| $ | 3,736 | $ | 3,965 | $ | 4,651 | |||||||
|
|
|
|
|
|
|
|||||||
5. Other Liabilities
Other liabilities consist of the following:
| June
30, 2013 |
December 31, | |||||||||||
| 2012 | 2011 | |||||||||||
| (unaudited) | ||||||||||||
| Long term deferred rent |
$ | 3,142 | $ | 2,703 | 2,539 | |||||||
| Accrued legal |
1,351 | 1,826 | 3,651 | |||||||||
| Other |
311 | — | 496 | |||||||||
|
|
|
|
|
|
|
|||||||
| $ | 4,804 | $ | 4,529 | $ | 6,686 | |||||||
|
|
|
|
|
|
|
|||||||
6. Related-Party Transactions
Amounts due (to) from affiliates consists of the following:
| June
30, 2013 |
December 31, | |||||||||||
| 2012 | 2011 | |||||||||||
| (unaudited) | ||||||||||||
| Cash sweep receivable from Parent |
$ | — | $ | 71,905 | $ | 45,141 | ||||||
| Advance to Parent |
5,576 | — | — | |||||||||
| Taxes payable to Parent |
(8,054 | ) | (11,133 | ) | (4,266 | ) | ||||||
| General and administrative expenses payable to Parent |
(436 | ) | (383 | ) | (370 | ) | ||||||
|
|
|
|
|
|
|
|||||||
| $ | (2,914 | ) | $ | 60,389 | $ | 40,505 | ||||||
|
|
|
|
|
|
|
|||||||
Prior to June 30, 2013, the majority of the cash generated and used in the Company’s operations was held in bank accounts with one financial institution that were included in a sweep arrangement with MMC. Pursuant to a treasury management service agreement with that financial institution, the cash was swept daily into MMC’s money market account. The Company collected interest income from MMC at the same interest rate as MMC earned on the money market account. Historically, other than for a 2-week period around MMC’s March 31 fiscal year end, the Company had a receivable from MMC for the cash that was swept. When the sweep arrangement was not in effect, during the week before and the week after March 31, the Company’s cash balances remained in the Company’s bank accounts. As of June 30, 2013, the sweep arrangement with MMC was permanently terminated.
F-15
Table of Contents
MARCUS & MILLICHAP REAL ESTATE INVESTMENT SERVICES, INC. AND SUBSIDIARIES
NOTES TO CONSOLIDATED FINANCIAL STATEMENTS
(dollar amounts in thousands)
The Parent has a credit agreement under which, the Company, along with many other entities controlled by the Parent, is a guarantor. The credit agreement comprises two components, a line of credit and a term loan which mature on September 26, 2015 and June 1, 2019, respectively. There are certain covenants that the Company is required to comply with, such as providing an annual audit report, and quarterly financial statements. The Company would be required to satisfy the outstanding obligation upon an event of default as defined in the credit agreement. Under the terms of the guarantee, there is not a specific allocation of liability related to the Company as all guarantors would be combined for paying specific claims. The Company’s guarantee for each component of the credit agreement expires on the respective maturity date. The maximum amount of future payments that the Company could be required to make under the guarantee as of June 30, 2013 is equal to the amount outstanding of $48.7 million (unaudited) ($30.7 million outstanding on the line of credit and $18.0 million advanced under the term loan component of the line). The maximum amount of future payments that the Company could be required to make under the guarantee as of December 31, 2012 is equal to the amount outstanding of $49.7 million ($30.7 million outstanding on the line of credit and $19.0 million advanced under the term loan component of the line). At June 30, 2013 and December 31, 2012, MMC was in compliance with all debt covenants under the terms of the line of credit agreement.
Total dividends declared and paid for the six months ended June 30, 2013 and 2012 were $24,718 (unaudited) and $8,097 (unaudited), respectively. Total dividends declared and paid for the years ended December 31, 2012, 2011 and 2010 were $30,756, $16,526 and $2,000, respectively.
Under a shared services arrangement with MMC, MMC provides services to the Company. During the six months ended June 30, 2013 and 2012, the Company paid $403 (unaudited) and $348 (unaudited) to MMC under the shared services arrangement. In 2012, 2011 and 2010, the Company paid $770, $862 and $477, respectively, to MMC pursuant to this arrangement.
Amounts representing health insurance premiums incurred by MMC on behalf of the Company for six months ended June 30, 2013 and 2012 were $1,805 (unaudited) and $1,571 (unaudited), respectively. Amounts representing health insurance premiums incurred by MMC on behalf of the Company for the years ended December 31, 2012, 2011, and 2010 were $3,471, $2,817 and $2,471 respectively. Such expenses, paid by MMC on behalf of the Company, are allocated to the affected related companies based on individual employee coverage costs.
During the six months ended June 30, 2013 and 2012, MMC incurred $389 (unaudited) and $358 (unaudited), respectively in general and administrative expenses on behalf of the Company. During the years ended December 31, 2012, 2011 and 2010, MMC incurred $457, $826 and $1,256, respectively, in other general and administrative expenses on behalf of the Company. Expenses paid by MMC, such as rent, corporate compensation, and other corporate costs, are allocated on a pro rata basis.
The Company earned interest income from MMC of $74 (unaudited) and $60 (unaudited) for the six months ended June 30, 2013 and 2012, respectively. The Company earned interest income from MMC of $162, $141 and $687 for the years ended December 31, 2012, 2011 and 2010, respectively.
The Company had $58 (unaudited), $51 and $65 of unpaid shared service amounts at June 30, 2013, December 31, 2012 and 2011, respectively, which are included in due to affiliates in the consolidated balance sheets.
The Company issues loans to employees and concurrently recognizes an employee notes receivable. At June 30, 2013, December 31, 2012 and 2011, the aggregate principal amount loaned to employees was $369 (unaudited), $1,157 and $909, respectively.
F-16
Table of Contents
MARCUS & MILLICHAP REAL ESTATE INVESTMENT SERVICES, INC. AND SUBSIDIARIES
NOTES TO CONSOLIDATED FINANCIAL STATEMENTS
(dollar amounts in thousands)
The Parent has wholly owned subsidiaries that buy and sell commercial real estate properties. The Company has performed financing and brokerage services related to these transactions with wholly-owned subsidiaries of MMC. For the six months ended June 30, 2013 and 2012, financing and brokerage service revenue from these transactions with wholly-owned subsidiaries of MMC totaled $382 (unaudited) and $619 (unaudited), respectively. For the years ended December 31, 2012, 2011 and 2010, revenue from these transactions with wholly-owned subsidiaries of MMC totaled $1,116, $847 and $1,493, respectively. MMC Commission expense for these transactions totaled $238 (unaudited) and $370 (unaudited) for the six months ended June 30, 2013 and 2012, respectively. MMC Commission expense for these transactions totaled $690, $526 and $887 for the years ended December 31, 2012, 2011 and 2010, respectively.
The Company has an operating lease with MMC for an office located in California. The lease expires April 30, 2015. Rent expense totaled $179 (unaudited) and $139 (unaudited) for the six months ended June 30, 2013 and 2012, respectively. Rent expense for this office totaled $278 for the years ended December 31, 2012 and 2011, and $279 for the year ended December 31, 2010.
7. Income Taxes
The provision for income taxes attributable to the Company consists of the following:
| Six Months
Ended June 30, |
Year Ended December 31, | |||||||||||||||||||
| 2013 | 2012 | 2012 | 2011 | 2010 | ||||||||||||||||
| (Unaudited) | ||||||||||||||||||||
| Federal |
$ | 6,516 | $ | 5,734 | $ | 18,866 | $ | 9,085 | $ | 5,667 | ||||||||||
| State |
912 | 804 | 2,641 | 1,270 | 793 | |||||||||||||||
|
|
|
|
|
|
|
|
|
|
|
|||||||||||
| $ | 7,428 | $ | 6,538 | $ | 21,507 | $ | 10,355 | $ | 6,460 | |||||||||||
|
|
|
|
|
|
|
|
|
|
|
|||||||||||
The provision for income taxes for the six months ended June 30, 2013 and 2012 and each of the years ended December 31, 2012, 2011 and 2010 differs from the amounts computed by applying the statutory federal corporate income tax rate of 35% to earnings before income taxes as a result of the following:
| Six Months
Ended June 30, |
Year Ended December 31, | |||||||||||||||||||
| 2013 | 2012 | 2012 | 2011 | 2010 | ||||||||||||||||
| (Unaudited) | ||||||||||||||||||||
| Computed expected tax expense |
$ | 5,976 | $ | 5,260 | $ | 17,305 | $ | 8,332 | $ | 5,198 | ||||||||||
| State taxes (net of federal tax effect) |
837 | 736 | 2,423 | 1,165 | 727 | |||||||||||||||
| Permanent differences |
57 | 8 | 8 | 180 | 47 | |||||||||||||||
| Adjustment to tax-sharing rate |
558 | 534 | 1,771 | 678 | 488 | |||||||||||||||
|
|
|
|
|
|
|
|
|
|
|
|||||||||||
| Provision for income taxes |
$ | 7,428 | $ | 6,538 | $ | 21,507 | $ | 10,355 | $ | 6,460 | ||||||||||
|
|
|
|
|
|
|
|
|
|
|
|||||||||||
The tax-sharing agreement with the Parent, as discussed in Note 1, has established a rate of 43.5% for the six months ended June 30, 2013 and 2012, and each of the years ended December 31, 2012, 2011 and 2010 which is utilized to compute the Company’s income tax provision and the resulting amount due from (to) the Parent, which are net of deferred tax assets and liabilities.
F-17
Table of Contents
MARCUS & MILLICHAP REAL ESTATE INVESTMENT SERVICES, INC. AND SUBSIDIARIES
NOTES TO CONSOLIDATED FINANCIAL STATEMENTS
(dollar amounts in thousands)
8. Restricted Common Stock and Stock Appreciation Rights
Restricted Common Stock
The Company grants options under the Program that are exercisable into shares of unvested restricted common stock. The Program is administered by a committee (the Committee). The Committee determines the terms of an award, including the amount, number of rights or shares, and vesting period, among others. Options issued generally have terms of one year or less and the restricted common stock issued upon exercise of the options generally vest over three to five years. The exercise price of the options is based upon a formula equivalent to the net book value of common stock as of the end of the fiscal year immediately preceding the date of issuance. The Company has not formally reserved any shares of its common stock for future stock awards under the Program.
In prior years and during the six months ended June 30, 2013, employees of the Company exercised stock options through the issuance of notes receivable. Cash payments on notes receivable are presented as an increase in consolidated stockholders’ equity. Such notes bear interest at a rate of 5% or 6% per annum and are due in defined installments on various remaining dates through April 15, 2016, which is consistent with the vesting periods of the restricted common stock.
During the years ended December 31, 2011 and 2010, 8,544 and 155 vested shares of common stock were redeemed, respectively. During the year ended December 31, 2011, 1,866 unvested shares were canceled. There were no redemptions or cancelations of common stock during the periods ended June 30, 2013 or June 30, 2012 or the year ended December 31, 2012.
The following is a summary of the Company’s stock option plan activity:
| Six Months Ended June 30, | ||||||||||||||||
| 2013 | 2012 | |||||||||||||||
| (Unaudited) | ||||||||||||||||
| Shares Under Options |
Weighted- Average Exercise Price |
Shares Under Options |
Weighted- Average Exercise Price |
|||||||||||||
| Options outstanding at beginning of period: |
750 | $ | 28.86 | 3,500 | $ | 25.67 | ||||||||||
| Granted |
— | — | — | — | ||||||||||||
| Exercised |
(750 | ) | 28.86 | (3,500 | ) | 25.67 | ||||||||||
|
|
|
|
|
|
|
|
|
|||||||||
| Options outstanding at end of period |
— | $ | — | — | $ | — | ||||||||||
|
|
|
|
|
|
|
|
|
|||||||||
| Year Ended December 31, | ||||||||||||||||||||||||
| 2012 | 2011 | 2010 | ||||||||||||||||||||||
| Shares Under Options |
Weighted- Average Exercise Price |
Shares Under Options |
Weighted- Average Exercise Price |
Shares Under Options |
Weighted- Average Exercise Price |
|||||||||||||||||||
| Options outstanding at beginning of year: |
3,500 | $ | 25.67 | 3,025 | $ | 25.25 | 3,750 | $ | 22.90 | |||||||||||||||
| Granted |
750 | 28.86 | 6,937 | 25.47 | 3,025 | 25.25 | ||||||||||||||||||
| Exercised |
(3,500 | ) | 25.67 | (6,462 | ) | 25.27 | (3,750 | ) | 22.90 | |||||||||||||||
|
|
|
|
|
|
|
|
|
|
|
|
|
|||||||||||||
| Options outstanding at end of year |
750 | $ | 28.86 | 3,500 | $ | 25.67 | 3,025 | $ | 25.25 | |||||||||||||||
|
|
|
|
|
|
|
|
|
|
|
|
|
|||||||||||||
F-18
Table of Contents
MARCUS & MILLICHAP REAL ESTATE INVESTMENT SERVICES, INC. AND SUBSIDIARIES
NOTES TO CONSOLIDATED FINANCIAL STATEMENTS
(dollar amounts in thousands)
The following is a summary of the Company’s restricted common stock activity:
| Six Months Ended June 30, | ||||||||||||||||
| 2013 | 2012 | |||||||||||||||
| (Unaudited) | ||||||||||||||||
| Restricted Stock |
Weighted- Average Grant Date Fair Value |
Restricted Stock |
Weighted- Average Grant Date Fair Value |
|||||||||||||
| Restricted common stock outstanding at beginning of period: |
27,999 | $ | 23.36 | 24,499 | $ | 23.36 | ||||||||||
| Issued upon exercise of stock options |
750 | 28.86 | 3,500 | 25.67 | ||||||||||||
| Canceled |
— | — | — | — | ||||||||||||
| Repurchased |
— | — | — | — | ||||||||||||
|
|
|
|
|
|
|
|
|
|||||||||
| Restricted common stock outstanding at end of period |
28,749 | $ | 23.76 | 27,999 | $ | 23.67 | ||||||||||
|
|
|
|
|
|
|
|
|
|||||||||
| Restricted common stock vested at end of period |
26,605 | 22,682 | ||||||||||||||
| Restricted common stock unvested at end of period |
2,144 | 5,317 | ||||||||||||||
| Year Ended December 31, | ||||||||||||||||||||||||
| 2012 | 2011 | 2010 | ||||||||||||||||||||||
| Restricted Stock |
Weighted- Average Grant Date Fair Value |
Restricted Stock |
Weighted- Average Grant Date Fair Value |
Restricted Stock |
Weighted- Average Grant Date Fair Value |
|||||||||||||||||||
| Restricted common stock outstanding at beginning of year: |
24,499 | $ | 23.36 | 28,447 | $ | 20.95 | 24,852 | $ | 20.12 | |||||||||||||||
| Issued upon exercise of stock options |
3,500 | 25.87 | 6,462 | 25.28 | 3,750 | 23.02 | ||||||||||||||||||
| Canceled |
— | — | (1,866 | ) | 23.07 | — | — | |||||||||||||||||
| Repurchased |
— | — | (8,544 | ) | 15.40 | (155 | ) | 22.05 | ||||||||||||||||
|
|
|
|
|
|
|
|
|
|
|
|
|
|||||||||||||
| Restricted common stock outstanding at end of year |
27,999 | $ | 23.67 | 24,499 | $ | 23.36 | 28,447 | $ | 20.95 | |||||||||||||||
|
|
|
|
|
|
|
|
|
|
|
|
|
|||||||||||||
| Restricted common stock vested at end of year |
22,682 | 18,960 | 24,881 | |||||||||||||||||||||
| Restricted common stock unvested at end of year |
5,317 | 5,539 | 3,566 | |||||||||||||||||||||
F-19
Table of Contents
MARCUS & MILLICHAP REAL ESTATE INVESTMENT SERVICES, INC. AND SUBSIDIARIES
NOTES TO CONSOLIDATED FINANCIAL STATEMENTS
(dollar amounts in thousands)
SARs
The following is a summary of the Company’s SARs plan activity:
| Period Ended June 30, | Year Ended December 31, | |||||||||||||||||||
| 2013 | 2012 | 2012 | 2011 | 2010 | ||||||||||||||||
| (Unaudited) | ||||||||||||||||||||
| SARs outstanding at beginning of period: |
28,733 | 27,983 | 27,983 | 31,456 | 28,602 | |||||||||||||||
| Granted |
— | — | 750 | 6,937 | 3,025 | |||||||||||||||
| Canceled |
— | — | — | (1,866 | ) | — | ||||||||||||||
| Repurchased |
— | — | — | (8,544 | ) | (171 | ) | |||||||||||||
|
|
|
|
|
|
|
|
|
|
|
|||||||||||
| SARs outstanding at end of period |
28,733 | 27,983 | 28,733 | 27,983 | 31,456 | |||||||||||||||
|
|
|
|
|
|
|
|
|
|
|
|||||||||||
| SARs vested at end of period |
26,589 | 22,666 | 22,666 | 18,944 | 24,865 | |||||||||||||||
|
|
|
|
|
|
|
|
|
|
|
|||||||||||
The total formula-settlement value and total compensation cost related to non-vested stock and SARs are as follows:
| Six Months Ended June 30, |
Year Ended December 31, |
|||||||||||||||||||
| 2013 | 2012 | 2012 | 2011 | 2010 | ||||||||||||||||
| (Unaudited) | ||||||||||||||||||||
| Stock |
$ | 359 | $ | 520 | $ | 447 | $ | 615 | $ | 400 | ||||||||||
| Rights under SARs |
$ | 298 | $ | 387 | $ | 371 | $ | 458 | $ | 249 | ||||||||||
The total compensation cost related to unvested stock and SARs is expected to be recognized over approximately four years. Restricted common stock issued upon exercise of stock options generally vest over three to five years and stock options typically are exercised immediately for a note receivable.
During the six months ended June 30, 2013 and 2012, total stock based compensation expense was $2,626 (unaudited) and $2,183 (unaudited), respectively. During 2012, 2011 and 2010, an aggregate credit and charge to compensation expense related to the change in the formula-settlement value of vested stock over each employee’s exercise price and vested SARs was $7,448, $2,851 and $1,246, respectively.
The total fair value of stock and SARs that vested during the periods ended June 30 and the years ended December 31 was as follows:
| Period Ended June 30, |
Year Ended December 31, |
|||||||||||||||||||
| 2013 | 2012 | 2012 | 2011 | 2010 | ||||||||||||||||
| (Unaudited) | ||||||||||||||||||||
| Stock |
$ | 88 | $ | 95 | $ | 961 | $ | 471 | $ | 135 | ||||||||||
| Rights under SARs |
$ | 73 | $ | 71 | $ | 818 | $ | 358 | $ | 45 | ||||||||||
F-20
Table of Contents
MARCUS & MILLICHAP REAL ESTATE INVESTMENT SERVICES, INC. AND SUBSIDIARIES
NOTES TO CONSOLIDATED FINANCIAL STATEMENTS
(dollar amounts in thousands)
9. Stockholders’ Equity
Series A Redeemable Preferred Stock
The Company had 1,000 shares of Series A Redeemable Preferred Stock (Series A Preferred) issued and outstanding as of June 30, 2013, December 31, 2012 and 2011. The terms are discussed below.
Dividends
The stockholders of Series A Preferred are entitled to receive dividends, payable in preference and priority to any distribution on common stock, at a rate determined by the Board of Directors, when and as declared by the Board of Directors. The right to dividends on the Series A Preferred is not cumulative, and no right accrues to the holders of Series A Preferred by reason of the fact that dividends on such shares are not declared and paid in any prior year, nor are any undeclared or unpaid dividends entitled to bear or accrue interest. No dividend shall be paid with respect to common stock unless Series A Preferred stockholders receive a dividend return in such year in the amount of $10 for each outstanding share of Series A Preferred. To the extent that dividends are declared on any common share, a dividend in an equal amount shall be paid on each outstanding share of Series A Preferred. Dividends in the amount of $24,718 (unaudited) and $8,097 (unaudited) were declared and paid during the six months ended June 30, 2013 and 2012, respectively, for Series A Preferred. Dividends in the amount of $30,756, $16,526 and $2,000 were declared and paid during the years ended December 31, 2012, 2011 and 2010, respectively, for Series A Preferred. No dividends were declared for common stock for the six months ended June 30, 2013 and 2012 and in the years ended December 31, 2012, 2011 and 2010.
Liquidation Preference
In the event of voluntary or involuntary liquidation, the Series A Preferred stockholders are entitled to be paid, before any payment shall be made in respect of the Company’s common stock, an amount equal to $10 per share of Series A Preferred plus all accrued but unpaid dividends for each share of Series A Preferred. If, upon liquidation, the assets of the Company available for distribution to its stockholders are insufficient to pay the holders of Series A Preferred, the entire remaining assets of the Company available for distribution shall be distributed ratably among the holders of the Series A Preferred in proportion to the full amount to which they would otherwise be respectively entitled.
After the payment or setting apart for payment to the holders of the Series A Preferred, the remaining assets and funds of the Company available for distribution to the stockholders shall be distributed among the holders of common stock pro rata on the basis of the number of shares of common stock then outstanding.
Redemption
The Company may redeem any or all shares of Series A Preferred by paying an amount equal to $10 per share plus all declared and unpaid dividends with respect to such shares at the redemption date. Series A Preferred shares do not convert to common stock.
Voting Rights
The Series A Preferred stockholders do not have voting rights.
F-21
Table of Contents
MARCUS & MILLICHAP REAL ESTATE INVESTMENT SERVICES, INC. AND SUBSIDIARIES
NOTES TO CONSOLIDATED FINANCIAL STATEMENTS
(dollar amounts in thousands)
10. Retirement Plans
The Company participates in a defined contribution plan (the Contribution Plan), provided by the Parent under Section 401(k) of the Internal Revenue Code, for all eligible employees of the Company who have completed one month of service and have reached age 21. The Contribution Plan is subject to the provisions of the Employee Retirement Income Security Act of 1974, as amended. Participants may contribute up to 100% of their annual eligible compensation, with a maximum contribution of $17.5 and $17 for calendar years 2013 and 2012, respectively, and $16.5 for the calendar years 2011 and 2010. An additional $5.5 contribution is allowed for participants age 50 or older. The Company also maintains a matching program for its employees for up to a maximum of $1 per eligible employee per year. Contributions totaled $194 (unaudited) for the six months ended June 30, 2013; however, no contributions were made for the years ended December 31, 2012, 2011 and 2010. Participants are entitled to retirement benefits at age 59 1/2.
During fiscal year 2001, the Company established the Marcus & Millichap Real Estate Investment Brokerage Company Deferred Compensation Plan (the Deferred Compensation Plan) for a select group of management. The Deferred Compensation Plan has similar characteristics of a 401(k) plan and provides the Deferred Compensation Plan participants additional flexibility in terms of contribution and distribution elections.
Participants may elect to invest in various equity and debt securities offered within the Deferred Compensation Plan program. The Company chose to fund the Deferred Compensation Plan through variable life insurance policies purchased for the participants’ benefit. The Deferred Compensation Plan is managed by a third-party institutional fund manager, and the deferred compensation and investment earnings are held as a Company asset in a rabbi trust. This trust account is restricted unless the Company becomes insolvent, as defined in the Deferred Compensation Plan, in which case the Deferred Compensation Plan’s assets are subject to the claims of the Company’s creditors.
The Company may also, in its sole and absolute discretion, elect to withdraw at any time all or a portion of the amount by which the fair market value of the Deferred Compensation Plan’s assets exceeds 110% of the aggregate amount credited to the Deferred Compensation Plan’s participants’ accounts, as defined by the Deferred Compensation Plan. The deferred compensation liability was $3,204 (unaudited), $2,421 and $1,932 at June 30, 2013, December 31, 2012 and 2011, respectively, and is included in other liabilities on the consolidated balance sheets.
The net change in the carrying value of the investment assets and the related obligation are recorded in other income and selling, general, and administrative expense, respectively, in the accompanying consolidated statements of income.
11. Commitments and Contingencies
Total rental expense under the Company’s operating leases was $7,939 (unaudited) and $7,562 (unaudited) for the six months ended June 30, 2013 and 2012, respectively. Rental expense was $14,453, $15,087 and $16,493 for the years ended December 31, 2012, 2011 and 2010 respectively. Rental expense is included in selling, general, and administrative expense.
F-22
Table of Contents
MARCUS & MILLICHAP REAL ESTATE INVESTMENT SERVICES, INC. AND SUBSIDIARIES
NOTES TO CONSOLIDATED FINANCIAL STATEMENTS
(dollar amounts in thousands)
As of December 31, 2012, the future minimum lease payments under non-cancelable operating leases for office facilities and automobile leases with terms in excess of one year are as follows:
| Year ending December 31: |
||||
| 2013 |
$ | 10,770 | ||
| 2014 |
9,581 | |||
| 2015 |
8,021 | |||
| 2016 |
5,088 | |||
| 2017 |
1,665 | |||
| Thereafter |
1,629 | |||
|
|
|
|||
| $ | 36,754 | |||
|
|
|
Certain facility leases provide for rental escalations related to increases in the lessors’ direct operating expenses.
The Company is obligated under capital lease arrangements for certain equipment. At June 30, 2013, December 31, 2012 and 2011, the amount of equipment recorded in property and equipment under capital leases was $63 (unaudited), $160 and $545, respectively.
As of December 31, 2012, the future minimum lease payments under capital leases for equipment are as follows:
| Year ending December 31: |
||||
| 2013 |
$ | 305 | ||
| 2014 |
186 | |||
| 2015 |
86 | |||
| 2016 |
9 | |||
| 2017 |
— | |||
| Thereafter |
— | |||
|
|
|
|||
| $ | 586 | |||
|
|
|
Litigation
In relation to litigation, the Company is subject to various legal proceedings and claims that arise in the ordinary course of business. If the Company determines that it is probable that a loss has been incurred and the amount is reasonable estimable, the Company will record a liability. The Company has determined that it does not have a potential liability related to any legal proceedings or claims that would individually or in the aggregate materially adversely affect its financial conditions or operating results.
12. Subsequent Events
In July 2013, dividends in the amount of $6,463 (unaudited) were declared and paid for Series A Preferred.
F-23
Table of Contents
![]()
Table of Contents
Shares
Common Stock
PROSPECTUS
Citigroup
Goldman, Sachs & Co.
JMP Securities
William Blair
Through and including , 2013 (the 25th day after the date of this prospectus), all dealers effecting transactions in these securities, whether or not participating in this offering, may be required to deliver a prospectus. This is in addition to a dealer’s obligation to deliver a prospectus when acting as an underwriter and with respect to an unsold allotment or subscription.
Table of Contents
PART II
INFORMATION NOT REQUIRED IN PROSPECTUS
| Item 13. | Other Expenses of Issuance and Distribution |
The following table sets forth the costs and expenses, other than underwriting discounts and commissions, payable by us in connection with the sale of common stock being registered. All amounts are estimates except the SEC registration fee, the FINRA filing fee and the stock exchange listing fee.
| Amount to be Paid |
||||
| SEC registration fee |
$14,117.40 | |||
| FINRA filing fee |
* | |||
| Stock exchange listing fee |
* | |||
| Printing and engraving expenses |
* | |||
| Legal fees and expenses |
* | |||
| Accounting fees and expenses |
* | |||
| Blue Sky qualification fees and expenses |
* | |||
| Transfer Agent and Registrar fees |
* | |||
| Miscellaneous fees and expenses |
* | |||
|
|
|
|||
| Total |
* | |||
|
|
|
|||
| * | to be filed by amendment |
| Item 14. | Indemnification of Directors and Officers |
Section 145 of the DGCL provides that a corporation may indemnify directors and officers as well as other employees and individuals against expenses (including attorneys’ fees), judgments, fines and amounts paid in settlement in connection with any threatened, pending or completed action, suit or proceeding, whether civil, criminal, administrative or investigative, in which such person is made a party by reason of the fact that the person is or was a director, officer, employee or agent of the corporation (other than an action by or in the right of the corporation—a “derivative action”), if such person acted in good faith and in a manner such person reasonably believed to be in or not opposed to the best interests of the corporation and, with respect to any criminal action or proceeding, had no reasonable cause to believe such person’s conduct was unlawful. A similar standard is applicable in the case of derivative actions, except that indemnification only extends to expenses (including attorneys’ fees) incurred in connection with the defense or settlement of such action, and the statute requires court approval before there can be any indemnification where the person seeking indemnification has been found liable to the corporation. The statute provides that it is not exclusive of other indemnification that may be granted by a corporation’s by-laws, disinterested director vote, stockholder vote, agreement or otherwise.
Our certificate of incorporation will limit the liability of our directors to the maximum extent permitted by Delaware law. Delaware law provides that directors will not be personally liable for monetary damages for breach of their fiduciary duties as directors, except with respect to liability:
| • | for any breach of the director’s duty of loyalty to our company or our stockholders; |
| • | for any act or omission not in good faith or which involved intentional misconduct or a knowing violation of law; |
| • | for unlawful payments of dividends or unlawful stock repurchases or redemptions as provided in Section 174 of the DGCL; and |
| • | for any transaction from which the director derived an improper personal benefit. |
II-1
Table of Contents
However, if the DGCL is amended to authorize corporate action further eliminating or limiting the personal liability of directors, then the liability of our directors will be eliminated or limited to the fullest extent permitted by the DGCL, as so amended. The modification or repeal of this provision of our amended and restated certificate of incorporation will not adversely affect any right or protection of a director existing at the time of such modification or repeal.
Our certificate of incorporation and bylaws will provide that we will, to the fullest extent from time to time permitted by law, indemnify our directors and officers against all liabilities and expenses in any suit or proceeding, arising out of their status as an officer or director or their activities in these capacities. We will also indemnify any person who, at our request, is or was serving as a director, officer, trustee, employee or agent of another corporation, partnership, joint venture, trust or other enterprise. We may, by action of our Board of Directors, provide indemnification to our employees and agents within the same scope and effect as the foregoing indemnification of directors and officers. In addition, we intend to enter into separate indemnification agreements with each of our directors and executive officers, which may be broader than the specific indemnification provisions contained in the DGCL. These indemnification agreements may require us, among other things, to indemnify our directors and officers against liabilities that may arise by reason of their status or service as directors or officers, other than liabilities arising from willful misconduct.
The right to be indemnified will include the right of an officer or a director to be paid expenses, including attorneys’ fees, in advance of the final disposition of any proceeding, provided that, if required by law, we receive an undertaking to repay such amount if it will be determined that he or she is not entitled to be indemnified.
| Item 15. | Recent Sales of Unregistered Securities |
Since June 1, 2010, MMREIS has granted to some of its officers and employees options to purchase an aggregate of 10,462 shares of common stock at prices ranging from $25.28 to $28.86, for an aggregate purchase price of $268,529. The issuances of the above securities were deemed to be exempt from registration under the Securities Act in reliance on Section 4(2) of such Securities Act as transactions by an issuer not involving any public offering. The recipients of securities in each such transaction represented their intentions to acquire the securities for investment only and not with a view to or for sale in connection with any distribution thereof and appropriate legends were affixed to the share certificates and warrants issued in such transactions. All recipients had adequate access, through their relationships with the company, to information about MMREIS.
Prior to completion of this offering, the existing shareholders of MMREIS will contribute their shares to us in exchange for shares of our common stock based on an assumed public offering price of $ (the midpoint of the price range set forth on the cover page of the prospectus that is part of this registration statement). Other than MMC, which is the majority shareholder of MMREIS, the MMREIS shareholders are currently directors or managing directors of MMREIS and constitute accredited investors as defined by Rule 501 of Regulation D. We intend to issue such shares of our common stock to existing MMREIS shareholders in reliance on Section 4(2) of the Securities Act.
| Item 16. | Exhibits and Financial Statement Schedules |
(a) Exhibits. The attached Exhibit Index is incorporated herein by reference.
(b) Financial Statement Schedules. Schedules not listed above have been omitted because the information required to be set forth therein is not applicable or is shown in the financial statements or notes thereto.
| Item 17. | Undertakings |
The undersigned registrant hereby undertakes to provide to the underwriters at the closing specified in the underwriting agreements certificates in such denominations and registered in such names as required by the underwriters to permit prompt delivery to each purchaser.
Insofar as indemnification for liabilities arising under the Securities Act of 1933 may be permitted to directors, officers and controlling persons of the registrant pursuant to the foregoing provisions, or otherwise, the
II-2
Table of Contents
registrant has been advised that in the opinion of the Securities and Exchange Commission such indemnification is against public policy as expressed in the Act, and is, therefore, unenforceable. In the event that a claim for indemnification against such liabilities (other than the payment by the registrant of expenses incurred or paid by a director, officer, or controlling person of the registrant in the successful defense of any action, suit or proceeding) is asserted by such director, officer or controlling person in connection with the securities being registered, the registrant will, unless in the opinion of its counsel the matter has been settled by controlling precedent, submit to a court of appropriate jurisdiction the question whether such indemnification by it is against public policy as expressed in the Act and will be governed by the final adjudication of such issue.
The undersigned registrant hereby undertakes that:
(1) For purposes of determining any liability under the Securities Act of 1933, the information omitted from the form of prospectus filed as part of this registration statement in reliance upon Rule 430A and contained in a form of prospectus filed by the registrant pursuant to Rule 424(b)(1) or (4) or 497(h) under the Securities Act shall be deemed to be part of this registration statement as of the time it was declared effective.
(2) For the purpose of determining any liability under the Securities Act of 1933, each post-effective amendment that contains a form of prospectus shall be deemed to be a new registration statement relating to the securities offered therein, and the offering of such securities at that time shall be deemed to be the initial bona fide offering thereof.
II-3
Table of Contents
SIGNATURES
Pursuant to the requirements of the Securities Act of 1933, the registrant has duly caused this registration statement to be signed on its behalf by the undersigned, thereunto duly authorized, in the city of Calabasas, State of California on September 23, 2013.
| MARCUS & MILLICHAP, INC. | ||
| By: | /s/ John J. Kerin | |
| John J. Kerin | ||
| President and Chief Executive Officer | ||
POWER OF ATTORNEY
KNOW ALL PERSONS BY THESE PRESENTS, that each person whose signature appears below hereby constitutes and appoints, jointly and severally, George M. Marcus, John J. Kerin and Martin E. Louie, and each of them, as his attorney-in-fact, with full power of substitution, for him in any and all capacities, to sign any and all amendments to this Registration Statement (including post-effective amendments), and any and all Registration Statements filed pursuant to Rule 462 under the Securities Act of 1933, as amended, in connection with or related to the offering contemplated by this Registration Statement and its amendments, if any, and to file the same, with exhibits thereto and other documents in connection therewith, with the Securities and Exchange Commission, hereby ratifying and confirming our signatures as they may be signed by our said attorney to any and all amendments to said Registration Statement.
Pursuant to the requirements of the Securities Act of 1933, this Registration Statement has been signed by the following persons in the capacities and on the dates indicated:
| Signature |
Title |
Date | ||
| /s/ John J. Kerin John J. Kerin |
Director, President and Chief Executive Officer (Principal Executive Officer) |
September 23, 2013 | ||
| /s/ Martin E. Louie Martin E. Louie |
Chief Financial Officer (Principal Financial Officer and Principal Accounting Officer) |
September 23, 2013 | ||
| /s/ George M. Marcus George M. Marcus |
Director | September 23, 2013 | ||
| /s/ William A. Millichap William A. Millichap |
Director | September 23, 2013 | ||
Table of Contents
EXHIBIT INDEX
| Number |
Description | |
| 1.1* | Form of Underwriting Agreement dated , 2013. | |
| 3.1 | Certificate of Incorporation of Marcus & Millichap, Inc., as currently in effect | |
| 3.2 | Amended and Restated Certificate of Incorporation of Marcus & Millichap, Inc., to become effective upon closing of the offering. | |
| 3.3 | Bylaws of Marcus & Millichap, Inc., as currently in effect | |
| 3.4 | Amended and Restated Bylaws of Marcus & Millichap, Inc., to become effective upon closing of the offering. | |
| 4.1 | Specimen Stock Certificate. | |
| 5.1* | Opinion of Orrick, Herrington & Sutcliffe LLP regarding the legality of the common stock being registered. | |
| 10.1 | Form of Contribution Agreement by and among Marcus & Millichap, Inc., Marcus & Millichap Company, and certain other shareholders of Marcus & Millichap Real Estate Investment Services, Inc. to be entered into prior to the completion of the offering. | |
| 10.2 | Form of Debt-for-Equity Exchange Agreement by and among Marcus & Millichap Company, George M. Marcus, William A. Millichap, The Donald and Beverly Lorenz Living Trust, and Lorenz Capital Assets, L.P., and with respect to certain sections therein, Marcus & Millichap, Inc. to be entered into prior to completion of the offering. | |
| 10.3 | Form of Separation and Distribution Agreement by and between Marcus & Millichap, Inc. and Marcus & Millichap Company to be entered into prior to the completion of the offering. | |
| 10.4 | Form of Tax Matters Agreement by and between Marcus & Millichap, Inc. and Marcus & Millichap Company to be entered into prior to the completion of the offering. | |
| 10.5 | Form of Transition Services Agreement by and between Marcus & Millichap, Inc. and Marcus & Millichap Company to be entered into prior to the completion of the offering. | |
| 10.6† | President and Chief Executive Officer Employment Agreement by and between Marcus & Millichap Real Estate Investment Services, Inc. and John J. Kerin, dated July 1, 2010. | |
| 10.7† | Form of Indemnification Agreement between Marcus & Millichap, Inc. and each of its Officers and Directors. | |
| 10.8†* | Form of 2013 Omnibus Equity Incentive Plan to become effective prior to the completion of the offering. | |
| 10.9† | Form of Deferred Stock Unit Award Agreement under 2013 Omnibus Equity Incentive Plan. | |
| 10.10† | Form of Stock Option Award Agreement under 2013 Omnibus Equity Incentive Plan. | |
| 10.11† | Form of Restricted Stock Unit Award Agreement under 2013 Omnibus Equity Incentive Plan. | |
| 10.12†* | Form of 2013 Employee Stock Purchase Plan to become effective prior to the completion of the offering. | |
| 10.13† | Form of Amendment, Restatement and Freezing of Stock Appreciation Rights Agreement. | |
| 10.14† | Form of Amendment, Restatement and Freezing of Stock Appreciation Rights Agreement (Section 409A grandfathered). | |
| 10.15† | Form of Sale Restriction Agreement. | |
| 21.1 | List of Subsidiaries. | |
Table of Contents
| Number |
Description | |
| 23.1 | Consent of Ernst & Young LLP. | |
| 23.2* | Consent of Orrick, Herrington & Sutcliffe LLP (included in Exhibit 5.1). | |
| 24.1 | Power of Attorney (included on the signature page to this Registration Statement). | |
| 99.1 | Consent of Norma J. Lawrence to be named as a director nominee. | |
| 99.2 | Consent of George T. Shaheen to be named as a director nominee. | |
| 99.3 | Consent of Don C. Watters to be named as a director nominee. | |
| 99.4 | Consent of Nicholas F. McClanahan to be named as a director nominee. | |
| * | To be filed by amendment. |
| † | Indicates management contract or compensatory plan. |