Attached files
| file | filename |
|---|---|
| 8-K - 8-K - PINNACLE WEST CAPITAL CORP | a13-21036_18k.htm |
Exhibit 99.1
|
|
RENEWABLE ENERGY RISES WITH THE SUN Sanford C. Bernstein & Co. Renewables Conference September 23, 2013 Barbara D. Lockwood, P.E. General Manager, Energy Innovation |
|
|
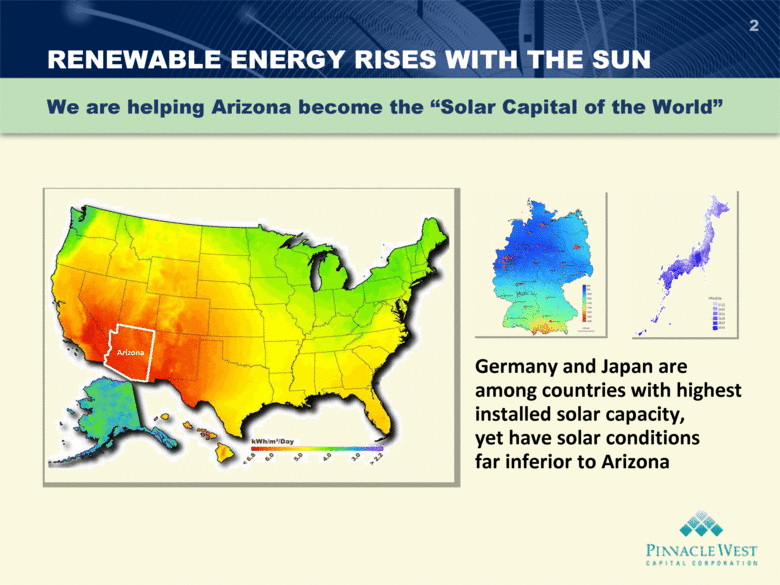
2 RENEWABLE ENERGY RISES WITH THE SUN We are helping Arizona become the “Solar Capital of the World” Germany and Japan are among countries with highest installed solar capacity, yet have solar conditions far inferior to Arizona Arizona Arizona |
|
|
3 Renewable Energy (RES) Minimum Requirements Portion of retail sales to be supplied by renewable resources 5% by 2015 15% by 2025 Distributed energy component 30% of total requirement by 2012 APS on track to approximately double 2015 requirement Pursuant to 2009 regulatory settlement Our programs address Arizona’s aggressive renewable energy standard ARIZONA’S RENEWABLE RESOURCE AND ENERGY EFFICIENCY STANDARDS APS ranked 4th nationally for solar installations in 2012 Solar Electric Power Association |
|
|
RENEWABLE GENERATION MIX 4 We are making good progress; our renewable resources will be predominantly solar 2012 2015 5.3% of retail sales 12% of retail sales (projected) Solar 70% Wind 24% Geothermal 2% Biomass/Biogas 4% Solar 40% Wind 47% Geothermal 4% Biomass/Biogas 9% |
|
|
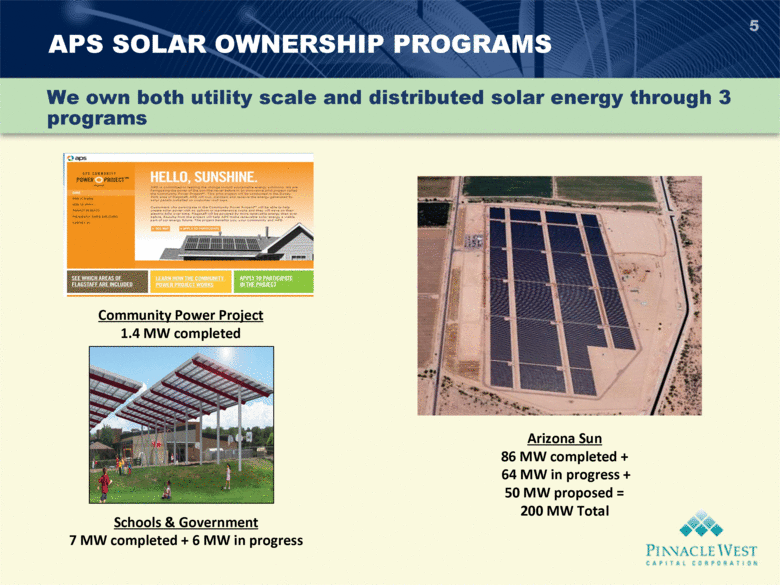
5 We own both utility scale and distributed solar energy through 3 programs APS SOLAR OWNERSHIP PROGRAMS Arizona Sun 86 MW completed + 64 MW in progress + 50 MW proposed = 200 MW Total Community Power Project 1.4 MW completed Schools & Government 7 MW completed + 6 MW in progress |
|
|
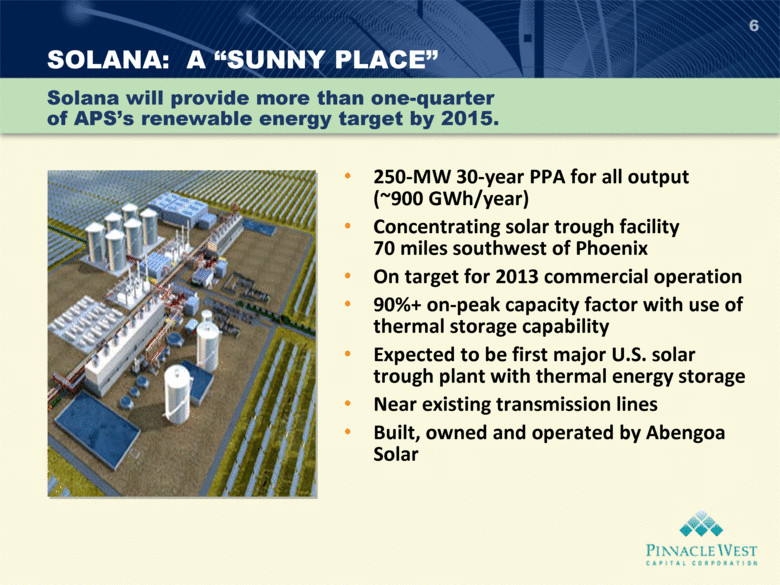
SOLANA: A “SUNNY PLACE” 6 250-MW 30-year PPA for all output (~900 GWh/year) Concentrating solar trough facility 70 miles southwest of Phoenix On target for 2013 commercial operation 90%+ on-peak capacity factor with use of thermal storage capability Expected to be first major U.S. solar trough plant with thermal energy storage Near existing transmission lines Built, owned and operated by Abengoa Solar Solana will provide more than one-quarter of APS’s renewable energy target by 2015. |
|
|
ROOFTOP SOLAR INCENTIVES IN ARIZONA 7 Incentives for photovoltaic systems have come down dramatically over time $0.00 $0.50 $1.00 $1.50 $2.00 $2.50 $3.00 Incentive Step-down 2009 2010 2011 2012 2013 15MW 19MW 23MW 44MW 47MW Estimated Capacity Distributed Solar Energy deployment has risen significantly in the last 5 years due to the following: – Reduction of installed costs – Customer finance models – Federal and state investment credits – Utility net metering and cash incentives |
|
|
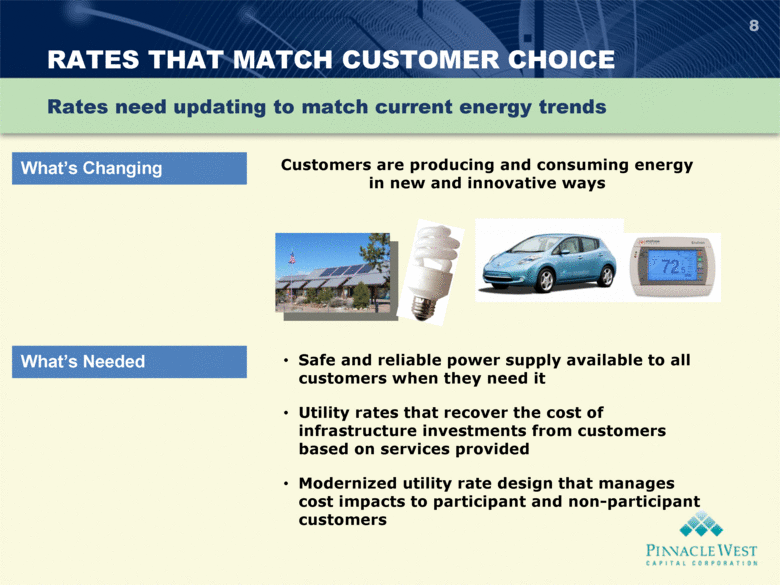
RATES THAT MATCH CUSTOMER CHOICE 8 Rates need updating to match current energy trends What’s Changing What’s Needed Customers are producing and consuming energy in new and innovative ways Safe and reliable power supply available to all customers when they need it Utility rates that recover the cost of infrastructure investments from customers based on services provided Modernized utility rate design that manages cost impacts to participant and non-participant customers |
|
|
LONG TERM OUTLOOK 9 Renewable energy will continue to increase over time and, in Arizona, it will predominately be solar Energy storage is not cost effective today - and is not likely to be in the near future Absent cost effective energy storage, flexible gas generation will be needed to accommodate increasing penetrations of renewable energy Current grid modernization efforts will be important to accommodate high levels of renewable generation Rates will need to be modernized to reflect the changing energy landscape |

