Attached files
| file | filename |
|---|---|
| 8-K - TAIWAN FUND INC | fp0008269_8k.htm |
|
THE TAIWAN FUND, INC. (THE ‘FUND’)
MONTHLY INSIGHT
|
 AUGUST 31, 2013
|
IN BRIEF
|
Net asset value per share
|
US$19.30
|
|
Market price
|
US$17.33
|
|
Premium/(discount)
|
(10.21%)
|
|
Total net assets
|
US$158.7m
|
|
Market cap
|
US$142.5m
|
Source: State Street Bank and Trust Company.
|
At August 31, 2013
|
US$ return
|
|
|
Fund*
%
|
TAIEX Total Return Index†
%
|
|
|
One month
|
(0.3)
|
(0.1)
|
|
Three months
|
3.1
|
(0.1)
|
|
One year
|
12.1
|
11.7
|
|
Three years % pa
|
7.2
|
7.8
|
Returns are annualized, except for periods of less than one year.
|
*
|
Source: State Street Bank and Trust Company.
|
NAV performance.
|
†
|
Source: TWSE.
|
Past performance is not a guide to future returns.
FUND MANAGERS
 |
 |
|
|
Wong Kok Hoi
|
James Liu
|
MANAGER’S COMMENTARY
The TAIEX fell by 0.1% in August, partly due to selling pressure from foreign institutional funds (concerned about the potential tapering of US quantitative easing), coinciding with low trading volumes. Material sectors like rubber, wire and cable, as well as construction were the weaker performers over the month.
Towards the end of 2012, the Taiwan government temporarily stopped the approval of local insurance firms buying domestic commercial property, due to concerns about compressing yields and an overheating of local commercial property prices. Over the past few months, however, the prospect of a potential early end to US monetary-stimulus measures has meant that the outlook on yields in alternative asset classes has changed, and the purchasing behavior of local insurance firms has shifted. As a result, the government decided in August to once again allow insurance companies to invest in Taiwan commercial property.
Our view is that this will help support the value of commercial property assets in Taiwan, which would have positive implications for a number of companies in the portfolio that own such assets. However, given how much property prices have risen since the global financial crisis, we are keeping a close eye on yield rates and price trends in the Taiwan property market, and using only conservative forecasts in our stock valuation modeling. By so doing, we seek to avoid either paying too much for potential new additions to the portfolio or holding onto stocks that have become overvalued.
MONTHLY INSIGHT
INVESTMENT REVIEW
The Fund’s net asset value fell 0.3% in US dollar terms over the month. Among the Fund’s best performers were the pharmaceutical group YungShin Global Holding, materials company Taiflex Scientific and technology firm Advantech.
YungShin Global recently won the rights to distribute the drug AmBiL in Taiwan, and to manufacture it for global distribution. AmBiL, a generic drug used to treat a life-threatening condition where fungi enter the bloodstream, has received the Taiwan authorities’ green light for the local market, and is awaiting approval for entry into the EU and US markets. Revenues are expected to begin streaming from each region in 2014 and 2015, respectively. Elsewhere, Taiflex Scientific performed strongly after it reported yet another month of strong sales growth in July. Advantech also fared well after it reported a good set of results in the second quarter, with 15% year-on- year earnings growth on the back of 8% sales growth and margin expansion.
On the other side, notable detractors included office-equipment supplier Aurora and Mercuries & Associates, which operates retail stores as well as securities and insurance businesses. Aurora’s share price slid along with the general market. However, the company has posted strong year-to-date performance and is still on track to grow its office automation and furniture business in China by strengthening its distribution network. Meanwhile, Mercuries & Associates also performed poorly in August, despite having reported a solid set of results for the first half of 2013. Investor concern centers on the company’s loss-making mini-mart and department-store businesses, and management’s plan to open another 1,000 mini-marts within three years. However, its insurance business has been improving, and the stock trades at an attractive valuation: a trailing price/earnings ratio of 12x and a price/book value ratio of about 1.3x for the 2013 fiscal year. We will hold onto the position at the current share price.
Source: Martin Currie Inc. and APS Asset Management Pte Ltd.
For further information please go to www.thetaiwanfund.com.
Martin Currie Inc. took over management of the Fund on May 9, 2010.
FUND DETAILS
|
August 31, 2013
|
|
|
Shares outstanding
|
8,221,259
|
|
Exchange listed
|
NYSE
|
|
Listing date
|
1986
|
|
Investment manager
|
Martin Currie Inc.
|
Source: State Street Bank and Trust Company.
|
PERFORMANCE
|
(US$ RETURNS)
|
|
(US$ returns)
|
NAV %
|
Market price %
|
|
One month
|
(0.3)
|
0.7
|
|
Three months
|
3.1
|
3.8
|
|
Three years % pa
|
7.2
|
7.2
|
Returns are annualized, except for periods of less than one year.
Source: State Street Bank and Trust Company.
Past performance is not a guide to future returns.
SECTOR ALLOCATION
|
Fund %*
|
Benchmark %†
|
|
|
Electronics
|
31.0
|
49.0
|
|
Wholesale and retail
|
14.1
|
5.2
|
|
Construction
|
12.7
|
2.2
|
|
Healthcare
|
9.5
|
—
|
|
Textiles
|
6.5
|
2.0
|
|
Electric and machinery
|
4.6
|
1.5
|
|
Others
|
4.3
|
3.3
|
|
Transportation
|
4.0
|
1.9
|
|
Finance
|
3.9
|
14.0
|
|
Plastics
|
3.7
|
7.2
|
|
Steel and iron
|
—
|
2.6
|
|
Chemicals
|
—
|
2.3
|
|
Foods
|
—
|
2.1
|
|
Rubber
|
—
|
1.9
|
|
Automobile
|
—
|
1.8
|
|
Cement
|
—
|
1.4
|
|
Tourism
|
—
|
0.6
|
|
Electrical appliance and cable
|
—
|
0.4
|
|
Glass and ceramics
|
—
|
0.3
|
|
Paper and pulp
|
—
|
0.3
|
|
Other assets and liabilities, net
|
5.7
|
—
|
|
*
|
Source: State Street Bank and Trust Company.
|
|
†
|
Source: TWSE.
|
15 LARGEST HOLDINGS*
|
64.4% of holdings
|
Sector
|
% of net assets
|
|
WT Microelectronics
|
Electronics
|
7.7
|
|
Yungshin Global Holding
|
Healthcare
|
6.4
|
|
Taiwan Semiconductor Manufacturing
|
Electronics
|
5.6
|
|
Aurora
|
Electronics
|
4.8
|
|
Yungtay Engineering
|
Electric and machinery
|
4.6
|
|
Advantech
|
Electronics
|
4.3
|
|
Mercuries & Associates
|
Wholesale and retail
|
4.2
|
|
PC Home Online
|
Wholesale and retail
|
3.8
|
|
Yem Chio
|
Plastics
|
3.7
|
|
Taiflex Scientific
|
Electronics
|
3.6
|
|
Makalot Industrial
|
Textiles
|
3.5
|
|
Taiwan Tea
|
Wholesale and retail
|
3.2
|
|
Pacific Hospital Supply
|
Healthcare
|
3.1
|
|
Far Eastern New Century
|
Textiles
|
3.0
|
|
Test-Rite International
|
Wholesale and retail
|
2.9
|
|
*
|
Source: State Street Bank and Trust Company.
|
|
PERFORMANCE
|
(US$ returns at August 31, 2013)
|
|
One month
%
|
Three months
%
|
Calendar year
to date
%
|
One year
%
|
Three years
% pa
|
Five years
% pa
|
Ten years
% pa
|
Since launch
% pa
|
|
The Taiwan Fund, Inc.*
|
(0.3)
|
3.1
|
7.9
|
12.1
|
7.2
|
5.6
|
6.7
|
8.7
|
|
TAIEX Index†
|
(0.9)
|
(2.8)
|
1.1
|
8.6
|
4.1
|
3.7
|
5.0
|
8.3
|
|
TAIEX Total Return Index†
|
(0.1)
|
(0.1)
|
4.0
|
11.7
|
7.8
|
7.4
|
8.9
|
na
|
|
MSCI Taiwan Index†
|
(0.2)
|
(1.3)
|
2.4
|
11.4
|
7.7
|
5.6
|
6.4
|
na
|
Returns are annualized, except for periods of less than one year.
|
*
|
Source: State Street Bank and Trust Company. Launch date December 23, 1986. Returns for the Fund are historical total returns that reflect changes in net asset value per share during each period and assume that dividends and capital gains, if any, were reinvested.
|
|
†
|
Source: MSCI for the MSCI Taiwan Index and TWSE for the TAIEX Total Return Index and the TAIEX Index. For a full description of each index please see the index descriptions section.
|
Returns for the TAIEX Index are not total returns and reflect only changes in the share price but do not assume that cash dividends, if any, were reinvested, and thus are not strictly comparable to the Fund returns.
The TAIEX Total Return Index commenced January 1, 2003.
Past performance is not a guide to future returns.
MONTHLY INSIGHT
PORTFOLIO IN FULL
|
Sector
|
Company
(BGB ticker)
|
Price NT$
|
Holding
|
Value US$
|
% of
net assets
|
|
ELECTRONICS
|
31.0
|
||||
|
WT Microelectronics
|
3036 TT
|
33.6
|
10,901,900
|
12,222,719
|
7.7
|
|
Taiwan Semiconductor Manufacturing
|
2300 TT
|
100.5
|
2,626,000
|
8,819,295
|
5.6
|
|
Aurora
|
2373 TT
|
56.4
|
4,060,000
|
7,652,058
|
4.8
|
|
Advantech
|
2395 TT
|
152.0
|
1,335,100
|
6,781,574
|
4.3
|
|
Taiflex Scientific
|
8039 TT
|
49.7
|
3,452,821
|
5,728,836
|
3.6
|
|
MPI
|
6223 TT
|
53.5
|
1,448,000
|
2,588,782
|
1.6
|
|
King Slide Works
|
2059 TT
|
254.0
|
285,000
|
2,419,088
|
1.5
|
|
Lumax International
|
6192 TT
|
66.4
|
844,000
|
1,872,766
|
1.2
|
|
Tatung
|
2371 TT
|
7.3
|
4,770,897
|
1,155,876
|
0.7
|
|
WHOLESALE AND RETAIL
|
14.1
|
||||
|
Mercuries & Associates
|
2905 TT
|
20.1
|
9,912,429
|
6,658,084
|
4.2
|
|
PC Home Online
|
8044 TT
|
170.0
|
1,048,128
|
5,954,377
|
3.8
|
|
Taiwan Tea
|
2913 TT
|
18.7
|
8,231,000
|
5,143,601
|
3.2
|
|
Test-Rite International
|
2908 TT
|
22.8
|
6,075,260
|
4,618,696
|
2.9
|
|
CONSTRUCTION
|
12.7
|
||||
|
Goldsun Development & Construction
|
2504 TT
|
11.3
|
11,314,980
|
4,253,823
|
2.7
|
|
King’s Town Construction
|
2524 TT
|
28.3
|
4,474,764
|
4,224,368
|
2.7
|
|
Acter
|
5536 TT
|
118.0
|
941,179
|
3,711,311
|
2.3
|
|
Taiwan Land Development
|
2841 TT
|
11.2
|
8,681,129
|
3,249,132
|
2.0
|
|
Hung Poo Real Estate Development
|
2536 TT
|
29.3
|
2,465,873
|
2,414,412
|
1.5
|
|
Good Friend International Holdings
|
912398 TT
|
10.0
|
6,990,000
|
2,324,199
|
1.5
|
|
HEALTHCARE
|
9.5
|
||||
|
YungShin Global Holding
|
3705 TT
|
49.5
|
6,146,000
|
10,166,486
|
6.4
|
|
Pacific Hospital Supply
|
4126 TT
|
107.0
|
1,345,456
|
4,810,900
|
3.1
|
|
TEXTILES
|
6.5
|
||||
|
Makalot Industrial
|
1477 TT
|
161.5
|
1,030,000
|
5,558,823
|
3.5
|
|
Far Eastern New Century
|
1402 TT
|
32.2
|
4,430,207
|
4,759,684
|
3.0
|
|
ELECTRIC AND MACHINERY
|
4.6
|
||||
|
Yungtay Engineering
|
1507 TT
|
69.4
|
3,134,000
|
7,268,278
|
4.6
|
| Sector |
Company
(BGB ticker)
|
Price NT$
|
Holding
|
Value US$
|
% of net assets
|
|
OTHER
|
4.3
|
||||
|
Ruentex Development
|
9945 TT
|
59.1
|
1,734,314
|
3,425,219
|
2.2
|
|
Taiwan Secom
|
9917 TT
|
71.0
|
728,000
|
1,727,280
|
1.1
|
|
Taiwan Sogo Shinkong Security
|
9925 TT
|
36.1
|
1,378,000
|
1,662,377
|
1.0
|
|
TRANSPORTATION
|
4.0
|
||||
|
First Steamship
|
2601 TT
|
18.3
|
6,677,714
|
4,072,525
|
2.6
|
|
Taiwan High Speed Rail
|
2633 TT
|
5.5
|
12,597,600
|
2,311,177
|
1.4
|
|
FINANCE
|
3.9
|
||||
|
Yuanta Financial Holding
|
2885 TT
|
15.0
|
6,321,000
|
3,168,474
|
2.0
|
|
Union Bank of Taiwan
|
2838 TT
|
10.6
|
8,523,207
|
3,004,890
|
1.9
|
|
PLASTICS
|
3.7
|
||||
|
Yem Chio
|
4306 TT
|
23.0
|
7,647,915
|
5,878,195
|
3.7
|
|
OTHER ASSETS AND LIABILITIES, NET
|
9,085,079
|
5.7
|
MONTHLY INSIGHT
THE TAIWAN FUND, INC. PREMIUM/DISCOUNT
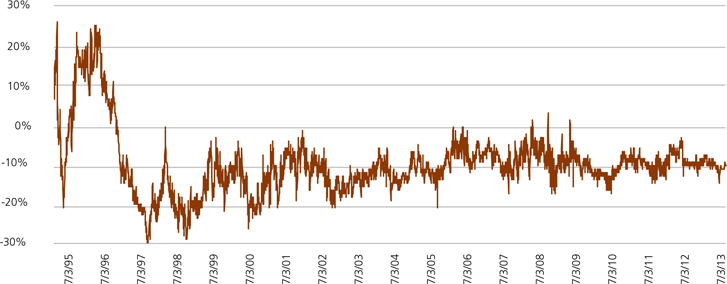
Source: State Street Bank and Trust Company as of August 31, 2013.
INDEX DESCRIPTIONS
TAIEX Index
The TWSE, or TAIEX Index is a capitalization-weighted index of all listed common shares traded on the Taiwan Stock Exchange. The Index was based in 1966 and does not include re-invested dividends.
TAIEX Total Return Index
The TAIEX Total Return Index is a capitalization-weighted index of all listed common shares traded on the Taiwan Stock Exchange, based in 1966, which includes re-invested dividends.
MSCI Taiwan Index
The MSCI Total Return Taiwan Index is a free-float adjusted market capitalization index. The Index represents Taiwanese companies that are available to investors worldwide. The Index has a base date of December 31, 1987. As of August 31, 2013, it contained 107 constituents.
OBJECTIVE
The Fund was launched on December 23, 1986 to allow US and other investors to access and participate in the growth of the economy and the stock market in Taiwan, the Republic of China. The Fund’s investment objective is to seek long-term capital appreciation primarily through investments in equity securities listed in Taiwan. The Fund is a diversified, closed-end management investment company listed on the New York Stock Exchange (NYSE) under the symbol ‘TWN’.
Taiwan, with its global market leadership in high technology goods and its significant investments throughout mainland China and Southeast Asian economies, is now an integral economic player in the Asia Pacific Region as well as around the world. Investing in Taiwan not only allows investors to capitalize on Taiwan’s dynamic economy, but also allows investors to reap the growth and investment potential of the mainland China and other emerging economies of the region.
CONTACTS
The Taiwan Fund, Inc.
c/o State Street Bank and Trust Company
2 Avenue de Lafayette
PO Box 5049
Boston, MA 02111
Tel: (1) 877-864-5056
www.thetaiwanfund.com
IMPORTANT INFORMATION
This document is issued and approved by Martin Currie Inc. (‘MC Inc.’), as investment adviser of The Taiwan Fund, Inc. (the ‘Fund’). MC Inc. is authorised and regulated by the Financial Conduct Authority (‘FCA’) and incorporated under limited liability in New York, USA. Registered in Scotland (No BR2575), registered address Saltire Court, 20 Castle Terrace, Edinburgh, EH1 2ES. Information herein is believed to be reliable but has not been verified by MC Inc. MC Inc. makes no representation or warranty and does not accept any responsibility in relation to such information or for opinion or conclusion which the reader may draw from this newsletter.
The Fund is classified as a diversified investment company under the US Investment Company Act of 1940 as amended. It meets the criteria of a closed ended US fund and its shares are listed on the New York Stock Exchange. MC Inc. has been appointed investment adviser to the Fund.
Investors are advised that they will not generally benefit from the rules and regulations of the United Kingdom Financial Services and Markets Act 2000 and the FCA for the protection of investors, nor benefit from the United Kingdom Financial Services Compensation Scheme, nor have access to the Financial Services Ombudsman in the event of a dispute. Investors will also have no rights of cancellation under the FCA’s Conduct of Business Sourcebook of the United Kingdom.
This newsletter does not constitute an offer of shares. MC Inc., its ultimate and intermediate holding companies, subsidiaries, affiliates, clients, directors or staff may, at any time, have a position in the market referred to herein, and may buy or sell securities, currencies, or any other financial instruments in such markets. The information or opinion expressed in this newsletter should not be construed to be a recommendation to buy or sell the securities, commodities, currencies or financial instruments referred to herein.
The information provided in this report should not be considered a recommendation to purchase or sell any particular security. There is no assurance that any securities discussed herein will remain in an account’s portfolio at the time you receive this report or that securities sold have not been repurchased.
It should not be assumed that any of the securities transactions or holdings discussed here were or will prove to be profitable, or that the investment recommendations or decisions we make in the future will be profitable or will equal the investment performance of the securities discussed herein.
Investing in the Fund involves certain considerations in addition to the risks normally associated with making investments in securities. The value of the shares issued by the Fund, and the income from them, may go down as well as up and there can be no assurance that upon sale, or otherwise, investors will receive back the amount originally invested. There can be no assurance that you will receive comparable performance returns, or that investments will reflect the performance of the stock examples contained in this document. Movements in foreign exchange rates may have a separate effect, unfavorable as well as favorable, on the gain or loss otherwise experienced on an investment. Past performance is not a guide to future returns. Accordingly, the Fund is only suitable for investment by investors who are able and willing to withstand the total loss of their investment. In particular, prospective investors should consider the following risks:
|
–
|
It should be noted that investment in the Fund is only suitable for sophisticated investors who are aware of the risk of investing in Taiwan and should be regarded as long term. Funds which invest in one country carry a higher degree of risk than those with portfolios diversified across a number of markets.
|
|
–
|
Investment in the securities of smaller and unquoted companies can involve greater risk than is customarily associated with investment in larger, more established, companies. In particular, smaller companies often have limited product lines, markets or financial resources and their management may be dependent on a smaller number of key individuals. In addition, the market for stock in smaller companies is often less liquid than that for stock in larger companies, bringing with it potential difficulties in acquiring, valuing and disposing of such stock. Proper information for determining their value, or the risks to which they are exposed, may not be available.
|
|
–
|
Investments within emerging markets such as Taiwan can be of higher risk. Many emerging markets, and the companies quoted on their stock exchanges, are exposed to the risks of political, social and religious instability, expropriation of assets or nationalization, rapid rates of inflation, high interest rates, currency depreciation and fluctuations and changes in taxation which may affect the Fund’s income and the value of its investments.
|
|
–
|
The marketability of quoted shares may be limited due to foreign investment restrictions, wide dealing spreads, exchange controls, foreign ownership restrictions, the restricted opening of stock exchanges and a narrow range of investors. Trading volume may be lower than on more developed stockmarkets, and equities are less liquid. Volatility of prices can also be greater than in more developed stockmarkets. The infrastructure for clearing, settlement and registration on the primary and secondary markets may be undeveloped. Under certain circumstances, there may be delays in settling transactions in some of the markets.
|

Martin Currie Inc. registered in Scotland (no BR2575)
Registered office: Saltire Court, 20 Castle Terrace, Edinburgh EH1 2ES
Tel: 44 (0) 131 229 5252 Fax: 44 (0) 131 228 5959 www.martincurrie.com
North American office: 1350 Avenue of the Americas, Suite 3010, New York, NY
10019, USA Tel: (1) 212 258 1900 Fax: (1) 212 258 1919
Authorised and regulated by the Financial Conduct Authority and incorporated with limited liability in New York, USA. Registered with the SEC as an investment adviser.
Please note: calls to the above numbers may be recorded.