Attached files
| file | filename |
|---|---|
| 8-K - 8-K - Matson, Inc. | a13-20686_18k.htm |
Exhibit 99.1
|
|
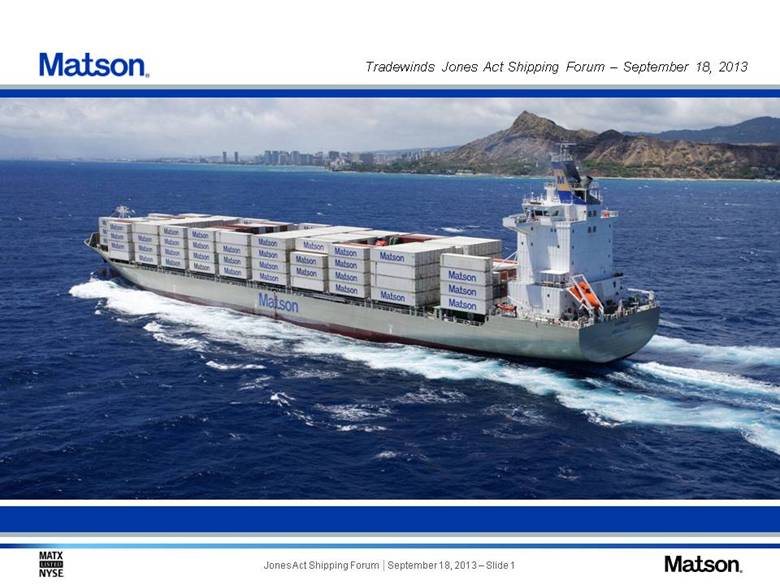
Tradewinds Jones Act Shipping Forum – September 18, 2013 |
|
|
Forward Looking Statements Statements in this presentation that set forth expectations or predictions are based on facts and situations that are known to us as of September 18, 2013. Actual results may differ materially, due to risks and uncertainties, such as those described on pages 9-15 of our 2012 Form 10-K and other subsequent filings with the SEC. Statements in this presentation are not guarantees of future performance. We do not undertake any obligation to update our forward-looking statements. Investors may obtain a free copy of all filings containing information about Matson from the SEC at the SEC’s website at http://www.sec.gov after such documents have been filed with the SEC. In addition, copies of filings containing information about us can be obtained without charge by sending a request to Matson, Inc., 1411 Sand Island Parkway, Honolulu, Hawaii 96819, Attention: Investor Relations; by calling (510) 628-4021; or by accessing them on the web at http://www.matson.com. |
|
|
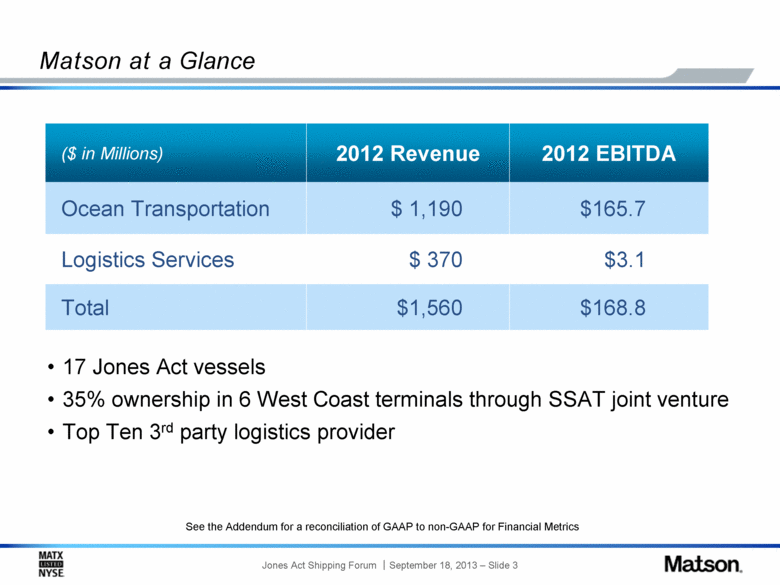
Matson at a Glance 17 Jones Act vessels 35% ownership in 6 West Coast terminals through SSAT joint venture Top Ten 3rd party logistics provider ($ in Millions) 2012 Revenue 2012 EBITDA Ocean Transportation $ 1,190 $165.7 Logistics Services $ 370 $3.1 Total $1,560 $168.8 See the Addendum for a reconciliation of GAAP to non-GAAP for Financial Metrics |
|
|
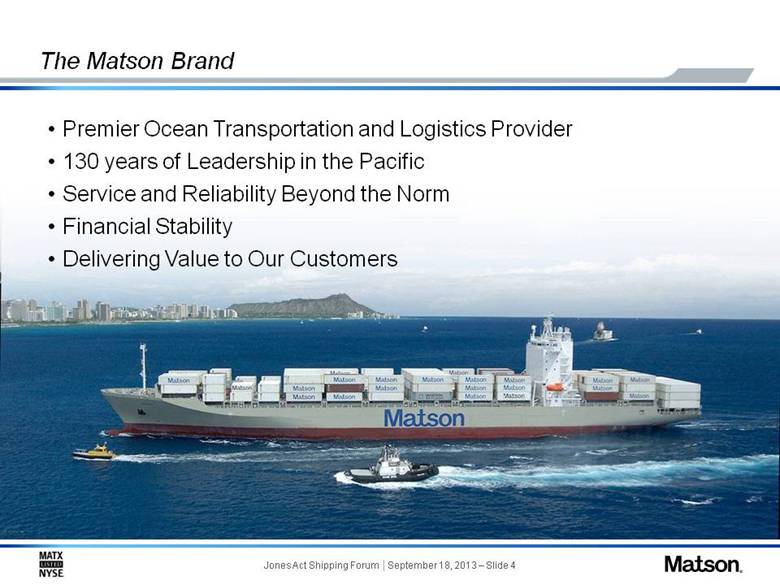
The Matson Brand Premier Ocean Transportation and Logistics Provider 130 years of Leadership in the Pacific Service and Reliability Beyond the Norm Financial Stability Delivering Value to Our Customers |
|
|
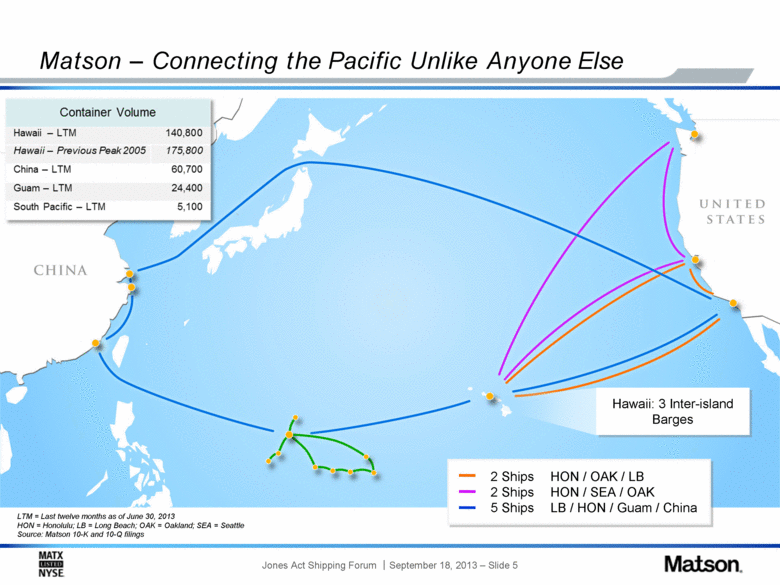
Matson – Connecting the Pacific Unlike Anyone Else Hawaii: 3 Inter-island Barges LTM = Last twelve months as of June 30, 2013 HON = Honolulu; LB = Long Beach; OAK = Oakland; SEA = Seattle Source: Matson 10-K and 10-Q filings 2 Ships HON / OAK / LB 2 Ships HON / SEA / OAK 5 Ships LB / HON / Guam / China |
|
|
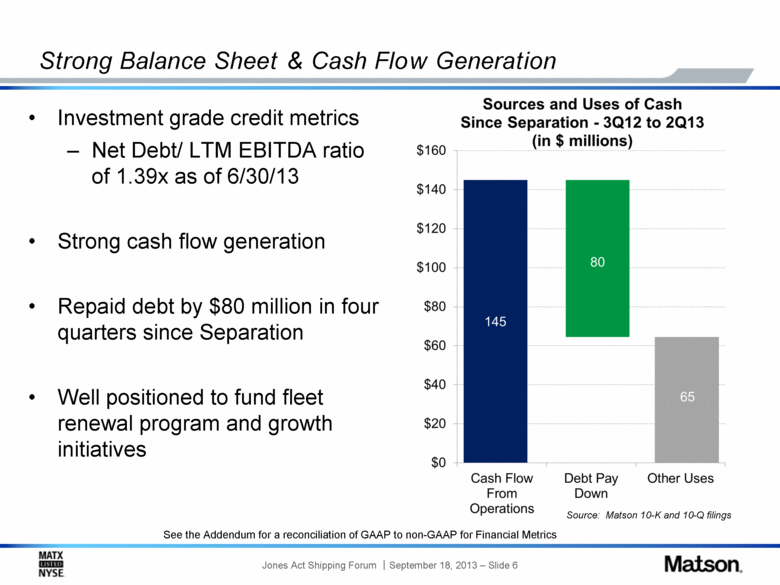
Strong Balance Sheet & Cash Flow Generation Investment grade credit metrics Net Debt/ LTM EBITDA ratio of 1.39x as of 6/30/13 Strong cash flow generation Repaid debt by $80 million in four quarters since Separation Well positioned to fund fleet renewal program and growth initiatives Source: Matson 10-K and 10-Q filings See the Addendum for a reconciliation of GAAP to non-GAAP for Financial Metrics |
|
|
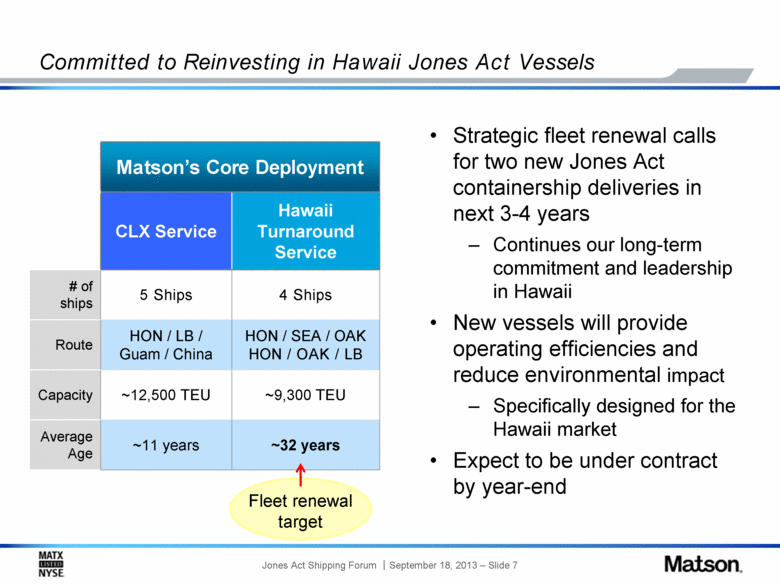
Matson’s Core Deployment CLX Service Hawaii Turnaround Service # of ships 5 Ships 4 Ships Route HON / LB / Guam / China HON / SEA / OAK HON / OAK / LB Capacity ~12,500 TEU ~9,300 TEU Average Age ~11 years ~32 years Committed to Reinvesting in Hawaii Jones Act Vessels Strategic fleet renewal calls for two new Jones Act containership deliveries in next 3-4 years Continues our long-term commitment and leadership in Hawaii New vessels will provide operating efficiencies and reduce environmental impact Specifically designed for the Hawaii market Expect to be under contract by year-end Fleet renewal target |
|
|
Addendum |
|
|
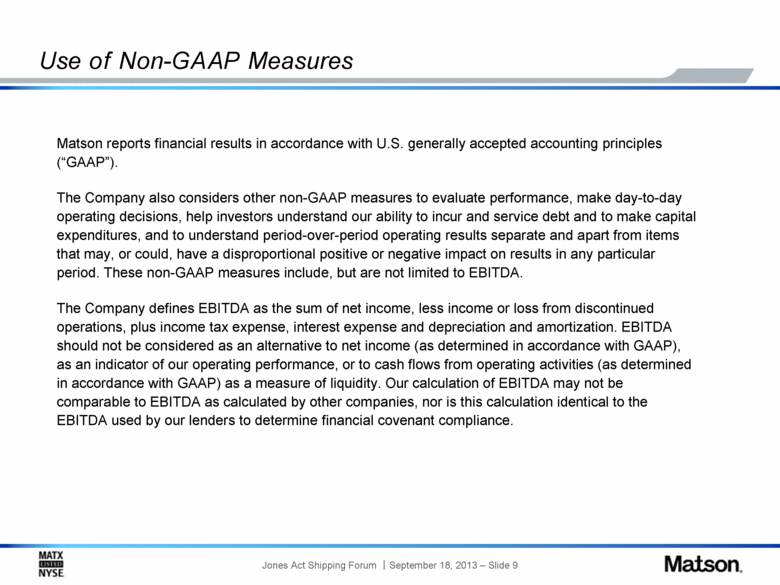
Use of Non-GAAP Measures Matson reports financial results in accordance with U.S. generally accepted accounting principles (“GAAP”). The Company also considers other non-GAAP measures to evaluate performance, make day-to-day operating decisions, help investors understand our ability to incur and service debt and to make capital expenditures, and to understand period-over-period operating results separate and apart from items that may, or could, have a disproportional positive or negative impact on results in any particular period. These non-GAAP measures include, but are not limited to EBITDA. The Company defines EBITDA as the sum of net income, less income or loss from discontinued operations, plus income tax expense, interest expense and depreciation and amortization. EBITDA should not be considered as an alternative to net income (as determined in accordance with GAAP), as an indicator of our operating performance, or to cash flows from operating activities (as determined in accordance with GAAP) as a measure of liquidity. Our calculation of EBITDA may not be comparable to EBITDA as calculated by other companies, nor is this calculation identical to the EBITDA used by our lenders to determine financial covenant compliance. |
|
|
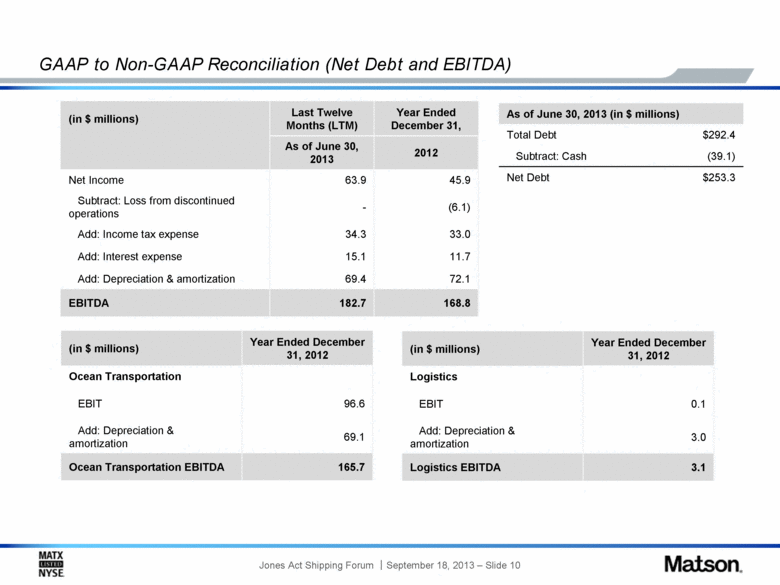
GAAP to Non-GAAP Reconciliation (Net Debt and EBITDA) (in $ millions) Last Twelve Months (LTM) Year Ended December 31, As of June 30, 2013 2012 Net Income 63.9 45.9 Subtract: Loss from discontinued operations - (6.1) Add: Income tax expense 34.3 33.0 Add: Interest expense 15.1 11.7 Add: Depreciation & amortization 69.4 72.1 EBITDA 182.7 168.8 As of June 30, 2013 (in $ millions) Total Debt $292.4 Subtract: Cash (39.1) Net Debt $253.3 (in $ millions) Year Ended December 31, 2012 Ocean Transportation EBIT 96.6 Add: Depreciation & amortization 69.1 Ocean Transportation EBITDA 165.7 (in $ millions) Year Ended December 31, 2012 Logistics EBIT 0.1 Add: Depreciation & amortization 3.0 Logistics EBITDA 3.1 |

