Attached files
| file | filename |
|---|---|
| 8-K - FORM 8-K - FIRST BANCORP /PR/ | d600350d8k.htm |
 First
BanCorp Investor Presentation
September 2013
Exhibit 99.1 |
 Disclaimer
1
This presentation contains “forward-looking statements” concerning First
BanCorp’s (the “Corporation”) future economic performance. The words or phrases “would
be,” “will allow,” “intends to,” “will likely result,”
“are expected to,” “expect,” “anticipate,” “look forward,” “should,” “believes” and similar expressions are meant to
identify “forward-looking statements” within the meaning of Section 27A of the
Private Securities Litigation Reform Act of 1995, and are subject to the safe harbor
created by such section. The Corporation wishes to caution readers not to place undue reliance
on any such “forward-looking statements,” which speak only as of the date
made, and to advise readers that various factors, including, but not limited to, uncertainty about whether the Corporation and FirstBank Puerto Rico (“FirstBank”
or “the Bank”) will be able to fully comply with the written agreement dated
June 3, 2010 that the Corporation entered into with the Federal Reserve Bank of New York
(the “FED”) and the order dated June 2, 2010 (the “Order”)that
FirstBank entered into with the FDIC and the Office of the Commissioner of Financial Institutions of
Puerto Rico that, among other things, require FirstBank to maintain certain capital levels and
reduce its special mention, classified, delinquent and non-performing assets; the
risk of being subject to possible additional regulatory actions; uncertainty as to the availability of certain funding sources, such as retail brokered CDs; the
Corporation’s reliance on brokered CDs and its ability to obtain, on a periodic basis,
approval from the FDIC to issue brokered CDs to fund operations and provide liquidity
in accordance with the terms of the Order; the risk of not being able to fulfill the Corporation’s cash obligations or resume paying dividends to the
Corporation’s stockholders in the future due to the Corporation’s inability to
receive approval from the FED to receive dividends from FirstBank or FirstBank’s failure to
generate sufficient cash flow to make a dividend payment to the Corporation; the strength or
weakness of the real estate markets and of the consumer and commercial credit sectors
and their impact on the credit quality of the Corporation’s loans and other assets, including the Corporation’s construction and commercial real estate
loan portfolios, which have contributed and may continue to contribute to, among other things,
the high levels of non-performing assets, charge-offs and the provision expense
and may subject the Corporation to further risk from loan defaults and foreclosures; adverse changes in general economic conditions in the United States and
in Puerto Rico, including the interest rate scenario, market liquidity, housing absorption
rates, real estate prices and disruptions in the U.S. capital markets, which may reduce
interest margins, impact funding sources and affect demand for all of the Corporation’s products and services and the value of the Corporation’s assets; an
adverse change in the Corporation’s ability to attract new clients and retain existing
ones; a decrease in demand for the Corporation’s products and services and lower
revenues and earnings because of the continued recession in Puerto Rico and the current fiscal
problems and budget deficit of the Puerto Rico government; uncertainty about regulatory
and legislative changes for financial services companies in Puerto Rico, the United States and the U.S. and British Virgin Islands, which could affect the
Corporation’s financial performance and could cause the Corporation’s actual results
for future periods to differ materially from prior results and anticipated or projected
results; uncertainty about the effectiveness of the various actions undertaken to stimulate the United States economy and stabilize the United States’
financial markets, and the impact such actions may have on the Corporation’s business,
financial condition and results of operations; changes in the fiscal and monetary
policies and regulations of the federal government, including those determined by the Federal
Reserve System, the FDIC, government-sponsored housing agencies and regulators in
Puerto Rico and the U.S. and British Virgin Islands; the risk of possible failure or circumvention of controls and procedures and the risk that the
Corporation’s risk management policies may not be adequate; the risk that the FDIC may
further increase the deposit insurance premium and/or require special assessments to
replenish its insurance fund, causing an additional increase in the Corporation’s non-interest expense; risks of not being able to recover the assets
pledged to Lehman Brothers Special Financing, Inc.; the impact on the Corporation’s
results of operations and financial condition associated with acquisitions and
dispositions; a need to recognize additional impairments on financial instruments or goodwill
relating to acquisitions; risks that downgrades in the credit ratings of the
Corporation’s long-term senior debt will adversely affect the Corporation’s
ability to access necessary external funds; the impact of the Dodd-Frank Wall Street Reform
and Consumer Protection Act on the Corporation’s businesses, business practices and cost
of operations; and general competitive factors and industry consolidation. The
Corporation does not undertake, and specifically disclaims any obligation, to update any “forward-looking statements” to reflect occurrences or unanticipated
events or circumstances after the date of such statements except as required by the federal
securities laws. Investors should refer to the Corporation’s Annual Report on Form
10-K for the year ended December 31, 2012 for a discussion of such factors and certain risks and uncertainties to which the Corporation is subject.
|
 Eastern
Caribbean:
7% of Assets
14 bank branches
3 First Express branches
Well diversified with significant competitive strengths
Franchise Overview
Founded in 1948
Headquartered in San Juan, Puerto
Rico with operations in PR, Eastern
Caribbean (Virgin Islands) and
Florida
–
~2,500 FTE employees
(1)
2nd largest financial holding
company in Puerto Rico with
attractive business mix and
substantial loan market share
Florida presence with focus on
serving south Florida region
The largest depository institution
in the Virgin Islands with
approximately 40% market share
151 ATM machines and largest
ATM network in the Eastern
Caribbean Region
(2)
A well diversified operation with
over 650,000 retail & commercial
customers
2
Total Assets -
$12.8B
Total Loans -
$9.7B
Total Deposits -
$10.0B
47 Branches
35 Branches
5 Branches
2 Branches
26 Branches
8 In-Branches
12 bank branches
1 Loan Production Office
SE Florida:
7% of Assets
30% of core
deposits
(3)
15% of core
deposits
(3)
As of June 30, 2013.
1) FTE = Full Time Equivalent. 2) Eastern
Caribbean Region or ECR includes United States and British Virgin Islands.
3) Data as of December 31, 2012. Core deposits excludes brokered deposits allocated to Puerto
Rico. |
 –
5.0%
10.0%
15.0%
20.0%
2005
2007
2009
2011
2013
2015
U.S.
P.R.
U.S. projected
P.R. projected
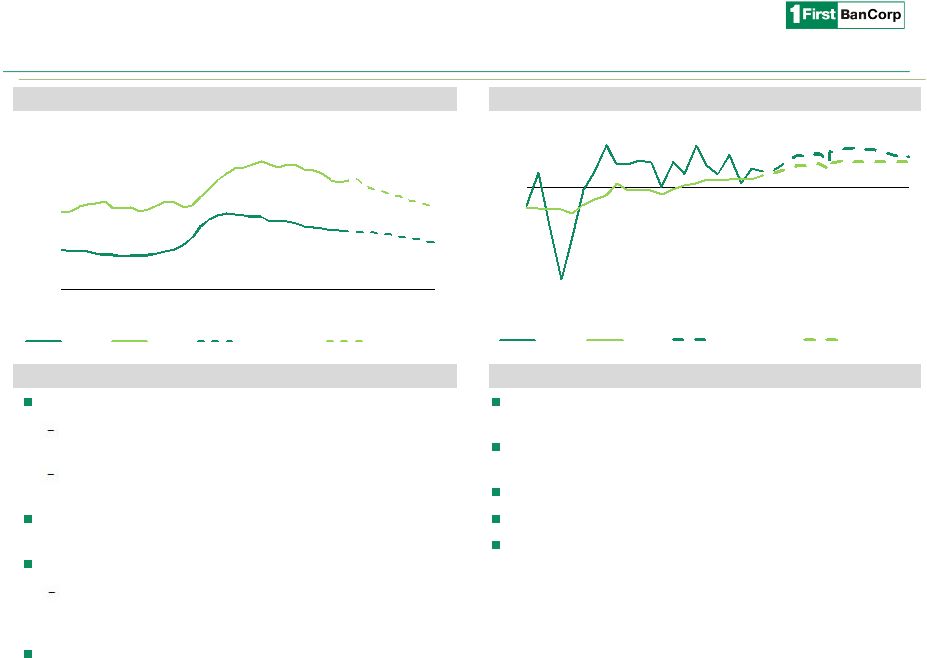
Outlook on economic growth projections in PR
GNP: -0.4% for FY 2013 and 0.2% for FY 2014 (PR
Planning Board)
Real GDP: 1.0%
for 2013 and 1.9% for 2014 (Global
Insight)
July 2013 unemployment rate of 13.5% compared to July 2012
of 14.0% (PR Planning Board, seasonally adjusted)
Increased tourist activity in first ten months of fiscal 2013
Hotel occupancy rate of 72.4% for 2013 YTD compared to
average occupancy rate of 69.7% during the same period
2012 (PR Planning Board).
Evaluation of priority infrastructure projects moving forward
Government targeting 65% reduction in fiscal 2014 budget
deficit
Act 154 excise tax fixed to its original level of 4% for five years
commencing on July 1, 2013
Tax of approximately 0.5% levied on gross income
Pension plan reform
Privatization of Luis Muñoz Marín International Airport
Puerto Rico economic update
Unemployment
(1)
Economic Activity
Recent Changes
3
Real GDP
(1)
1) Source: Global Insight’s Comparative World Overview, Quarterly data.
10.0%
10.5%
5.3%
6.1%
(10.0%)
(5.0%)
–
5.0%
2008
2010
2012
2014
2016
U.S.
P.R.
U.S. projected
P.R. projected
2.4%
3.0%
1.2%
1.6%
(2.1%)
(3.7%)
PR has lagged the US recovery coming out of the credit crisis |
 Our turnaround
story Franchise Overview
($ in millions)
De-Risking of Balance Sheet
Capital
Enhanced Franchise Value
4
June 2010:
Written
Agreement
with the FED
and Consent
Order with
FDIC
July 2010:
The U.S.
Treasury
exchanged
TARP for
convertible
preferred
August 2010:
Exchange of 89%
Perpetual
Preferred Stock
for Common
February 2011:
Sale of non-
performing
loans with a
book value of
$269 million
Feb-April 2011:
Sale of $330
million of MBS
and $518
million of
performing
residential
mortgages
March 2013:
Sale of non-performing
loans with a book value
of $217.7 million and
entered two separate
agreements for sale of
NPLs with a book value
of $99 million
2010
2011
2013
October 2011:
Conversion of
the shares held
by the U.S.
Treasury into
32.9 million
shares of
common stock
May 2012:
Acquisition of a $406
million portfolio of
FirstBank-branded
credit cards from FIA
June 2013:
Write-off of $66.6
million collateral
pledged to
Lehman, sale of
NPLs with book
value of $203.8
million and $19.2
million of OREO
October 2011:
Private placement
of $525 million in
common stock.
Lead investors
included Thomas H.
Lee & Oaktree
2012
1) Represents change in dollar amount.
August 2013:
Completed
secondary
offering reducing
ownership
interest of U S
Treasury and PE
Investors |
 Franchise
Overview Source: PR Market Share Report prepared with data provided by the Commissioner
of Financial Institutions of Puerto Rico as of 6/30/13. 1) Puerto Rico only.
2) Calculated as institution bank branches within a mile of an FBP branch as a
percentage of total institution branches. 3) Alphabetical order.
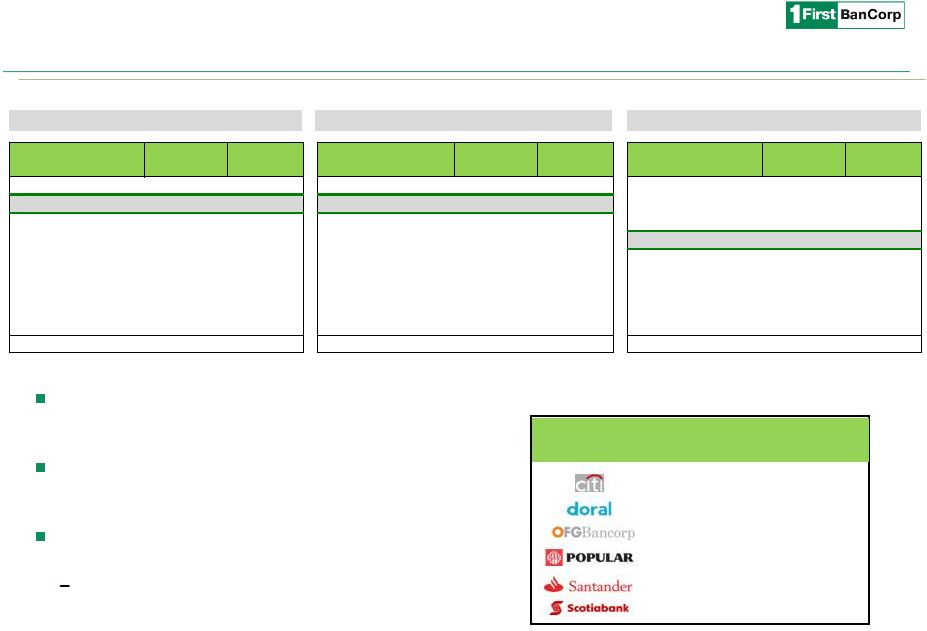
Well positioned Puerto Rico institution in a consolidating market
5
Puerto Rico Total Assets
(1)
Puerto Rico Total Loans
(1)
Puerto Rico Deposits, Net of Brokered
(1)
($ in millions)
Strong and uniquely positioned franchise in
densely populated regions of core operating
footprint
Strong market share in loan portfolios
facilitates customer relationship expansion and
cross-sell to increase deposit share
Long-term opportunity for additional
consolidation
Branch overlap of greater than 40% with six
Puerto Rico institutions
(2)
1-mile branch overlap
(3)
64
42
80%
42
47
44
Portfolio
Balance
Market
Share
Portfolio
Balance
Market
Share
Portfolio
Balance
Market
Share
1
Banco Popular
$26,132
39.9%
1
Banco Popular
$19,212
38.8%
1
Banco Popular
$17,852
44.1%
2
FirstBank
9,662
14.8%
2
FirstBank
8,123
16.4%
2
Banco Santander
5,694
14.1%
3
Oriental Bank
7,405
11.3%
3
Banco Santander
5,413
10.9%
3
Oriental Bank
4,908
12.1%
4
Banco Santander
7,031
10.7%
4
Scotiabank
5,146
10.4%
4
FirstBank
3,858
9.5%
5
Scotiabank
7,002
10.7%
5
Oriental Bank
5,083
10.3%
5
Scotiabank
3,427
8.5%
6
Doral Bank
5,477
8.4%
6
Doral Bank
2,839
5.7%
6
Citibank
2,227
5.5%
7
Citibank
2,223
3.4%
7
Other
2,692
5.4%
7
Doral Bank
2,031
5.0%
8
Banco Cooperativo
518
0.8%
8
Citibank
755
1.5%
8
Banco Cooperativo
437
1.1%
9
BBU
20
0.0%
9
Banco Cooperativo
193
0.4%
9
BBU
25
0.1%
Total
$65,469
100%
Total
$49,456
100%
Total
$40,460
100%
Institutions
Institutions
Institutions |
 Core Franchise is
Strong Effectively executing Strategic Plan towards Profitability
Management focused on continued strengthening of the franchise and
executing on profitability levers
Balance Sheet
Improving risk profile; current focus on organic reduction of NPAs
Executing on opportunities to reduce cost of funds
6
Completed two bulk sales of adversely classified loans and OREO properties with
total book value of $441 million in first half of 2013
NPAs decreased for the 13
th
consecutive quarter
NPAs down 39% or $486 million YTD 2013
$1.8 billion brokered CDs maturing in twelve months at average rate of 1.28%
|
 Core deposit
growth strategy continues producing positive results; $1.5B since 2009
Florida continues to be a strong funding source
Focus remains on cross-selling opportunities
Cost of deposits, net of brokered CDs, decreased to 0.81%
Reduced reliance on brokered CDs
$3.3bn (33% of deposits) today vs. $7.4bn (60%) in
2009
$1.8 billion brokered CDs maturing over next twelve
months at average rate of 1.28%; brokered CDs being
renewed
at
average
rate
of
0.75%
-
0.85%
($ in millions)
Core Deposits
(1)
Total Deposit Composition
Cost of Deposits
(1)
1) Total Deposits excluding Brokered CDs.
Opportunity for Earnings Growth
Successful deposit growth over recent years
7
Brokered CDs
33%
Non-interest
bearing
9%
Interest bearing
58%
2Q 2013
Brokered CDs
60%
Non-interest
bearing
6%
Interest bearing
34%
4Q 2009
$5,108
$5,800
$6,176
$6,490
$6,695
Retail
Commercial
CDs & IRA
Public Funds
2,381
2,477
2,654
2,776
2,835
774
763
915
1,108
1,144
1,505
2,090
2,126
2,077
2,111
448
470
481
529
605
$6,000
$4,500
$3,000
$1,500
$0
2009
2010
2011
2012
2Q 2013 |
 Continued
focus on revenue generation through growth in Consumer and Residential Mortgage
market share & rebuilding Commercial portfolio
Strong origination activity at $1 billion for 2Q ‘13:
Residential mortgages originations increased
$33 million
Consumer loans originations increased $33
million
•
Auto loan originations increased $11
million
•
Personal loan originations increased
$13 million
•
Credit card utilization activity of $96
million
2013 focus on rebuilding Commercial book
•
Achieved $90 million growth in 2Q
2013
•
First quarter of growth since 2009
•
Executing on Florida growth
opportunities
8
Loan Portfolio
1) Originations include purchases, refinancings, and draws from existing revolving and
non-revolving commitments. Strong Origination Capabilities
Loan Originations
(1)
($ in millions)
Steady increase in residential and consumer originations
3,417
2,874
2,747
2,714
2,511
1,716
1,562
2,013
2,020
2,047
701
428
362
223
195
5,822
5,695
4,933
4,603
4,693
301
16
85
276
238
$11,957
$10,575
$10,140
$9,836
$9,684
$0
$5,000
$10,000
$15,000
2010
2011
2012
1Q 2013
2Q 2013
Residential
Consumer & Finance Leases
Construction
Commercial
Loans Held for Sale |
 Continuing
De-risking of the Balance Sheet 9
Net Charge-offs (NCO)
(1)
Non-performing Assets (NPA)
NPAs are down over $1 billion, or 58%, since the peak in 1Q 2010
Total
NPLs
are
also
down
over
$1
billion,
or
73%,
since
the
peak
in
1Q
2010
Recent actions (1H 2013)
Bulk sale of NPAs ($441m book value), resulting in NCOs of $197m
Transferred
$182m
of
loans
to
held
for
sale
resulting
in
NCOs
of
$36m
Non-cash charge of $67m due to write-off of securities pledged to
Lehman
($ in millions)
(5)
1) Excludes bulk sales.
2) Excludes $165 million of net charge-offs associated with the bulk sale to
CPG in 2010. 3)
Excludes $232 million of net-charge offs associated with the bulk asset sales and transfer of loans in 2013.
4) June 30, 2013.
5) Net Carrying Amount = % of carrying value net of reserves and accumulated charge-offs. Focus remains on organic
reductions of nonperforming assets including the disposition of $246 million of
HFS and OREO Proactively managing asset quality
Commercial
Non-performing
Loans
(includes
HFS)
(4)
Product
Book Value
Accumulated
Charge-offs
Reserves
Net Carrying
Amount
C & I
$129.1
$45.1
$28.2
57.9%
CRE
177.6
42.9
29.7
67.1%
Construction
125.1
104.5
15.6
47.7%
Total
$431.8
$192.5
$73.5
57.4% |
 Focus on
Strategic Plan Rebuild earnings and de-risk balance sheet
10
($ in millions, except per share results)
2Q 2013 Highlights
Net loss of $122.6 million, or $0.60 per diluted share, including a $72.9 million loss related
to the bulk sale of assets and $66.6 million loss related to the write-off of
assets pledged as collateral with Lehman Adjusted net income of $16.8 million, or $0.08
per diluted share, excluding the aforementioned items Net interest margin increased by 8
basis points to 4.04%; 58 basis point increase YoY driven by further reductions in funding costs
Completed the bulk sale of a nonperforming pool of residential loans with book value of $203.8
million, as well as $19.2 million of
OREO for $128.3 million in an all cash transaction
Completed sale of $40.8 million non-performing commercial mortgage loan without incurring
in additional losses Capital remains strong with total capital ratio, tier 1 and
leverage of 16.6%, 15.3% and 11.3%, respectively (2)
Expect credit related expenses for the second half of 2013 to be
lower than the first half by approximately $10 million based on
the bulk sale expenses included in credit cost in the first half of the year and the
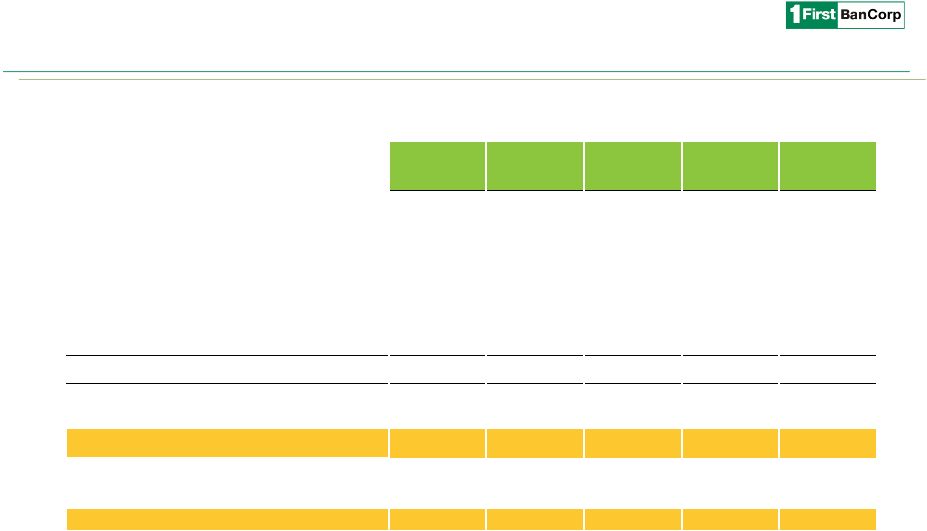
reduced level of non-performing loans Income Statement
2Q 2012
3Q 2012
4Q 2012
1Q 2013
2Q 2013
GAAP Net Interest Income
108.7
$
125.5
$
125.6
$
124.5
$
126.9
$
Provision for loan and lease losses
24.9
29.0
30.5
111.1
87.5
Non-interest income
16.5
17.3
20.1
19.1
14.3
Impairment of collateral pledged to Lehman
(66.6)
Equity in (losses) gains of unconsolidated entities
(2.5)
(2.2)
(8.3)
(5.5)
0.6
Non-interest expense
86.9
91.8
90.9
98.0
111.3
Pre-tax net income (loss)
10.9
19.8
16.0
(71.0)
(123.6)
Income tax (expense) benefit
(1.5)
(0.8)
(1.5)
(1.6)
1.0
Net income (loss)
9.4
$
19.1
$
14.5
$
(72.6)
$
(122.6)
$
Adjusted Pre-tax pre-provision earnings
37.9
$
51.4
$
54.5
$
50.5
$
35.9
$
Net Interest Margin, (GAAP) (%)
3.46%
3.98%
3.91%
3.96%
4.04%
Net income (loss) per common share-basic
0.05
$
0.09
$
0.07
$
(0.35)
$
(0.60)
$
(1)
1) See reconciliation on page 18.
2) First Bancorp cannot be considered well-capitalized because of the regulatory
agreements. |
 Opportunity for
Earnings Growth Targeted strategies for growth
Puerto
Rico
Market
Share
(1)
1) Source: Office of the Commissioner of Financial Institutions of Puerto Rico as of 6/30/13
and internal reports. 11
Current
Market
Share
Jun-13
Rank
Auto / leasing
19%
2
Commercial
20%
2
Credit cards
18%
2
Mortgage
originations
15%
3
Personal
8%
4
ACH Transactions
11%
6
ATM Terminals
8%
3
Debit Cards
7%
4
POS Terminals
11%
2
Branches
12%
4
Deposits
10%
4
Opportunities for ongoing market share gains
Largest opportunity on deposit products, electronic
banking & transaction services
Growth in selected loan products for balanced
risk/return to manage risk concentration and
diversify income sources
Recently acquired FirstBank-branded credit card
portfolio
Diversifies revenue stream and loan portfolio
composition
Opportunity to broaden and deepen relationships
SE Florida
Expansion prospects in Florida given long-term
demographic trends
Continue focus in core deposit growth, commercial
and transaction banking and conforming residential
mortgages
Virgin Islands
Solidify leadership position by further increasing
customer share of wallet
Puerto Rico |
 Opportunity for
Earnings Growth 12
Path to improved profitability
Net Interest
Income
Improvement
Cost of funds
reduction
$1.8B of brokered
CD’s maturing at 128
bps to be replaced at
75-85bps
Excess liquidity re-
investment
$700MM currently
yielding 25 bps
Replacement of NPLs
for performing loans
Additional loan
Provision
Reduction
Currently 134bps of
loans (excluding
bulk sales)
2000-2008
weighted average
provision of 98bps
on loans
Deposit fee income
from expansion of
transaction deposit
base
Non-interest bearing
represents only 9% of
deposit base
Market share
expansion of
transaction
processing
Credit costs of
$27MM
(1)
for the first
6 months of 2013
compared to 2008
annual expense of
$23MM
Fee Income
Opportunities
Operating Expense
Reduction
Long-term Efficiency Ratio Target of 55%
1) Represents net loss on REO operations and professional fees from collections, appraisals
and other credit related fees. FDIC Cost reduction
POS Terminals, Debit
cards, ACH
transactions, ATM
Terminals
growth as economy
recovers across our
geographies
with credit profile
improvement ($15 –
20
million annually) |
 Key Investment
Highlights 13
As of June 30, 2013.
1) See reconciliation to net income on page 18.
2) See reconciliation to total equity on page 19.
3) Assuming 100% reversal of Deferred Tax Asset Valuation Allowance of $523m; shares
outstanding of 207m. See reconciliation to adjusted tangible book value on page 19.
Improving core operating performance
Average
pre-tax
pre-provision
income
for
the
last
four
quarters
of
$48m
(1)
NIM expanded 135 bps since 2009 to 4.04% in 2Q 2013
Stabilization of non-interest expenses; expected reduction in credit-related expense
Healthy capital levels
Tier 1 Common of $1.2bn or 12.3% and Tier 1 capital of 15.3%
Tangible
Book
Value
of
$1.1bn
or
$5.32
/
share
(2)
Deferred Tax Asset Valuation Allowance of $523m; Adjusted Tangible Book Value
(3)
of $7.85 / share
Continuing de-risking of the balance sheet
Total
NPAs
declined
for
the
13
th
consecutive
quarter,
down
over
$1bn
or
58%
since
peak
in
1Q
2010
Focus remains on organic reductions of non-performing assets
Opportunity for revenue expansion and earnings growth
Strong loan origination capabilities ($1.8bn YTD 2013)
Potential for NIM expansion through reduction in cost of deposits
Expected reduction in credit-related and other expenses (e.g., FDIC insurance)
Increasing
market
share
in
fee
generating
products
and
services,
consumer
and
mortgage
loan
originations
Opportunity for commercial loan growth in SE Florida
Stabilization in Puerto Rico’s economy provides opportunities for growth
Long-term potential for value creation from consolidation in Puerto Rico
|
 Appendix
|
 Stock
Profile 15
Trading Symbol:
•
FBP
Exchange:
•
NYSE
Share
Price
(9/13/13):
•
$6.39
Shares
Outstanding
(as
of
June 30,
2013):
•
206,991,155
Market Capitalization
(9/13/13):
•
$1.35bn
1 Yr. Average Daily
Volume:
•
553,028
Price
(9/13/13)
to
Tangible
Book
(6/30/13):
•
1.20x
Price
(9/13/13)
to
Adjusted
Tangible Book
(1)
(6/30/13):
•
0.81x
5% of more Beneficial Ownership
Beneficial Owner
Amount
Percent of
Class
Entities affiliated with Thomas H. Lee
Partners, L.P.
41,843,581
20.2%
Entities managed by Oaktree Capital
Management, L.P.
41,843,581
20.2
United States Department of the
Treasury
(2)
20,966,340
10.1
Wellington Management Company, LLP
(3)
16,421,858
7.9
Assuming 100% reversal of Deferred Tax Valuation Allowance of $523m; shares outstanding
of 207m. Includes the U.S. Treasury warrant that entitles it to purchase up to 1,285,899 shares of
Common Stock at an exercise price of $3.29 per share, as adjusted as a result of the issuance of
shares of Common Stock in the Corporation’s $525m private placement of Common Stock
completed in October 2011. The exercise price and the number of shares issuable upon exercise of
the warrant are subject to further adjustments under certain circumstances to prevent
dilution. The warrant has a 10-year term from its issue date and is exercisable in whole or in part at any
time.
As of June 30, 2013.
1)
2)
3) |
 Capital Position
and Asset Quality Asset
quality
remains
our
number
one
focus,
while
preserving
and
growing
capital
Strong capital position: Total capital, Tier 1 capital and Leverage ratios of the
Corporation of 16.6%, 15.3% and 11.3%, respectively. $523
million
Deferred
Tax
Asset
Valuation
Allowance.
NPAs/Assets
Leverage ratio
Tier 1 Capital Ratio
Total Capital Ratio
16
9.5%
9.4%
10.0%
10.0%
9.3%
9.8%
10.2%
10.2%
10.2%
10.1%
9.6%
9.5%
8.4%
5.9%
8.4%
8.1%
8.3%
7.6%
7.8%
8.0%
8.4%
11.9%
12.3%
12.5%
12.7%
12.6%
12.1%
11.3%
12.0%
12.1%
12.0%
10.7%
10.7%
11.1%
11.1%
15.8%
16.0%
16.0%
16.2%
16.5%
16.2%
15.3%
13.3%
13.4%
13.3%
12.0%
12.0%
12.4%
12.4%
17.1%
17.4%
17.3%
17.5%
17.8%
17.4%
16.6%
6.0%
12.0%
18.0%
1Q '10
2Q '10
3Q '10
4Q '10
1Q '11
2Q '11
3Q '11
4Q '11
1Q '12
2Q '12
3Q '12
4Q '12
1Q '13
2Q '13
Core franchise is strong
– |
 Non-performing Assets
1) Collateral pledged with Lehman Brothers Special Financing, Inc.
17
2009
2010
2011
2012
6/30/2013
Non-performing loans held for investment:
Residential mortgage
441,642
$
392,134
$
338,208
$
313,626
$
133,937
$
Commercial mortgage
196,535
217,165
240,414
214,780
136,737
Commercial & industrial
241,316
317,243
270,171
230,090
131,906
Construction
634,329
263,056
250,022
178,190
68,204
Consumer & finance leases
50,041
49,391
39,547
38,875
35,416
Total non-performing loans held for investment
1,563,863
1,238,989
1,138,362
975,561
506,200
OREO
69,304
84,897
114,292
185,764
139,257
Other repossessed property
12,898
14,023
15,392
10,107
11,503
Other assets
(1)
64,543
64,543
64,543
64,543
-
Total non-performing assets, excluding loans
held for sale 1,710,608
1,402,452
1,332,589
1,235,975
656,960
Non-performing loans held for sale
-
159,321
4,764
2,243
94,951
Total non-performing assets
1,710,608
$
1,561,773
$
1,337,353
$
1,238,218
$
751,911
$
($ in millions) |
  Adjusted
Pre-tax, Pre-provision Income Reconciliation 18
($ in thousands)
2Q 2012
3Q 2012
4Q 2012
1Q 2013
2Q 2013
Income (loss) before income taxes
10,901
$
19,834
$
16,028
$
(71,011)
$
(123,562)
$
Add: Provision for loan and lease losses
24,884
28,952
30,466
111,123
87,464
Add: Net loss on investments and impairments
143
547
69
117
42
Less: Unrealized gain (loss) on derivatives instruments and
liabilities measured at fair value
(506)
(170)
(432)
(400)
(708)
Add: Bulk sales related expenses and other professional fees related
to the terminated preferred stock exchange offer
-
-
-
5,096
3,198
Add: Loss on certain OREO properties sold as part of the bulk sale
of non-performing residential mortgage assets
-
-
-
-
1,879
Add: National gross tax receipts tax corresponding to Q1 2013
recorded during Q2 2013 after enactment
-
-
-
-
1,656
Add: write-off of collateral pledged to Lehman
-
-
-
-
66,574
Add: Equity in losses (earnings) of unconsolidated entities
2,491
2,199
8,330
5,538
(648)
Adjusted Pre-tax, pre-provision income
37,913
$
51,362
$
54,461
$
50,463
$
35,895
$
Quarter Ended |
 Tangible Book
Value Per Share Reconciliation 19
2Q 2012
3Q 2012
4Q 2012
1Q 2013
2Q 2013
Tangible equity:
Total equity - GAAP
1,449
$
1,484
$
1,485
$
1,404
$
1,222
$
Preferred equity
(63)
(63)
(63)
(63)
(63)
Goodwill
(28)
(28)
(28)
(28)
(28)
Purchased credit card relationship
(24)
(24)
(24)
(23)
(22)
Core deposit intangible
(11)
(10)
(9)
(9)
(8)
Tangible common equity
1,323
$
1,359
$
1,361
$
1,282
$
1,101
$
Common shares outstanding
206
206
206
206
207
Tangible book value per common share
6.42
$
6.59
$
6.60
$
6.21
$
5.32
$
Deferred tax valuation allowance
367
$
360
$
360
$
384
$
523
$
Deferred tax valuation allowance per share
1.78
1.75
1.75
1.86
2.53
Adjusted tangible book value per share
8.20
$
8.34
$
8.34
$
8.08
$
7.85
$
($ in millions, except for per share data) |
 |