Attached files
| file | filename |
|---|---|
| 8-K - 8-K - Rockwood Holdings, Inc. | a13-20807_28k.htm |
Exhibit 99.1
|
|
Credit Suisse Chemical & Ag Science Conference September 2013 Maximizing Shareholder Value |
|
|
Forward Looking Statements This presentation contains, and management may make, certain "forward-looking statements" within the meaning of the Private Securities Litigation Reform Act of 1995. All statements other than statements of historical facts may be forward-looking statements. Words such as "may,” “will,” “should,” “could,” “likely,” “anticipates," “intends,” "believes," "estimates," "expects," "forecasts," “plans,” “projects,” "predicts," “potential,” and “outlook” and similar words and expressions are intended to identify forward-looking statements. Examples of our forward-looking statements include, among others, statements relating to our outlook, our future operating results on a segment basis, our future Adjusted EBITDA, Adjusted EBITDA margins, EPS Growth and free cash flows, estimated cash proceeds from divestitures and our strategic initiatives. Although they reflect Rockwood’s current expectations, they involve a number of known and unknown risks, uncertainties and other factors that could cause actual results to differ materially from those expressed or implied, and not guarantees of future performance. These risks, uncertainties and other factors include, without limitation, Rockwood’s business strategy; changes in general economic conditions in North America and Europe and in other locations in which Rockwood currently does business; competitive pricing or product development activities affecting demand for Rockwood’s products; technological changes affecting production of Rockwood’s materials; fluctuations in interest rates, exchange rates and currency values; availability and pricing of raw materials; governmental and environmental regulations and changes in those regulations; fluctuations in energy prices; changes in the end-use markets in which Rockwood’s products are sold; hazards associated with chemicals manufacturing; Rockwood’s ability to access capital markets; Rockwood’s high level of indebtedness; risks associated with competition and the introduction of new competing products, especially from the Asia-Pacific region; risks associated with international sales and operations; risks associated with information securities and the risks, uncertainties and other factors discussed under "Risk Factors" and “Management’s Discussion and Analysis of Financial Condition and Results of Operations” in Rockwood's Form 10-K for the year ended December 31, 2012 and other periodic reports filed with or furnished to the Securities and Exchange Commission. Rockwood does not undertake any obligation to publicly update or revise any forward-looking statement, whether as a result of new information, future events or otherwise. |
|
|
Agenda Rockwood Investment Considerations Strategy and Business Overview Update on 2013 Initiatives Pro-Forma Core Business Financials and Net Est. Cash on Hand Core Businesses Lithium Surface Treatment Rockwood Strategy to Maximize Shareholder Value Appendices |
|
|
Rockwood Strategy and Business Overview |
|
|
Corporate Strategy/Management Philosophy Self-sufficient, highly focused and accountable business units with the following characteristics: Global market leadership Technology leadership High EBITDA margins of 25%+ Limited exposure to oil-based raw materials pricing Small corporate center Self-sufficient and accountable business units Detailed operating metrics Short term incentive plan based on cash generation Long term equity plan for key executives On-site communication and motivation of all employees Corporate Strategy Management Philosophy Customers – Focus on superior customer service Cash Generation – Deliver superior financial performance, productivity improvement and disciplined redeployment of capital; and Commitment – Target excellence and execution Corporate Culture |
|
|
Rockwood Investment Considerations Market-leading business niche positions Adjusted EBITDA margins of 25%+ Strong free cash flow Solid balance sheet with no net debt Goal of 20% average annual EPS growth Shareholder-aligned management team with meaningful equity ownership |
|
|
2013 Planned Initiatives: Maximizing Shareholder Value Initiatives Progress Update Announced share repurchase program for up to $400 million Completed program, having repurchased 6.23 million shares for average price of $64.17/ps Estimated dividend yield in range of 2.8% to 3.2% Increased quarterly dividend by nearly 30% to $0.45/ps from $0.35/ps last year Expected repayment up to $600 million of debt Repaid more than $1.43 billion of secured term debt Launched strategic evaluation process for non-core businesses Concluded process to address non-strategic businesses through announced sales of 7 businesses for total enterprise value of ~ $3.9 billion, adjusting for assumed pension obligations Closed sale on Advanced Ceramics business for an enterprise value of EUR 1.49 billion on August 31, 2013 Entered into definitive agreement to sell Clay Additives business for $635 million (expected close 4th quarter 2013) Executed definitive sale agreement for TiO2 and four other non-strategic businesses for enterprise value of $1.325B (expected to close 1st half 2014) |
|
|
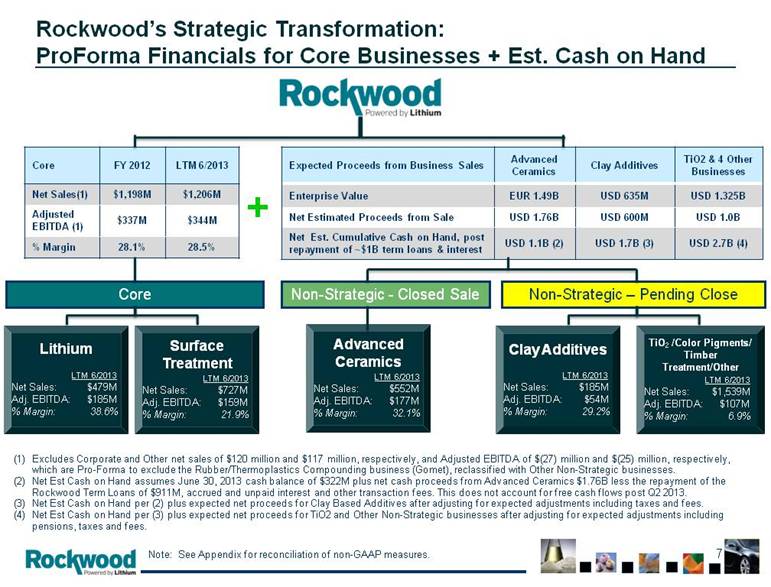
Rockwood’s Strategic Transformation: ProForma Financials for Core Businesses + Est. Cash on Hand Clay Additives LTM 6/2013 Net Sales: $185M Adj. EBITDA: $54M % Margin: 29.2% Surface Treatment LTM 6/2013 Net Sales: $727M Adj. EBITDA: $159M % Margin: 21.9% Note: See Appendix for reconciliation of non-GAAP measures. TiO2 /Color Pigments/ Timber Treatment/Other LTM 6/2013 Net Sales: $1,539M Adj. EBITDA: $107M % Margin: 6.9% Lithium LTM 6/2013 Net Sales: $479M Adj. EBITDA: $185M % Margin: 38.6% Advanced Ceramics LTM 6/2013 Net Sales: $552M Adj. EBITDA: $177M % Margin: 32.1% Non-Strategic - Closed Sale Core Core FY 2012 LTM 6/2013 Net Sales(1) $1,198M $1,206M Adjusted EBITDA (1) $337M $344M % Margin 28.1% 28.5% Non-Strategic – Pending Close Excludes Corporate and Other net sales of $120 million and $117 million, respectively, and Adjusted EBITDA of $(27) million and $(25) million, respectively, which are Pro-Forma to exclude the Rubber/Thermoplastics Compounding business (Gomet), reclassified with Other Non-Strategic businesses. Net Est Cash on Hand assumes June 30, 2013 cash balance of $322M plus net cash proceeds from Advanced Ceramics $1.76B less the repayment of the Rockwood Term Loans of $911M, accrued and unpaid interest and other transaction fees. This does not account for free cash flows post Q2 2013. Net Est Cash on Hand per (2) plus expected net proceeds for Clay Based Additives after adjusting for expected adjustments including taxes and fees. Net Est Cash on Hand per (3) plus expected net proceeds for TiO2 and Other Non-Strategic businesses after adjusting for expected adjustments including pensions, taxes and fees. Expected Proceeds from Business Sales Advanced Ceramics Clay Additives TiO2 & 4 Other Businesses Enterprise Value EUR 1.49B USD 635M USD 1.325B Net Estimated Proceeds from Sale USD 1.76B USD 600M USD 1.0B Net Est. Cumulative Cash on Hand, post repayment of ~$1B term loans & interest USD 1.1B (2) USD 1.7B (3) USD 2.7B (4) + |
|
|
Core Businesses: Lithium and Surface Treatment |
|
|
Diversity. Flexibility. Results. Lowest Cost Producer Long-Term Reserves with High Lithium Concentration Integrated Business Model for Upstream and Downstream Production Lithium: #1 Global Integrated Producer of Lithium Compounds & Chemicals |
|
|
Lithium – Net Sales & Adjusted EBITDA Note: See Appendix for reconciliation of non-GAAP measures. 302 324 391 436 357 397 457 474 479 118 115 126 125 2005 2006 2007 2008 2009 2010 2011 2012 LTM 6/2013 Q1/Q2 2013 Q1/Q2 2012 Q2 Net Sales Q1 Net Sales 91 109 146 181 141 144 170 182 185 47 44 49 48 2005 2006 2007 2008 2009 2010 2011 2012 LTM 6/2013 Q1/Q2 2013 Q1/Q2 2012 Q2 Adj. EBITDA Q1 Adj. EBITDA Adjusted EBITDA Net Sales [$M] [$M] 30.3% 33.8% 37.4% 41.5% 39.5% 36.4% 37.3% 38.3% Margin % 38.6% 39.2% 38.6% 244 239 96 92 |
|
|
Organo- metallics Lithium Metal Special Salts Pharmaceuticals Pharmaceuticals Glass Ceramics Grease CO2 Absorption Elastomers Aluminum Li Primary Batteries Electronic Materials Cement Al-Alloys Mining Agrochemicals Li-Ion Batteries Li-Ion Batteries Scintillation Industrial Catalysis Airbag Ignition Lithium: Key Upstream and Downstream Products and Applications Electronics Lithium Carbonate Lithium Hydroxide 2012 Net Sales by Products: Organometallics and Lithium Metal – 49%; Lithium Salts (Lithium Carbonate, Lithium Hydroxide, Potash) – 37%; Special Salts – 14%. |
|
|
Li-Acetylide Methyl- lithium Phenyl- lithium LDA LHS Li-t- Butoxide Li- Methoxide Li- Hydride Li-tri (t-butoxy)- alanate Li- Amide Li- Salicylate Li- Citrate Li- Benzoate Li- Acetate Li- Zeolite Potash Bischofite Li- Sulphate Li- Nitrate Li- Phosphate Li- Silicate Li-Tetra- borate Li- Chromate Sabalith Li- Nitride Li- Bromide Li- Fluoride Li- Peroxide Li- Hydroxide CO2- Absorption Products Li- Iodide Li- Perchlorate LiBOB Anodes Foils Lithium Carbonate Lithium Chloride Brines Butyl- lithium Li- Alanate Lithium Metal Life-Science Products Metal and Battery Products Other Products Lithium: Our Integrated Value Chain |
|
|
Lithium Business Model: Maximize Profit Margins Through Higher Value-Added Downstream Processes |
|
|
Lithium Net Sales Source: Company 2012 estimates. Competitors FMC Corporation Sociedad Quimica y Minera de Chile S.A. Tianqi Lithium / Talison Cabot Corporation Major Customers Syngenta AG Umicore Group Reshine Group Samsung SDI Co. Ltd. Bayer Crop Science Royal DSM N.V. ROC Net Sales by End-Market Pharma & Agriculture 36% Chemicals & Plastics 23% Batteries 13% Other 28% |
|
|
Lithium Historical Market Development Source: Rockwood Lithium estimates ‘*Other Applications’ include air treatment, Aluminum production, rubbers * |
|
|
Potential Lithium Demand Volume Scenarios Source: Rockwood Lithium estimates and market surveys from BCG, Bloomberg, Avicenne, Roland Berger, Pike Research, Frauenhofer IST, Deutsche Bank Research, McKinsey, CTI, Anderman, JD Powers Glass & Ceramics Lubricating Greases Other Applications Portable Batteries 0 50,000 100,000 150,000 200,000 250,000 300,000 350,000 2012 2013 2014 2015 2016 2017 2018 2019 2020 Automotive high Automotive low Automotive aver. |

|
|
Potential LCE Demand for Lithium Battery (LIB) Market Source: Rockwood Lithium estimates and market surveys from BCG, Bloomberg, Avicenne, Roland Berger, Pike Research, Frauenhofer IST, Deutsche Bank Research, McKinsey, CTI, Anderman, JD Powers Application Lithium Carbonate Content Cell Phone 3 grams ~ 0.1 oz Notebook 30 grams ~ 1.0 oz Power Tool 30-40 grams ~ 1.0-1.4 oz Hybrid (HEV) 2.5 lbs Plug-in Hybrid (PHEV) 15 kWh 20 lbs Electrical Vehicle (EV) 25 kWh 50 lbs |
|
|
E-Mobility – BEV and PHEV Market Development Source: Bloomberg New Energy Finance, Rockwood Lithium * Estimate based on 71 MM global new car sales in 2012; HEV new car sales of 875,000 in 2010, 715,000 in 2011, 1.7 million in 2012, and estimated 1.8 million in 2013 Drivers: BEV and PHEV sales trends increase significantly, following on societal growing adoption of non-conventional cars (i.e., HEV) Global incremental increase of EV new car sales driven by US, Japan, and Europe Switch from conventional to alternative fuel vehicles as % of new sales driven by increased number of models available New Sales 2010-2013 Available Number of BEV/PHEV Models Source: CFA‚ On the road to 54 MPG, April 2013 New Sales by Region Best Selling EVs in 2012: GM Volt (30,000 units) Toyota Prius PHV (27,000 units) Nissan Leaf (25,000 units) Mitsubishi i-MiEV (14,000 units) 0.3% EVs of 74 MM* new car sales in 2013 51,000 120,000 |

|
|
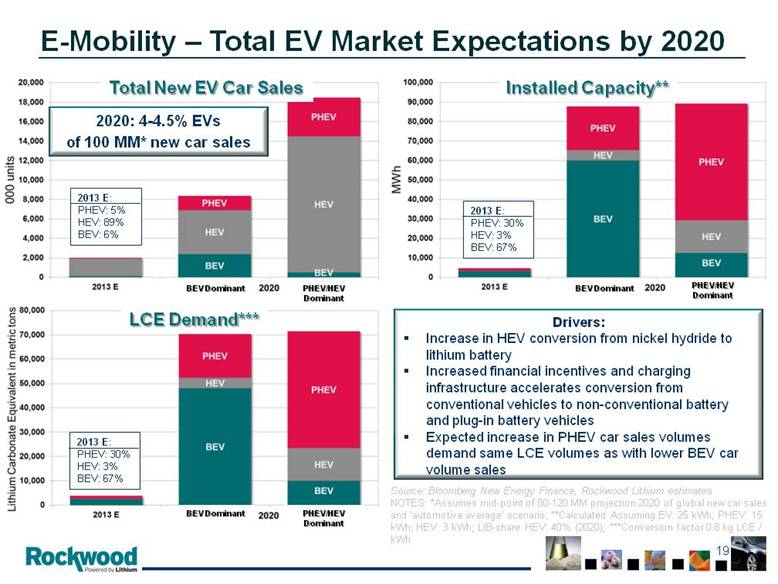
E-Mobility – Total EV Market Expectations by 2020 Source: Bloomberg New Energy Finance, Rockwood Lithium estimates NOTES: *Assumes mid-point of 80-120 MM projection 2020 of global new car sales and ‘automotive average’ scenario; **Calculated Assuming EV: 25 kWh; PHEV: 15 kWh; HEV: 3 kWh; LIB-share HEV: 40% (2020); ***Conversion factor 0.8 kg LCE / kWh Total New EV Car Sales Installed Capacity** LCE Demand*** Drivers: Increase in HEV conversion from nickel hydride to lithium battery Increased financial incentives and charging infrastructure accelerates conversion from conventional vehicles to non-conventional battery and plug-in battery vehicles Expected increase in PHEV car sales volumes demand same LCE volumes as with lower BEV car volume sales 2020: 4-4.5% EVs of 100 MM* new car sales 2013 E: PHEV: 5% HEV: 89% BEV: 6% 2013 E: PHEV: 30% HEV: 3% BEV: 67% 2013 E: PHEV: 30% HEV: 3% BEV: 67% BEV Dominant BEV Dominant BEV Dominant PHEV/HEV Dominant PHEV/HEV Dominant PHEV/HEV Dominant |
|
|
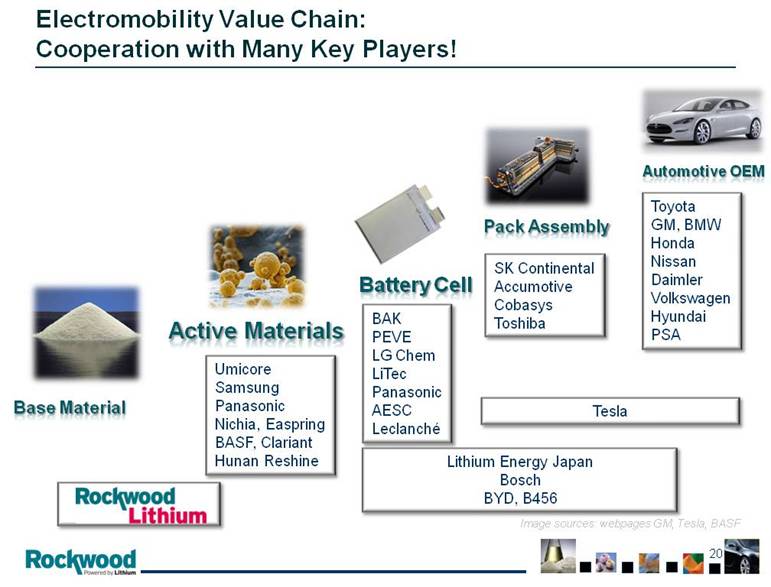
Electromobility Value Chain: Cooperation with Many Key Players! Base Material Active Materials Pack Assembly Automotive OEM Battery Cell Umicore Samsung Panasonic Nichia, Easpring BASF, Clariant Hunan Reshine Image sources: webpages GM, Tesla, BASF BAK PEVE LG Chem LiTec Panasonic AESC Leclanché Lithium Energy Japan Bosch BYD, B456 SK Continental Accumotive Cobasys Toshiba Toyota GM, BMW Honda Nissan Daimler Volkswagen Hyundai PSA Tesla |
|
|
Surface Treatment: 2nd largest global producer of products & services for metal processing Growing market share due to innovation and customer relationships and reputation Strong free cash flow generation |
|
|
Surface Treatment – Net Sales & Adjusted EBITDA Note: FY 2008 on a proforma basis including bolt-on acquisitions. See Appendix for reconciliation of non-GAAP measures. 471 522 594 724 564 662 743 723 727 185 189 191 184 2005 2006 2007 2008 PF 2009 2010 2011 2012 LTM 6/2013 Q1/Q2 2013 Q1/Q2 2012 Q2 Net Sales Q1 Net Sales 69 82 98 120 86 124 151 155 159 39 40 43 39 2005 2006 2007 2008 PF 2009 2010 2011 2012 LTM 6/2013 Q1/Q2 2013 Q1/Q2 2012 Q2 Adj. EBITDA Q1 Adj. EBITDA Adjusted EBITDA Net Sales [$M] [$M] 14 . 7 % 15.8% 16.5% 16.6% 15.2% 18.7% 20.3% 21.5% Margin % 21.9% 22.1% 21 . 1 % 376 372 83 79 |
|
|
Aerospace Sealants and sealant removers, NDT products and equipment, corrosion protection, cleaners, pretreatment and paint strippers for airframe, aircraft operation and aero-engine applications. Automotive OEM Globally harmonized technologies available for NDT products, inhibitors, conversion coatings, cleaners, coolants, activating and passivating agents and maintenance chemicals. Appliances, HVAC Broad portfolio eco-friendly, nickel-free and chrome-free processes – from cleaners, conversion coatings, paint detackification to maintenance chemicals. Aluminium Finishing Pretreatment technologies, anodizing processes and service products ensure an excellent surface in the architectural and construction industry. Surface Treatment Markets Coil A variety of technologies for coil coating and galvanizing processes. Prepainted and passivated metal sheets are used in automotive, building, electrical and packaging industries. Automotive Components Broad portfolio of technologies from cleaners to conversion coatings for all kinds of components and substrates, such as steel or aluminium wheels, bumpers or diesel injection systems. General Industry Broad portfolio of metal pretreatment technologies for all kinds of applications such as furniture, garden fences, trains, electrical cabines and many more. Metal Packaging High efficient cleaners, conversion treatments and mobility enhancers for the aluminium beverage can manufacturing. Metal (Cold) Forming Tube industry (from the blank tube to the precision tube), wire industry (from cold heading to spring steel wire) and cold extrusion (complex geometries extruded net shape). Heavy Equipment Eco-friendly and efficient technologies ensure an excellent and long-term surface quality for off-road vehicles, construction equipment, industrial machines and agricultural vehicles. |

|
|
Surface Treatment – Net Sales Source: Company 2012 estimates. Competitors Henkel AG & Co. KGaA Nihon Parkerizing Co., Ltd. PPG Industries, Inc. Nippon Paint Co., Ltd. Major Customers Daimler AG ArcelorMittal Volkswagen AG European Aeronautic Defense & Space Company (EADS) N.V. Ford ROC Net Sales by End-Market General Industry 38% Automotive OEM 16% Aerospace 15% Automotive Components 11% Coil 10% Cold Forming 8% Aluminium Finishing 2% |
|
|
Surface Treatment – Estimated Market Share Market Share by Segment Estimated Total Market Chemetall Net Sales Automotive $ 800 million $ 117 million Wheels $ 85 million $ 19 million Can $ 85 million $ 3 million Metal Working $ 650 million $ 54 million Aluminum Finishing $ 250 million $ 16 million Auto Components $ 250 million $ 56 million Source: Company 2012 estimates. 2012 2007 |
|
|
Going Forward: Further Enhancing Shareholder Value |
|
|
Rockwood’s Strategic Transformation: ProForma Financials for Core Businesses + Est. Cash on Hand Clay Additives LTM 6/2013 Net Sales: $185M Adj. EBITDA: $54M % Margin: 29.2% Surface Treatment LTM 6/2013 Net Sales: $727M Adj. EBITDA: $159M % Margin: 21.9% Note: See Appendix for reconciliation of non-GAAP measures. TiO2 /Color Pigments/ Timber Treatment/Other LTM 6/2013 Net Sales: $1,539M Adj. EBITDA: $107M % Margin: 6.9% Lithium LTM 6/2013 Net Sales: $479M Adj. EBITDA: $185M % Margin: 38.6% Advanced Ceramics LTM 6/2013 Net Sales: $552M Adj. EBITDA: $177M % Margin: 32.1% Non-Strategic - Closed Sale Core Core FY 2012 LTM 6/2013 Net Sales(1) $1,198M $1,206M Adjusted EBITDA (1) $337M $344M % Margin 28.1% 28.5% Non-Strategic – Pending Close Excludes Corporate and Other net sales of $120 million and $117 million, respectively, and Adjusted EBITDA of $(27) million and $(25) million, respectively, which are Pro-Forma to exclude the Rubber/Thermoplastics Compounding business (Gomet), reclassified with Other Non-Strategic businesses. Net Est Cash on Hand assumes June 30, 2013 cash balance of $322M plus net cash proceeds from Advanced Ceramics $1.76B less the repayment of the Rockwood Term Loans of $911M, accrued and unpaid interest and other transaction fees. This does not account for free cash flows post Q2 2013. Net Est Cash on Hand per (2) plus expected net proceeds for Clay Based Additives after adjusting for expected adjustments including taxes and fees. Net Est Cash on Hand per (3) plus expected net proceeds for TiO2 and Other Non-Strategic businesses after adjusting for expected adjustments including pensions, taxes and fees. Expected Proceeds from Business Sales Advanced Ceramics Clay Additives TiO2 & 4 Other Businesses Enterprise Value EUR 1.49B USD 635M USD 1.325B Net Estimated Proceeds from Sale USD 1.76B USD 600M USD 1.0B Net Est. Cumulative Cash on Hand, post repayment of ~$1B term loans & interest USD 1.1B (2) USD 1.7B (3) USD 2.7B (4) + |

|
|
Rockwood Strategy to Further Enhance Shareholder Value Focus Portfolio Focus On Growth & Productivity Improve Financial Ratios Invest in The Business Drive top tier growth in core businesses: Lithium and Surface Treatment Allocate a significant amount of our cash on hand to: Promote organic growth; and Make acquisitions that are accretive, create value, and meet Rockwood’s strategic criteria: Global market position Adjusted EBITDA margin of 25%+ Global industry technology leader Limited exposure to oil-based raw materials Continue return of capital to shareholders |
|
|
Credit Suisse Chemical & Ag Science Conference September 2013 Maximizing Shareholder Value |
|
|
Appendices |
|
|
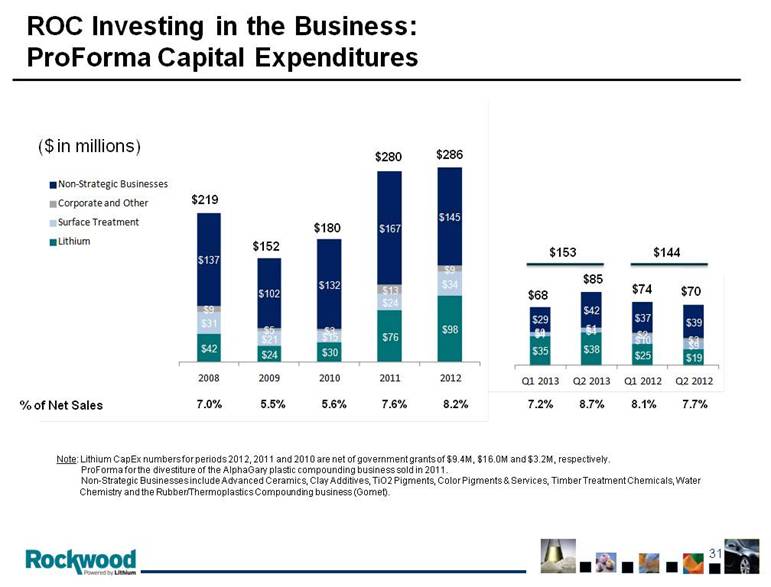
ROC Investing in the Business: ProForma Capital Expenditures Note: Lithium CapEx numbers for periods 2012, 2011 and 2010 are net of government grants of $9.4M, $16.0M and $3.2M, respectively. ProForma for the divestiture of the AlphaGary plastic compounding business sold in 2011. Non-Strategic Businesses include Advanced Ceramics, Clay Additives, TiO2 Pigments, Color Pigments & Services, Timber Treatment Chemicals, Water Chemistry and the Rubber/Thermoplastics Compounding business (Gomet). ($ in millions) % of Net Sales 7.0% 5.5% 5.6% 7.6% 8.2% 7.2% 8.7% 8.1% 7.7% $219 $152 $180 $280 $68 $74 $286 $70 $85 $153 $144 $35 $38 $25 $ 19 $4 $4 $10 $9 $0 $1 $2 $3 $29 $42 $37 $39 Q1 2013 Q2 2013 Q1 2012 Q 2 2012 $42 $24 $30 $76 $98 $31 $21 $15 $24 $34 $ 137 $102 $132 $167 $145 $9 $5 $3 $13 $9 2008 2009 2010 2011 2012 Non - Strategic Businesses Corporate and Other Surface Treatment Lithium |
|
|
Rockwood Consolidated Net Debt: Historical and ProForma for Expected Net Sales Proceeds ProForma (a)(b) ProForma (a)(c) ($M) December 31, 2012 June 30, 2013 June 30, 2013 June 30, 2013 LTM Adj EBITDA $778.9 $656.9 $425.9 $319.2 Net Debt Rockwood Term Loans 924.1 911.0 - - TiO2 Venture Term Loans 514.5 - - - Other Debt 63.1 62.6 59.7 44.2 Sr. Sub. Notes 1,250.0 1,250.0 1,250.0 1,250.0 Total Debt $2,751.8 $2,223.6 $1,309.7 $1,294.2 Cash (1,273.6) (321.7) (1,734.6) (2,734.6) Net Debt $1,478.2 $1,901.9 ($424.9) ($1,440.4) Net Debt / LTM Adj. EBITDA 1.90 x 2.90 x -1.00 x -4.51 x As Reported (a) (a) All Euro denominated debt is converted at the balance sheet rate ($1.32 at 12/31/12 and $1.30 at 6/30/13) (b) ProForma for the net cash proceeds from the sale of Advanced Ceramics, the repayment of the Rockwood Term Loans and the expected net cash proceeds from the sale of Clay Additives. (c) ProForma for the net cash proceeds from the sale of Advanced Ceramics, the repayment of the Rockwood Term Loans and the expected net cash proceeds from the sale of Clay Additives, TiO2 and 4 Other Non-Strategic businesses. |
|
|
ROC Free Cash Flow (a) Note: See Appendix for reconciliation of non-GAAP measures. ($M) 2008 2009 2010 2011 2012 Adjusted EBITDA $639 $541 $668 $863 $779 WC Change (b) (119) 119 27 (187) (147) Cash Taxes (41) (32) (35) (98) (88) Cash Interest (c) (164) (174) (159) (92) (71) Cash From Operating Activities $315 $454 $502 $486 $473 CAPEX (d) (219) (152) (181) (279) (284) Free Cash Flow (a) (e) $96 $302 $320 $207 $189 ($M) Q1 2013 Q1 2012 Q2 2013 Q2 2012 Adjusted EBITDA $168 $235 $166 $221 WC Change (b) (79) (146) 11 (80) Cash Taxes (13) (9) (32) (20) Cash Interest (c) (14) (26) (40) (13) Cash From Operating Activities $62 $54 $105 $108 CAPEX (d) (67) (73) (85) (69) Free Cash Flow (a) (e) ($6) ($19) $20 $39 (a) (b) (c) (d) CAPEX net of government grants received and proceeds on sale of assets. (e) Includes changes in accounts receivable, inventories, prepaid expenses, accounts payable, income taxes payable and accrued expenses. All figures net of the effect of foreign currency translation and impact of acquisitions and divestitures. Free Cash Flow is before share repurchases of $216.4 million and dividends paid of $61.9 million in the first half of 2013. Interest on the $1.25 billion Senior Notes due in 2020 is paid semi-annually in April and October of each year, commencing April 2013. Includes free cash flow for discontinued operations. |
|
|
Reconciliation of As Reported Cash to ProForma Cash ($ in millions) As reported cash and cash equivalents balance as of June 30, 2013 321.7 $ Proceeds from sale of Advanced Ceramics business 1,755.0 Redemption of senior secured credit facility (911.0) Estimated fees and expenses associated with Adv. Ceramics sale (28.0) Accrued interest on senior secured credit facility (3.1) ProForma cash and cash equivalents balance as of June 30, 2013 1,134.6 Enterprise value from sale of Clay Additives business 635.0 Estimated taxes, fees, expenses and other required adjustments associated with Clay Additives sale (35.0) ProForma cash and cash equivalents balance as of June 30, 2013 1,734.6 Enterprise value from sale of TiO2 and four other businesses 1,325.0 Estimated pension, taxes, fees, expenses and other required adjustments associated with TiO2 and other non-strategic businesses sale (325.0) ProForma cash and cash equivalents balance as of June 30, 2013 2,734.6 $ |
|
|
Reconciliation of Net Sales – LTM 6/30/2013 (a) Performance Additives comprised of Color Pigments & Services, Timber Treatment Chemicals and Other. Excludes Clay Additives. (b) Corporate and Other includes $22.9 million of net sales from the Rubber/Thermoplastics Compounding business (Gomet). Titanium Surface Performance Clay Dioxide Advanced Corporate Lithium Treatment Additives (a) Additives Pigments Ceramics and other (b) Three months ended September 30, 2012 116.0 $ 175.3 $ 131.7 $ 46.4 $ 229.6 $ 130.3 $ 33.5 $ 862.8 $ Three months ended December 31, 2012 119.1 175.5 112.1 39.3 223.0 129.0 31.0 829.0 Three months ended March 31, 2013 118.5 184.5 129.1 48.0 273.1 142.9 38.5 934.6 Three months ended June 30, 2013 125.7 191.2 141.6 51.3 275.8 150.0 36.7 972.3 Twelve months ended June 30, 2013 479.3 $ 726.5 $ 514.5 $ 185.0 $ 1,001.5 $ 552.2 $ 139.7 $ 3,598.7 $ ($ in millions) Total |
|
|
Inc. Before Taxes To Adjusted EBITDA – LTM 6/2013 (a) Performance Additives comprised of Color Pigments & Services, Timber Treatment Chemicals and Other. Excludes Clay Additives. (b) Corporate and Other includes $5.4 million of Adjusted EBITDA from the Rubber/Thermoplastics Compounding business (Gomet). Titanium Surface Performance Clay Dioxide Advanced Corporate Lithium Treatment Additives (a) Additives Pigments Ceramics and other (b) Twelve months ended June 30, 2013 Income (loss) before taxes 106.0 $ 102.6 $ 11.0 $ 42.1 $ (88.7) $ 106.4 $ (112.8) $ 166.6 $ Interest expense, net 2.8 12.7 4.1 - 23.4 (0.5) 61.1 103.6 Depreciation and amortization 45.6 31.6 47.0 11.1 72.6 52.2 9.2 269.3 Restructuring and other severance costs 18.4 9.4 4.4 0.4 2.2 2.6 0.1 37.5 Systems/organization establishment expenses 0.8 2.1 - - 0.8 - 0.1 3.8 Acquisition and disposal costs 0.1 0.9 0.2 0.1 0.6 15.5 12.2 29.6 Acquisition method inventory charges - - - - 3.3 - - 3.3 Loss on early extinguishment/modification of debt 0.4 - 0.2 - 17.7 - 1.7 20.0 Asset write-downs and other 4.8 0.1 0.1 0.2 - 0.5 - 5.7 Foreign exchange loss (gain) on financing activities, net 6.5 (0.4) 0.4 - - 0.2 6.6 13.3 Other (0.1) 0.4 0.7 - 1.5 - 1.7 4.2 Total Adjusted EBITDA 185.3 $ 159.4 $ 68.1 $ 53.9 $ 33.4 $ 176.9 $ (20.1) $ 656.9 $ ($ in millions) Total |
|
|
Inc. from Cont. Ops. To Adjusted EBITDA – 2012 (a) Discontinued operations include the Advanced Ceramics and Clay Additives businesses. Titanium Surface Performance Dioxide Discontinued Corporate Lithium Treatment Additives Pigments Operations and other Year ended December 31, 2012 Income (loss) from continuing operations before taxes 98.8 $ 91.6 $ 5.8 $ 56.2 $ - $ (76.2) $ 176.2 $ Interest expense, net 3.3 15.6 5.3 22.6 - 40.2 87.0 Depreciation and amortization 44.2 31.9 48.1 70.6 - 8.6 203.4 Restructuring and other severance costs 26.1 8.0 6.1 1.8 - 0.2 42.2 Systems/organization establishment expenses 0.6 1.4 0.1 2.2 - 0.1 4.4 Acquisition and disposal costs - 0.2 - 2.2 - (2.3) 0.1 Acquisition method inventory charges - - - 3.3 - - 3.3 Loss on early extinguishment/modification of debt 2.6 3.0 0.9 2.8 - 5.5 14.8 Asset write-downs and other 0.1 0.2 0.2 - - - 0.5 Foreign exchange loss (gain) on financing activities, net 6.2 3.0 (0.1) - - 1.1 10.2 Other - 0.3 0.3 3.0 - 1.1 4.7 Adjusted EBITDA from continuing operations 181.9 155.2 66.7 164.7 - (21.7) 546.8 Discontinued operations (a) - - - - 232.1 - 232.1 Total Adjusted EBITDA 181.9 $ 155.2 $ 66.7 $ 164.7 $ 232.1 $ (21.7) $ 778.9 $ ($ in millions) Consolidated |
|
|
Inc. from Cont. Ops. To Adjusted EBITDA – 2011 (a) Discontinued operations include the Advanced Ceramics and Clay Additives businesses. Titanium Surface Performance Dioxide Discontinued Corporate Lithium Treatment Additives Pigments Operations and other Year ended December 31, 2011 Income (loss) from continuing operations before taxes 118.0 $ 80.3 $ 21.1 $ 163.7 $ - $ (105.6) $ 277.5 $ Interest expense, net 7.4 20.6 7.2 12.7 - 48.2 96.1 Depreciation and amortization 41.4 33.1 48.0 71.9 - 8.7 203.1 Restructuring and other severance costs 3.2 8.0 2.3 - - 0.3 13.8 Systems/organization establishment expenses - 0.8 0.6 5.0 - - 6.4 Acquisition and disposal costs - 0.1 - - - 0.2 0.3 Loss on early extinguishment/modification of debt 2.9 4.8 1.4 - - 7.5 16.6 Asset write-downs and other 0.1 0.1 0.7 - - - 0.7 Foreign exchange (gain) loss on financing activities, net (2.8) 3.0 0.1 - - (3.4) (3.1) Other - 0.2 0.2 4.3 - 0.4 5.3 Adjusted EBITDA from continuing operations 170.2 151.0 81.6 257.6 - (43.7) 616.7 Discontinued operations (a) - - - - 246.1 - 246.1 Total Adjusted EBITDA 170.2 $ 151.0 $ 81.6 $ 257.6 $ 246.1 $ (43.7) $ 862.8 $ ($ in millions) Consolidated |
|
|
Inc. from Cont. Ops. To Adjusted EBITDA – 2010 (a) Discontinued operations include the Advanced Ceramics and Clay Additives businesses. Excludes the discontinued operations the plastic compounding business of $33.5 million. Titanium Surface Performance Dioxide Discontinued Corporate Lithium Treatment Additives Pigments Operations and other Year ended December 31, 2010 Income (loss) from continuing operations before taxes 85.5 $ 55.5 $ 0.1 $ 44.5 $ - $ (119.2) $ 66.4 $ Interest expense, net 20.7 30.3 23.2 15.0 - 61.6 150.8 Depreciation and amortization 37.1 33.6 47.2 69.6 - 9.2 196.7 Restructuring and other severance costs - 2.0 1.5 - - 0.4 3.9 Systems/organization establishment expenses - 1.0 0.4 0.5 - 0.1 2.0 Acquisition and disposal costs - 0.1 0.2 - - 1.0 1.3 Loss on early extinguishment/modification of debt 0.2 0.4 0.3 - - 0.7 1.6 Asset write-downs and other 0.3 1.5 4.1 0.1 - 4.7 10.7 Foreign exchange loss (gain) on financing activities, net 0.6 (0.2) 0.1 - - 0.9 1.4 Other - (0.1) 0.7 (0.2) - - 0.4 Adjusted EBITDA from continuing operations 144.4 124.1 77.8 129.5 - (40.6) 435.2 Discontinued operations (a) - - - - 199.2 - 199.2 Total Adjusted EBITDA 144.4 $ 124.1 $ 77.8 $ 129.5 $ 199.2 $ (40.6) $ 634.4 $ ($ in millions) Consolidated |
|
|
Inc. from Cont. Ops. To Adjusted EBITDA – 2009 (a) Discontinued operations include the Advanced Ceramics and Clay Additives businesses. Excludes the discontinued operations the plastic compounding business of $30.6 million. Titanium Surface Performance Dioxide Discontinued Corporate Lithium Treatment Additives Pigments Operations and other Year ended December 31, 2009 Income (loss) from continuing operations before taxes 70.7 $ 8.3 $ (29.4) $ (8.3) $ - $ (97.5) $ (56.2) $ Interest expense, net 27.2 34.0 28.5 24.6 - 63.7 178.0 Depreciation and amortization 35.2 35.3 50.4 77.7 - 11.3 209.9 Restructuring and other severance costs 0.5 5.2 4.2 0.1 - 1.4 11.4 Systems/organization establishment expenses - 0.7 1.9 3.1 - 0.1 5.8 Acquisition and disposal costs - 0.1 2.7 0.1 - 0.1 3.0 Loss on early extinguishment/modification of debt 5.8 5.2 2.2 - - 13.4 26.6 Asset write-downs and other (0.1) 0.4 0.2 - - 1.8 2.3 Foreign exchange loss (gain) on financing activities, net 1.7 (5.9) 0.1 - - (11.3) (15.4) Other 0.2 2.4 2.0 - - (0.1) 4.5 Adjusted EBITDA from continuing operations 141.2 85.7 62.8 97.3 - (17.1) 369.9 Discontinued operations (a) - - - - 140.0 - 140.0 Total Adjusted EBITDA 141.2 $ 85.7 $ 62.8 $ 97.3 $ 140.0 $ (17.1) $ 509.9 $ ($ in millions) Consolidated |
|
|
Inc. from Cont. Ops. To Adjusted EBITDA – 2008 Discontinued operations include the Advanced Ceramics and Clay Additives businesses. Excludes the discontinued operations the plastic compounding business of $30.3 million. Titanium Surface Performance Dioxide Discontinued Corporate Lithium Treatment Additives Pigments Operations and other Year ended December 31, 2008 Income (loss) from continuing operations before taxes 117.9 $ 43.2 $ (423.3) $ (266.3) $ - $ (193.5) $ (722.0) $ Interest expense, net 27.6 20.8 27.7 37.7 - 111.3 225.1 Depreciation and amortization 36.3 29.8 52.3 56.3 - 13.0 187.7 Goodwill impairment charges - - 395.0 247.7 - 13.2 655.9 Restructuring and other severance costs 1.3 15.9 9.4 0.2 - 2.4 29.2 Systems/organization establishment expenses - 2.7 4.7 3.4 - 1.0 11.8 Acquisition and disposal costs - - 0.9 - - 0.8 1.7 Acquisition method inventory charges - 0.8 1.5 3.3 - - 5.6 Gain on early extinguishment of debt - - - - - (4.0) (4.0) Asset write-downs and other 0.2 (1.5) 0.5 1.1 - (2.3) (2.0) Acquired in-process research and development - - 2.6 - - - 2.6 Foreign exchange (gain) loss on financing activities, net (2.4) 5.3 0.3 (0.3) - 28.0 30.9 Other - (0.5) 1.5 - - 0.9 1.9 Adjusted EBITDA from continuing operations 180.9 116.5 73.1 83.1 - (29.2) 424.4 Discontinued operations (a) - - - - 184.2 - 184.2 Total Adjusted EBITDA 180.9 $ 116.5 $ 73.1 $ 83.1 $ 184.2 $ (29.2) $ 608.6 $ ($ in millions) Consolidated |
|
|
Inc. from Cont. Ops. To Adjusted EBITDA Lithium and Surface Treatment 2005-2007 Surface Surface Surface Lithium Treatment Lithium Treatment Lithium Treatment Income (loss) from continuing operations before taxes 89.0 $ 67.1 $ 53.2 $ 49.5 $ 41.4 $ 42.8 $ Interest expense, net 25.7 10.5 26.4 13.1 22.9 7.1 Depreciation and amortization 32.1 19.6 27.6 17.7 26.0 16.5 Restructuring and other severance costs 0.3 2.3 0.8 1.1 0.8 - Systems/organization establishment expenses - (0.4) - 0.1 - 3.4 Acquisition and disposal costs - 0.1 - 1.0 - (0.1) Asset write-downs and other (0.3) 0.1 0.2 0.1 - (1.7) Foreign exchange (gain) loss on financing activities, net (0.6) - (0.1) 0.5 0.3 1.6 Other - (1.1) 1.3 (0.8) - (0.4) Adjusted EBITDA from continuing operations 146.2 $ 98.2 $ 109.4 $ 82.3 $ 91.4 $ 69.2 $ ($ in millions) 2007 2006 2005 |
|
|
Inc. from Cont. Ops. To Adjusted EBITDA – Q1 2013 and Q1 2012 (a) Discontinued operations include the Advanced Ceramics and Clay Additives businesses. Titanium Surface Performance Dioxide Discontinued Corporate Lithium Treatment Additives Pigments Operations and other Three months ended March 31, 2013 Income (loss) from continuing operations before taxes 30.4 $ 27.2 $ 6.7 $ (33.3) $ - $ (48.4) $ (17.4) $ Interest expense, net 0.7 3.0 1.1 5.9 - 18.4 29.1 Depreciation and amortization 11.1 7.9 11.6 18.2 - 2.3 51.1 Restructuring and other severance costs 3.9 2.2 0.5 0.3 - - 6.9 Systems/organization establishment expenses (income) 0.1 0.6 - (0.1) - - 0.6 Acquisition and disposal costs 0.1 - 0.1 - - 2.3 2.5 Loss on early extinguishment/modification of debt - - - 17.6 - - 17.6 Foreign exchange loss (gain) on financing activities, net 0.6 (1.9) 0.1 - - 16.4 15.2 Other - 0.5 0.1 - - (0.1) 0.5 Adjusted EBITDA from continuing operations 46.9 39.5 20.2 8.6 - (9.1) 106.1 Discontinued operations (a) - - - - 62.1 - 62.1 Total Adjusted EBITDA 46.9 $ 39.5 $ 20.2 $ 8.6 $ 62.1 $ (9.1) $ 168.2 $ Three months ended March 31, 2012 Income (loss) from continuing operations before taxes 16.0 $ 22.7 $ 4.1 $ 53.6 $ - $ (25.0) $ 71.4 $ Interest expense, net 1.0 5.2 1.8 1.9 - 10.5 20.4 Depreciation and amortization 10.7 7.9 12.4 17.3 - 2.0 50.3 Restructuring and other severance costs 11.3 0.8 1.7 - - 0.1 13.9 Systems/organization establishment expenses - - 0.1 1.5 - - 1.6 Loss on early extinguishment/modification of debt 2.2 3.0 0.7 - - 3.8 9.7 Foreign exchange loss (gain) on financing activities, net 3.2 - - - - (1.6) 1.6 Other - 0.1 - 1.3 - 0.3 1.7 Adjusted EBITDA from continuing operations 44.4 39.7 20.8 75.6 - (9.9) 170.6 Discontinued operations (a) - - - - 64.3 - 64.3 Total Adjusted EBITDA 44.4 $ 39.7 $ 20.8 $ 75.6 $ 64.3 $ (9.9) $ 234.9 $ Consolidated |
|
|
Inc. from Cont. Ops. To Adjusted EBITDA – Q2 2013 and Q2 2012 (a) Discontinued operations include the Advanced Ceramics and Clay Additives businesses. Titanium Surface Performance Dioxide Discontinued Corporate Lithium Treatment Additives Pigments Operations and other Three months ended June 30, 2013 Income (loss) from continuing operations before taxes 29.2 $ 30.2 $ 9.2 $ (28.4) $ - $ (33.1) $ 7.1 $ Interest expense, net 0.7 2.9 1.0 0.4 - 18.4 23.4 Depreciation and amortization 11.8 7.6 11.7 18.1 - 2.4 51.6 Restructuring and other severance costs 0.5 1.2 0.9 0.1 - - 2.7 Systems/organization establishment expenses 0.4 0.1 - 0.2 - - 0.7 Acquisition and disposal costs - 0.8 0.1 0.1 - 12.4 13.4 Asset write-downs and other 4.7 - - - - - 4.7 Foreign exchange loss (gain) on financing activities, net 1.7 0.6 0.3 - - (6.9) (4.3) Other - - 0.4 - - 0.7 1.1 Adjusted EBITDA from continuing operations 49.0 43.4 23.6 (9.5) - (6.1) 100.4 Discontinued operations (a) - - - - 65.3 - 65.3 Total Adjusted EBITDA 49.0 $ 43.4 $ 23.6 $ (9.5) $ 65.3 $ (6.1) $ 165.7 $ Three months ended June 30, 2012 Income (loss) from continuing operations before taxes 36.4 $ 23.7 $ 6.6 $ 29.6 $ - $ (19.9) $ 76.4 $ Interest expense, net 0.9 3.6 1.5 3.6 - 5.4 15.0 Depreciation and amortization 10.8 7.9 12.0 17.0 - 2.1 49.8 Restructuring and other severance costs 0.8 1.2 1.4 - - - 3.4 Systems/organization establishment expenses 0.3 - - - - - 0.3 Acquisition and disposal costs - 0.1 - 1.7 - 0.2 2.0 Loss on early extinguishment/modification of debt - - - 2.7 - - 2.7 Asset write-downs and other - 0.1 0.1 - - - 0.2 Foreign exchange (gain) loss on financing activities, net (1.2) 2.1 (0.1) - - 5.6 6.4 Other 0.1 0.3 0.1 0.2 - (0.2) 0.5 Adjusted EBITDA from continuing operations 48.1 39.0 21.6 54.8 - (6.8) 156.7 Discontinued operations (a) - - - - 64.4 - 64.4 Total Adjusted EBITDA 48.1 $ 39.0 $ 21.6 $ 54.8 $ 64.4 $ (6.8) $ 221.1 $ ($ in millions) Consolidated |
|
|
Net Cash from Operations To Adjusted EBITDA Includes proforma adjustments primarily for the Kemira venture along with several bolt-on acquisitions completed in 2008. All figures above include the Advanced Ceramics and Clay Additives business. Excludes the discontinued operations of the plastic compounding business sold in 2011 of $33.5 million, $30.6 million and $30.3 million for the years ended December 31, 2010, 2009 and 2008, respectively. ($ in millions) 2013 2012 2013 2012 2012 2011 2010 2009 2008 Net cash provided by operating activities from continuing operations 85.4 $ 100.9 $ 134.2 $ 146.6 $ 444.9 $ 450.8 $ 478.0 $ 363.6 $ 279.6 $ Changes in assets and liabilities, net of the effect of foreign currency translation and acquisitions 14.7 72.4 81.9 199.8 116.8 191.4 (48.5) (90.6) 72.7 Current portion of income tax provision 10.1 27.5 20.6 53.0 81.3 98.1 36.3 29.8 38.5 Interest expense, net, excluding amortization of deferred financing costs and unrealized losses/gains on derivatives 22.0 13.5 49.3 32.3 76.4 91.8 158.6 174.1 164.0 Restructuring and other severance costs 2.8 3.7 9.9 17.9 45.5 14.5 5.0 20.3 34.1 Systems/organization establishment expenses 0.7 0.4 1.3 2.0 4.5 6.5 2.1 6.3 12.5 Acquisition and disposal costs 24.3 2.0 30.4 2.0 1.2 0.4 1.3 3.0 1.7 Acquisition mehtod inventory charges - - - - 3.3 - - - 6.9 Bad debt provision (0.3) (0.1) (0.3) (0.1) (0.7) 0.2 1.2 (1.2) (3.3) Other 6.0 0.8 6.6 2.5 5.7 9.1 0.4 4.6 1.9 Proforma adjustments (a) - - - - - - - - 43.2 Total Adjusted EBITDA (b) 165.7 $ 221.1 $ 333.9 $ 456.0 $ 778.9 $ 862.8 $ 634.4 $ 509.9 $ 651.8 $ Year ended December 31, Three months ended June 30, Six months ended June 30, |
|
|
Free Cash Flow Reconciliation Net of government grants received and proceeds on sale of assets. These amounts represent the cash impact of adjustments made to Adjusted EBITDA permitted under the Company's senior secured credit agreement. Free cash flow does not reflect the sale of discontinued operations. 2013 2012 2013 2012 2012 2011 2010 2009 2008 Net cash provided by operating activities 85.4 $ 100.9 $ 48.8 $ 47.6 $ 444.9 $ 450.8 $ 482.4 $ 369.6 $ 296.6 $ Capital expenditures, net (a) (85.0) (69.4) (67.6) (72.9) (284.2) (278.6) (181.4) (152.7) (219.5) Restructuring charges 6.4 4.2 5.7 3.8 16.7 10.5 9.4 41.3 7.2 Swap termination payments - - 3.7 - - 14.3 3.2 31.1 - Systems/organization establishment expenses - - - - 3.2 1.9 2.1 6.2 12.9 Excess tax benefits from stock-based payment arrangements 1.0 0.7 1.4 0.7 3.7 4.0 - - - Other (b) 12.0 2.6 2.5 2.1 4.3 4.3 4.6 6.1 (2.2) Free cash flow (c) 19.8 $ 39.0 $ (5.5) $ (18.7) $ 188.6 $ 207.2 $ 320.3 $ 301.6 $ 95.0 $ ($ in millions) Year ended December 31, Three months ended March 31, Three months ended June 30, |
|
|
[LOGO] |