Attached files
| file | filename |
|---|---|
| 8-K - FORM 8-K - PUBLIC SERVICE ENTERPRISE GROUP INC | d595674d8k.htm |
 Forward Looking Statement
3
EXHIBIT 99
Certain of the matters discussed in this report constitute
“forward-looking statements” within the meaning of the
Private Securities Litigation Reform Act of 1995. Such
forward-looking statements are subject to risks and uncertainties, which
could cause actual results to differ materially from those anticipated.
Such statements are based on management’s beliefs as well as
assumptions made by and information currently available to management.
When used herein, the words “anticipate,” “intend,”
“estimate,” “believe,” “expect,”
“plan,” “should,” “hypothetical,” “potential,” “forecast,
“project,” variations of such words and similar expressions are
intended to identify forward-looking statements. Factors that may
cause actual results to differ are often presented with the
forward-looking statements themselves. Other factors that could
cause actual results to differ materially from those contemplated in any
forward- looking statements made by us herein are discussed in Item
1. Financial Statements— Note 9. Commitments and Contingent
Liabilities, Item 2. Management’s Discussion and Analysis of
Financial Condition and Results of Operations, and other factors
discussed in filings we make with the United States Securities and Exchange
Commission (SEC). These factors include, but are not limited to:
• adverse changes in the demand for or the price of the capacity and
energy that we sell into wholesale electricity
markets, • adverse changes in energy industry law, policies and regulation,
including market structures and a potential
shift away from competitive markets toward subsidized
market mechanisms, transmission planning and cost allocation rules, including
rules regarding how transmission is planned and who is
permitted to build transmission in the future, and
reliability standards, • any inability of our transmission and distribution businesses to obtain
adequate and timely rate relief and regulatory
approvals from federal and state regulators, • changes in federal and state environmental regulations that could
increase our costs or limit our operations,
• changes in nuclear regulation and/or general developments in the nuclear
power industry, including various impacts from any
accidents or incidents experienced at our facilities
or by others in the industry, that could limit operations of our nuclear
generating units,
• actions or activities at one of our nuclear units located on a
multi-unit site that might adversely affect our
ability to continue to operate that unit or other units
located at the same site,
• any inability to balance our energy obligations, available supply and
risks,
• any deterioration in our credit quality or the credit quality of our
counterparties, including in our leveraged
leases, • availability of capital and credit at commercially reasonable terms and
conditions and our ability to meet cash needs,
• changes in the cost of, or interruption in the supply of, fuel and
other commodities necessary to the operation of our
generating units, • delays in receipt of necessary permits and approvals for our
construction and development activities,
• delays or unforeseen cost escalations in our construction and
development activities,
• any inability to achieve, or continue to sustain, our expected levels
of operating performance,
• any equipment failures, accidents, severe weather events or other
incidents that impact our ability to provide safe
and reliable service to our customers, and any
inability to sufficiently obtain coverage or recover proceeds of insurance on
such matters,
• increases in competition in energy supply markets as well as
competition for certain rate-based
transmission projects, • any inability to realize anticipated tax benefits or retain tax
credits, • challenges associated with recruitment and/or retention of a qualified
workforce, • adverse performance of our decommissioning and defined benefit plan
trust fund investments and changes in funding
requirements, and • changes in technology and customer usage
patterns.
All of the forward-looking statements made in this report are qualified by
these cautionary statements and we cannot assure you that the results
or developments anticipated by management will be realized or even if
realized, will have the expected consequences to, or effects on, us or
our business prospects, financial condition or results of operations.
Readers are cautioned not to place undue reliance on these
forward-looking statements in making any investment decision.
Forward-looking statements made in this report apply only as of the
date of this report. While we may elect to update forward-looking
statements from time to time, we specifically disclaim any obligation
to do so, even if internal estimates change, unless otherwise required
by applicable securities laws. The forward-looking statements
contained in this report are intended to qualify for the safe harbor
provisions of Section 27A of the Securities Act of 1933, as amended,
and Section 21E of the Securities Exchange Act of 1934, as
amended.
|
 GAAP Disclaimer
PSEG presents Operating Earnings in addition to its Income from Continuing
Operations/Net Income reported in accordance with accounting principles
generally accepted in the United States (GAAP). Operating Earnings
is a non- GAAP financial measure that differs from Net Income because
it excludes gains or losses associated with Nuclear Decommissioning
Trust (NDT), Mark-to-Market (MTM) accounting, and other material
one-time items. PSEG presents Operating Earnings because
management believes that it is appropriate for investors to consider
results excluding these items in addition to the results reported in
accordance with GAAP. PSEG believes that the non-GAAP financial
measure of Operating Earnings provides a consistent and comparable
measure of performance of its businesses to help shareholders understand
performance trends. This information is not
intended to be viewed as an alternative to GAAP
information. Slides A and B at the end of this presentation include a list of
items excluded from Income from Continuing Operations/Net Income to
reconcile to Operating Earnings, with a reference to that slide included
on each of the slides where the non-GAAP information appears.
4 |
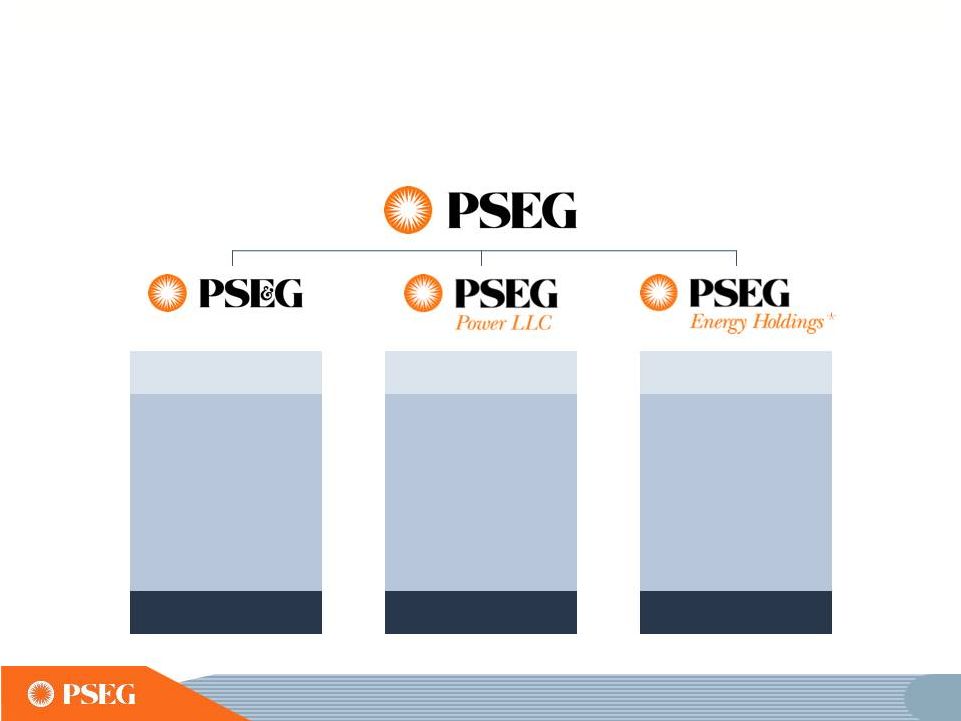 PSEG meeting the market’s challenges
with our strong platform of assets
PSEG Energy
Holdings positioned
to pursue attractive
renewable
generation and
develop new
business
opportunities
Assets $1.5B
Operating Earnings $64M
Renewable
Investments
PSE&G positioned
to meet NJ’s
energy policy and
economic growth
objectives with an
investment program
exceeding $10 billion
through 2017
Assets $19.2B
Operating Earnings $528M
Electric & Gas Delivery
and Transmission
PSEG Power’s
low-cost, base
load and load
following fleet is
geographically well
positioned and
environmentally
responsible
Assets $11.0B
Operating Earnings $644M
Regional
Wholesale Energy
*
7
ASSETS
AND
OPERATING
EARNINGS
ARE
FOR
THE
YEAR
ENDED
12/31/2012.
ENERGY
HOLDINGS
INCLUDES
PARENT.
SEE
SLIDE A
FOR
ITEMS
EXCLUDED
FROM
INCOME
FROM
CONTINUING
OPERATIONS/NET
INCOME
TO RECONCILE
TO
OPERATING
EARNINGS.
. |
 61 local NJ towns and 5 counties
support
•
61 municipalities and five counties (Bergen, Hudson, Mercer,
Passaic and Somerset) have approved resolutions in support of
Energy Strong, PSE&G’s infrastructure proposal to improve and
fortify its electric and gas distribution systems
•
The Energy Strong proposal is currently being evaluated by the
NJ Board of Public Utilities
•
Public hearings are scheduled for September and October 2013
13 |
 Where we’re going …
PSE&G operating earnings
are forecast to grow at double digit rate through
2015
•
O&M Growth per year
•
PSE&G Rate Base
Transmission
E&G Distribution
EMP
•
EFORd Rate -
CCGT
•
Nuclear Generation
•
Holdings Solar Investment
•
LIPA Earnings
PSEG Focus
($ millions, except as noted)
•
•
$12,600
•
$5,000
4
•
$6,900
5
•
$700
5
•
1.4%
•
30.4TWh
•
$290
•
$12-$15
2015E
•
0.8%
•
$9,000
•
$2,500
•
$5,900
•
$600
•
1.7%
•
29.8TWh
•
$240
•
$0
2012
•
2.4%
•
$6,800
•
$866
•
$5,900
•
$0
•
1.6%
•
29.3TWh
•
$0
•
$0
2008
(1)
Planned compound annual growth rate 2008-2012.
(2)
Actual compound annual growth rate 2008-2012.
(3) Two-year compound annual growth rate from 2013.
(4) Includes additional Transmission hardening.
(5) Includes proposed filings: EE4A, SL3, S4Ae, and ES programs.
E = ESTIMATE.
.
2.2%
(planned
)
(actual )
(forecast )
1
2
3
15 |
 PSEG First Half 2013 -
Highlights
Maintaining 2013 operating earnings guidance of $2.25 -
$2.50 per share
Strong earnings: First half 2013 earnings of $1.33 per share vs. $1.28
in year-ago period Power benefitting from higher capacity prices
and asset location PSE&G seeing results from increased investment
in transmission O&M under control {Continuing control of O&M
supporting results} Capital investment on schedule
PSE&G received approval to invest $446 million in extensions of Solar 4
All and Solar Loan programs PSE&G’s existing $3.4 billion
Transmission investment program remains on schedule Hearings scheduled
for Energy Strong, PSE&G’s $2.6 billion, 5-year capital infrastructure program
Financial position remains strong
S&P
credit
rating
upgrade
across
Enterprise,
Power
and
PSE&G
Debt represented 41% of capital at June 30, 2013
Dividend
increased
1.4%
to
$1.44
per
share,
the
9
increase
in
the
last
ten
years
Full year 2013 operating earnings expected to be at the upper end of
guidance, assuming normal weather and unit operations
17
th |
 2013 Operating Earnings
*
*SEE SLIDE A FOR ITEMS EXCLUDED FROM INCOME FROM CONTINUING OPERATIONS/NET
INCOME TO RECONCILE TO OPERATING EARNINGS; ALL PERIODS REFLECT TEXAS IN
DISCONTINUED OPERATIONS. E=ESTIMATE.
Investment in the
regulated business
has changed the
earnings mix
Our 2009-2013
investment focus has
brought us to a 50/50
mix for 2013
PSE&G’s 2013-2017
Energy Strong Program
and ongoing transmission
investments will support
continued growth in
PSE&G’s earnings
Percent of Operating Earnings Contribution by Subsidiary
PSE&G
Power
Other
$2.74
$2.44
$2.25 -$2.50E
$3.09
$3.12
18
20%
27%
38%
43%
50%
76%
69%
61%
52%
47%
2009
2010
2011
2012
2013E |
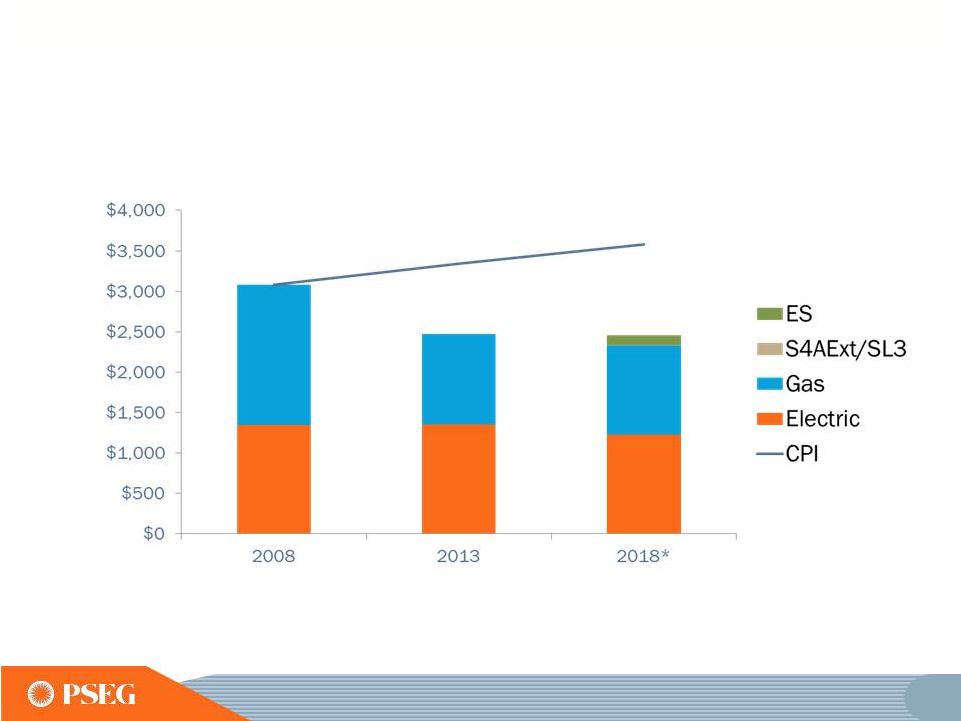 Lower commodity costs and expiration of
certain transition charges are expected to offset the impact to
customer bills
*FOR THE TYPICAL COMBINED ELECTRIC & GAS RESIDENTIAL CUSTOMER, 2018 BGS
(INCLUDING TRANSMISSION) / BGSS, AS WELL AS SBC, WNC, RAC AND DISTRIBUTION RATES HELD CONSTANT AS OF THE ES FILING DATE (FEB-2013). RATES RELATED TO
ELECTRIC RESTRUCTURING: SECURITIZATION (STC), NON-UTILITY GENERATION
CHARGE (NGC), & TRANSITIONAL ENERGY FACILITIES ASSESSMENT (TEFA), ARE REDUCED TO ZERO BY 2018. THE RGGI RECOVERY CHARGE (RRC), SOLAR PILOT RECOVERY
CHARGE (SPRC), AND CAPITAL ECONOMIC STIMULUS INFRASTRUCTURE INVESTMENT PROGRAM
(CIP I) AND THE CIP EXTENSION (CIP II) BILL IMPACTS ARE INCLUDED IN THEIR RESPECTIVE GAS & ELECTRIC BARS AND FORECASTED BASED UPON MAR-2013
ESTIMATES. THE BILL IMPACTS FOR ES PROGRAM BASED UPON THE PROPOSED FILING
AND S4AEXT/SL3 IMPACTS ARE BASED UPON THE BPU APPROVED PROGRAM.
.
Typical Residential Annual Bill
44 |
 PSE&G’s 2013 operating earnings
benefiting from transmission growth and cost containment
initiatives
E= ESTIMATE
*SEE SLIDE A FOR ITEMS EXCLUDED FROM INCOME FROM CONTINUING OPERATIONS/NET
INCOME TO RECONCILE TO OPERATING EARNINGS.
$528
2012
2013 Guidance
PSE&G Operating Earnings*
($ Millions)
$580
-
$635E
45 |
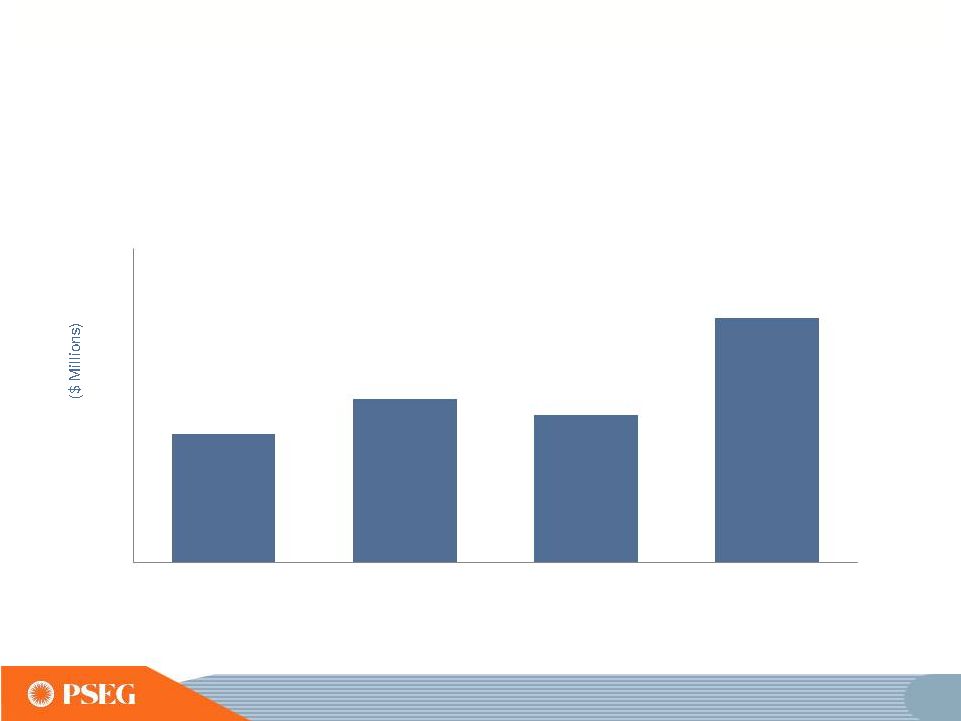 PSEG Energy Holdings
These projects should produce steady results for PSEG
PSEG Solar Source EBITDA
E
E = ESTIMATE.
…
A STABLE, LOW-RISK PORTFOLIO
53
0
3
6
9
12
15
2010
2011
2012
2013 |
 •
Lower cost supplies of shale
gas have been beneficial to
both PSE&G customers and
PSEG Power
•
Over 50% of our available
pipeline capacity can access
market area supplies of shale
gas
•
Power’s generating units sit in
close proximity to the Marcellus
fairway
•
Power buys approximately
350BCF/year of gas
•
Availability of a robust gas
portfolio of storage and pipeline
capacity benefits PSE&G
customers and Power’s
generating assets
Albany
PSEG’s locational advantage
and gas basis
New York
Shale Supply
0.6 BCF/D
Storage
0.9 BCF/D
Gulf Coast Supply
0.7 BCF/D
80 |
 Reserve margins in PJM declining with retirements
Generation Deactivation Notifications
Source: PJM TEAC, 8/8/2013
•
PJM Pending Deactivation Requests of
13,340 MW as of August 13, 2013
•
Approximately 5,000 MW of additional
owner announced retirements in PJM
through next auction
Forecast Reserve Margin (PJM June 2013)
•
PJM forecasts a declining Reserve Margin
through 2017
82
0%
5%
10%
15%
20%
25%
30%
6/1/2013
6/1/2014
6/1/2015
6/1/2016
6/1/2017
Reserve Requirement
Existing + Expected New Generation |
 Maintaining 2013 operating earnings guidance
PSEG Operating Earnings
$ Millions (except EPS)
2013E
PSEG Power
$535 -
$600
PSE&G
$580 -
$635
PSEG Energy Holdings/Parent
$25 -
$35
Operating Earnings*
$1,140 -
$1,270
2013 Earnings Guidance
$2.25
-
$2.50
E = ESTIMATE
*SEE SLIDE A FOR ITEMS EXCLUDED FROM INCOME FROM CONTINUING OPERATIONS/NET
INCOME TO RECONCILE TO OPERATING EARNINGS.
Based on our performance year-to-date, we expect full year
operating earnings to be at the upper end of guidance,
assuming normal weather and unit operations
87 |
 Our capital investment options can result in as
much as $5.4B of utility growth investment through 2015
PSE&G
Growth
~$4.2B
PSE&G
Maintenance
Power
& Other
Potential Opportunities
Approved Programs
2013 –
2015E Capital Investment
~$6.3B
~$6.5B
~$7.5B
New
Transmission
~$0.2B
New
Distribution
~$1B
PSE&G
Growth
$5.4B
DATA AS OF JUNE 30, 2013.
E = ESTIMATE
90 |
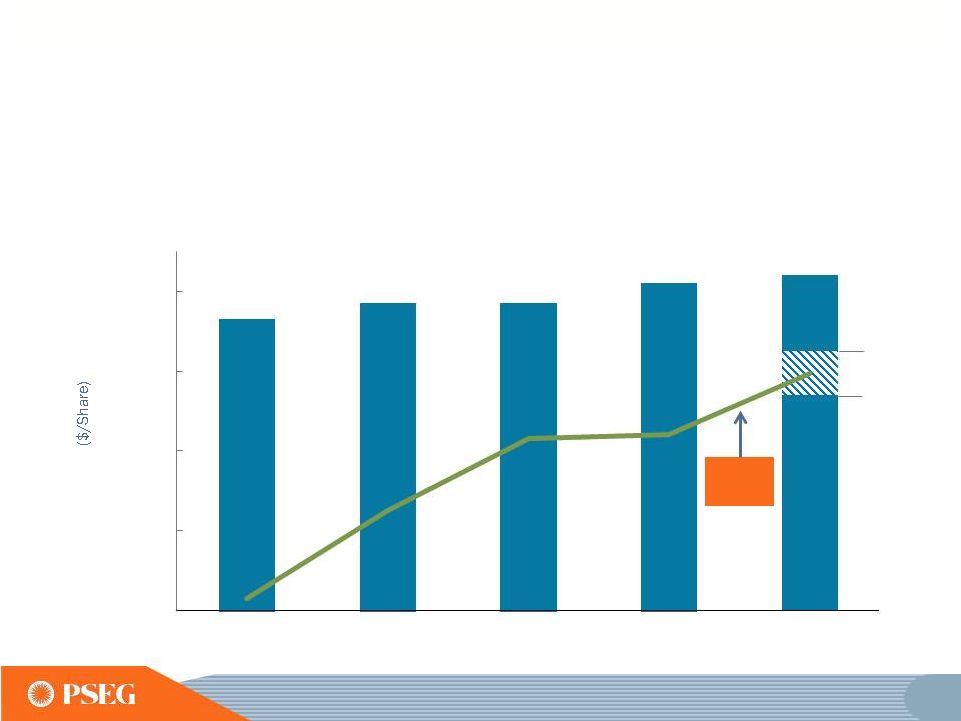 Opportunity for modest and sustainable
dividend increases consistent with stable regulated growth
and cash generation outlook at PSEG Power
PSE&G
EPS
$1.25
$1.14
$1.42
Annual Dividend Per Share
E = ESTIMATE
99
$1.33
$1.37
$1.37
$1.44
$0.60
$0.80
$1.00
$1.20
$1.40
2009
2010
2011
2012
2013E |
 PSEG Summary
•
Maintaining
2013
operating
earnings
guidance
of
$2.25
-
$2.50
per share --
based on financial results to date, we expect operating
earnings for the full year to be at the upper end of our guidance range
assuming normal weather and unit operations
•
Double digit operating earnings growth at PSE&G starting in 2013,
and continuing through 2015 driven by transmission investments
and approved programs
•
Power’s continued focus on operational excellence, market expertise
and financial strength reduces risk in low price environment
•
Strong Balance Sheet and Cash Flow support full capital program
without the need for equity
•
Long history of returning cash to the shareholder through the
common dividend, with opportunity for future growth
100 |
 The full requirements BGS rate recognizes the
forward PJM capacity market price
114
Capacity Price per RPM Auction for PSEG Zone
Capacity Price per BGS Tranche
2013-2014
250
$
Three Year Average ($/MW-day)
$195
2014-2015
170
$
MW
per Tranche (varies by EDC) 108
2015-2016
166
$
Days per Year
365
195
$
7,712,637
$
MWh per Tranche
Energy MW per Tranche (varies by EDC)
108
Hours per Year
8,760
Load Factor (varies by EDC)
~37%
MWh per Tranche, approx.
350,000
Capacity Cost per MWh
22
$
Three Year Average ($/MW-day)
Capacity Cost per Tranche |
 Items Excluded from Income from Continuing
Operations/Net Income to Reconcile to Operating Earnings
2012
2011
2010
2009
2008
Earnings Impact ($ Millions)
Gain (Loss) on Nuclear Decommissioning Trust (NDT)
Fund Related Activity (PSEG Power)
52
$
50
$
46
$
9
$
(71)
$
Gain (Loss) on Mark-to-Market (MTM) (PSEG Power)
(10)
107
(1)
(11)
14
Lease Transaction Activity (Energy Holdings)
36
(173)
-
29
(490)
Storm O&M (PSEG Power)
(39)
-
-
-
-
Market Transition Charge Refund (PSE&G)
-
-
(72)
-
-
Gain (Loss) on Asset Sales and Impairments (Energy Holdings)
-
34
-
-
(13)
Total Pro-forma adjustments
39
$
18
$
(27)
$
27
$
(560)
$
Fully Diluted Average Shares Outstanding (in Millions)
507
507
507
507
508
Per Share Impact (Diluted)
Gain (Loss) on NDT Fund Related Activity (PSEG Power)
0.10
$
0.10
$
0.09
$
0.02
$
(0.14)
$
Gain (Loss) on MTM (PSEG Power)
(0.02)
0.21
-
(0.02)
0.03
Lease Transaction Activity (Energy Holdings)
0.07
(0.34)
-
0.05
(0.96)
Storm O&M (PSEG Power)
(0.08)
-
-
-
-
Market Transition Charge Refund (PSE&G)
-
-
(0.14)
-
-
Gain (Loss) on Asset Sales and Impairments (Energy Holdings)
-
0.06
-
-
(0.03)
Total Pro-forma adjustments
0.07
$
0.03
$
(0.05)
$
0.05
$
(1.10)
$
For the Year Ended
December 31,
(Unaudited)
Pro-forma Adjustments, net of tax
A
PLEASE SEE PAGE 4 FOR AN EXPLANATION OF PSEG’S USE OF OPERATING
EARNINGS AS A NON-GAAP FINANCIAL MEASURE AND HOW IT DIFFERS FROM
INCOME FROM CONTINUING OPERATIONS/NET INCOME. |
 Items Excluded from Income from Continuing
Operations/Net Income to Reconcile to Operating Earnings
B
PLEASE SEE PAGE 4 FOR AN EXPLANATION OF PSEG’S USE OF OPERATING
EARNINGS AS A NON-GAAP FINANCIAL MEASURE AND HOW IT DIFFERS FROM
INCOME FROM CONTINUING OPERATIONS/NET INCOME. 2013
2012
2013
2012
Earnings
Impact
($
Millions)
Gain (Loss) on Nuclear Decommissioning Trust (NDT)
Fund Related Activity (PSEG Power)
8
$
4
$
17
$
9
$
Gain (Loss) on Mark-to-Market (MTM)
(a)
(PSEG Power)
80
(10)
(25)
42
Lease Related Activity (PSEG Energy Holdings)
-
2
-
6
Storm O&M, (PSEG Power)
2
-
(15)
-
Total Pro-forma adjustments
90
$
(4)
$
(23)
$
57
$
Fully Diluted Average Shares Outstanding (in Millions)
507
507
507
507
Per
Share
Impact
(Diluted)
Gain (Loss) on NDT Fund Related Activity (PSEG Power)
0.02
$
0.01
$
0.04
$
0.02
$
Gain (Loss) on MTM
(a)
(PSEG Power)
0.16
(0.02)
(0.05)
0.08
Lease Related Activity (PSEG Energy Holdings)
-
-
-
0.01
Storm O&M, (PSEG Power)
-
-
(0.03)
-
Total Pro-forma adjustments
0.18
$
(0.01)
$
(0.04)
$
0.11
$
(a) Includes the financial impact from positions with forward delivery months.
Three Months Ended
Six Months Ended
PUBLIC SERVICE ENTERPRISE GROUP INCORPORATED
Reconciling Items Excluded from Income from Continuing Operations/Net Income to Compute Operating
Earnings (Unaudited)
June 30,
June 30,
Pro-forma Adjustments, net of tax |