Attached files
| file | filename |
|---|---|
| 8-K - FORM 8-K - National American University Holdings, Inc. | d596926d8k.htm |
Exhibit 99.1

| NASDAQ: NAUH Investor Presentation September 2013 You deserve an education. We provide the opportunity. |

| 2 Safe Harbor This presentation may contain forward-looking statements within the meaning of the Private Securities Litigation Reform Act of 1995, about National American University Holdings, Inc. and its affiliated entities (the "Company"). Forward-looking statements are statements that are not historical facts. Such forward-looking statements, based upon the current beliefs and expectations of the Company's management, are subject to risks and uncertainties, which could cause actual results of the Company to differ from any future results expressed or implied by such forward-looking statements. The following factors, among others, could cause actual results to differ from those set forth in the forward-looking statements: future operating or financial results; uncertainties regarding the strength of the future growth of the education industry; uncertainties regarding the availability of student loans and other financing sources primarily used for tuition; continued compliance with government regulations; changing legislative or regulatory environments; management of growth; intensity of competition; the availability of cash to pay dividends, the ability to meet debt obligations or obtain additional financing to fund operations and/or acquisitions; general market conditions; changing interpretations of generally accepted accounting principles; and general economic conditions, as well as other relevant risks detailed in the Company's filings with the Securities and Exchange Commission, including its report on Form 10-K for the period ended May 31, 2013. The information set forth herein should be read in light of such risks. The Company does not undertake any obligation to update anyone with regard to the forward-looking statements. |

| 3 NAUH OVERVIEW |

| 4.8% dividend yield* 4 Key Takeaways Continued Enrollment Growth (slides 10-13) Focus on Vertical Growth (slides 16-18) Shareholder Friendly (slide 36) Strong Financial Growth (slide 30) *At 8/30/2013 |

| 5 National American University Holdings, Inc., through its wholly owned subsidiary, operates National American University (NAU), a regionally accredited, proprietary, multi- campus institution of higher learning offering associate, bachelor's, master's, and doctoral degree programs in technical and professional disciplines Offers degree programs in on-ground and online formats, and combination of both, providing students increased flexibility to take courses at times and places convenient to their busy lifestyles Has 37 physical locations (two pending approvals) in the U.S., primarily in the Midwest, as of 7/31/2013 NAUH At-A-Glance NAUH At-A-Glance Industry Education Headquarters Rapid City, South Dakota Employees 1,500+ (as of 8/15/2013) Fiscal Year End May 31 Company Overview |

| 6 Financial Highlights/Valuation Metrics Select Financial Info for the TTM ended 5/31/2013: Select Financial Info for the TTM ended 5/31/2013: Total Revenue $129.2 million Net Income Attributable to NAUH $5.4 million Diluted EPS $0.21 Cash/Short-term Investments $31.9 million (at 5/31/2013) Total Property and Equipment $44.9 million (at 5/31/2013) Stock Info/Valuation Metrics (as of 7/31/2013 unless otherwise noted) Stock Info/Valuation Metrics (as of 7/31/2013 unless otherwise noted) Stock Info/Valuation Metrics (as of 7/31/2013 unless otherwise noted) Stock Info/Valuation Metrics (as of 7/31/2013 unless otherwise noted) Stock Price $3.43 (at 8/30/2013) Market Cap $85.9 million (at 8/30/2013) Shares Outstanding 25.0 million Book Value Per Share $2.03 PE (ttm) 16.3x EV (ttm) $54.0 million Dividend (mrq) $0.045 Dividend Yield 4.8% |

| 7 NAU is a postsecondary educational institution catering to the nontraditional student, typically in his/her early 30s, seeking to complete a degree either for the first time or in a new field, while also juggling pressures of family obligations and work commitments Regionally accredited by the Higher Learning Commission; various programmatic accreditations Associate, bachelor's, master's, and doctoral degree programs and select industry-focused diplomas Flexible course and program delivery: on-ground, online, or a combination of both 37 physical locations (two pending approvals) in the U.S., primarily in the Midwest, as of 7/31/2013 Growth primarily driven by: Continued investment in the expansion and development of physical locations and academic programs Improved enrollment management system and recruitment processes Quality academic programming Economic conditions History of Organic Growth, Education that Caters to the Working Adult Operating Highlights |
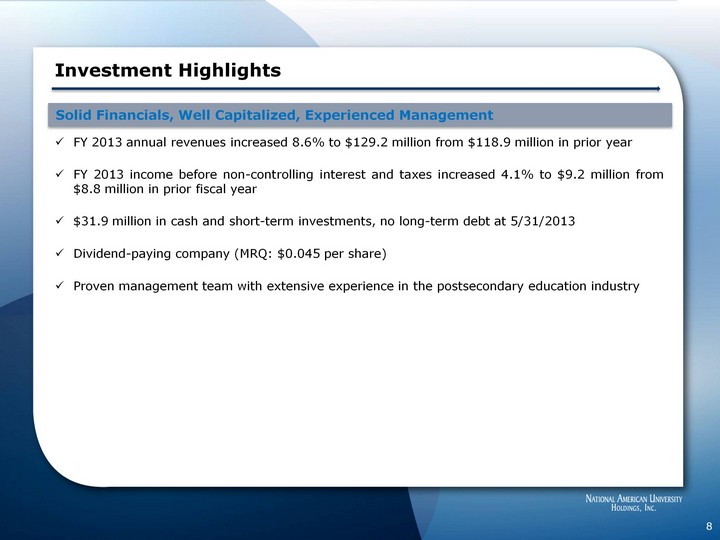
| 8 FY 2013 annual revenues increased 8.6% to $129.2 million from $118.9 million in prior year FY 2013 income before non-controlling interest and taxes increased 4.1% to $9.2 million from $8.8 million in prior fiscal year $31.9 million in cash and short-term investments, no long-term debt at 5/31/2013 Dividend-paying company (MRQ: $0.045 per share) Proven management team with extensive experience in the postsecondary education industry Solid Financials, Well Capitalized, Experienced Management Investment Highlights |

| 9 Experienced Management Team Dr. Ronald Shape Chief Executive Officer Dr. Jerry L. Gallentine President Dr. Sam Kerr Chief Operating Officer Ms. Venessa Green Chief Financial Officer Dr. Robert Paxton President-Online Learning Ms. Michaelle Holland President of Campus Operations Mr. Scott Toothman VP of Institutional Support Dr. Rick Upchurch Executive Vice President Institutional Effectiveness Mr. John Buxton Chief Information Officer |

| Credit Hours 10 Enrollment by Credit Hour FY 2008 169,670 FY 2009 203,114 19.7% YoY growth FY 2010 276,125 35.9% YoY growth FY 2011 337,558 22.2% YoY growth FY 2012 372,097 10.2% YoY Growth FY 2013 390,930 5.1% YoY Growth (CHART) |

| 11 Enrollment Breakout Spring 2013 enrollment increased 2.2% YoY to 11,472 students |

| 12 (CHART) APOL STRA EDMC National American University Over the past several quarters, NAU has reported healthy YoY enrollment growth rates, particularly when compared to those of its peers. CPLA Enrollment Comparison Source of enrollment figures: quarterly earnings releases from CPLA, EDMC, STRA, APOL, and NAUH Note: EDMC stopped providing total enrollment figures starting with the Fall '12 quarter. Figures in the chart from that period onward are average enrollment figures for each period. |

| 13 Factors Affecting Enrollment Growth Continued investment in the development of physical locations Dedicated focus on utilizing existing capacity Continued investment in the expansion of current academic programs and development of new academic programs Improved enrollment management system and recruiting processes Number of admissions advisors employed toward future enrollment growth Quality academic programming Economic conditions Timing of regulatory approvals for new locations and new programs |

| 14 EXPANSION |
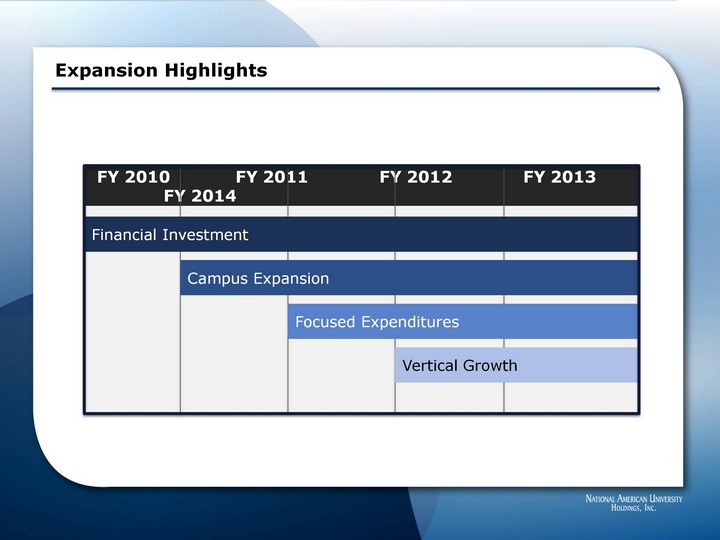
| Expansion Highlights FY 2010 FY 2011 FY 2012 FY 2013 FY 2014 Financial Investment Campus Expansion Focused Expenditures Vertical Growth |

| (CHART) Geographic Growth 37 Current Locations (includes pending in orange) Colorado - 4 Indiana - 1 Kansas - 3 Minnesota - 6 Missouri - 4 Nebraska - 1 Locations Pending Approvals Austin Graduate Center, TX Houston, TX NAU Locations 16 Note: Number of locations for fiscal years 2009, 2010, 2011, 2012, and 2013 include locations pending final approvals. 17 22 32 35 New Mexico - 2 Oklahoma - 1 Oregon - 1 South Dakota - 5 Texas - 9 37 37 |

| Current locations Pending approvals 17 Geographic Footprint NAU offers online programs in every U.S. state except Massachusetts and Rhode Island. Geographic Footprint 17 |

| 18 Online Growth Strategy Online Growth Strategy Support Centers Vertical Growth International Exposure Program Mix Strategic Alliances Strategically placed to maximize online enrollments in new markets Dedicated focus on utilizing existing capacity Strategic relationships and degree programs for international students High-demand programs designed for the future Increase enrollments and offer unique student opportunities Growth in Online and On-ground Credit Hours (CHART) Credit Hours |

| 19 ACADEMICS |

| 20 Academic Highlights/Focus Continued academic program expansion, including business, IT, and allied health at the undergraduate level Received approval from the Higher learning Commission (HLC) to offer the Education Doctorate (Ed.D.) in Community College Leadership Received approval from the HLC to begin offering five new doctoral-level courses for a doctoral certificate in community college leadership Began offering first course in spring 2013 quarter and intend to offer others in coming academic quarters Continue to develop the Roueche Graduate Center in Austin, Texas, which houses NAU's Harold D. Buckingham Graduate School, placing greater emphasis on master's and post-bachelor programs Continued growth in allied health and associate degree programs Continued focus on course completion, persistence and placement of graduates |

| 21 Academic Breakdown for Spring '13 Term Degree Offering Academic Area (CHART) (CHART) |

| 22 Roueche Graduate Center Located in Austin, Texas Led by Dr. John E. Roueche, a nationally recognized authority in community college education Houses NAU's Harold D. Buckingham Graduate School Represents NAU's commitment to quality graduate programming In August 2013, became HLC-approved to offer Education Doctorate (Ed.D.) in Community College Leadership HLC-approved to offer five new doctoral-level courses for a certificate in community college leadership, began offering first course in spring 2013 quarter Dr. John E. Roueche President Community College Advisory Board Former Professor & Director, Community College Leadership Program and Sid W. Richardson Regents Chair, The University of Texas at Austin Goal: to better serve the graduate student community and continue pursuing additional graduate opportunities |

| 23 NAU Community College Advisory Board Dr. George R. Boggs President and CEO Emeritus American Association of Community Colleges Dr. Donald W. Cameron President Emeritus Guilford Technical Community College Dr. Gerardo E. de los Santos President and Chief Executive Officer League for Innovation in the Community College Dr. Terry O'Banion (Chair) President Emeritus and Senior League Fellow League for Innovation in the Community College Dr. Margaretta B. Mathis (Secretary and Treasurer) Vice President, NAU Roueche Graduate Center Dr. Robert Paxton (Ex-officio member) President - Online Learning, NAU Dr. Samuel D. Kerr (Ex-officio member) Chief Operating Officer, NAUH This board serves as an advisory group on matters related to NAU's academic programs, services, and related initiatives in connection with community colleges. Dr. John E. Roueche (Ex-officio member) President, NAU Roueche Graduate Center Dr. Jerry Sue Thornton President, Cuyahoga Community College Dr. George A. Baker III Distinguished University Professor Emeritus North Carolina State University Dr. Christine Johnson McPhail Managing Partner, The McPhail Group and Emerita Professor, Morgan State University Contact: 8140 N. Mopac, Bldg. 4, Ste. 140, Austin, TX 78759 |

| 24 Accreditation & Regulatory Compliance Regional accreditation by the Higher Learning Commission and member of the North Central Association of Colleges and Schools Programmatic accreditation and approvals by various national educational and professional associations Continual evaluation of regulatory compliance by NAU senior management, including federal, state, and accrediting agency requirements Recent recertification by U.S. Department of Education to participate in Title IV program for next six years |

| 25 Accreditation & Academic Quality Third-party Accreditation and Approvals Regional Accreditation by The Higher Learning Commission Colorado Board of Nursing Kansas State Board of Nursing Minnesota Board of Nursing Missouri State Board of Nursing New Mexico Board of Nursing South Dakota Board of Nursing Accreditation Commission for Education in Nursing (ACEN) (Formerly NLNAC) Commission on Collegiate Nursing Education (CCNE) International Assembly for Collegiate Business Education (IACBE) Commission on Accreditation of Allied Health Education Programs (CAAHEP) American Bar Association (ABA) - Rapid City and Sioux Falls campuses American Society of Health-System Pharmacists (ASHP) Committee on Veterinary Technician Education and Activities (CVTEA) State and Federally Sponsored Veterans Training |

| *Represents students who received a grade in the course. 26 Academic Excellence Course Completion* High Student Term-to-Term Persistence (CHART) (CHART) |
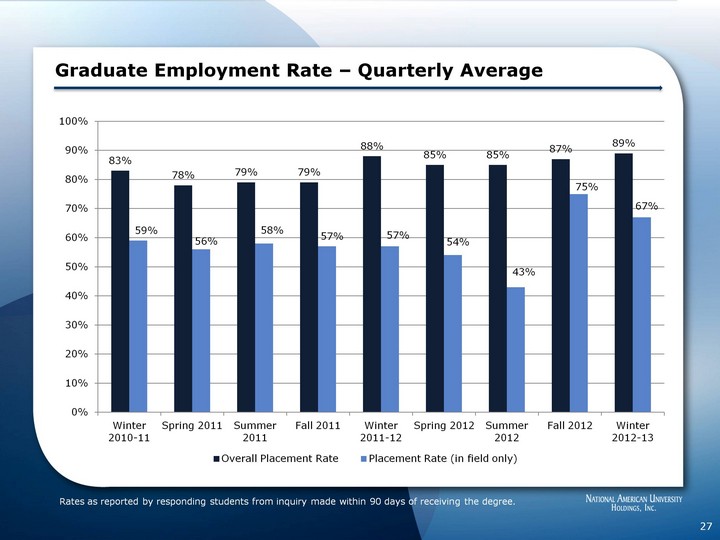
| Rates as reported by responding students from inquiry made within 90 days of receiving the degree. 27 Graduate Employment Rate - Quarterly Average (CHART) |

| 28 Cohort Default Rate (CDR) (CHART) NAU Cohort Default Rate vs. Proprietary Institutions * * *Draft rates |

| 29 FINANCIALS |

| History of Financial Growth (CHART) $ in USD thousands 30 |

| 31 Q4 Revenues and Cost of Educational Services (CHART) Q4 Results Q4 Results Q4 Results (in USD thousands) Q4 2013 (unaudited) Q4 2012 (unaudited) Revenue $33,162 $33,110 Cost of educational services $7,493 $7,609 SG&A $21,441 $20,274 (in millions) Q4 Revenue |

| (CHART) 32 Q4 Net Income and EBITDA (in millions) *Please see reconciliation of EBITDA to net income attributable to the Company in the press release dated July 31, 2013, available at www.national.edu/investorrelations. Q4 EBITDA Q4 Results Q4 Results Q4 Results (in USD thousands) Q4 2013 (unaudited) Q4 2012 (unaudited) Income before non-controlling interest and taxes $2,055 $2,573 Net income attributable to NAUH $1,146 $1,564 EBITDA* $3,770 $3,987 |

| (CHART) (in millions) 33 FY 2013 Revenues and Cost of Educational Services Fiscal Year Revenue Fiscal Year Results Fiscal Year Results Fiscal Year Results (in USD thousands) FY 2013 (audited) FY 2012 (audited) Revenue $129,176 $118,894 Cost of educational services $29,188 $27,831 SG&A $82,906 $77,476 |

| (CHART) 34 FY 2013 Net Income and EBITDA (in millions) *Please see reconciliation of EBITDA to net income attributable to the Company in the press release dated July 31, 2013, available at www.national.edu/investorrelations. Fiscal Year EBITDA Fiscal Year Results Fiscal Year Results Fiscal Year Results (in USD thousands) FY 2013 (audited) FY 2012 (audited) Income before non-controlling interest and taxes $9,184 $8,820 Net income attributable to NAUH $5,446 $5,049 EBITDA* $15,767 $13,520 |

| Strong Balance Sheet 35 (in USD thousands) May 31, 2013 May 31, 2012 Cash and cash equivalents / available for sale investments $ 31,878 $ 30,575 Working capital $ 23,843 $ 24,585 Long-term debt $ 0 $ 0 Stockholders' equity $ 50,788 $ 50,712 |

| Shareholder Friendly Dividend-paying company Dividend yield of 4.8% (CHART) 36 |
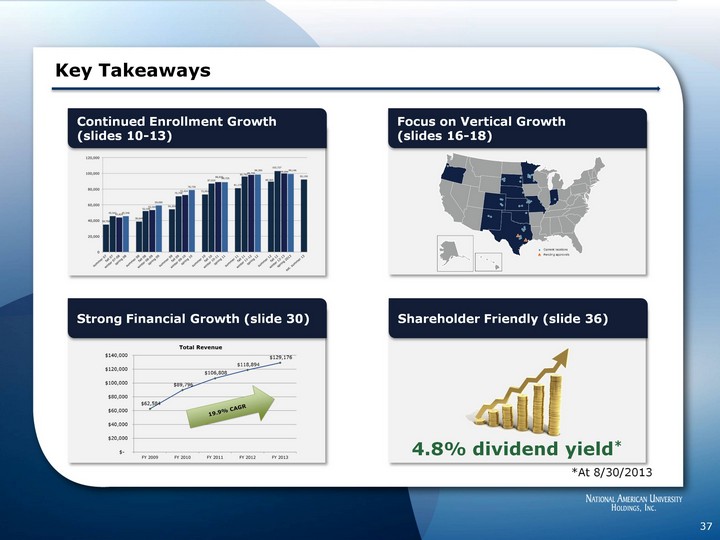
| 4.8% dividend yield* 37 Key Takeaways Continued Enrollment Growth (slides 10-13) Focus on Vertical Growth (slides 16-18) Shareholder Friendly (slide 36) Strong Financial Growth (slide 30) *At 8/30/2013 |

| Contact Information: National American University Holdings, Inc. Dr. Ronald Shape 605-721-5220 rshape@national.edu Investor Relations Counsel The Equity Group Inc. Carolyne Yu 415-568-2255 cyu@equityny.com Adam Prior 212-836-9606 aprior@equityny.com 38 Thank You |