Attached files
| file | filename |
|---|---|
| 8-K - 8-K - EXCO RESOURCES INC | excoform8-k9x11x131.htm |
EXCO Resources, Inc. 9/12/13 – 9/13/13 Barclays CEO Energy Conference
2 2013 Barclays CEO Energy Conference Management Participants Doug Miller Chairman and CEO Mark Mulhern CFO & EVP
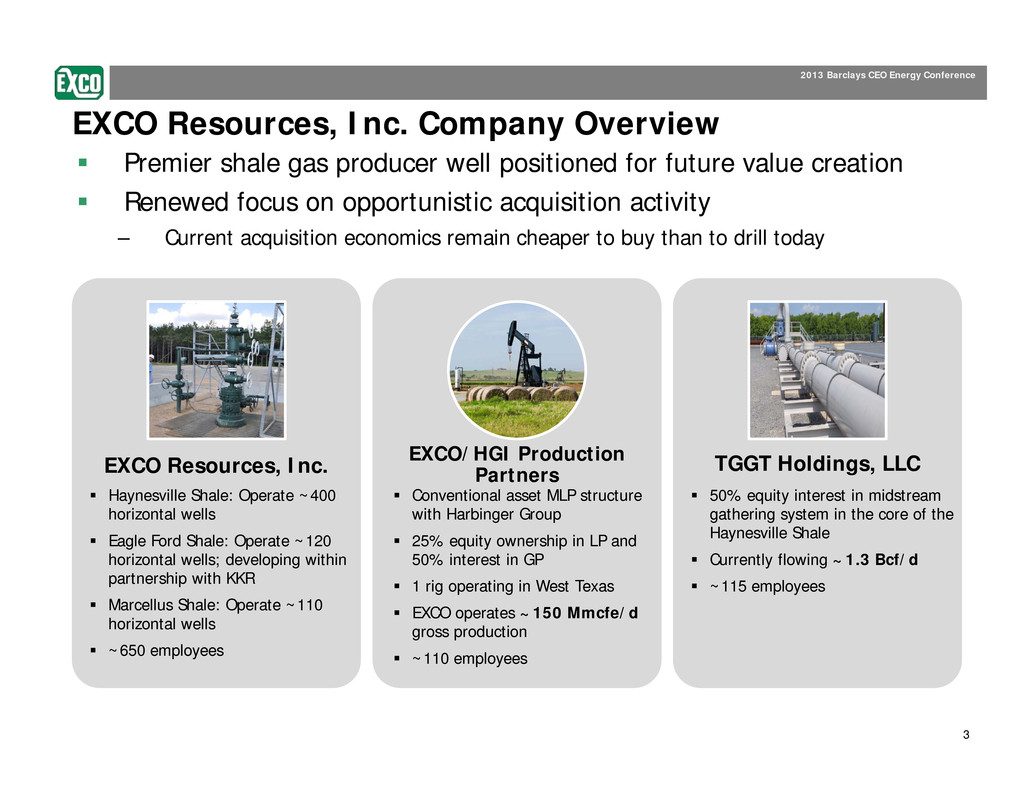
3 2013 Barclays CEO Energy Conference EXCO Resources, Inc. EXCO/HGI Production Partners TGGT Holdings, LLC Haynesville Shale: Operate ~400 horizontal wells Eagle Ford Shale: Operate ~120 horizontal wells; developing within partnership with KKR Marcellus Shale: Operate ~110 horizontal wells ~650 employees Conventional asset MLP structure with Harbinger Group 25% equity ownership in LP and 50% interest in GP 1 rig operating in West Texas EXCO operates ~150 Mmcfe/d gross production ~110 employees 50% equity interest in midstream gathering system in the core of the Haynesville Shale Currently flowing ~1.3 Bcf/d ~115 employees EXCO Resources, Inc. Company Overview Premier shale gas producer well positioned for future value creation Renewed focus on opportunistic acquisition activity – Current acquisition economics remain cheaper to buy than to drill today

4 2013 Barclays CEO Energy Conference Introduction Solid year to date 2013 financial results – Resulting from discipline around capital deployment and cost management Established foundation for additional future growth through Eagle Ford and Haynesville acquisitions Concentration of producing properties acquired will increase cash flow Partnerships with KKR, Harbinger and BG bolster our financial reach Eagle Ford transaction allows EXCO to extend its proven operational expertise

5 2013 Barclays CEO Energy Conference Strategic Focus Grow EBITDA/Cash Flow of the company through successful execution of recent acquisitions and evaluation of additional drilling partnerships to minimize CAPEX and add production/revenue Acquire bankable producing properties after 1st year declines Finance those acquisitions via net cash flows plus secured (borrowing base) financing Translate EBITDA growth into share price appreciation
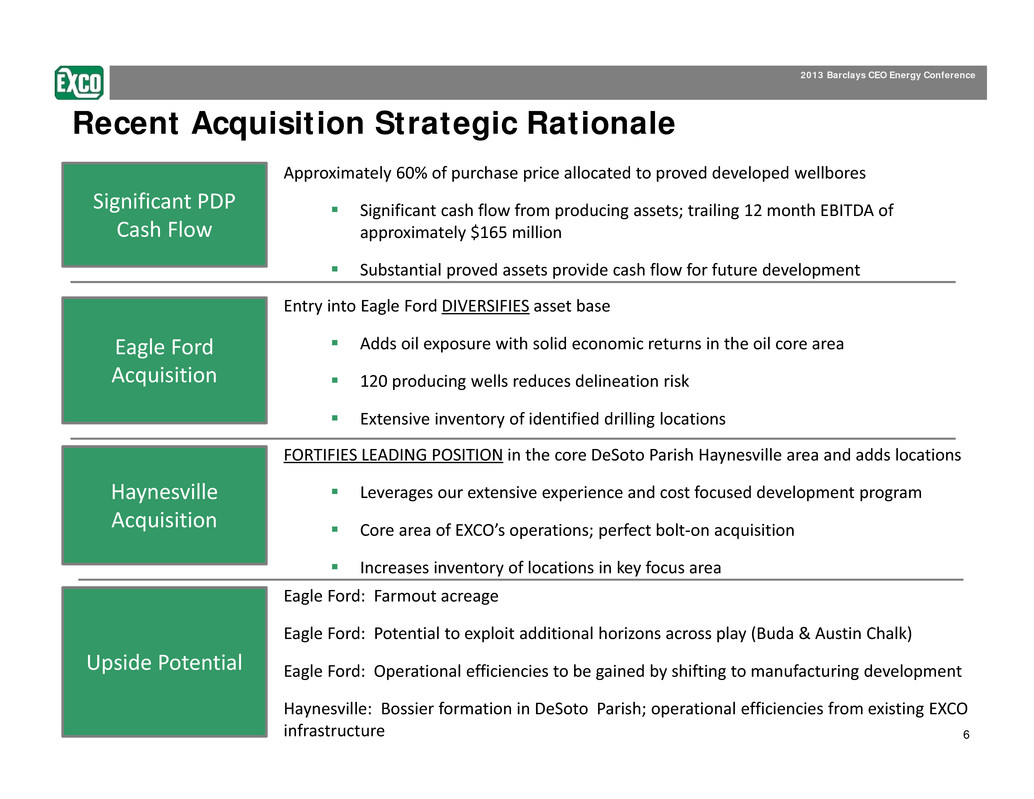
6 2013 Barclays CEO Energy Conference Approximately 60% of purchase price allocated to proved developed wellbores Significant cash flow from producing assets; trailing 12 month EBITDA of approximately $165 million Substantial proved assets provide cash flow for future development Recent Acquisition Strategic Rationale Eagle Ford: Farmout acreage Eagle Ford: Potential to exploit additional horizons across play (Buda & Austin Chalk) Eagle Ford: Operational efficiencies to be gained by shifting to manufacturing development Haynesville: Bossier formation in DeSoto Parish; operational efficiencies from existing EXCO infrastructure Entry into Eagle Ford DIVERSIFIES asset base Adds oil exposure with solid economic returns in the oil core area 120 producing wells reduces delineation risk Extensive inventory of identified drilling locations Significant PDP Cash Flow Eagle Ford Acquisition Upside Potential Haynesville Acquisition FORTIFIES LEADING POSITION in the core DeSoto Parish Haynesville area and adds locations Leverages our extensive experience and cost focused development program Core area of EXCO’s operations; perfect bolt‐on acquisition Increases inventory of locations in key focus area
7 2013 Barclays CEO Energy Conference Financial Topics Eagle Ford KKR Development Structure 2013 EBITDA and CAPEX Update Liquidity Review
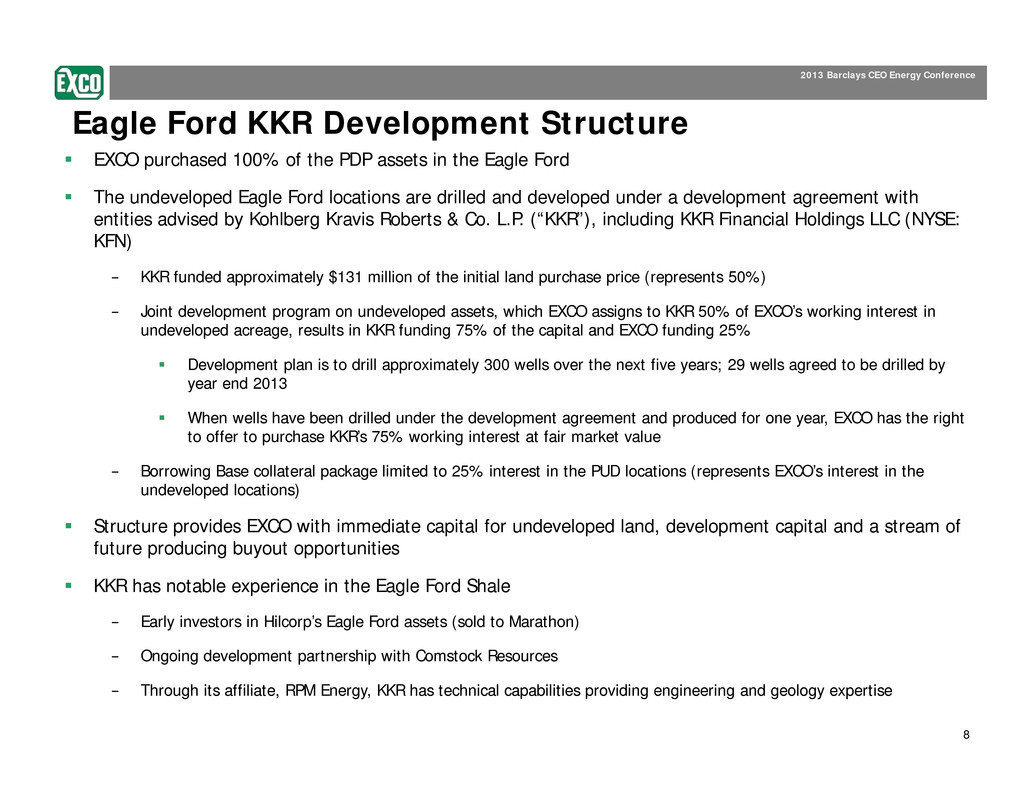
8 2013 Barclays CEO Energy Conference Eagle Ford KKR Development Structure EXCO purchased 100% of the PDP assets in the Eagle Ford The undeveloped Eagle Ford locations are drilled and developed under a development agreement with entities advised by Kohlberg Kravis Roberts & Co. L.P. (“KKR”), including KKR Financial Holdings LLC (NYSE: KFN) − KKR funded approximately $131 million of the initial land purchase price (represents 50%) − Joint development program on undeveloped assets, which EXCO assigns to KKR 50% of EXCO’s working interest in undeveloped acreage, results in KKR funding 75% of the capital and EXCO funding 25% Development plan is to drill approximately 300 wells over the next five years; 29 wells agreed to be drilled by year end 2013 When wells have been drilled under the development agreement and produced for one year, EXCO has the right to offer to purchase KKR’s 75% working interest at fair market value − Borrowing Base collateral package limited to 25% interest in the PUD locations (represents EXCO’s interest in the undeveloped locations) Structure provides EXCO with immediate capital for undeveloped land, development capital and a stream of future producing buyout opportunities KKR has notable experience in the Eagle Ford Shale − Early investors in Hilcorp’s Eagle Ford assets (sold to Marathon) − Ongoing development partnership with Comstock Resources − Through its affiliate, RPM Energy, KKR has technical capabilities providing engineering and geology expertise
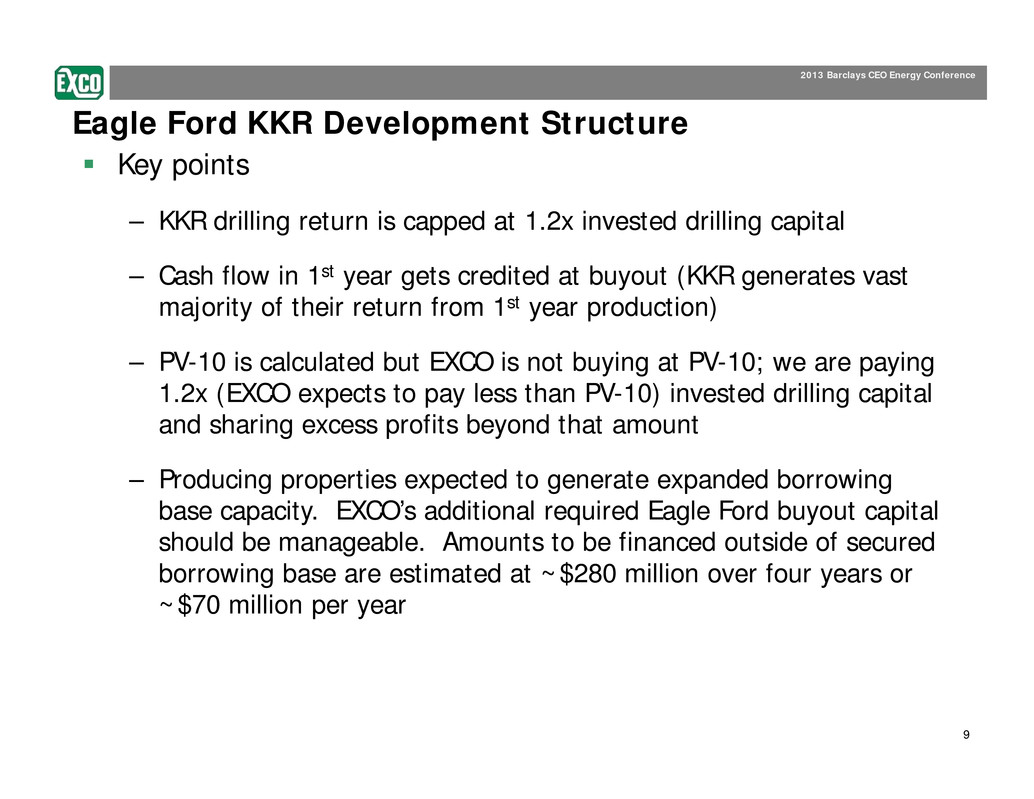
9 2013 Barclays CEO Energy Conference Eagle Ford KKR Development Structure Key points – KKR drilling return is capped at 1.2x invested drilling capital – Cash flow in 1st year gets credited at buyout (KKR generates vast majority of their return from 1st year production) – PV-10 is calculated but EXCO is not buying at PV-10; we are paying 1.2x (EXCO expects to pay less than PV-10) invested drilling capital and sharing excess profits beyond that amount – Producing properties expected to generate expanded borrowing base capacity. EXCO’s additional required Eagle Ford buyout capital should be manageable. Amounts to be financed outside of secured borrowing base are estimated at ~$280 million over four years or ~$70 million per year
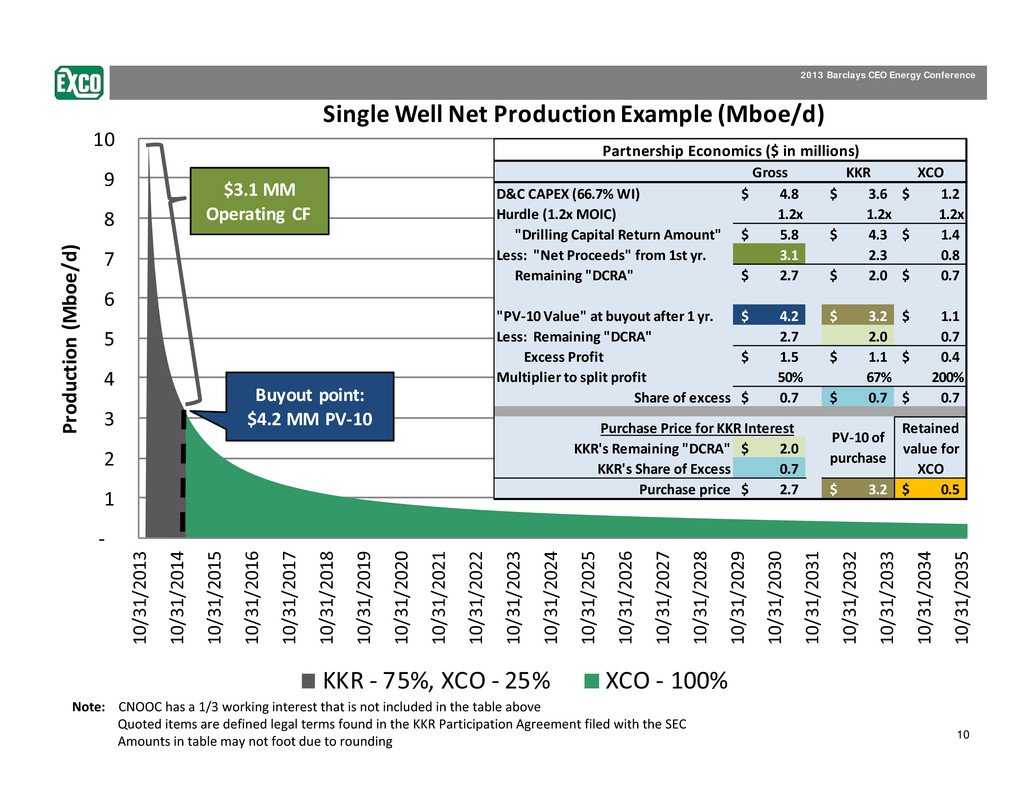
10 2013 Barclays CEO Energy Conference ‐ 1 2 3 4 5 6 7 8 9 10 1 0 / 3 1 / 2 0 1 3 1 0 / 3 1 / 2 0 1 4 1 0 / 3 1 / 2 0 1 5 1 0 / 3 1 / 2 0 1 6 1 0 / 3 1 / 2 0 1 7 1 0 / 3 1 / 2 0 1 8 1 0 / 3 1 / 2 0 1 9 1 0 / 3 1 / 2 0 2 0 1 0 / 3 1 / 2 0 2 1 1 0 / 3 1 / 2 0 2 2 1 0 / 3 1 / 2 0 2 3 1 0 / 3 1 / 2 0 2 4 1 0 / 3 1 / 2 0 2 5 1 0 / 3 1 / 2 0 2 6 1 0 / 3 1 / 2 0 2 7 1 0 / 3 1 / 2 0 2 8 1 0 / 3 1 / 2 0 2 9 1 0 / 3 1 / 2 0 3 0 1 0 / 3 1 / 2 0 3 1 1 0 / 3 1 / 2 0 3 2 1 0 / 3 1 / 2 0 3 3 1 0 / 3 1 / 2 0 3 4 1 0 / 3 1 / 2 0 3 5 P r o d u c t i o n ( M b o e / d ) Single Well Net Production Example (Mboe/d) KKR ‐ 75%, XCO ‐ 25% XCO ‐ 100% Buyout point: $4.2 MM PV‐10 $3.1 MM Operating CF Gross KKR XCO D&C CAPEX (66.7% WI) 4.8$ 3.6$ 1.2$ Hurdle (1.2x MOIC) 1.2x 1.2x 1.2x "Drilling Capital Return Amount" 5.8$ 4.3$ 1.4$ Less: "Net Proceeds" from 1st yr. 3.1 2.3 0.8 Remaining "DCRA" 2.7$ 2.0$ 0.7$ "PV‐10 Value" at buyout after 1 yr. 4.2$ 3.2$ 1.1$ Less: Remaining "DCRA" 2.7 2.0 0.7 Excess Profit 1.5$ 1.1$ 0.4$ Multiplier to split profit 50% 67% 200% Share of excess 0.7$ 0.7$ 0.7$ KKR's Remaining "DCRA" 2.0$ KKR's Share of Excess 0.7 Purchase price 2.7$ 3.2$ 0.5$ Partnership Economics ($ in millions) Purchase Price for KKR Interest PV‐10 of purchase Retained value for XCO Note: CNOOC has a 1/3 working interest that is not included in the table above Quoted items are defined legal terms found in the KKR Participation Agreement filed with the SEC Amounts in table may not foot due to rounding
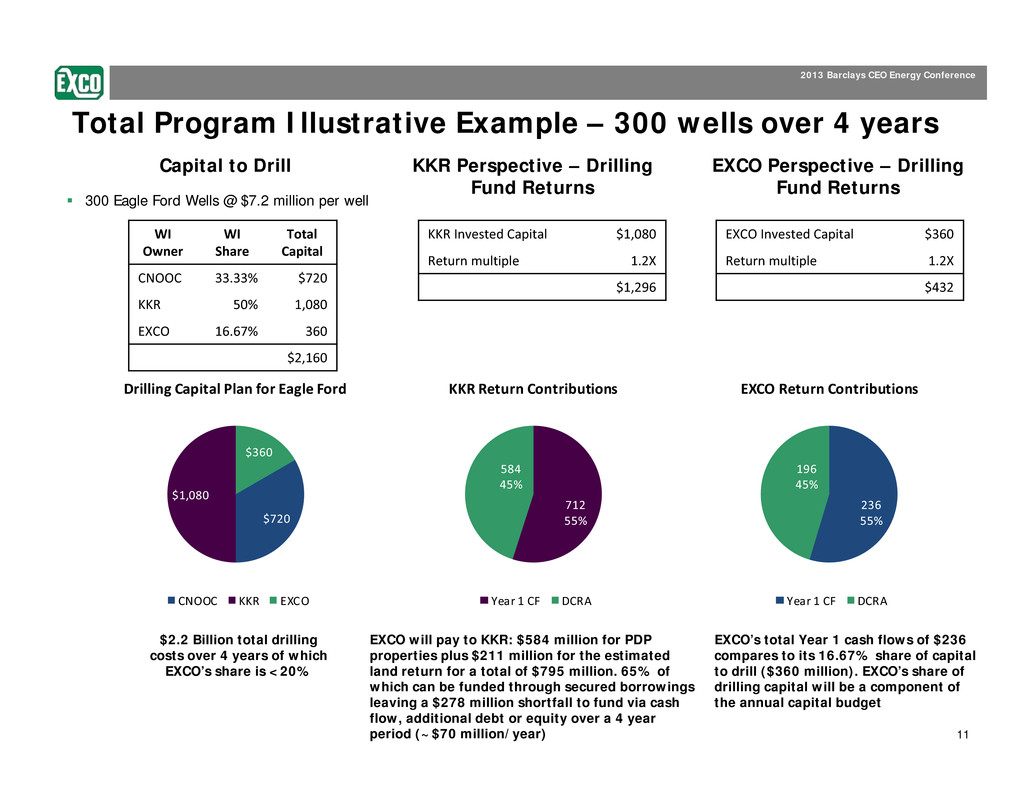
11 2013 Barclays CEO Energy Conference Total Program Illustrative Example – 300 wells over 4 years Capital to Drill 300 Eagle Ford Wells @ $7.2 million per well $720 $1,080 $360 Drilling Capital Plan for Eagle Ford CNOOC KKR EXCO $2.2 Billion total drilling costs over 4 years of which EXCO’s share is <20% WI Owner WI Share Total Capital CNOOC 33.33% $720 KKR 50% 1,080 EXCO 16.67% 360 $2,160 KKR Perspective – Drilling Fund Returns KKR Invested Capital $1,080 Return multiple 1.2X $1,296 712 55% 584 45% KKR Return Contributions Year 1 CF DCRA EXCO Invested Capital $360 Return multiple 1.2X $432 236 55% 196 45% EXCO Return Contributions Year 1 CF DCRA EXCO’s total Year 1 cash flows of $236 compares to its 16.67% share of capital to drill ($360 million). EXCO’s share of drilling capital will be a component of the annual capital budget EXCO Perspective – Drilling Fund Returns EXCO will pay to KKR: $584 million for PDP properties plus $211 million for the estimated land return for a total of $795 million. 65% of which can be funded through secured borrowings leaving a $278 million shortfall to fund via cash flow, additional debt or equity over a 4 year period (~$70 million/year)
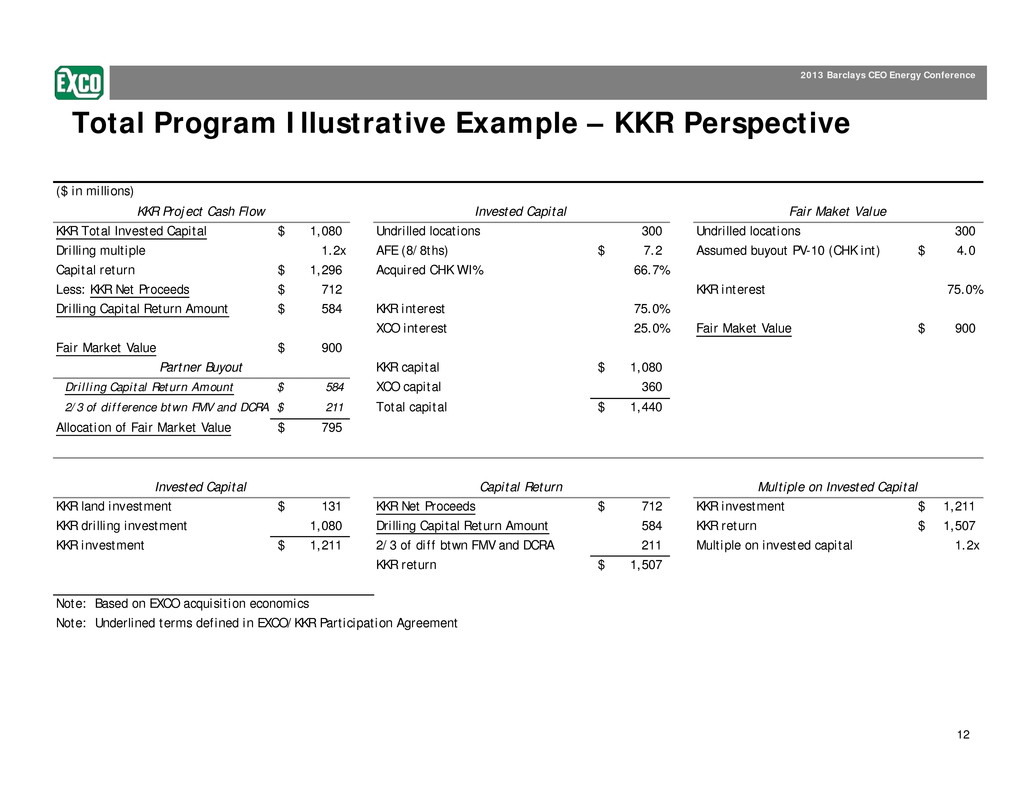
12 2013 Barclays CEO Energy Conference Total Program Illustrative Example – KKR Perspective ($ in millions) KKR Total Invested Capital 1,080$ Undrilled locations 300 Undrilled locations 300 Drilling multiple 1.2x AFE (8/8ths) 7.2$ Assumed buyout PV-10 (CHK int) 4.0$ Capital return 1,296$ Acquired CHK WI% 66.7% Less: KKR Net Proceeds 712$ KKR interest 75.0% Drilling Capital Return Amount 584$ KKR interest 75.0% XCO interest 25.0% Fair Maket Value 900$ Fair Market Value 900$ KKR capital 1,080$ Drilling Capital Return Amount 584$ XCO capital 360 2/3 of difference btwn FMV and DCRA 211$ Total capital 1,440$ Allocation of Fair Market Value 795$ KKR land investment 131$ KKR Net Proceeds 712$ KKR investment 1,211$ KKR drilling investment 1,080 Drilling Capital Return Amount 584 KKR return 1,507$ KKR investment 1,211$ 2/3 of diff btwn FMV and DCRA 211 Multiple on invested capital 1.2x KKR return 1,507$ Note: Based on EXCO acquisition economics Note: Underlined terms defined in EXCO/KKR Participation Agreement KKR Project Cash Flow Invested Capital Fair Maket Value Invested Capital Capital Return Multiple on Invested Capital Partner Buyout
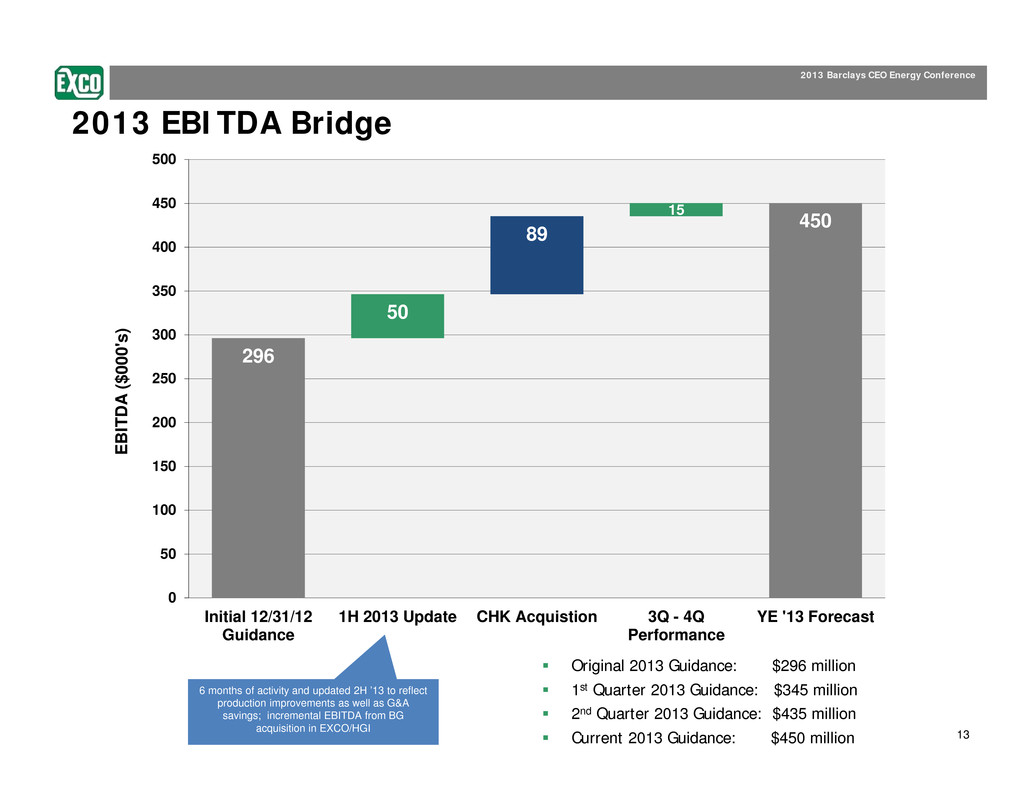
13 2013 Barclays CEO Energy Conference 50 89 15 296 450 0 50 100 150 200 250 300 350 400 450 500 Initial 12/31/12 Guidance 1H 2013 Update CHK Acquistion 3Q - 4Q Performance YE '13 Forecast E B I T D A ( $ 0 0 0 ' s ) 2013 EBITDA Bridge Original 2013 Guidance: $296 million 1st Quarter 2013 Guidance: $345 million 2nd Quarter 2013 Guidance: $435 million Current 2013 Guidance: $450 million 6 months of activity and updated 2H ’13 to reflect production improvements as well as G&A savings; incremental EBITDA from BG acquisition in EXCO/HGI

14 2013 Barclays CEO Energy Conference 2013 CAPEX Bridge 2Q updated CAPEX guidance range of $313 to $353 million
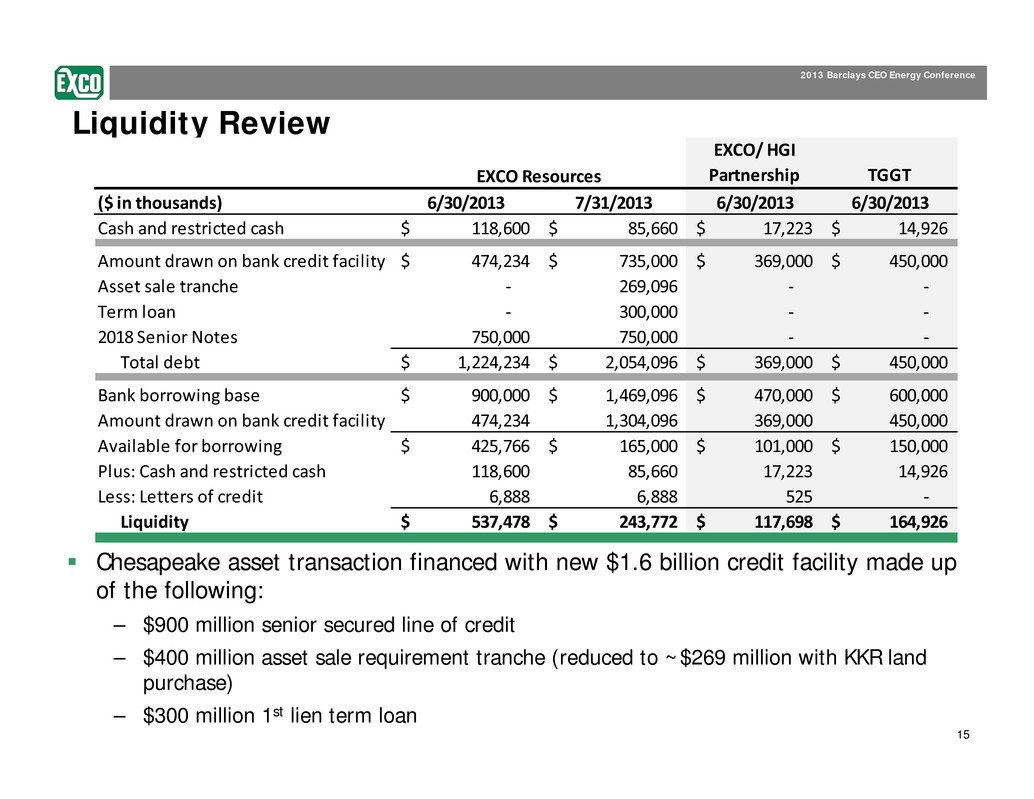
15 2013 Barclays CEO Energy Conference Liquidity Review EXCO/ HGI Partnership TGGT ($ in thousands) 6/30/2013 7/31/2013 6/30/2013 6/30/2013 Cash and restricted cash 118,600$ 85,660$ 17,223$ 14,926$ Amount drawn on bank credit facility 474,234$ 735,000$ 369,000$ 450,000$ Asset sale tranche ‐ 269,096 ‐ ‐ Term loan ‐ 300,000 ‐ ‐ 2018 Senior Notes 750,000 750,000 ‐ ‐ Total debt 1,224,234$ 2,054,096$ 369,000$ 450,000$ Bank borrowing base 900,000$ 1,469,096$ 470,000$ 600,000$ Amount drawn on bank credit facility 474,234 1,304,096 369,000 450,000 Available for borrowing 425,766$ 165,000$ 101,000$ 150,000$ Plus: Cash and restricted cash 118,600 85,660 17,223 14,926 Less: Letters of credit 6,888 6,888 525 ‐ Liquidity 537,478$ 243,772$ 117,698$ 164,926$ EXCO Resources Chesapeake asset transaction financed with new $1.6 billion credit facility made up of the following: – $900 million senior secured line of credit – $400 million asset sale requirement tranche (reduced to ~$269 million with KKR land purchase) – $300 million 1st lien term loan
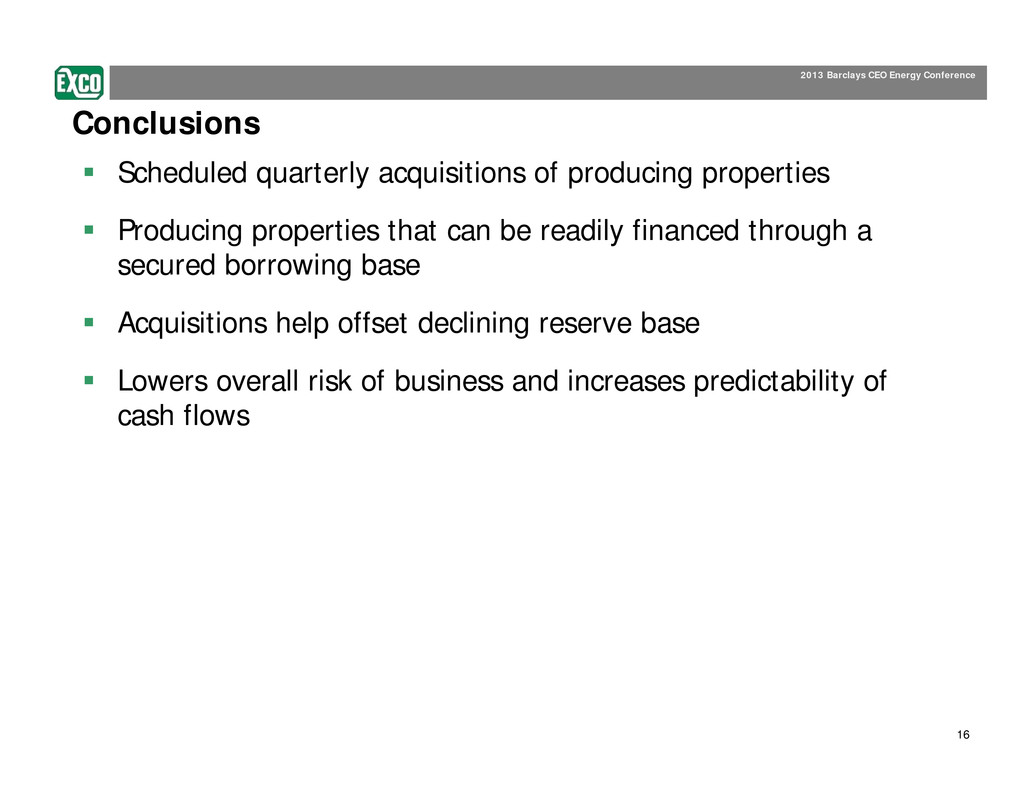
16 2013 Barclays CEO Energy Conference Conclusions Scheduled quarterly acquisitions of producing properties Producing properties that can be readily financed through a secured borrowing base Acquisitions help offset declining reserve base Lowers overall risk of business and increases predictability of cash flows
17 2013 Barclays CEO Energy Conference This presentation contains forward‐looking statements, as defined in Section 27A of the Securities Act and Section 21E of the Securities Exchange Act of 1934, or the Exchange Act. These forward‐looking statements relate to, among other things, the following: • our future financial and operating performance and results; • our business strategy; • market prices for oil, natural gas and natural gas liquids; • our future use of derivative financial instruments; and • our plans and forecasts. We have based these forward‐looking statements on our current assumptions, expectations and projections about future events. We use the words "may," "expect," "anticipate," "estimate," "believe," "continue," "intend," "plan," "budget" and other similar words to identify forward‐looking statements. The statements that contain these words should be read carefully because they discuss future expectations, contain projections of results of operations or our financial condition and/or state other "forward‐looking" information. We do not undertake any obligation to update or revise publicly any forward‐looking statements, except as required by applicable securities law. These statements also involve risks and uncertainties that could cause our actual results or financial condition to materially differ from our expectations in this presentation, including, but not limited to: • fluctuations in the prices of oil, natural gas and natural gas liquids; • the availability of foreign oil, natural gas and natural gas liquids; • future capital requirements and availability of financing; • our ability to meet our current and future debt service obligations; • disruption of credit and capital markets and the ability of financial institutions to honor their commitments; • estimates of reserves and economic assumptions; • geological concentration of our reserves; • risks associated with drilling and operating wells; • exploratory risks, primarily related to our activities in shale formations including our recent acquisition in the Eagle Ford shale; • risks associated with operation of natural gas pipelines and gathering systems; • discovery, acquisition, development and replacement of oil and natural gas reserves; • cash flow and liquidity; • timing and amount of future production of oil and natural gas; • availability of drilling and production equipment; • marketing of oil and natural gas; • political and economic conditions and events in oil‐producing and natural gas‐producing countries; • title to our properties; • litigation; • competition; • general economic conditions, including costs associated with drilling and operation of our properties; • environmental or other governmental regulations, including legislation to reduce emissions of greenhouse gases, legislation of derivative financial instruments, regulation of hydraulic fracture stimulation and elimination of income tax incentives available to our industry; • receipt and collectability of amounts owed to us by purchasers of our production and counterparties to our derivative financial instruments; • decisions whether or not to enter into derivative financial instruments; • potential acts of terrorism; • our ability to manage joint ventures with third parties including the resolution of any material disagreements and our partners’ ability to satisfy obligations under these arrangements; • actions of third party co‐owners of interests in properties in which we also own an interest; • fluctuations in interest rates; and • our ability to effectively integrate companies and properties that we acquire.. Forward Looking Statements
18 2013 Barclays CEO Energy Conference We believe that it is important to communicate our expectations of future performance to our investors. However, events may occur in the future that we are unable to accurately predict, or over which we have no control. We caution users of the financial statements not to place undue reliance on a forward‐looking statement. When considering our forward‐looking statements, keep in mind the risk factors and other cautionary statements in this presentation, and the risk factors included in our Annual Report on Form 10‐K for the year ended December 31, 2012, filed with the Securities and Exchange Commission, or the SEC, on February 21, 2013, and our Quarterly Reports on Form 10‐Q. Our revenues, operating results and financial condition substantially depend on prevailing prices for oil and natural gas and the availability of capital from our credit agreement, or the EXCO Resources Credit Agreement. Declines in oil or natural gas prices may have a material adverse effect on our financial condition, liquidity, results of operations, the amount of oil or natural gas that we can produce economically and the ability to fund our operations. Historically, oil and natural gas prices and markets have been volatile, with prices fluctuating widely, and they are likely to continue to be volatile. The SEC permits oil and gas companies, in their filings with the SEC, to disclose not only "proved" reserves (i.e., quantities of oil and gas that are estimated to be recoverable with a high degree of confidence), but also "probable" reserves (i.e., quantities of oil and gas that are as likely as not to be recovered) as well as "possible" reserves (i.e., additional quantities of oil and gas that might be recovered, but with a lower probability than probable reserves). In addition unless otherwise noted, certain proved reserve numbers and other reserve numbers provided herein are not SEC “case” numbers using flat commodity prices, but a management case price deck using escalating prices for a period of time. As noted above, statements of reserves are only estimates and may not correspond to the ultimate quantities of oil and gas recovered. Any reserve estimates provided in this presentation that are not specifically designated as being estimates of proved reserves may include estimated reserves not necessarily calculated in accordance with, or contemplated by, the SEC's latest reserve reporting guidelines. Investors are urged to consider closely the disclosure in our Annual Report on Form 10‐K for the year ended December 31, 2012, which is available on our website at www.excoresources.com under the Investor Relations tab or by calling us at 214‐368‐2084. Forward Looking Statements (Continued)
