Attached files
| file | filename |
|---|---|
| 8-K - 8-K - UDR, Inc. | d595840d8k.htm |
| Acoma - Denver, CO Investor Presentation September 2013 Exhibit 99.1 |
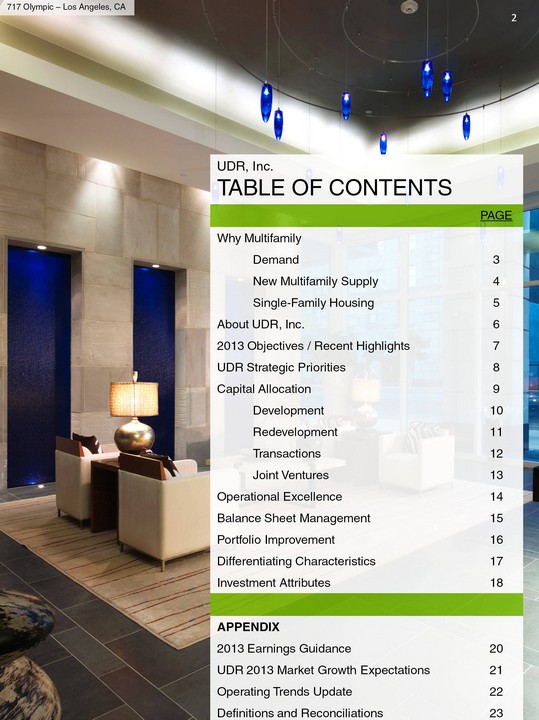
| 717 Olympic - Los Angeles, CA UDR, Inc. TABLE OF CONTENTS UDR, Inc. TABLE OF CONTENTS PAGE Why Multifamily Demand 3 New Multifamily Supply 4 Single-Family Housing 5 About UDR, Inc. 6 2013 Objectives / Recent Highlights 7 UDR Strategic Priorities 8 Capital Allocation 9 Development 10 Redevelopment 11 Transactions 12 Joint Ventures 13 Operational Excellence 14 Balance Sheet Management 15 Portfolio Improvement 16 Differentiating Characteristics 17 Investment Attributes 18 APPENDIX 2013 Earnings Guidance 20 UDR 2013 Market Growth Expectations 21 Operating Trends Update 22 Definitions and Reconciliations 23 2 |
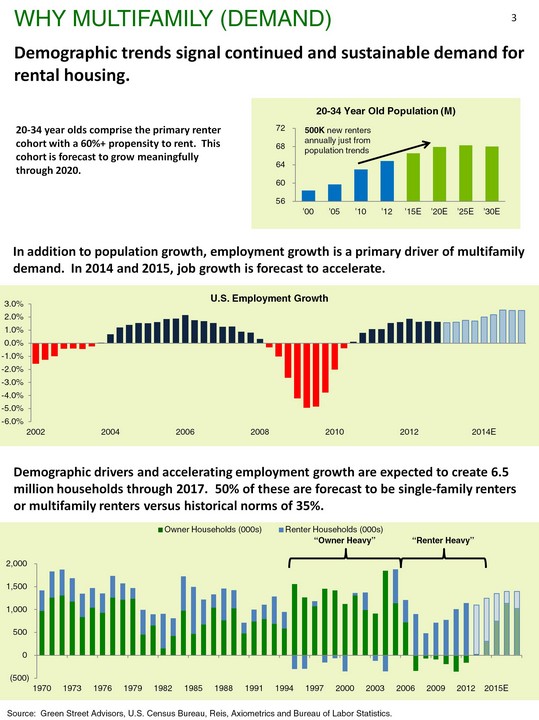
| Why Multifamily (Demand) (CHART) Source: Green Street Advisors, U.S. Census Bureau, Reis, Axiometrics and Bureau of Labor Statistics. 3 20-34 year olds comprise the primary renter cohort with a 60%+ propensity to rent. This cohort is forecast to grow meaningfully through 2020. In addition to population growth, employment growth is a primary driver of multifamily demand. In 2014 and 2015, job growth is forecast to accelerate. Demographic drivers and accelerating employment growth are expected to create 6.5 million households through 2017. 50% of these are forecast to be single-family renters or multifamily renters versus historical norms of 35%. (CHART) Demographic trends signal continued and sustainable demand for rental housing. (CHART) "Owner Heavy" "Renter Heavy" |
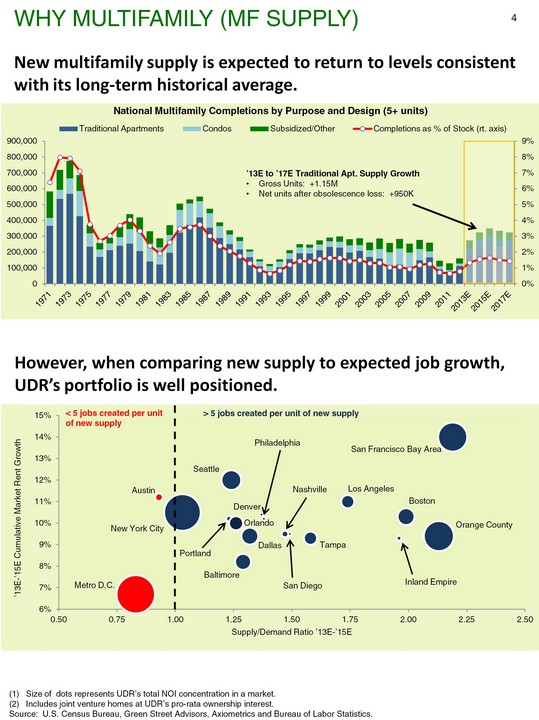
| However, when comparing new supply to expected job growth, UDR's portfolio is well positioned. Why Multifamily (MF Supply) 4 Portland New multifamily supply is expected to return to levels consistent with its long-term historical average. (CHART) '13E to '17E Traditional Apt. Supply Growth Gross Units: +1.15M Net units after obsolescence loss: +950K Size of dots represents UDR's total NOI concentration in a market. Includes joint venture homes at UDR's pro-rata ownership interest. Source: U.S. Census Bureau, Green Street Advisors, Axiometrics and Bureau of Labor Statistics. |
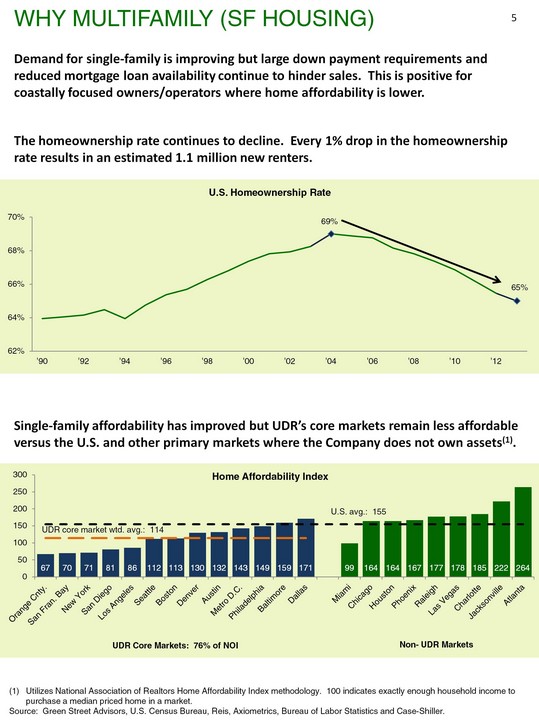
| Utilizes National Association of Realtors Home Affordability Index methodology. 100 indicates exactly enough household income to purchase a median priced home in a market. Source: Green Street Advisors, U.S. Census Bureau, Reis, Axiometrics, Bureau of Labor Statistics and Case-Shiller. Demand for single-family is improving but large down payment requirements and reduced mortgage loan availability continue to hinder sales. This is positive for coastally focused owners/operators where home affordability is lower. Why Multifamily (SF Housing) 5 (CHART) (CHART) Single-family affordability has improved but UDR's core markets remain less affordable versus the U.S. and other primary markets where the Company does not own assets(1). The homeownership rate continues to decline. Every 1% drop in the homeownership rate results in an estimated 1.1 million new renters. |
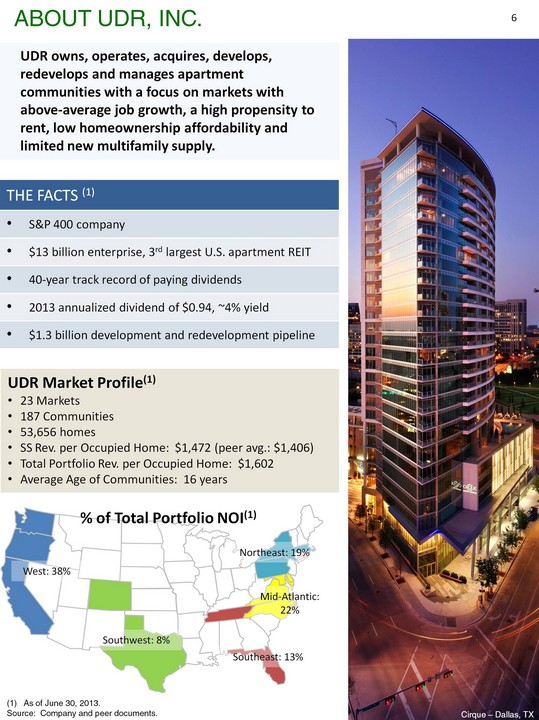
| About UDR, INC. 6 As of June 30, 2013. Source: Company and peer documents. The Facts (1) S&P 400 company $13 billion enterprise, 3rd largest U.S. apartment REIT 40-year track record of paying dividends 2013 annualized dividend of $0.94, ~4% yield $1.3 billion development and redevelopment pipeline West: 38% Southwest: 8% Southeast: 13% Mid-Atlantic: 22% Northeast: 19% UDR owns, operates, acquires, develops, redevelops and manages apartment communities with a focus on markets with above-average job growth, a high propensity to rent, low homeownership affordability and limited new multifamily supply. Cirque - Dallas, TX % of Total Portfolio NOI(1) |

| 2013 objectives Generated strong 2Q13 growth SS Revenue Growth: +5.2% SS NOI Growth: +6.8% 1 2 3 7 Generate strong organic growth SS Revenue Guidance: +4.5% to +5.0% SS NOI Guidance: +5.25% to +6.00% 1 Recent Highlights Progress $1.3 billion development and redevelopment pipeline Development: 6.0% to 6.5% avg. stabilized yield on cost Redevelopment: 7.0% to 9.0% cash-on- cash stabilized yield + cap rate compression 2 Position UDR for strong cash flow per share growth in '14 and '15 3 Execute UDR's 3-Year Strategic Plan 4 Formed Vitruvian Park(r) Partnerships $290 million JV with MetLife comprised of operating assets and new development potential 3Q13 operating trends Move-outs to home purchase at 13.4% in 2Q versus UDR's LT average of 14.5% Rent-to-income at 17.0% in 2Q See page 22 for market-level detail 717 Olympic - Los Angeles, CA (1) As of 8/31/2013. Source: Company documents. SS Growth New Lease Renewal Occupancy QTD 3Q 2013(1) +4.1% +5.6% 96.1% 2Q 2013 +4.3% +5.4% 96.1% |
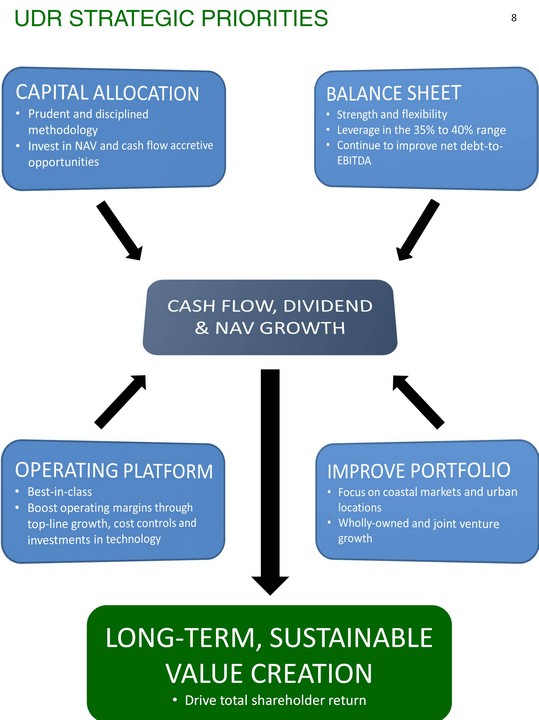
| UDR Strategic priorities 8 CAPITAL ALLOCATION Prudent and disciplined methodology Invest in NAV and cash flow accretive opportunities BALANCE SHEET Strength and flexibility Leverage in the 35% to 40% range Continue to improve net debt-to- EBITDA OPERATING PLATFORM Best-in-class Boost operating margins through top-line growth, cost controls and investments in technology IMPROVE PORTFOLIO Focus on coastal markets and urban locations Wholly-owned and joint venture growth CASH FLOW, DIVIDEND & NAV GROWTH LONG-TERM, SUSTAINABLE VALUE CREATION Drive total shareholder return |
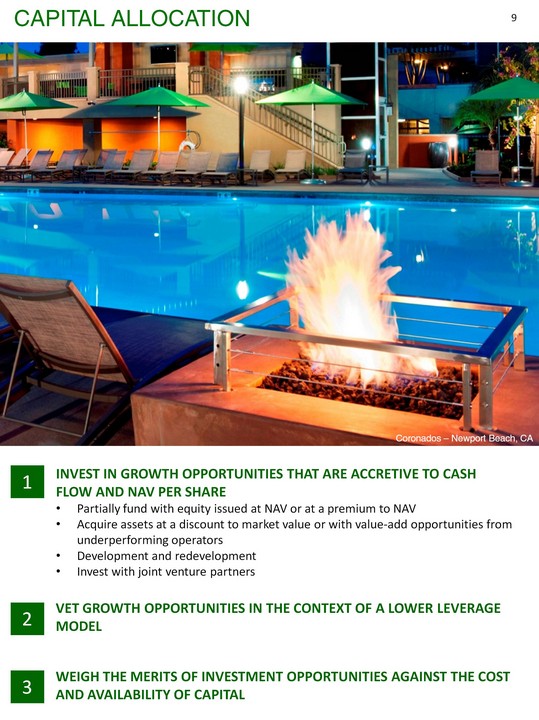
| Capital Allocation Invest in growth opportunities that are accretive to cash flow and NAV per share Partially fund with equity issued at NAV or at a premium to NAV Acquire assets at a discount to market value or with value-add opportunities from underperforming operators Development and redevelopment Invest with joint venture partners Vet growth opportunities in the context of a lower leverage model Weigh the merits of investment opportunities against the cost and availability of capital Coronados - Newport Beach, CA 9 |
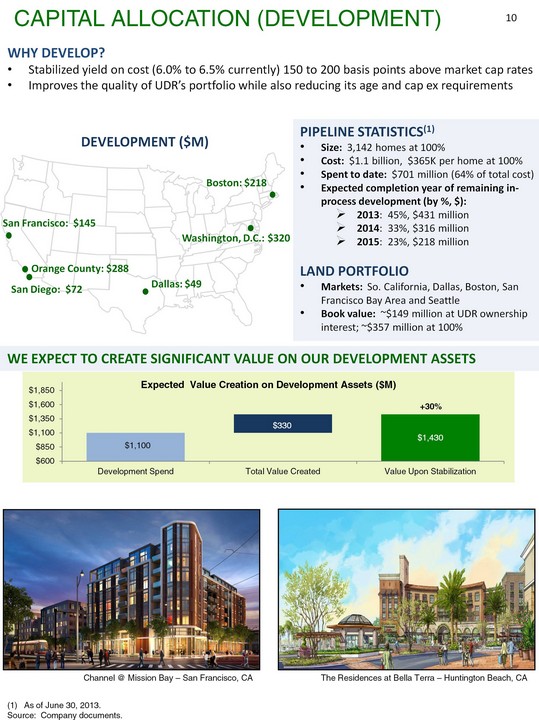
| As of June 30, 2013. Source: Company documents. (CHART) Pipeline statistics(1) Size: 3,142 homes at 100% Cost: $1.1 billion, $365K per home at 100% Spent to date: $701 million (64% of total cost) Expected completion year of remaining in- process development (by %, $): 2013: 45%, $431 million 2014: 33%, $316 million 2015: 23%, $218 million Land portfolio Markets: So. California, Dallas, Boston, San Francisco Bay Area and Seattle Book value: ~$149 million at UDR ownership interest; ~$357 million at 100% Capital Allocation (Development) 10 We expect to create significant value on our development assets development ($M) Boston: $218 Why develop? Stabilized yield on cost (6.0% to 6.5% currently) 150 to 200 basis points above market cap rates Improves the quality of UDR's portfolio while also reducing its age and cap ex requirements Channel @ Mission Bay - San Francisco, CA The Residences at Bella Terra - Huntington Beach, CA +30% |
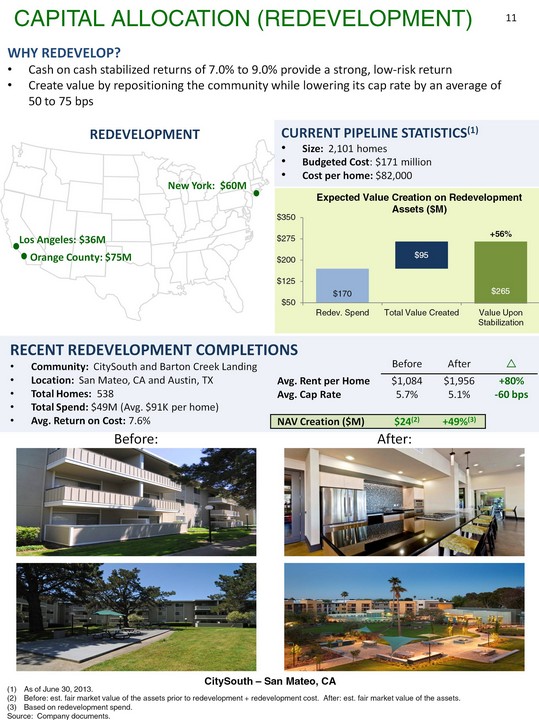
| As of June 30, 2013. Before: est. fair market value of the assets prior to redevelopment + redevelopment cost. After: est. fair market value of the assets. Based on redevelopment spend. Source: Company documents. (CHART) Capital Allocation (redevelopment) 11 Current Pipeline statistics(1) Size: 2,101 homes Budgeted Cost: $171 million Cost per home: $82,000 Redevelopment New York: $60M Orange County: $75M Why redevelop? Cash on cash stabilized returns of 7.0% to 9.0% provide a strong, low-risk return Create value by repositioning the community while lowering its cap rate by an average of 50 to 75 bps After: Before: Recent Redevelopment Completions Community: CitySouth and Barton Creek Landing Location: San Mateo, CA and Austin, TX Total Homes: 538 Total Spend: $49M (Avg. $91K per home) Avg. Return on Cost: 7.6% +56% Before After ? Avg. Rent per Home $1,084 $1,956 +80% Avg. Cap Rate 5.7% 5.1% -60 bps NAV Creation ($M) $24(2) +49%(3) CitySouth - San Mateo, CA Los Angeles: $36M |
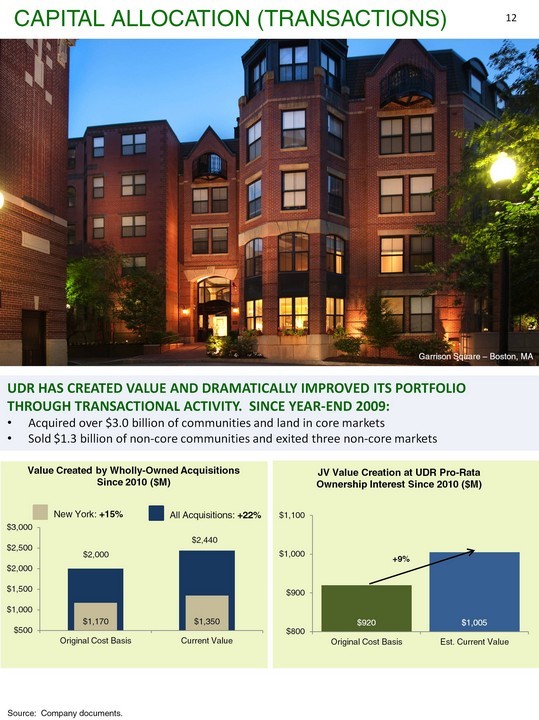
| Source: Company documents. Capital Allocation (Transactions) 12 UDR has created value and dramatically improved its portfolio through transactional activity. Since year-end 2009: Acquired over $3.0 billion of communities and land in core markets Sold $1.3 billion of non-core communities and exited three non-core markets Garrison Square - Boston, MA (CHART) New York: +15% All Acquisitions: +22% $2,000 $2,440 (CHART) +9% Value Created by Wholly-Owned Acquisitions Since 2010 ($M) |
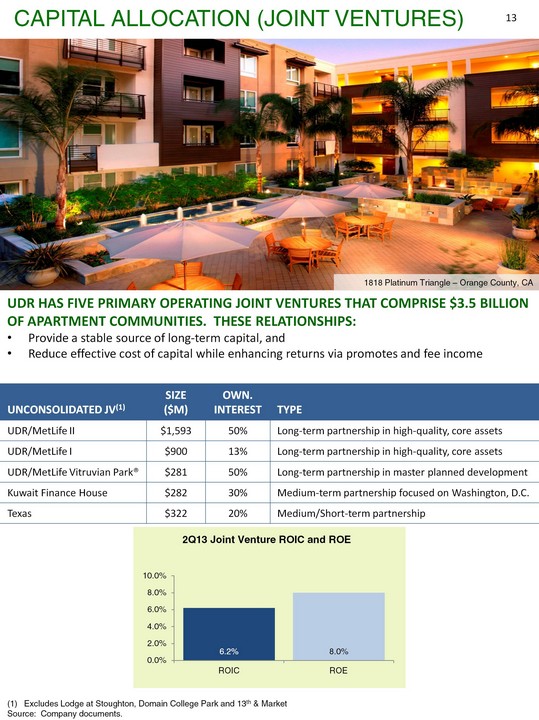
| (CHART) Excludes Lodge at Stoughton, Domain College Park and 13th & Market Source: Company documents. Columbus Square - New York, NY UNCONSOLIDATED JV(1) SIZE ($M) OWN. INTEREST TYPE UDR/MetLife II $1,593 50% Long-term partnership in high-quality, core assets UDR/MetLife I $900 13% Long-term partnership in high-quality, core assets UDR/MetLife Vitruvian Park(r) $281 50% Long-term partnership in master planned development Kuwait Finance House $282 30% Medium-term partnership focused on Washington, D.C. Texas $322 20% Medium/Short-term partnership UDR has five primary operating joint ventures that comprise $3.5 billion of apartment communities. These relationships: Provide a stable source of long-term capital, and Reduce effective cost of capital while enhancing returns via promotes and fee income Capital Allocation (Joint Ventures) 13 1818 Platinum Triangle - Orange County, CA |
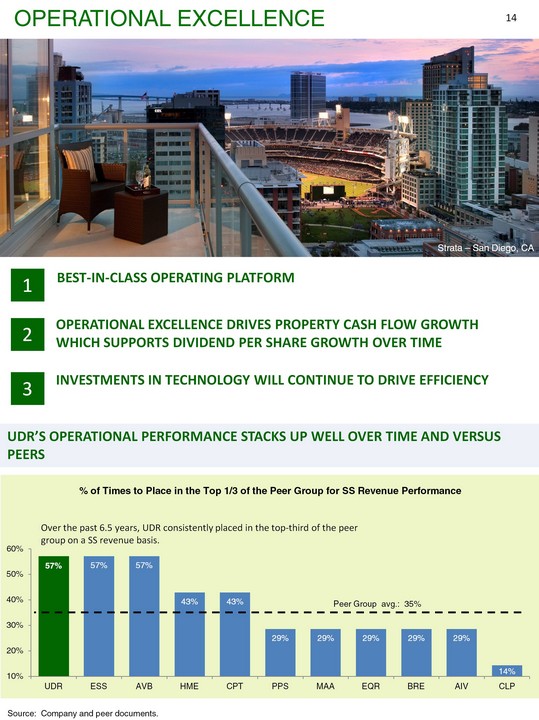
| Operational excellence drives property cash flow growth which supports dividend per share growth over time Investments in technology will continue to drive efficiency Best-in-class operating platform Operational Excellence 14 UDR's operational performance stacks up well over time and versus peers Source: Company and peer documents. Strata - San Diego, CA (CHART) Peer Group avg.: 35% |

| METRIC YEAR-END 2009 2Q13 YEAR-END 2013E YEAR-END 2015E Debt-to-assets 53% 39% 38% to 40% 35% to 40% Net debt-to-EBITDA 10.0x 6.9x 6.8x to 7.2x 6.0x to 6.5x Fixed Charge Coverage 2.0x 3.1x 2.8x to 3.0x 3.1x to 3.3x Balance sheet management 15 3 Well-Laddered Maturity Schedule with 83% fixed-rate debt 4 Investment Grade Ratings S&P: BBB, stable outlook Moody's: Baa2, positive outlook (CHART) 0% 9% 17% 4% 10% 32% 9% 12% 4% Source: Company documents. 3% 0% |
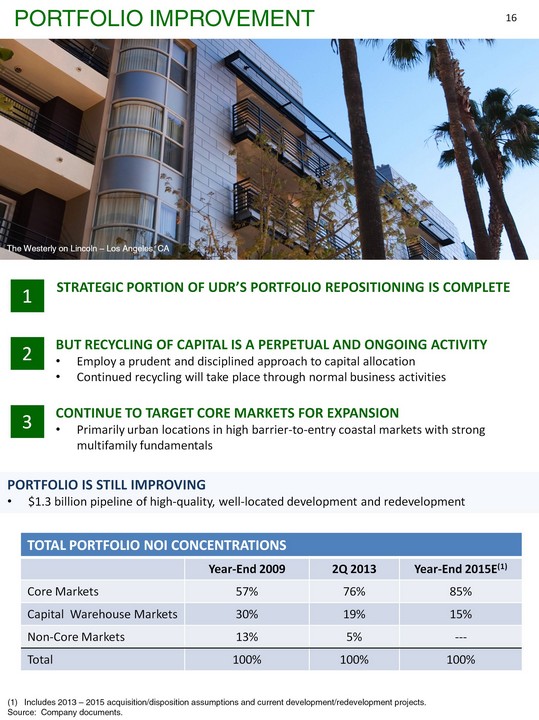
| The Westerly on Lincoln - Los Angeles, CA Portfolio is Still Improving $1.3 billion pipeline of high-quality, well-located development and redevelopment But recycling of capital is a Perpetual and ongoing activity Employ a prudent and disciplined approach to capital allocation Continued recycling will take place through normal business activities Continue to target core markets for expansion Primarily urban locations in high barrier-to-entry coastal markets with strong multifamily fundamentals Strategic portion of UDR's portfolio repositioning is complete Portfolio improvement 16 TOTAL PORTFOLIO NOI CONCENTRATIONS TOTAL PORTFOLIO NOI CONCENTRATIONS TOTAL PORTFOLIO NOI CONCENTRATIONS TOTAL PORTFOLIO NOI CONCENTRATIONS Year-End 2009 2Q 2013 Year-End 2015E(1) Core Markets 57% 76% 85% Capital Warehouse Markets 30% 19% 15% Non-Core Markets 13% 5% --- Total 100% 100% 100% Includes 2013 - 2015 acquisition/disposition assumptions and current development/redevelopment projects. Source: Company documents. |
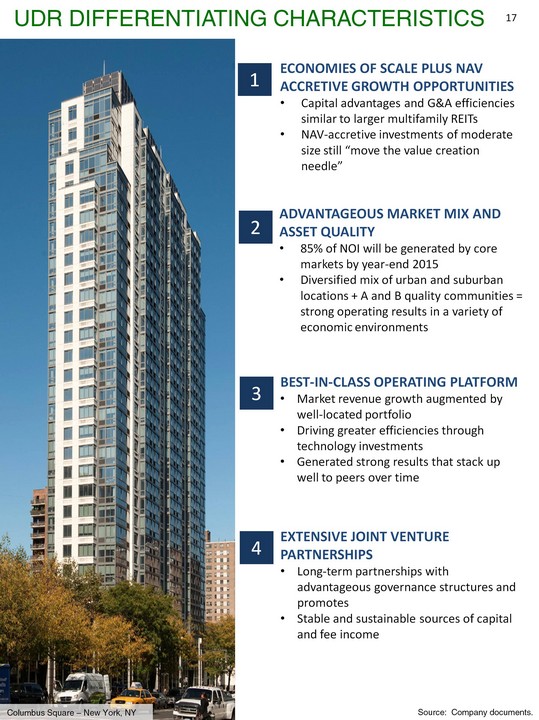
| 1 2 3 4 ECONOMIES OF SCALE plus NAV ACCRETIVE GROWTH OPPORTUNITIES Capital advantages and G&A efficiencies similar to larger multifamily REITs NAV-accretive investments of moderate size still "move the value creation needle" Advantageous market mix and asset quality 85% of NOI will be generated by core markets by year-end 2015 Diversified mix of urban and suburban locations + A and B quality communities = strong operating results in a variety of economic environments Best-in-class operating platform Market revenue growth augmented by well-located portfolio Driving greater efficiencies through technology investments Generated strong results that stack up well to peers over time Extensive Joint Venture partnerships Long-term partnerships with advantageous governance structures and promotes Stable and sustainable sources of capital and fee income UDR differentiating characteristics 17 Source: Company documents. Columbus Square - New York, NY |
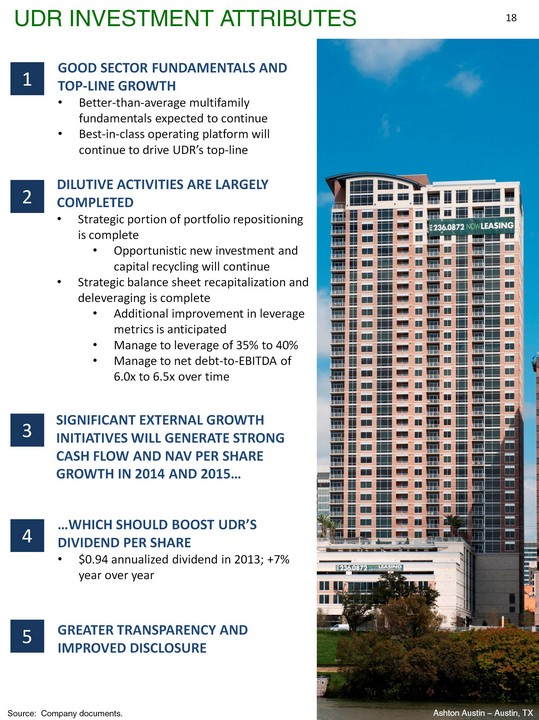
| 1 good sector Fundamentals and Top-line growth Better-than-average multifamily fundamentals expected to continue Best-in-class operating platform will continue to drive UDR's top-line Dilutive activities are largely completed Strategic portion of portfolio repositioning is complete Opportunistic new investment and capital recycling will continue Strategic balance sheet recapitalization and deleveraging is complete Additional improvement in leverage metrics is anticipated Manage to leverage of 35% to 40% Manage to net debt-to-EBITDA of 6.0x to 6.5x over time Significant external growth initiatives will generate strong cash flow and NAV per share Growth in 2014 and 2015... ...which should boost UDR's dividend per share $0.94 annualized dividend in 2013; +7% year over year Greater transparency and improved disclosure 2 3 4 5 UDR Investment attributes 18 Source: Company documents. Ashton Austin - Austin, TX |
| Ashton Westwood - Los Angeles, CA UDR, Inc. Appendix UDR, Inc. Appendix PAGE 2013 Earnings Guidance 20 2013 Market Growth Expectations 21 Operating Trends Update 22 Definitions and Reconciliations 23 19 |
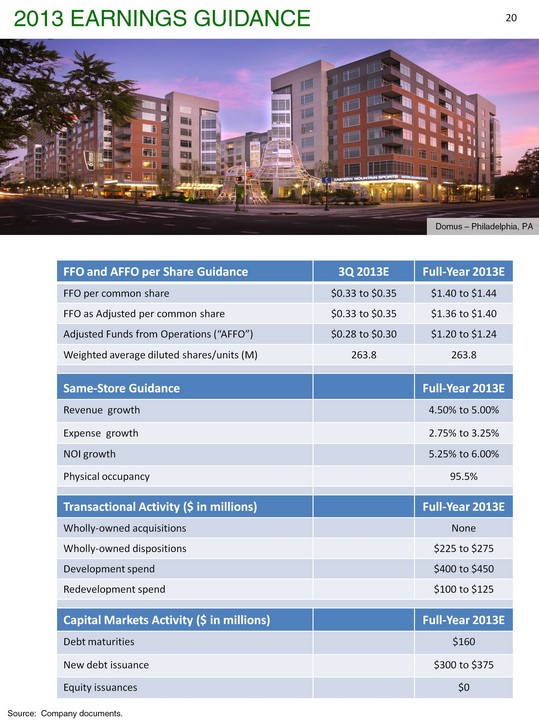
| 2013 Earnings Guidance 20 FFO and AFFO per Share Guidance 3Q 2013E Full-Year 2013E FFO per common share $0.33 to $0.35 $1.40 to $1.44 FFO as Adjusted per common share $0.33 to $0.35 $1.36 to $1.40 Adjusted Funds from Operations ("AFFO") $0.28 to $0.30 $1.20 to $1.24 Weighted average diluted shares/units (M) 263.8 263.8 Same-Store Guidance Full-Year 2013E Revenue growth 4.50% to 5.00% Expense growth 2.75% to 3.25% NOI growth 5.25% to 6.00% Physical occupancy 95.5% Transactional Activity ($ in millions) Full-Year 2013E Wholly-owned acquisitions None Wholly-owned dispositions $225 to $275 Development spend $400 to $450 Redevelopment spend $100 to $125 Capital Markets Activity ($ in millions) Full-Year 2013E Debt maturities $160 New debt issuance $300 to $375 Equity issuances $0 Source: Company documents. Domus - Philadelphia, PA |
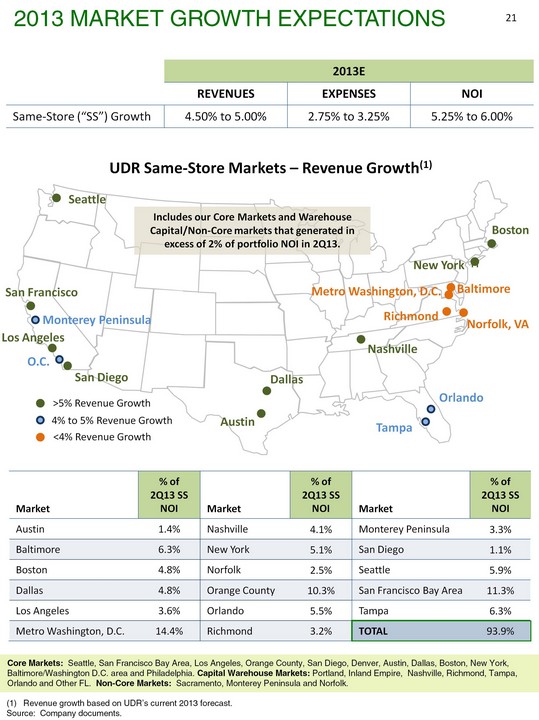
| 2013E 2013E 2013E REVENUES EXPENSES NOI Same-Store ("SS") Growth 4.50% to 5.00% 2.75% to 3.25% 5.25% to 6.00% Revenue growth based on UDR's current 2013 forecast. Source: Company documents. Core Markets: Seattle, San Francisco Bay Area, Los Angeles, Orange County, San Diego, Denver, Austin, Dallas, Boston, New York, Baltimore/Washington D.C. area and Philadelphia. Capital Warehouse Markets: Portland, Inland Empire, Nashville, Richmond, Tampa, Orlando and Other FL. Non-Core Markets: Sacramento, Monterey Peninsula and Norfolk. Includes our Core Markets and Warehouse Capital/Non-Core markets that generated in excess of 2% of portfolio NOI in 2Q13. 2013 Market Growth Expectations 21 Market % of 2Q13 SS NOI Market % of 2Q13 SS NOI Market % of 2Q13 SS NOI Austin 1.4% Nashville 4.1% Monterey Peninsula 3.3% Baltimore 6.3% New York 5.1% San Diego 1.1% Boston 4.8% Norfolk 2.5% Seattle 5.9% Dallas 4.8% Orange County 10.3% San Francisco Bay Area 11.3% Los Angeles 3.6% Orlando 5.5% Tampa 6.3% Metro Washington, D.C. 14.4% Richmond 3.2% TOTAL 93.9% |
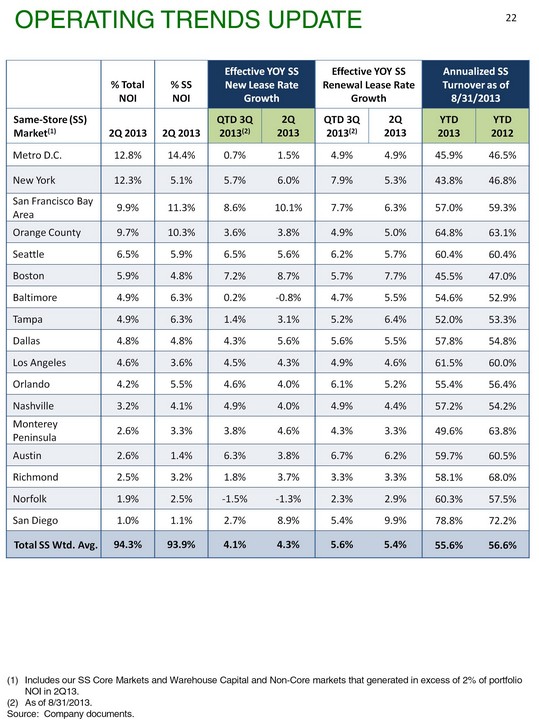
| Includes our SS Core Markets and Warehouse Capital and Non-Core markets that generated in excess of 2% of portfolio NOI in 2Q13. As of 8/31/2013. Source: Company documents. Operating Trends Update 22 % Total NOI % SS NOI Effective YOY SS New Lease Rate Growth Effective YOY SS New Lease Rate Growth Effective YOY SS Renewal Lease Rate Growth Effective YOY SS Renewal Lease Rate Growth Annualized SS Turnover as of 8/31/2013 Annualized SS Turnover as of 8/31/2013 Same-Store (SS) Market(1) 2Q 2013 2Q 2013 QTD 3Q 2013(2) 2Q 2013 QTD 3Q 2013(2) 2Q 2013 YTD 2013 YTD 2012 Metro D.C. 12.8% 14.4% 0.7% 1.5% 4.9% 4.9% 45.9% 46.5% New York 12.3% 5.1% 5.7% 6.0% 7.9% 5.3% 43.8% 46.8% San Francisco Bay Area 9.9% 11.3% 8.6% 10.1% 7.7% 6.3% 57.0% 59.3% Orange County 9.7% 10.3% 3.6% 3.8% 4.9% 5.0% 64.8% 63.1% Seattle 6.5% 5.9% 6.5% 5.6% 6.2% 5.7% 60.4% 60.4% Boston 5.9% 4.8% 7.2% 8.7% 5.7% 7.7% 45.5% 47.0% Baltimore 4.9% 6.3% 0.2% -0.8% 4.7% 5.5% 54.6% 52.9% Tampa 4.9% 6.3% 1.4% 3.1% 5.2% 6.4% 52.0% 53.3% Dallas 4.8% 4.8% 4.3% 5.6% 5.6% 5.5% 57.8% 54.8% Los Angeles 4.6% 3.6% 4.5% 4.3% 4.9% 4.6% 61.5% 60.0% Orlando 4.2% 5.5% 4.6% 4.0% 6.1% 5.2% 55.4% 56.4% Nashville 3.2% 4.1% 4.9% 4.0% 4.9% 4.4% 57.2% 54.2% Monterey Peninsula 2.6% 3.3% 3.8% 4.6% 4.3% 3.3% 49.6% 63.8% Austin 2.6% 1.4% 6.3% 3.8% 6.7% 6.2% 59.7% 60.5% Richmond 2.5% 3.2% 1.8% 3.7% 3.3% 3.3% 58.1% 68.0% Norfolk 1.9% 2.5% -1.5% -1.3% 2.3% 2.9% 60.3% 57.5% San Diego 1.0% 1.1% 2.7% 8.9% 5.4% 9.9% 78.8% 72.2% Total SS Wtd. Avg. 94.3% 93.9% 4.1% 4.3% 5.6% 5.4% 55.6% 56.6% |
| Please see the Company's most recent Earnings Supplement, available at www.udr.com, for a full list of definitions, reconciliations and details on the financial position and operating results of the Company. Adjusted Funds From Operations ("AFFO"): The Company defines AFFO as FFO as Adjusted less recurring capital expenditures that are necessary to help preserve the value of and maintain functionality at our communities. Management considers AFFO a useful supplemental performance metric for investors as it is more indicative of the Company's operational performance than FFO or FFO as Adjusted. AFFO is not intended to represent cash flow or liquidity for the period, and is only intended to provide an additional measure of our operating performance. The Company believes that net income attributable to UDR, Inc. is the most directly comparable GAAP financial measure to AFFO. Management believes that AFFO is a widely recognized measure of the operations of REITs, and presenting AFFO will enable investors to assess our performance in comparison to other REITs. However, other REITs may use different methodologies for calculating AFFO and, accordingly, our AFFO may not always be comparable to AFFO calculated by other REITs. AFFO should not be considered as an alternative to net income (determined in accordance with GAAP) as an indication of financial performance, or as alternative to cash flows from operating activities (determined in accordance with GAAP) as a measure of our liquidity, nor is it indicative of funds available to fund our cash needs, including our ability to make distributions. A reconciliation from net income attributable to UDR, Inc. to AFFO is provided on page 27 of this presentation. Funds From Operations ("FFO"): The Company defines FFO as net income (computed in accordance with GAAP), excluding impairment write-downs of depreciable real estate or of investments in non-consolidated investees that are driven by measurable decreases in the fair value of depreciable real estate held by the investee, gains (or losses) from sales of depreciable property, plus real estate depreciation and amortization, and after adjustments for unconsolidated partnerships and joint ventures. This definition conforms with the National Association of Real Estate Investment Trust's definition issued in April 2002. In the computation of diluted FFO, OP units, unvested restricted stock, stock options, and the shares of Series E Cumulative Convertible Preferred Stock are dilutive; therefore, they are included in the diluted share count. Activities of our taxable REIT subsidiary (TRS), RE3, include development and land entitlement. From time to time, we develop and subsequently sell a TRS property which results in a short-term use of funds that produces a profit that differs from the traditional long-term investment in real estate for REITs. We believe that the inclusion of these TRS gains in FFO is consistent with the standards established by NAREIT as the sort-term investment is incidental to our main business. TRS gains on sales, net of taxes, are defined as net sales proceeds less a tax provision and the gross investment basis of the asset before accumulated depreciation. Management considers FFO a useful metric for investors as the Company uses FFO in evaluating property acquisitions and its operating performance and believes that FFO should be considered along with, but not as an alternative to, net income and cash flow as a measure of the Company's activities in accordance with GAAP. FFO does not represent cash generated from operating activities in accordance with GAAP and is not necessarily indicative of funds available to fund our cash needs. A reconciliation from net income attributable to UDR, Inc. to FFO is provided on page 27 of this presentation. Funds From Operations as Adjusted: The Company defines FFO as Adjusted as FFO excluding the impact of acquisition-related costs and other comparable items including, but not limited to, prepayment costs/benefits associated with early debt retirement, gains on sales of marketable securities and TRS property, deferred tax valuation allowance increases and decreases, storm-related expenses, severance costs and legal costs. Management believes that FFO as Adjusted is useful supplemental information regarding our operating performance as it provides a consistent comparison of our operating performance across time periods and allows investors to more easily compare our operating results with other REITs. FFO as Adjusted is not intended to represent cash flow or liquidity for the period, and is only intended to provide an additional measure of our operating performance. The Company believes that net income attributable to UDR, Inc. is the most directly comparable GAAP financial measure to FFO as Adjusted. However, other REITs may use different methodologies for calculating FFO as Adjusted or similar FFO measure and, accordingly, our FFO as Adjusted may not always be comparable to FFO as Adjusted or similar FFO measure calculated by other REITs. FFO as Adjusted should not be considered as an alternative to net income (determined in accordance with GAAP) as in indication of financial performance, or as an alternative to cash flows from operating activities (determined in accordance with GAAP) as a measure of our liquidity. A reconciliation from net income attributable to UDR, Inc. to FFO as Adjusted is provided on page 27 of this presentation. Definitions and reconciliations 23 |
| Net Asset Value: Net Asset Value ("NAV") is defined as marked-to-market value of assets less marked-to-market value of liabilities and preferred equity, divided by total outstanding diluted shares and operating units. Management considers NAV a useful metric for investors as it provides context to portfolio value changes over time based on widely accepted market inputs. Stabilization Period for Development Yield: The Company defines the stabilization period for development property yield as the forward twelve month NOI, excluding any remaining lease-up concessions outstanding, commencing one year following the delivery of the final home of the project. Stabilization Period for Redevelopment Yield: The Company defines the stabilization period for a redevelopment property for purposes of computing the Projected Weighted Average Return on Incremental Capital Invested, as the forward twelve month NOI, excluding any remaining lease-up concessions outstanding, following the delivery of the final home of a project. Effective New Lease Rate Growth: The Company defines effective new lease rate growth as the increase in gross potential rent realized less all concessions for the new lease term (current effective rent) versus prior resident effective rent for the prior lease term on all new leases commenced during the current quarter. Effective Renewal Lease Rate Growth: The Company defines effective renewal lease rate growth as the increase in gross potential rent realized less all concessions for the new lease term (current effective rent) versus prior effective rent for the prior lease term on all renewed leases commenced during the current quarter. JV Return on Equity ("ROE"): The Company defines JV ROE as the pro rata share of property NOI plus property and asset management fee revenue less interest expense, divided by the average of beginning and ending equity capital for the quarter. Management considers ROE a useful metric for investors as it provides a widely used measure of how well the Company is investing its capital on a leveraged basis. JV Return on Invested Capital ("ROIC"): The Company defines JV ROIC as the pro rata share of property NOI plus property and asset management fee revenue divided by the average of beginning and ending invested capital for the quarter. Management considers ROIC a useful metric for investors as it provides a widely used measure of how well the Company is investing its capital on an unleveraged basis. Stabilized Yield on Developments: Expected stabilized yields on development are calculated as follows, projected stabilized NOI less management fees divided by budgeted construction cost on a project-specific basis. Projected stabilized NOI for development projects, calculated in accordance with the NOI reconciliation provided above, is set forth in the definition of Stabilization Period for Development Yield. Given the differing completion dates and years for which NOI is being projected for these communities as well as the complexities associated with estimating other expenses upon completion such as corporate overhead allocation, general and administrative costs and capital structure, a reconciliation to GAAP measures is not meaningful. Projected NOI for these projects is neither provided, nor is representative of Management's expectations for the Company's overall financial performance or cash flow growth and there can be no assurances that forecast NOI growth implied in the estimated construction yield of any project will be achieved. Management considers estimated stabilized yield on development as a useful metric for investors as it helps provide context to the expected effects that development projects will have on the Company's future performance once stabilized. Total Revenue per Occupied Home: The Company defines total revenue per occupied home as rental and other revenues, calculated in accordance with GAAP, divided by the product of occupancy and the number of apartment homes. Value Creation: Value creation is defined as the difference between the Company's best estimate of the current or expected market value of a community and its original purchase price or cost basis. Underlying valuation estimates and model inputs are provided by the Company. Estimated value creation is not representative of the Company's expectations for its overall financial performance or cash flow growth and there can be no assurances that the value creation implied for any of the Company's communities will be achieved. Management considers value creation a useful metric for investors as it quantifies how successful the Company's past investments have been and current investments are expected to be. Definitions and reconciliations 24 |
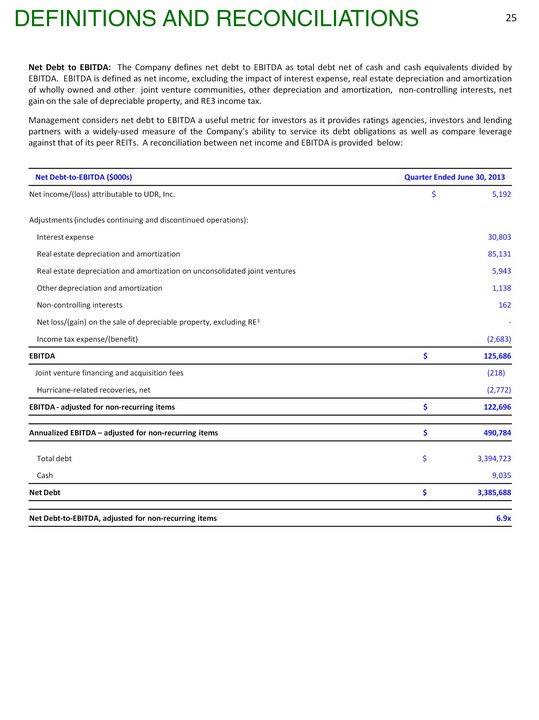
| Net Debt to EBITDA: The Company defines net debt to EBITDA as total debt net of cash and cash equivalents divided by EBITDA. EBITDA is defined as net income, excluding the impact of interest expense, real estate depreciation and amortization of wholly owned and other joint venture communities, other depreciation and amortization, non-controlling interests, net gain on the sale of depreciable property, and RE3 income tax. Management considers net debt to EBITDA a useful metric for investors as it provides ratings agencies, investors and lending partners with a widely-used measure of the Company's ability to service its debt obligations as well as compare leverage against that of its peer REITs. A reconciliation between net income and EBITDA is provided below: Net Debt-to-EBITDA ($000s) Quarter Ended June 30, 2013 Net income/(loss) attributable to UDR, Inc. $ 5,192 Adjustments (includes continuing and discontinued operations): Interest expense 30,803 Real estate depreciation and amortization 85,131 Real estate depreciation and amortization on unconsolidated joint ventures 5,943 Other depreciation and amortization 1,138 Non-controlling interests 162 Net loss/(gain) on the sale of depreciable property, excluding RE3 - Income tax expense/(benefit) (2,683) EBITDA $ 125,686 Joint venture financing and acquisition fees (218) Hurricane-related recoveries, net (2,772) EBITDA - adjusted for non-recurring items $ 122,696 Annualized EBITDA - adjusted for non-recurring items $ 490,784 Total debt $ 3,394,723 Cash 9,035 Net Debt $ 3,385,688 Net Debt-to-EBITDA, adjusted for non-recurring items 6.9x Definitions and reconciliations 25 |
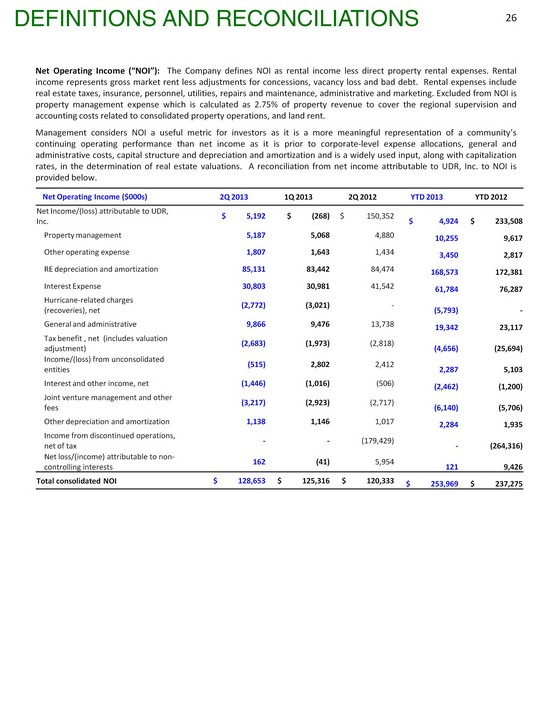
| Net Operating Income ("NOI"): The Company defines NOI as rental income less direct property rental expenses. Rental income represents gross market rent less adjustments for concessions, vacancy loss and bad debt. Rental expenses include real estate taxes, insurance, personnel, utilities, repairs and maintenance, administrative and marketing. Excluded from NOI is property management expense which is calculated as 2.75% of property revenue to cover the regional supervision and accounting costs related to consolidated property operations, and land rent. Management considers NOI a useful metric for investors as it is a more meaningful representation of a community's continuing operating performance than net income as it is prior to corporate-level expense allocations, general and administrative costs, capital structure and depreciation and amortization and is a widely used input, along with capitalization rates, in the determination of real estate valuations. A reconciliation from net income attributable to UDR, Inc. to NOI is provided below. Net Operating Income ($000s) 2Q 2013 1Q 2013 2Q 2012 YTD 2013 YTD 2012 Net Income/(loss) attributable to UDR, Inc. $ 5,192 $ (268) $ 150,352 $ 4,924 $ 233,508 Property management 5,187 5,068 4,880 10,255 9,617 Other operating expense 1,807 1,643 1,434 3,450 2,817 RE depreciation and amortization 85,131 83,442 84,474 168,573 172,381 Interest Expense 30,803 30,981 41,542 61,784 76,287 Hurricane-related charges (recoveries), net (2,772) (3,021) - (5,793) - General and administrative 9,866 9,476 13,738 19,342 23,117 Tax benefit , net (includes valuation adjustment) (2,683) (1,973) (2,818) (4,656) (25,694) Income/(loss) from unconsolidated entities (515) 2,802 2,412 2,287 5,103 Interest and other income, net (1,446) (1,016) (506) (2,462) (1,200) Joint venture management and other fees (3,217) (2,923) (2,717) (6,140) (5,706) Other depreciation and amortization 1,138 1,146 1,017 2,284 1,935 Income from discontinued operations, net of tax - - (179,429) - (264,316) Net loss/(income) attributable to non-controlling interests 162 (41) 5,954 121 9,426 Total consolidated NOI $ 128,653 $ 125,316 $ 120,333 $ 253,969 $ 237,275 Definitions and reconciliations 26 |
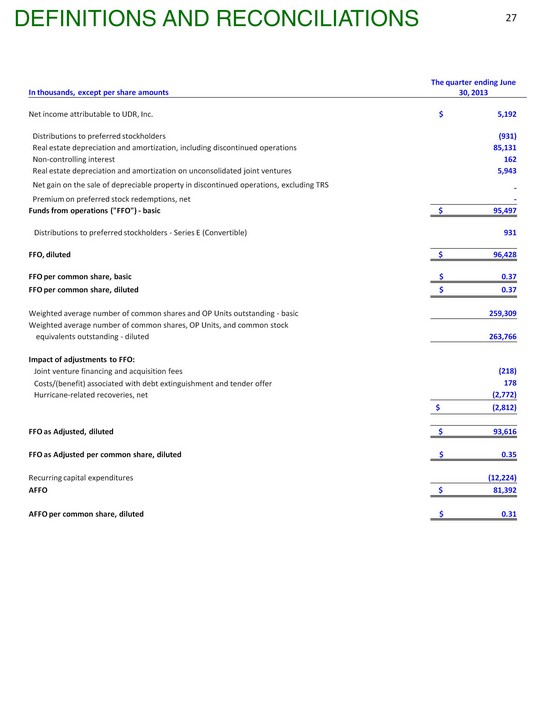
| Definitions and reconciliations 27 In thousands, except per share amounts The quarter ending June 30, 2013 Net income attributable to UDR, Inc. $ 5,192 Distributions to preferred stockholders (931) Real estate depreciation and amortization, including discontinued operations 85,131 Non-controlling interest 162 Real estate depreciation and amortization on unconsolidated joint ventures 5,943 Net gain on the sale of depreciable property in discontinued operations, excluding TRS - Premium on preferred stock redemptions, net - Funds from operations ("FFO") - basic $ 95,497 Distributions to preferred stockholders - Series E (Convertible) 931 FFO, diluted $ 96,428 FFO per common share, basic $ 0.37 FFO per common share, diluted $ 0.37 Weighted average number of common shares and OP Units outstanding - basic 259,309 Weighted average number of common shares, OP Units, and common stock equivalents outstanding - diluted 263,766 Impact of adjustments to FFO: Joint venture financing and acquisition fees (218) Costs/(benefit) associated with debt extinguishment and tender offer 178 Hurricane-related recoveries, net (2,772) $ (2,812) FFO as Adjusted, diluted $ 93,616 FFO as Adjusted per common share, diluted $ 0.35 Recurring capital expenditures (12,224) AFFO $ 81,392 AFFO per common share, diluted $ 0.31 |
| Certain statements made in this presentation may constitute "forward-looking statements." Words such as "expects," "intends," "believes," "anticipates," "plans," "likely," "will," "seeks," "estimates" and variations of such words and similar expressions are intended to identify such forward-looking statements. Forward-looking statements, by their nature, involve estimates, projections, goals, forecasts and assumptions and are subject to risks and uncertainties that could cause actual results or outcomes to differ materially from those expressed in a forward-looking statement, due to a number of factors, which include, but are not limited to, unfavorable changes in the apartment market, changing economic conditions, the impact of inflation/deflation on rental rates and property operating expenses, expectations concerning availability of capital and the stabilization of the capital markets, the impact of competition and competitive pricing, acquisitions, developments and redevelopments not achieving anticipated results, delays in completing developments, redevelopments and lease-ups on schedule, expectations on job growth, home affordability and demand/supply ratio for multifamily housing, expectations concerning development and redevelopment activities, expectations on occupancy levels, expectations concerning the Vitruvian Park(r) development, expectations concerning the joint ventures with third parties, expectations that automation will help grow net operating income, expectations on annualized net operating income and other risk factors discussed in documents filed by the Company with the Securities and Exchange Commission from time to time, including the Company's Annual Report on Form 10-K and the Company's Quarterly Reports on Form 10-Q. Actual results may differ materially from those described in the forward-looking statements. These forward-looking statements and such risks, uncertainties and other factors speak only as of the date of this press release, and the Company expressly disclaims any obligation or undertaking to update or revise any forward-looking statement contained herein, to reflect any change in the Company's expectations with regard thereto, or any other change in events, conditions or circumstances on which any such statement is based, except to the extent otherwise required under the U.S. securities laws. This presentation and these forward-looking statements include UDR's analysis and conclusions and reflect UDR's judgment as of the date of these materials. UDR assumes no obligation to revise or update to reflect future events or circumstances. * Green Street Advisors ("GSA") is an independent research, trading and consulting firm. By referencing reports included on GSA's website, UDR does not intend to incorporate any of the information included on that website into this presentation, or to otherwise adopt or endorse any analysis, statements or communications made by GSA on its website or elsewhere. Forward Looking Statements 28 |

| Notes 29 |

| Notes 30 |

| Notes 31 |
| Investor Relations Contact: Chris Van Ens cvanens@udr.com 720.348.7762 |