Attached files
| file | filename |
|---|---|
| 8-K - 8-K - PARKWAY PROPERTIES INC | d596850d8k.htm |
 Investor
Presentation Acquisition of Thomas Properties Group, Inc.
September
2013
Exhibit 99.1 |
 2
Forward-Looking Statements
Certain statements contained in this presentation, including those that express a belief, expectation
or intention, as well as those that are not statements of historical fact, are
forward-looking statements within the meaning of the federal securities laws and as such are based
upon the Company’s current beliefs as to the outcome and timing of future events. There can be no
assurance that actual future developments affecting the Company will be those anticipated by
the Company. Examples of forward-looking statements include projected capital resources,
projected profitability and portfolio performance, estimates of market rental rates, projected capital
improvements, expected sources of financing, expectations as to the timing of closing of acquisitions,
dispositions, or other transactions, the expected operating performance of anticipated
near-term acquisitions and descriptions relating to these expectations, including without
limitation, the anticipated net operating income yield. We caution investors that any forward-looking statements presented in this
presentation are based on management’s beliefs and assumptions made by, and information currently
available to, management. When used, the words “anticipate,” “believe,”
“expect,” “intend,” “may,” “might,” “plan,” “estimate,” “project,” “should,” “will,” “result” and similar
expressions that do not relate solely to historical matters are intended to identify
forward-looking statements. You can also identify forward-looking statements by
discussions of strategy, plans or intentions. Forward-looking statements involve risks and uncertainties
(some of which are beyond the Company’s control) and are subject to change based upon various
factors, including but not limited to the following risks and uncertainties: changes in
the real estate industry and in performance of the financial markets; the demand for and market
acceptance of our properties for rental purposes; the amount and growth of our expenses; tenant financial difficulties and general
economic conditions, including interest rates, as well as economic conditions in those areas where we
own properties; risks associated with joint venture partners; the risks associated with the
ownership and development of real property; the failure to acquire or sell properties as and
when anticipated; termination or non-renewal of property management contracts; the bankruptcy or insolvency of
companies for which Parkway provides property management services or the sale of these properties; the
outcome of claims and litigation involving or affecting the Company; the ability to satisfy
conditions necessary to close pending transactions; our failure to maintain our status as real
estate investment trust, or REIT; and other risks and uncertainties detailed from time to time in the
Company’s SEC filings. Should one or more of these risks or uncertainties occur, or should
underlying assumptions prove incorrect, the Company’s business, financial condition,
liquidity, cash flows and results could differ materially from those expressed in any forward-
looking statement. While forward-looking statements reflect our good faith beliefs, they are not
guarantees of future performance. Any forward-looking statements speak only as of the date
on which it is made. New risks and uncertainties arise over time, and it is not possible for us
to predict the occurrence of those matters or the manner in which they may affect us. We disclaim any obligation to
publicly update or revise any forward-looking statement to reflect changes in underlying
assumptions or factors, of new information, data or methods, future events or other changes.
Accordingly, investors should use caution in relying on past forward-looking statements,
which were based on results and trends at the time they were made, to anticipate future results or
trends. |
 3
Additional Information
In connection with the proposed transaction, the Parkway Properties Inc. expects to file with the SEC
a registration statement on Form S-4 that will include a joint proxy statement of Parkway
and Thomas Properties that also constitutes a prospectus of Parkway, which joint proxy statement will
be mailed or otherwise disseminated to Parkway and Thomas Properties shareholders when it becomes
available. Parkway and Thomas Properties also plan to file other relevant documents with
the SEC regarding the proposed transaction. INVESTORS ARE URGED TO READ THE JOINT PROXY
STATEMENT/PROSPECTUS AND OTHER RELEVANT DOCUMENTS FILED WITH THE SEC IF AND WHEN THEY BECOME
AVAILABLE, BECAUSE THEY WILL CONTAIN IMPORTANT INFORMATION. You may obtain a free copy of the
joint proxy statement/prospectus (if and when it becomes available) and other relevant documents
filed by Parkway and Thomas Properties with the SEC at the SEC’s website at www.sec.gov. Copies of the documents filed by the companies will be available free of charge on their websites at
www.pky.com
and www.tpgre.com
or by contacting Investor Relations at the companies (for Parkway at (407) 650-0593 and for
Thomas Properties at (213) 613-1900). Parkway and Thomas
Properties and their respective directors and executive officers may be deemed to be participants in the solicitation of
proxies in respect of the proposed transaction. You can find information about Parkway’s
executive officers and directors in Parkway’s definitive proxy statement filed with the SEC
on April 4, 2013 in connection with its 2013 annual meeting of shareholders. You can find information about
Thomas Properties’ executive officers and directors in Thomas Properties’ definitive proxy
statement filed with the SEC on April 30, 2013 in connection with its 2013 annual meeting of
shareholders. Additional information regarding the interests of such potential participants will be
included in the joint proxy statement/prospectus and other relevant documents filed with the SEC if
and when they become available. You may obtain free copies of these documents from Parkway
or Thomas Properties using the sources indicated above.
This document shall not constitute an offer to sell or the solicitation of an offer to buy any
securities, nor shall there be any sale of securities in any jurisdiction in which such offer,
solicitation or sale would be unlawful prior to registration or qualification under the securities laws of any such
jurisdiction. No offering of securities shall be made except by means of a prospectus meeting
the requirements of Section 10 of the Securities Act of 1933, as amended. |
 4
Table of Contents
Situation / Transaction Overview
5
Asset & Market Overviews
19
Appendix
26
San Felipe Plaza
Houston, TX
Frost Tower
Houston, TX
One Congress Plaza
Austin, TX |
 Situation / Transaction Overview
Houston, TX
Galleria Submarket
Austin, TX
Downtown CBD |
 6
Strategic Plan Overview
Strategic Objective
Increase cash flow and unlock embedded value within
existing portfolio
Realize leasing and operational efficiencies and gain local
advantage
Create long-term value for shareholders as the leading
owner of high-quality assets in higher growth submarkets
in the Sunbelt
Maintain a conservative balance sheet with sufficient
flexibility for growth
Tactics
•
Efficiently exit non-core markets
•
Reinvest funds over time in quality assets in higher-growth
submarkets
•
Pursue primarily wholly owned investments and select joint ventures
when appropriate
•
Achieve critical mass in target submarkets
•
Maintain highly experienced local leadership
•
New asset level ownership plans given new investment strategy
•
Customized leasing strategies by submarket
•
More judicious prioritization of capital expenditures
•
Focus on high-quality, differentiated assets
•
Maintain between 5.5x to 6.5x net debt to EBITDA over long term
•
Focus on debt composition and maintain quality unencumbered pool
•
Use credit facility as short-term financing source
Since the new management team was put in place in the fourth quarter of 2011, Parkway
has executed on its strategic plan |
 7
Key Achievements
New
Management
Team / TPG
Sponsorship
Enhanced
Operational
Results
Fortified
Balance Sheet
and Cash Flow
•
New management team with proven value creation expertise and strong regional
management platform took over in December 2011
•
~$275 million total equity investment by TPG, a leading global private investment
firm, which holds a 34% ownership interest in the Company
pre-transaction and 25% post-transaction •
Substantial operational improvement throughout 2012 and through 2Q 2013
–
Occupancy increased over 475 basis points to 89.9%
–
Average in-place rents increased from $22.65 to $24.13 per square foot
–
FAD / FFO ratio significantly improved
–
Announced
over
1.0
million
SF
of
leasing
from
April
through
July
2013
•
Parkway has maintained a strong and conservative balance sheet as it has continued
to grow •
All
leverage
and
coverage
metrics
have
improved,
and
Parkway
has
raised
$839
million
of
capital
–
Raised $594 million in private and public equity in 2012 and 2013 YTD
–
Closed $125 million and $120 million unsecured term loans
•
Amended
its
credit
facility
to
extend
term,
increase
the
size
of
the
accordion
and
lower
fees
•
Reduced overall cost of capital by redeeming 8.0% preferred equity
•
Improved operating cash flow performance, which resulted in a 100% increase in
dividend Strategy &
Portfolio
Transformation
•
Portfolio repositioning substantially completed and acquisition pipeline remains
strong •
Exited majority of non-core assets and completed sale of Fund I
portfolio •
Purchased or under contract to purchase over $1.6 billion of high-quality
assets since January 2011 |
 8
Strategic Rationale for Transaction
High Quality
Portfolio
Increased Scale
and Market
Dominance
Limited
Integration Risk
•
Premier, Class A office properties with difficult to replicate locations and
amenities •
Located in target submarkets of desirable, high-growth markets
•
Core and core-plus properties with creditworthy and diverse tenant base
•
Significant upside potential through lease-up due to in-place portfolio
occupancy of 90% •
Increases PKY’s total portfolio square feet by approximately 39%
•
More than doubles the size and improves the quality of PKY’s Houston
portfolio •
Achieves PKY’s stated strategy of expanding into Austin
•
Critical mass gained in targeted, high-growth submarkets
•
Overlapping markets with strong regional leadership already in-place
•
Significant potential cost savings with minimal increase to PKY’s existing
G&A expense •
No changes to PKY’s current management team
PKY’
s Stated
Investment Strategy
Attractive
Asset Pricing
•
Early stages of recovery in the real estate cycle
•
Core and core-plus investments with room for occupancy and rental rate
growth •
Significant embedded rent growth via below-market rents
•
Pricing below replacement cost
•
Leverage remains conservative post transaction with sufficient flexibility for
growth •
Projected
Net
Debt
to
EBITDA
of
6.5x
and
Net
Debt
to
TEV
of
46.4%
post
transaction
•
Expect portfolio to naturally de-lever as EBITDA increases from announced
leasing •
Expect to continue to recycle certain PKY assets
1.
Based on PKY closing stock price of $16.37 as of September 4, 2013.
Pro Forma
Balance Sheet
Strategic Rationale is Consistent with and Exemplifies PKY’s
Stated Investment Strategy
Create Long-Term
Value as the
Leading Owner of
Quality Assets in
Higher Growth
Submarkets in the
Sunbelt
Achieve Critical
Mass in Target
Submarkets
Conservative
Balance Sheet with
Flexibility for
Growth
1 |
 9
Transaction Overview
Transaction
Summary
•
Parkway Properties, Inc. (“PKY”) to acquire Thomas Properties Group, Inc.
(NYSE:TPGI or “TPGI”)
•
100% stock merger
•
Fixed exchange ratio
–
0.3822 shares / units of PKY per TPGI common share / unit
•
Implied offer price of $6.26 per TPGI share
–
9.8% premium to TPGI closing price of $5.70 on September 4, 2013
Board of
Directors
•
PKY’s Board of Directors will be expanded from 9 to 10 members
•
James
A.
Thomas
will
be
named
Chairman
of
the
Board
of
Directors
of
PKY
Transaction
Value
•
$381 million aggregate offer value to TPGI shareholders
•
$1.235 billion implied transaction value
•
$1.034 billion implied transaction value (pro forma for planned asset sales in
conjunction with the closing of the transaction)
Ownership
•
~75% PKY shareholders
•
~25% TPGI shareholders
Shareholder
Vote / Closing
•
Transaction will require majority approval by both PKY and TPGI shareholders
•
Anticipated closing: December 2013 |
 10
Key Elements of the Transaction
TPGI / CalSTRS
Joint Venture
Liquidation
•
TPGI
/
CalSTRS
joint
venture
to
be
liquidated
in
advance
of
closing
of
transaction
1
–
City National Plaza (Los Angeles) distributed to CalSTRS
–
San Felipe Plaza and CityWestPlace (Houston Assets) distributed to TPGI
Bridge
Financing to
TPGI
•
PKY to provide up to $80 million bridge loan to TPGI
–
Used to fund portion of TPGI’s $163 million equity contribution in connection
with the TPGI / CalSTRS joint venture liquidation
Planned
Sales of TPGI
Assets
•
One
&
Two
Commerce
Square
(Philadelphia)
and
Four
Points
Centre
(Austin)
2
expected
to
be
sold to Brandywine Realty Trust (Brandywine) concurrently with the closing of the
transaction •
Three TPGI Northern Virginia properties under special servicer oversight expected
to be sold prior to or shortly after closing
1.
As announced on July 31, 2013. See slide 27 for more details related to the TPGI /
CalSTRS joint venture liquidation. 2.
Includes property and adjacent land parcel.
Key Steps
1. Bridge Financing
2. Joint Venture Liquidation
3. TPGI Acquisition
4. Asset Sales
•
PKY provides up to $80 mm
bridge loan to TPGI
•
Funded through PKY revolving
credit facility
•
TPGI funds equity contribution
for the liquidation of the TPGI /
CalSTRS JV
•
Houston Assets distributed to
TPGI
•
City National Plaza distributed
to CalSTRS
•
PKY acquires TPGI
•
Anticipated timing: Dec. 2013
•
At or near closing:
•
One & Two Commerce Square
sold to Brandywine
•
Four Points Centre
²
sold to
Brandywine
•
Northern VA properties sold or
liquidated |
 1.
Based on 100% ownership.
11
TPGI Operating Properties
Pre and Post Transaction
Denotes properties part of the TPGI / CalSTRS JV Liquidation
Existing TPGI Properties
Properties Acquired by PKY
Rentable
TPGI
Rentable
PKY
Sq. Ft.
Occupancy
Existing
Sq. Ft.
Occupancy
Pro Forma
Property
Location
(000's)
(1)
at 6/30/13
(1)
Ownership
Property
(000's)
(1)
at 6/30/13
(1)
Ownership
1.
CityWestPlace
Houston
1,473
99%
25%
1.
CityWestPlace
1,473
99%
100%
2.
San Felipe Plaza
Houston
980
87%
25%
2.
San Felipe Plaza
980
87%
100%
3.
Frost Bank Tower
Austin
535
95%
33%
3.
Frost Bank Tower
535
95%
33%
4.
One Congress Plaza
Austin
518
84%
33%
4.
One Congress Plaza
518
84%
33%
5.
One American Center
Austin
504
76%
33%
5.
One American Center
504
76%
33%
6.
300 West 6th Street
Austin
454
90%
33%
6.
300 West 6th Street
454
90%
33%
7.
San Jacinto Center
Austin
410
81%
33%
7.
San Jacinto Center
410
81%
33%
8.
One Commerce Square
Philadelphia
943
88%
75%
One Commerce Square
9.
Two Commerce Square
Philadelphia
953
87%
75%
Two Commerce Square
10.
Four Points Centre
Austin
192
99%
100%
Four Points Centre
11.
City National Plaza
Los Angeles
2,496
88%
8%
City National Plaza
Distributed to CalSTRS
12.
Fair Oaks Plaza
Northern VA
180
N/A
25%
Fair Oaks Plaza
13.
Reflections I
Northern VA
124
N/A
25%
Reflections I
14.
Reflections II
Northern VA
64
N/A
25%
Reflections II
Existing TPGI Properties
9,827
89%
Properties Acquired by PKY
4,875
90%
Expected to be sold in conjunction with closing
of transaction
Expected to be sold in the near term |
 12
Transaction Value / Economics
Transaction Value
Transaction Value
Before
Expected
After
Asset Sales
¹
Asset Sales
³
Asset Sales
PKY Stock Price (as of 9/4/13)
$16.37
$16.37
Exchange Ratio
0.3822x
0.3822x
Offer Price per TPGI Share
$6.26
$6.26
Premium to TPGI Closing Price (on 9/4/2013)
9.8%
9.8%
TPGI Shares Outstanding
60.9
60.9
Offer Value
$381
$381
Assumed TPGI Debt
$731
2
($201)
$530
Bridge Loan for Houston Assets
75
2
75
Less: Cash & Cash Equivalents
(28)
2
(95)
(123)
Net Debt
$777
$481
TPGI Total Enterprise Value (TEV) at Offer Price
$1,159
$863
Add-Back: Cash & Cash Equivalents
28
95
123
Estimated Transaction Costs
48
48
Transaction Value
$1,235
$1,034
Value of Operating Real Estate
$866
Estimated 2014E FFO per Share Accretion
$0.13 -
$0.18
Estimated Annual Recurring G&A Increase
~$1.5 -
2.0 million
Estimated 2014E Cash NOI Cap Rate
6.0%
Estimated 2014E GAAP NOI Cap Rate
8.1%
Note: $ in millions, except per share amounts.
1.
Pro forma for the three Northern Virginia properties under special servicer oversight that are expected
to be sold prior to or shortly after closing.
2.
Pro forma for TPGI’s planned liquidation of TPGI / CalSTRS joint venture, announced on July 31,
2013. 3.
Adjustments for the planned sale of One Commerce Square and Two Commerce Square (Philadelphia, PA) and
Four Points Centre (property and land parcel in Austin, TX) concurrent with the
transaction.
|
 Note: $ in millions, except per share amounts.
1.
Estimated TPGI debt outstanding at December 31, 2013, shown at TPGI’s pro rata
share of ownership. 2.
Expected net proceeds from the sale of One Commerce Square, Two Commerce Square and
Four Points Centre (property and land) in connection with the anticipated closing of this transaction.
3.
Bridge financing provided by PKY to TPGI to fund a portion of TPGI’s required
equity contribution in connection with the announced liquidation of the TPGI / CalSTRS joint venture.
13
Transaction Financing:
Sources & Uses
Sources
Uses
$ in millions
% of Total
$ in millions
% of Total
PKY Shares Issued to TPGI Shareholders
$381
37%
Stock Consideration to TPGI Shareholders
$381
37%
Assumed TPGI Debt
¹
530
51%
Assumed TPGI Debt
¹
530
51%
Net Proceeds from Planned Asset Sales
²
95
9%
Bridge Loan
³
75
7%
TPGI Cash & Cash Equivalents
28
3%
Estimated Transaction Costs
48
5%
Total Sources
$1,034
100%
Total Uses
$1,034
100% |
 14
Pro Forma PKY Capitalization
Bridge Loan to TPGI
$75.0
Estimated Transaction Costs
48.3
Total Potential Line of Credit Draw
$123.3
Less: Net Proceeds from Asset Sales
(95.1)
Less: TPGI Cash & Equivalents
(28.2)
Net Line of Credit Draw
$0.0
PKY Capitalization
$ in millions, except per share amounts
TPGI Acquisition
PKY
Incremental
Post TPGI
Asset
New
PKY
Acquisition
Financing
Acquisition
Sales
PKY
PKY Stock Price (as of 9/4/13)
$16.37
$16.37
$16.37
$16.37
Shares Outstanding
69.7
23.3
93.0
93.0
Equity Market Capitalization
$1,140.5
$381.3
$1,521.8
$1,521.8
Debt
Secured Debt -
Wholly Owned
$452.6
$344.3
$797.0
($200.8)
$596.1
Secured Debt -
Consolidated Joint Venture
88.1
177.6
265.7
265.7
Unsecured Term Loans
245.0
245.0
245.0
Revolving Credit Facility
17.5
95.1
112.6
(95.1)
17.5
Draw to Fund Bridge Loan to TPGI
75.0
(75.0)
0.0
0.0
Share of Unconsolidated Joint Venture Debt
0.0
208.7
208.7
208.7
Total Debt
$803.3
$805.5
$20.1
$1,628.9
$1,333.0
-
Cash & Cash Equivalents
(16.2)
(28.2)
28.2
(16.2)
(16.2)
Net Debt
$787.0
$1,612.7
$1,316.7
TEV
$1,927.5
$3,134.5
$2,838.5
Net Debt / TEV
40.8%
51.4%
46.4%
Net Debt / EBITDA
6.1x
7.1x
6.5x
1
3
4
2
Pro forma for acquisition / disposition activity announced after June 30, 2013.
PKY debt is shown at share and as of June 30, 2013. TPGI debt is based on estimated debt balance at
December 31, 2013.
Bridge financing funded through PKY’s revolving credit facility to partially fund TPGI’s
equity contribution in connection with TPGI / CalSTRS joint venture liquidation.
Adjustments for the planned sale of Commerce Square (Philadelphia, PA) and Four Points
Centre (property and land parcel in Austin, TX) concurrent with the transaction. 1.
2.
3.
4. |
 $255
$33
$110
$69
$291
$18
$125
$120
$236
$31
$27
$3
$15
$255
$412
$261
$96
$294
$100
$200
$300
$400
$500
2013
2014
2015
2016
2017
2018
2019
Thereafter
$33
$69
$198
$18
$125
$120
$28
$31
$27
$3
$15
$137
$203
$151
$96
$201
$100
$200
$300
$400
$500
2013
2014
2015
2016
2017
2018
2019
Thereafter
15
Debt Maturity Schedule
PKY (As of 6/30/13)
PRO FORMA PKY
Note: $ in millions.
1.
Pro forma for announced sales of Waterstone, Meridian, and Bank of America Plaza and
for the pending acquisition of Lincoln Place. 2.
Includes
100%
of
debt
on
San
Felipe
Plaza
and
CityWestPlace
(Houston,
TX
assets)
and
debt
related
to
TPGI
/
CalSTRS
Austin
joint
venture
assets.
Secured (Wholly Owned)
Revolving Credit Facility
Secured (JV)
Term Loan
Total Debt (At Share):
$803mm
Total Debt (At Share):
$1,333mm
1
2 |
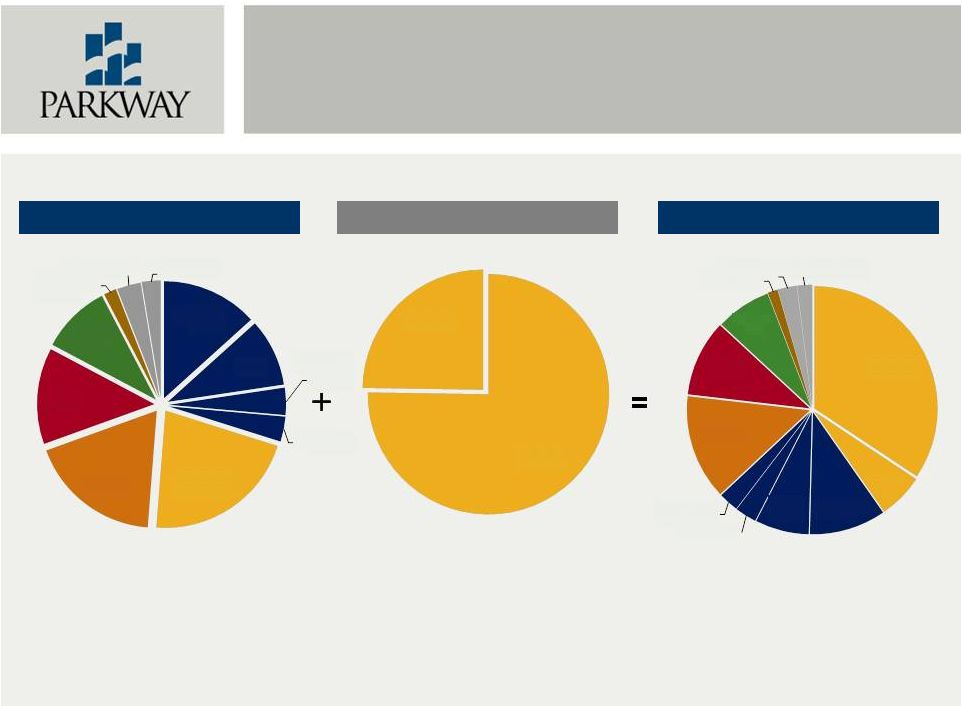 16
Increased Exposure to Desirable
Markets and CBD / Infill Locations
PKY
1
PRO FORMA PKY
TPGI
2
Jacksonville
13%
Tampa
9%
Orlando
4%
South Florida
4%
Houston
21%
Charlotte
18%
Atlanta
13%
Phoenix
10%
Philadelphia
2%
Memphis
3%
Jackson
3%
Houston
75%
Austin
25%
Houston
34%
Austin
6%
Jacksonville
10%
Tampa
7%
Orlando
3%
South Florida
3%
Charlotte
14%
Atlanta
10%
Phoenix
7%
Philadelphia
1%
Memphis
2%
Jackson
2%
Note: Based on sq. ft. (at pro rata share of PKY, TPGI and the combined company).
1.
Pro forma for announced sale of three properties for $53 million (Waterstone, Meridian, and Bank of
America Plaza) and for pending acquisition of Lincoln Place for $66 million.
2.
Only reflects properties to be retained by combined company. |
 17
Broader and More Diversified
Tenant Base
=
Note: Shaded rows represent new PKY tenants.
1.
Excludes One Commerce Square and Two Commerce Square (Philadelphia), Four Points
Centre (Austin), and City National Plaza (Los Angeles) per TPGI / CalSTRS liquidation and
transaction with Brandywine.
2.
Based on pro rata share of PKY, TPGI and the combined company square feet.
PKY
TPGI
(1)
PRO FORMA PKY
% of Total
% of Total
% of Total
Tenant
Sq. Ft.
(2)
Tenant
Sq. Ft.
(2)
Tenant
Sq. Ft.
(2)
1.
Bank of America
6.8%
1.
BMC Software
23.4%
1.
Bank of America
5.5%
2.
Raymond James & Associates
2.7%
2.
Halliburton
18.2%
2.
BMC Software
4.7%
3.
Nabors Industries
2.3%
3.
ENSCO
8.5%
3.
Halliburton
3.7%
4.
US Airways
2.3%
4.
Statoil
6.2%
4.
Raymond James & Associates
2.8%
5.
Blue Cross Blue Shield
2.1%
5.
Ion Geophysical
4.7%
5.
Nabors Industries
1.9%
6.
JPMorgan Chase Bank
2.0%
6.
Houston Series of Lockton Cos
3.4%
6.
US Airways
1.9%
7.
Hearst Communications
1.9%
7.
Aker Solutions
3.1%
7.
ENSCO
1.7%
8.
K & L Gates
1.6%
8.
Raymond James & Associates
3.1%
8.
Blue Cross Blue Shield
1.7%
9.
Schlumberger
1.6%
9.
Petrobras
2.5%
9.
JPMorgan Chase Bank
1.6%
10.
NASCAR Media Group
1.5%
10.
Alliant Insurance Services
1.8%
10.
Hearst Communications
1.5%
11.
Chiquita Brands
1.4%
11.
The Hanover Company
1.7%
11.
K & L Gates
1.3%
12.
Honeywell
1.4%
12.
Pannell Kerr Forster of Texas, P.C.
1.6%
12.
Schlumberger
1.3%
13.
Forman Perry Watkins
1.3%
13.
Wood Mackenzie, Inc.
1.4%
13.
Statoil
1.2%
14.
General Services Administration
1.3%
14.
Hoover Slovacek, L.L.P.
1.3%
14.
NASCAR Media Group
1.2%
15.
Southwestern Energy
1.2%
15.
Brown McCarroll
1.2%
15.
Chiquita Brands
1.1%
PKY Top 15 Tenants
31.6%
TPGI Top 15 Tenants
(1)
82.2%
Pro Forma Top 15 Tenants
33.0% |
 18
Potential Value Creation
Houston
Austin
TPGI Acquisition
Total Square Footage (At 100% / At Share)
4.9 million
/
3.3 million
Implied Value of Operating Real Estate
$866 million
Price per Square Foot
$266
Occupancy
1
90%
Estimated 2014E Cash NOI Cap Rate
6.0%
Estimated 2014E GAAP NOI Cap Rate
8.1%
Note: Amounts shown are based on PKY’s pro forma pro rata share unless otherwise noted.
1.
Based on 100% ownership and as of 6/30/13. 2.
Based on triple net rates for available spaces in the respective properties as of 9/2/2013, per CoStar
Group.
San Felipe Plaza
CityWestPlace
Square Footage (At 100% / At Share)
1.0 million / 1.0 million
1.5 million / 1.5 million
Price per Square Foot
$246
$250
Occupancy¹
87%
99%
In-Place Rents per Square Foot
$20.94 PSF
$20.20 PSF
Blended Market / Asking Rates
²
$25.00 PSF
$29.00 PSF
Above / (Below) Market
(16%)
(30%)
Total Portfolio
Square Footage (At 100% / At Share)
2.4 million / 0.8 million
Price per Square Foot
$313
Occupancy¹
85%
In-Place Rents
$22.14 PSF
Blended Market / Asking Rates
²
$28.58 PSF
Above / (Below) Market
(23%) |
 19
Acquired Other Assets
Other Acquired Asset
Remaining Condominiums at Murano
•
41 of 302 units remain unsold as of June 30, 2013
•
Value estimated at net book value as of June 30, 2013
Entitled Land Parcel at CityWestPlace
•
9.9 acres with 500,000 square feet of entitlements
•
Value estimated at approximately $25 per buildable foot
Cash and Cash Equivalents on TPGI’s Balance Sheet
Continuing Fee Income on TPGI / Austin Joint Venture
•
Fee income estimated to be between $1.8 and $2.3 million annually
•
Value estimated at present value of fee income
Estimated Value ($ in millions))
31.6
12.5
$28.2
7.2
In addition to the Operating Real Estate assets of TPGI, PKY will acquire a number of
other tangible assets of TPGI
TOTAL ESTIMATED VALUE OF NET OTHER ASSETS ACQUIRED
$79.5
1. Estimated pro forma cash balance at closing.
2. Present value based on 5-year fee income projection as of 1/1/14 at a
10% discount rate. 2
1 |
 Asset & Market Overviews |
 21
High-Quality Office Properties in
Desirable Markets
TPGI Assets To Be Acquired by PKY
Frost Bank Tower
Austin, TX
One Congress Plaza
Austin, TX
San Jacinto Center
Austin, TX
300
West
6
Street
Austin, TX
One American Center
Austin, TX
San Felipe Plaza
Houston, TX
CityWestPlace
Houston, TX
th |
 22
Houston Market
Houston Office Statistics
•
First major metro area in the U.S. to regain all jobs lost
during the recession (290,000 since Dec. 2009)
•
Overall Class A office vacancy of 6.9%
•
YTD net absorption in excess of 1.6 million SF
•
Galleria submarket Class A vacancy of 7.3%
•
Significant rental rate momentum. Class A
rate growth year-over-year exceeds 12%
•
Westchase submarket Class A vacancy of 2.5%
•
Vacancy compression of 760 bps since 1Q12
•
CityWestPlace represents ~25% of the Class A
office inventory in the submarket
•
PKY is a significant owner / operator of Class A office
space in its targeted submarkets in Houston
Galleria –
Class A
Westchase –
Class A
Sources: BLS.gov and CBRE.
CBRE Galleria submarket data is for combined Galleria/West Loop submarket.
All data as of 2Q13 unless otherwise noted. |
 23
Houston Portfolio
San Felipe Plaza
CityWestPlace
•
Four building, Class A corporate campus located in the
Westchase submarket of Houston
•
Numerous attractive amenities including three cafes, two
fitness centers and basketball courts on campus
•
The campus was constructed for BMC Software in 1998
•
Assets currently operate as a unique multi-tenant corporate
campus environment
•
46-story, Class A office tower located in the
Galleria submarket of Houston
•
Second tallest building outside of the CBD
•
LEED EB Gold certified
•
Well located with surrounding high-end
residential and Galleria amenities
San Felipe Plaza
San Felipe Plaza
San Felipe Plaza
CityWestPlace 1
305,828 SF
CityWestPlace 2
443,551 SF
CityWestPlace 3
205,348 SF
CityWestPlace 4
518,293 SF |
 24
Houston Portfolio (cont’d)
San Felipe Plaza
CityWestPlace
Market
Houston
Houston
Submarket
Galleria
Westchase
RSF
980,472
1,473,020
Year Built (Renovated)
1984 (1996)
1998-2001
Occupancy (6/30/2013)
86.5%
99.0%
Pro Forma Ownership
100.0%
100.0%
Investment Highlights
•
Premier, Class A office properties with distinctive
designs and features
•
Located in desirable, high-growth Galleria and
Westchase submarkets
•
Value-add potential:
•
Lease-up of San Felipe Plaza vacant space
•
Embedded growth opportunity with in-place
rents lower than market rents at both
properties
•
Leased to a diverse array of high-quality tenants
•
Immediately upgrades the quality of PKY’s
Houston portfolio
•
Houston office demand continues to grow at a
rapid pace, absorbing over 1.5mm SF YTD
•
Assets will be wholly-owned by PKY at closing
San Felipe Plaza
CityWestPlace |
 25
Austin Market
Source: CBRE and Rosen Consulting Group.
Austin Office Statistics
•
Austin MSA has been one of the fastest growing
regions in the United States
•
Job growth of 3.9% year-over-year
•
Population expected to reach 2.1mm by 2017
•
Overall Austin had strong rental rate growth over the
past year due to limited new supply and increasing
demand
•
YTD net absorption of 464,000 SF
•
CBD average Class A rental rates have grown
9% year-over-year
•
Downtown office demand driven by growing
technology hub, expanding government sector and
increased residential expansion
CBD –
Class A
Frost Bank
Tower
San Jacinto
Tower
One American
Center |
 26
Austin Portfolio
Frost Bank
Tower
300 West 6th Street
San Jacinto
Center
One Congress
Plaza
One American
Center
Submarket
CBD
CBD
CBD
CBD
CBD
RSF
535,078
454,225
410,248
518,385
503,951
Year Built (Renovated)
2003
2001
1987
1987
1984 (1992)
Occupancy (6/30/2013)
94.8%
89.9%
81.2%
83.5%
75.9%
Pro Forma Ownership
33.3%
33.3%
33.3%
33.3%
33.3%
Investment Highlights
•
Five Class A, Trophy assets comprising 2.4mm RSF
•
Represents ~40% of Class A office inventory
in CBD
•
Centrally located in thriving downtown Austin CBD
•
Positive embedded growth opportunities with in-
place rents lower than market rents
•
All five assets are LEED EB Gold certified
•
Portfolio overall occupancy of 85% provides
significant upside potential through lease-up
•
Anchored by a diverse, stable tenant base including
legal, financial services, insurance firms and
technology companies such as Facebook
•
Achieves PKY’s stated strategy of expanding into
Austin market with portfolio of high-quality assets
1.
Owned as part of the TPGI / CalSTRS Austin joint venture.
2.
Source: CBRE.
2
1 |
 Appendix |
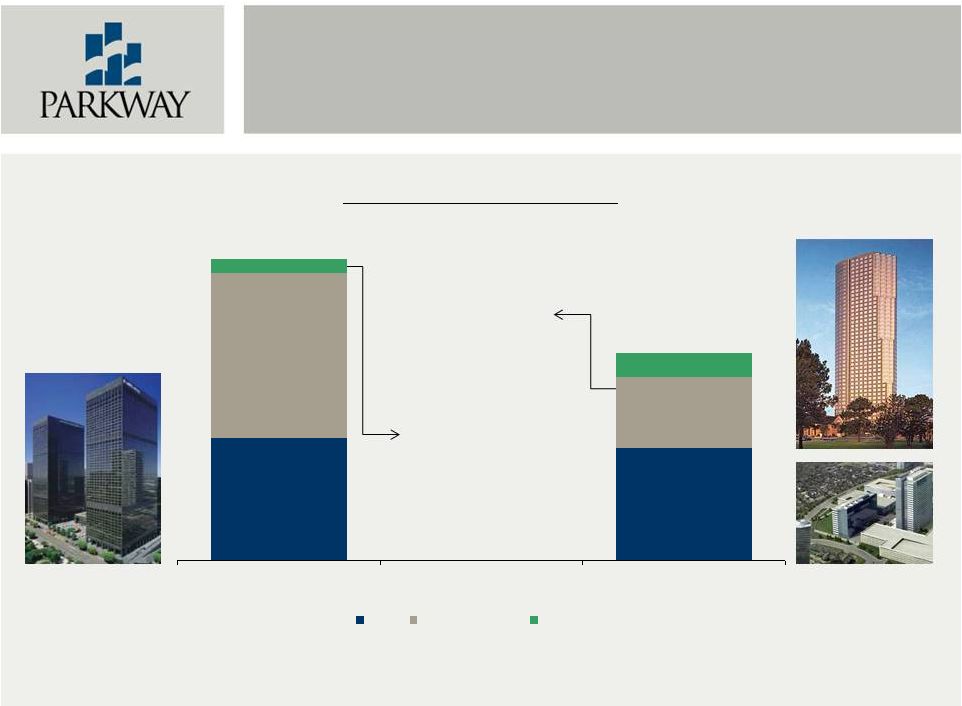 28
TPGI / CalSTRS
Joint Venture Liquidation
Purchase of CalSTRS Equity
in San Felipe Plaza and CityWestPlace:
~$205 million
Less:
TPGI’s
Equity in City National Plaza:
~$41 million
Less: Trans. Fees of ~$1mm
Equals
~$163 million
TPGI Net Equity Contribution
$351mm
$323mm
$474mm
$205mm
$41mm
$68mm
$865mm
$596mm
City National Plaza (Los Angeles)
San Felipe Plaza and
CityWestPlace (Houston)
Debt
CalSTRS Equity
TPGI Equity |
 29
Austin CBD Map
300 West 6 St
One American Center
Frost Bank Tower
One Congress Plaza
San Jacinto Center
th |
 30
Houston Map
Galleria
Westchase
CityWest Place
San Felipe Plaza |
 Parkway Properties, Inc.
390 North Orange Avenue
Suite 2400
Orlando, FL 32801
(407) 650-0593
www.pky.com |