Attached files
| file | filename |
|---|---|
| 8-K - FORM 8-K - NTELOS HOLDINGS CORP. | d596657d8k.htm |
 NASDAQ: NTLS
Investor Presentation
September 2013
Exhibit 99.1 |
 Presentation of Financial and Other Important Information
2
NASDAQ: NTLS
USE OF NON-GAAP FINANCIAL MEASURES
Included in this presentation are certain non-GAAP financial measures that are not determined in
accordance with US generally accepted accounting principles (“GAAP”). These financial
performance measures are not indicative of cash provided or used by operating activities and exclude the effects of certain operating,
capital and financing costs and may differ from comparable information provided by other companies,
and they should not be considered in isolation, as an alternative to, or more meaningful than
measures of financial performance determined in accordance with US generally accepted accounting principles. These
financial performance measures are commonly used in the industry and are presented because NTELOS
believes they provide relevant and useful information to investors. NTELOS utilizes these
financial performance measures to assess its ability to meet future capital expenditure and working capital requirements, to
incur indebtedness if necessary, and to fund continued growth. NTELOS also uses these financial
performance measures to evaluate the performance of its business, for budget planning purposes
and as factors in its employee compensation programs. Adjusted EBITDA is defined as net income attributable to
NTELOS Holdings Corp. before interest, income taxes, depreciation and amortization, accretion of asset
retirement obligations, gain/loss on derivatives, net income attributable to
non-controlling interests, other expenses/income, equity based compensation charges, acquisition related charges, gain/loss on sale of
assets and net loss from discontinued operations and costs related to the separation of the wireless
and wireline companies. Please review the reconciliations and other definitions of non-GAAP
financial measures contained in the press releases filed by the Company with the SEC, including those filed on Form 8-K on
August 1, 2012, November 8, 2012, February 28, 2013, May 7, 2013 and July 30, 2013.
SPECIAL NOTE REGARDING FORWARD-LOOKING STATEMENTS
Any statements contained in this presentation that are not statements of historical fact, including
statements about our beliefs and expectations, are forward- looking statements and should be
evaluated as such. The words “anticipates,” “believes,” “expects,” “intends,” “plans,” “estimates,” “targets,” “projects,” “should
“may,” “will” and similar words and expressions are intended to identify
forward-looking statements. Such forward-looking statements reflect, among other
things, our current expectations, plans and strategies, and anticipated financial results, all of
which are subject to known and unknown risks, uncertainties and factors that may cause our
actual results to differ materially from those expressed or implied by these forward-looking statements. Many of these risks are
beyond our ability to control or predict. Because of these risks, uncertainties and assumptions, you
should not place undue reliance on these forward-looking statements. Furthermore,
forward-looking statements speak only as of the date they are made. We do not undertake any obligation to update or review any
forward-looking information, whether as a result of new information, future events or
otherwise. Important factors with respect to any such forward-looking statements,
including certain risks and uncertainties that could cause actual results to differ from those contained in the forward-looking statements, include,
but are not limited to: our ability to attract and retain retail subscribers to our services;
our dependence on our strategic relationship and the potential outcome of any disputes with
Sprint Nextel (“Sprint”); a potential increase in roaming rates and wireless handset subsidy costs; rapid development and intense
competition in the telecommunications industry; our ability to finance, design, construct and realize
the benefits of any planned network technology upgrade; our ability to acquire or gain access
to additional spectrum; the potential to experience a high rate of customer turnover; the potential for Sprint and others to
build networks in our markets; cash and capital requirements; operating and financial restrictions
imposed by our senior credit facility; adverse economic conditions; federal and state
regulatory fees, requirements and developments; loss of ability to use our current cell sites; our continued reliance on indirect
channels of retail distribution; our reliance on certain suppliers and vendors; and other unforeseen
difficulties that may occur. These risks and uncertainties are not intended to represent a
complete list of all risks and uncertainties inherent in our business, and should be read in conjunction with the more detailed
cautionary statements and risk factors included in our SEC filings, including our most recent Annual
Report filed on Form 10-K. |
 Company Overview
3
Leading “pure-play”
wireless carrier in mid-Atlantic region
Headquartered in Waynesboro, VA
Exclusive CDMA Network provider for Sprint in WV and Western VA
NTELOS-branded retail postpay and prepay subscribers; robust wholesale
business NASDAQ: NTLS
NASDAQ:
NTLS
–
Market
Capitalization
approximately
$348
million¹
7.9 million licensed POPs; covered POPs of 6.0 million; 454,800 subscribers
¹
As of market close 9/9/13 |
 Investment Considerations
Leading “pure-play”
regional wireless company
4
Strategic asset set
Strong free cash flow
Broad geographic and network technology footprint
Experienced management team
NASDAQ: NTLS
Competitive and diversified business model |
 Key
Operating Strategies 5
Elevate brand & best value in wireless position to improve quality of
subscriber base and grow market share
Enhance customer experience at all touch points by focusing on core differentiators
of Savings, Simplicity and Service to improve customer satisfaction and
reduce subscriber
churn
Leverage disciplined network investments to expand revenues and margins
Drive Smartphone and data services penetration to increase ARPU
NASDAQ: NTLS
Manage cost structure to improve profitability |
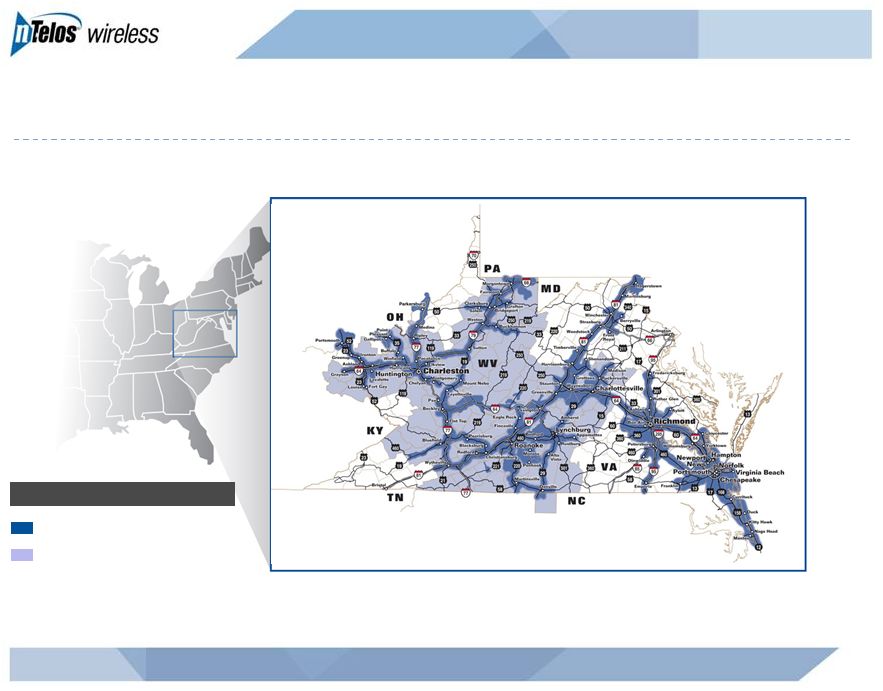 Regional Wireless Service Provider
NASDAQ: NTLS
6
Ntelos Covered Network
Sprint Wholesale Markets
STRATEGIC NETWORK ASSETS |
 Carriers Without Network Assets in NTELOS’s Footprint
7
NASDAQ: NTLS
West Virginia / Virginia West
Leap³
Sprint¹
T-Mobile
US Cellular²
Virginia East
Leap³
US Cellular
¹Sprint’s retail business runs on NTELOS’s Network in West Virginia
and portions of Virginia ²US Cellular has network assets and retail
business within a portion of NTELOS’s footprint ³Pending
acquisition by AT&T |
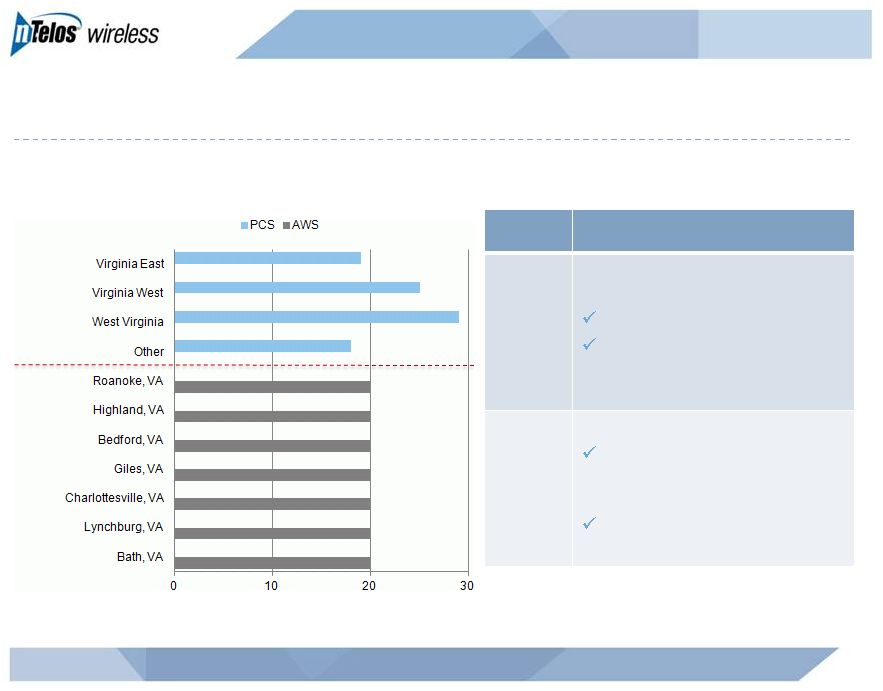 Attractive Spectrum Portfolio
8
NASDAQ: NTLS
Average Spectrum Depth in Key Markets
Source:
Map
Info:
Custom
Data,
Total
Population
–
Current
Year
and
Five
Year
USA
by
Block
Group:
United
States,
SO215245
Band
Commentary
PCS
Average depth of 23 MHz
Scarce strategic asset
AWS
Significant spectrum
holdings in contiguous
markets in western Virginia
Currently undeployed
MHZ
3,673
2,710
1,767
1,016
Licensed POPs
(000’s)
302
200
209
216
205
278
66 |
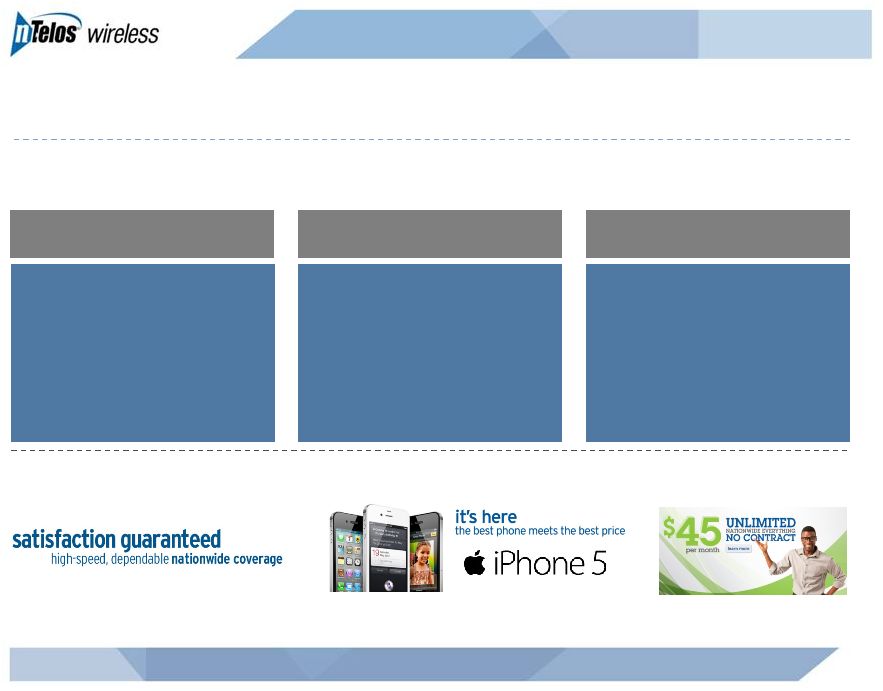 Competitively Differentiated Retail Model
SAVINGS
SIMPLICITY
SERVICE
Driving consideration for
“the best value in
wireless”
proposition
Making it “easy”
to switch
Creating “raving fans”
through superior
customer service
9
NASDAQ: NTLS
Note: Historical examples of campaigns; not to be considered current offers.
|
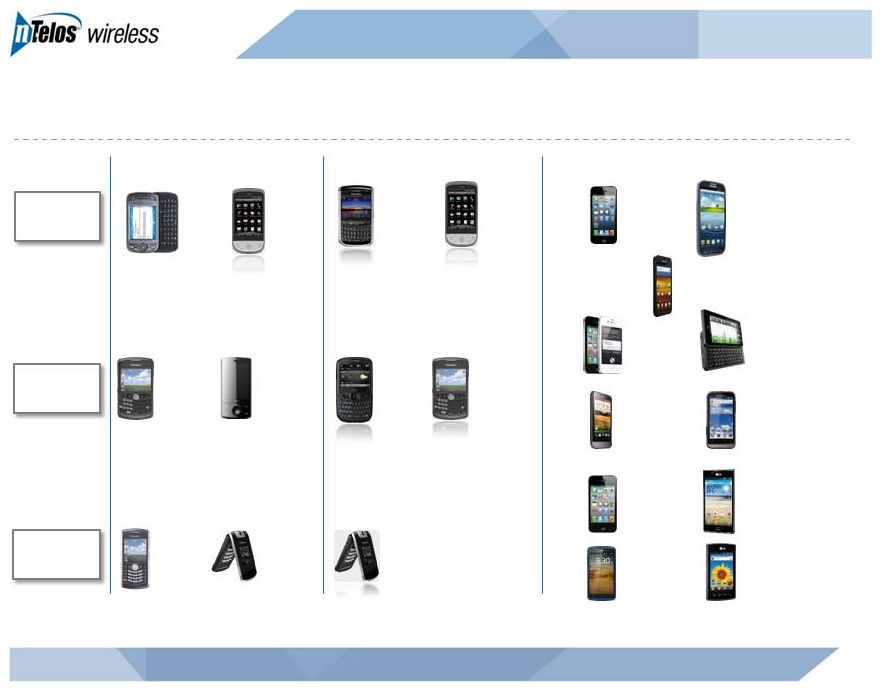 Closing the Device Gap on Competition
10
NASDAQ: NTLS
Q4 2009
Q4 2010
3Q 2013
LG Optimus
Plus
Motorola
Defy XT
Alcatel One
Touch Ultra
Motorola
Milestone 3
HTC One V
Samsung Galaxy S II
Samsung
Galaxy III
LG Optimus
Select
iPhone 4
iPhone 4S
iPhone 5
BlackBerry
Curve 8330
BlackBerry
Pearl Flip
8230
HTC Hero
Android
BlackBerry
Pearl
8130
HTC 6800
HTC Touch
Diamond
BlackBerry
Curve 8330
BlackBerry
Pearl Flip
8230
HTC Snap
HTC Hero
Android
BlackBerry
Tour 9630
Best
Better
Good |
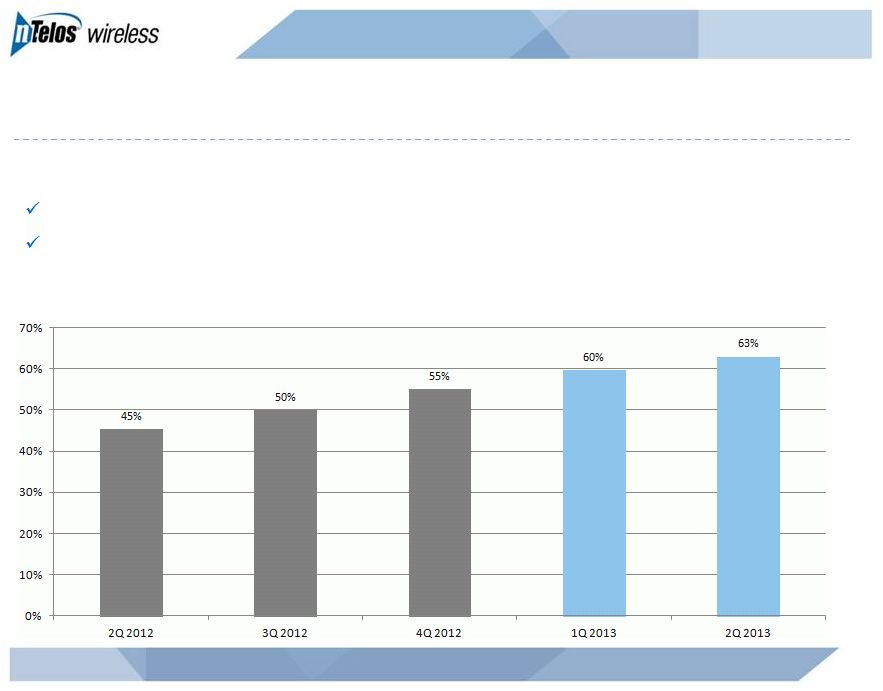 Smartphone Penetration
11
NASDAQ: NTLS
As of June 30, 2013:
66% of postpaid subscribers have a smartphone
56% of prepaid subscribers have a smartphone |
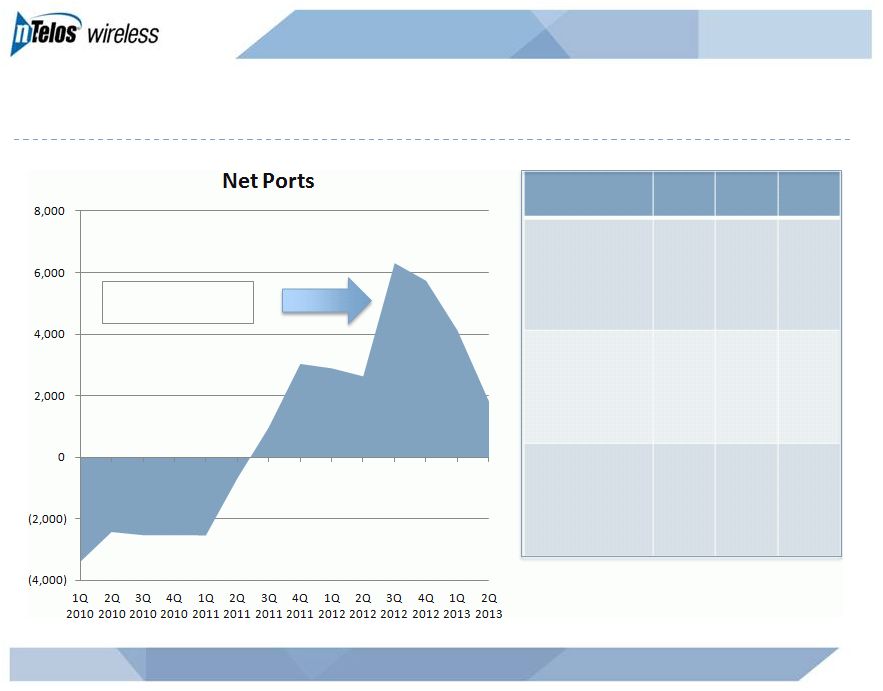 NTELOS Branding Resonating With Consumers
12
NASDAQ: NTLS
2Q11
2Q12
2Q13
Unaided
Awareness
22%
28%
26%
Unaided
Recall
18%
25%
26%
Purchase
Consideration
11%
14%
11%
Source: Independent third-party research studies.
Positive net ports
vs. all other carriers |
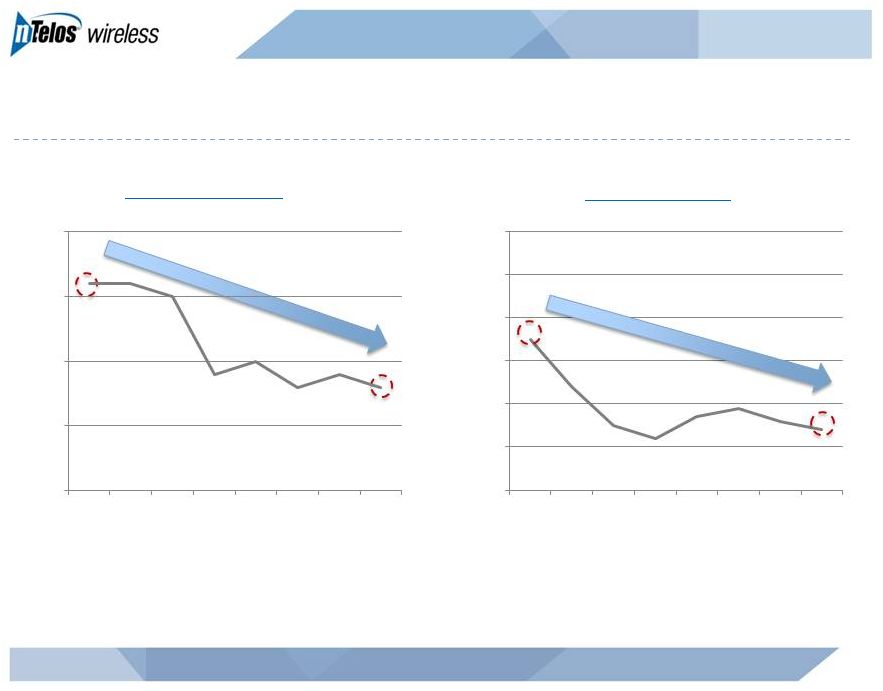 Managing Churn to Enhance Profitability
13
NASDAQ: NTLS
Prepaid Churn
Postpaid Churn
1.0%
1.5%
2.0%
2.5%
3.0%
3Q
2011
4Q
2011
1Q
2012
2Q
2012
3Q
2012
4Q
2012
1Q
2013
2Q
2013
3.0%
4.0%
5.0%
6.0%
7.0%
8.0%
9.0%
3Q
2011
4Q
2011
1Q
2012
2Q
2012
3Q
2012
4Q
2012
1Q
2013
2Q
2013 |
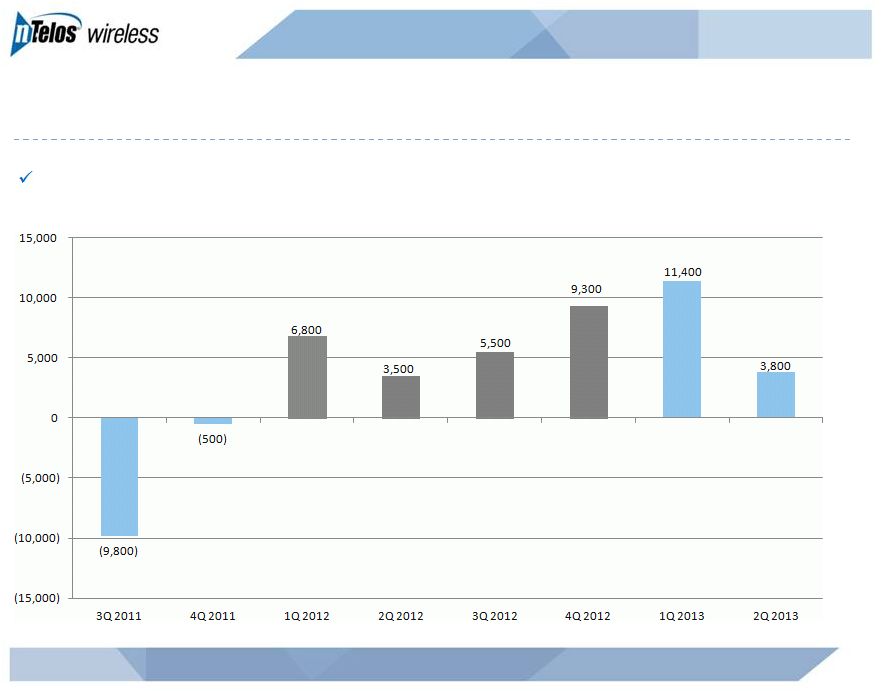 Subscribers
–
Net
Additions
Trend
14
NASDAQ: NTLS
Sixth consecutive quarter of positive net adds |
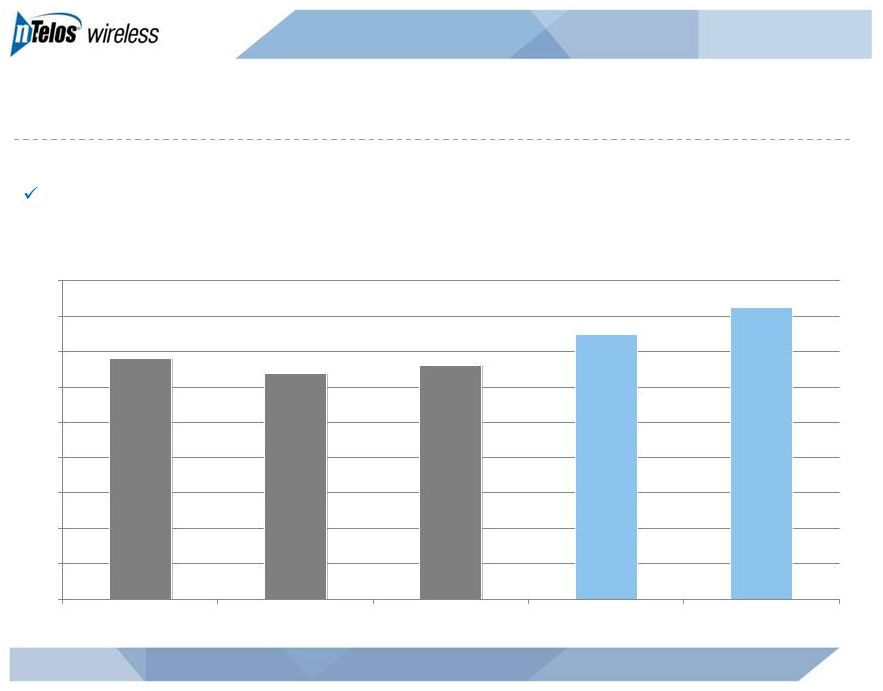
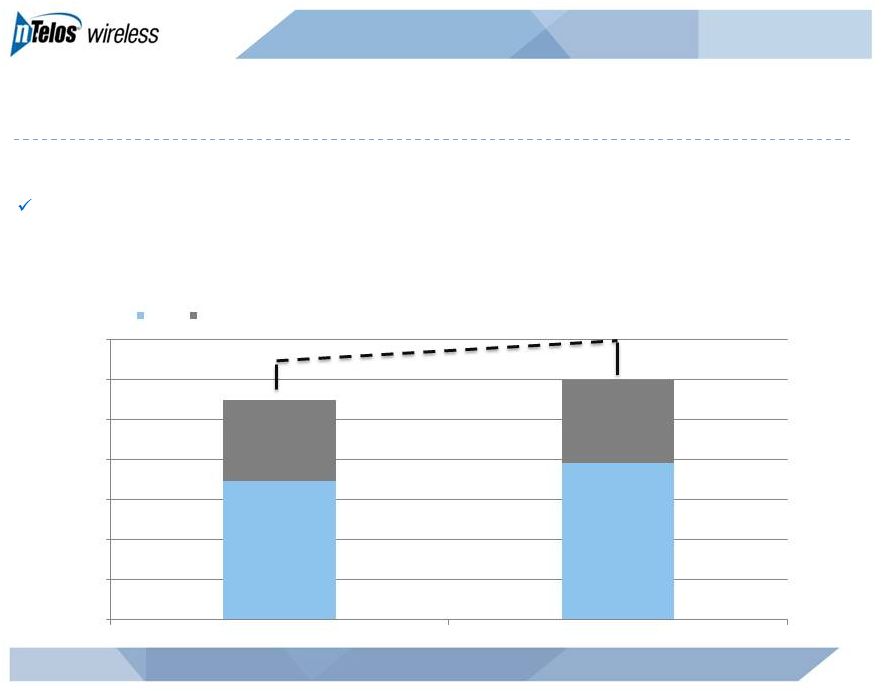 Continuing Growth in Operating Revenues
15
NASDAQ: NTLS
millions
+7%
2Q13 revenue increased 7% from 2Q12 to $119.9 million
$0.0
$20.0
$40.0
$60.0
$80.0
$100.0
$120.0
$140.0
2Q 2012
2Q 2013
Retail
Wholesale & Other |
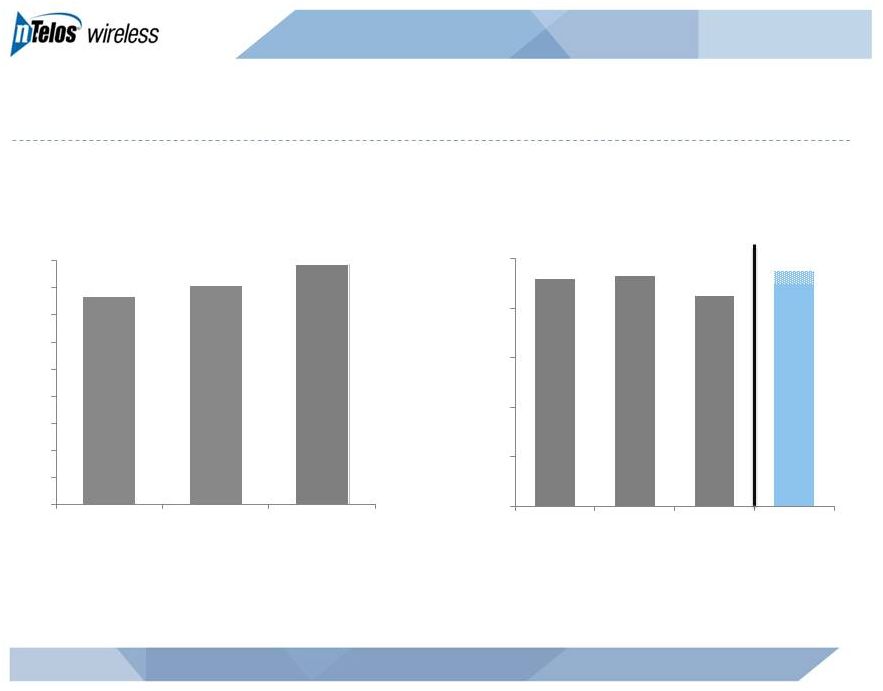
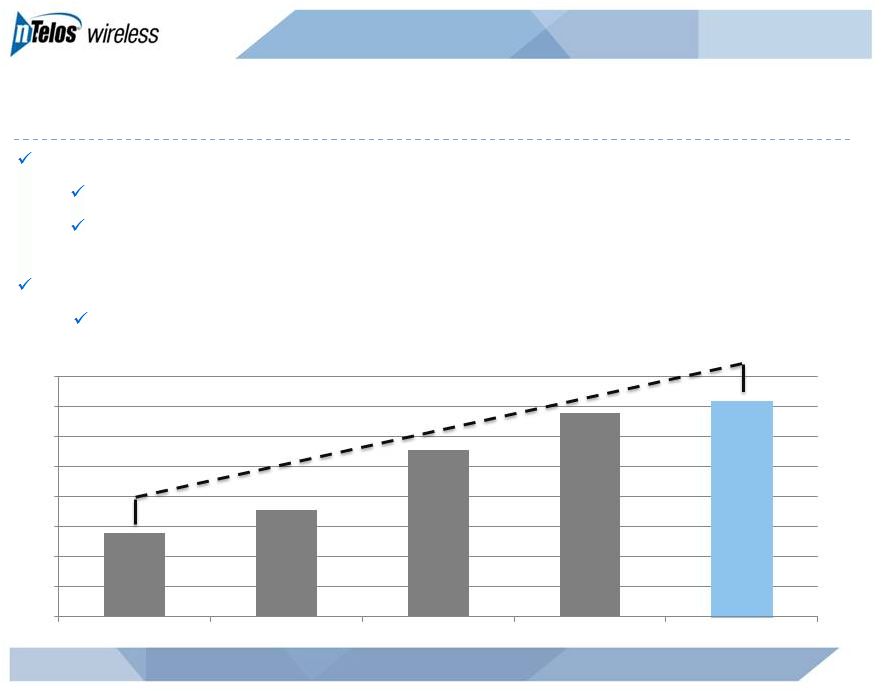 Retail Revenue Gains Continue
16
NASDAQ: NTLS
millions
Subscriber revenue growth driven by both:
ARPU growth
Subscriber growth
2Q13 retail revenue increased 1% sequentially and 13% from 2Q12 to $78.4
million Highest level in four years
+13%
$64.0
$66.0
$68.0
$70.0
$72.0
$74.0
$76.0
$78.0
$80.0
2Q 2012
3Q 2012
4Q 2012
1Q 2013
2Q 2013 |
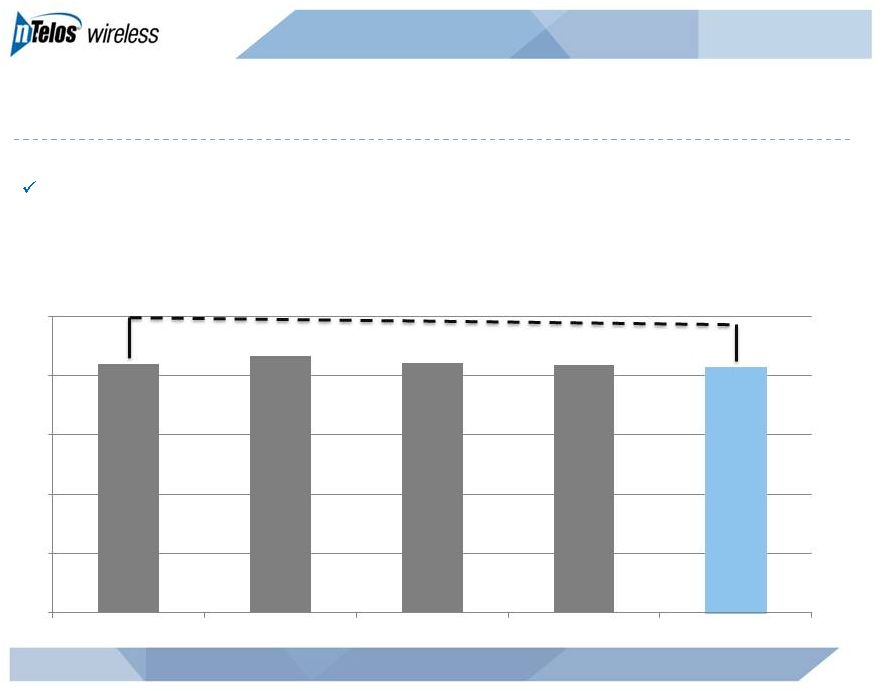 Wholesale/Other Revenue Remains Strong
17
NASDAQ: NTLS
millions
-1%
2Q13 wholesale/other revenue decreased 1% from 2Q12 to $41.4 million
$0.0
$10.0
$20.0
$30.0
$40.0
$50.0
2Q 2012
3Q 2012
4Q 2012
1Q 2013
2Q 2013 |
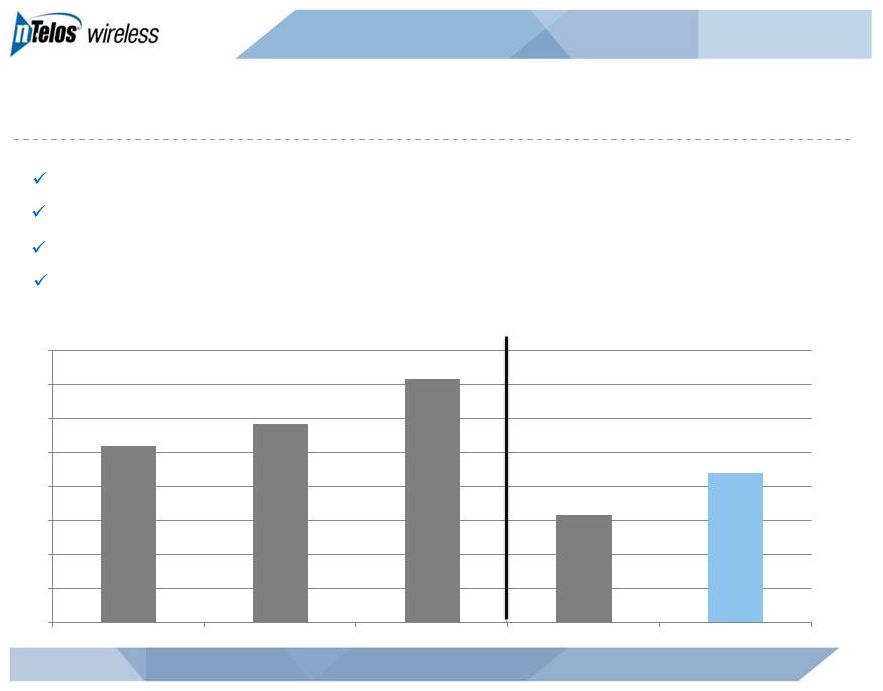 Capital Investments Driving Operational Improvements
18
NASDAQ: NTLS
Expand wholesale coverage
Control roaming costs
Mitigate churn risk
1,432 3G EV-DO cell sites as of June 30, 2013
millions
$52
$58
$72
$32
$44
$0
$10
$20
$30
$40
$50
$60
$70
$80
FY 2010
FY 2011
FY 2012
1H 2012
1H 2013 |
 Network Evolution
NASDAQ: NTLS
19
•
6.0mm covered POPs; 7.9 mm licensed
POPs
•
100% of covered POPs are served with 3G
EV-DO Rev. A
•
Primarily Alcatel Lucent equipment
•
1,432 cell sites deployed
•
Market level spectrum holdings ranging from
10 MHz to 50 MHz
•
PCS average depth of 23 MHz
•
AWS average depth of 20 MHz
•
Additional spectrum includes
•
Small amount of BRS
•
Opportunities for additional spectrum
and spectrum sharing being evaluated
•
Upgrade history
•
1xRTT launched in 2002
•
EV-DO Rev A launched in 2008
•
LTE Drivers
•
Serve the needs of our retail
subscribers
•
Maintain competitive position in
marketplace
•
Optimize long-term network
operating cost with new technology
•
Serve the needs of our largest
wholesale customer, Sprint
•
Deployment Plan
•
Launch first LTE markets in 2H 2013
•
Complete initial build-out by year-end
2014; 70% of covered POPs
•
Devices supporting Band Classes 2,
4 and 25
•
Estimated network CapEx of
approximately $65mm to $70mm
Current network
4G LTE upgrade plans |
 Sprint Strategic Network Alliance Evolution
20
NASDAQ: NTLS
1999
8/1999:
Agreement
with Horizon PCS
(Sprint affiliate)
10/2010:
Sprint
announces
Network Vision
2010
8/2004:
Horizon
bankruptcy; Sprint
agreement signed
8/2007:
Amends
agreement with Sprint
10/2006:
Sprint
launches EV-DO
Rev A in San Diego
2006
9/2012:
Sprint
has
19
metropolitan areas
with 4G LTE
2012
2008
3/2008:
Launch
of EV-DO
11/2008:
Completes
EV-DO build
2013
7/2013:
Sprint
has
151 metropolitan
areas with 4G LTE
2008
2004 |
 Sprint Strategic Network Alliance Service
21
NASDAQ: NTLS
Exclusively provides 3G services to large number of Sprint home and travel
subscribers
Encompasses approximately
•
2.0mm covered POPs in WV and Western VA
•
823 cell sites
•
36,800 square miles
Provides ~$40mm in quarterly revenues
Sprint relationship update
•
Rate dispute previously outlined remains outstanding; ranges updated to:
•
Sprint’s favor: $12.0 million
•
nTelos’s favor: $19.0 million
•
$4.2 million unrelated dispute raised during 3Q 2012, isolated to historical
billing issues •
$18.3 million accrual recorded for the disputes, included in current
liabilities |
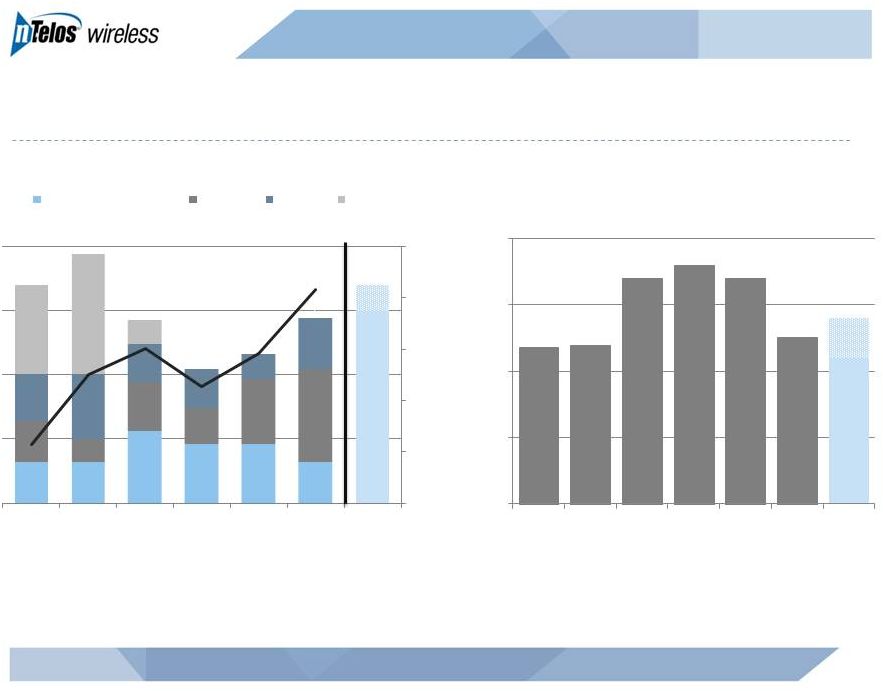
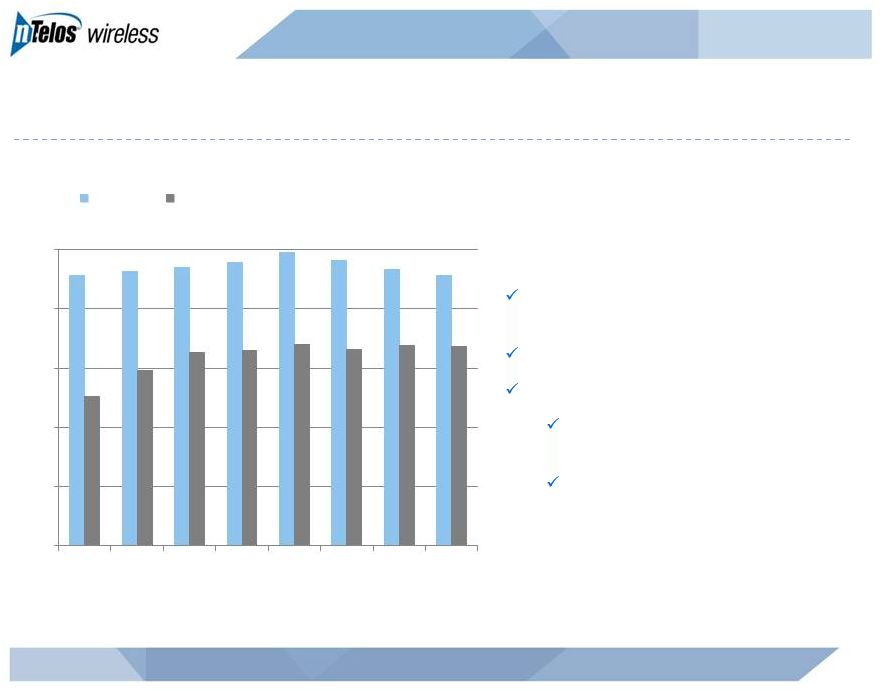 Sprint Strategic Network Alliance Leverages NTELOS’s Network
22
NASDAQ: NTLS
Strategic
Network
Alliance
revenues
(1)
(1)
Excludes roaming
Sprint Nextel Strategic Network Alliance
through at least July 2015
Attractive contribution to margin
Growing Usage
Significant growth in data usage
since EV-DO launched
Voice continues to grow
millions
$23
$23
$24
$24
$25
$24
$23
$23
$13
$15
$16
$17
$17
$17
$17
$17
$0.0
$5.0
$10.0
$15.0
$20.0
$25.0
3Q 2011
4Q 2011
1Q 2012
2Q 2012
3Q 2012
4Q 2012
1Q 2013
2Q 2013
Total Voice
Total Data |
 Financial Summary |
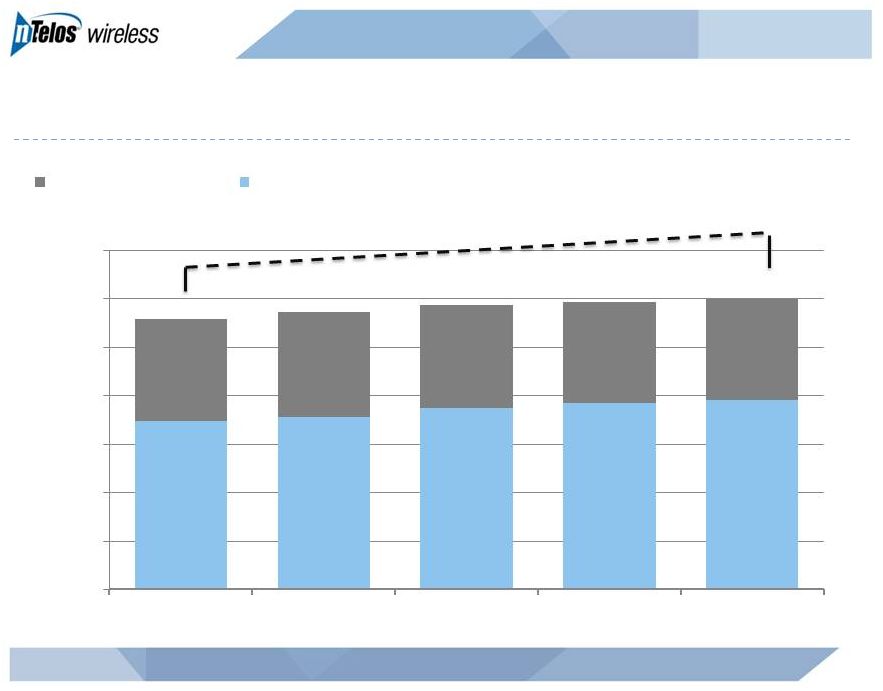 Operating Revenues
24
NASDAQ: NTLS
millions
+7%
$70
$71
$75
$77
$78
$42
$43
$42
$42
$41
$112
$114
$117
$119
$120
$0
$20
$40
$60
$80
$100
$120
$140
2Q 2012
3Q 2012
4Q 2012
1Q 2013
2Q 2013
Sprint, Wholesale & Other
Retail |
 Adjusted EBITDA
25
NASDAQ: NTLS
millions
Continued investments in the business resulted in higher Adjusted EBITDA
$34
$32
$33
$37
$41
$0
$5
$10
$15
$20
$25
$30
$35
$40
$45
2Q 2012
3Q 2012
4Q 2012
1Q 2013
2Q 2013 |
 Historical Financial Performance
26
NASDAQ: NTLS
Revenue
Adjusted EBITDA
millions
millions
(1) As of July 30, 2013
$407
$423
$454
$100
$140
$180
$220
$260
$300
$340
$380
$420
$460
2010
2011
2012
$142
$143
$135
$140 -
$145
$50
$70
$90
$110
$130
$150
2010
2011
2012
2013 G (1) |
 Managing Free Cash Flow with Disciplined Capital Investment
27
NASDAQ: NTLS
CapEx
millions
millions
CapEx
Free Cash Flow
(Adjusted EBITDA Less CapEx)
(1) As of July 30, 2013
Note: Excludes wireline and related capex incurred prior to business separation
Revenue
Revenue
millions
$85
$97
$71
$52
$58
$72
$75 -
$85
$350
$375
$400
$425
$450
$475
$0
$25
$50
$75
$100
2007
2008
2009
2010
2011
2012
2013 G (1)
Maintenance, IT & Other
Capacity
Growth
EV-DO
$55 -
$70
$59
$60
$85
$90
$85
$63
$0
$25
$50
$75
$100
2007
2008
2009
2010
2011
2012
2013 G (1) |
  Capitalization Overview
($ in millions)
June 30, 2013
Cash
$98.2
Total Debt
$492.5
Net Debt
$394.3
LTM Adjusted EBITDA
$143.5
Secured Term Loan
$491.5
Net Debt Leverage
2.7x
NASDAQ: NTLS
28 |
 Guidance (as of July 30, 2013)
NASDAQ: NTLS
29
FY
2013
Adjusted
EBITDA
of
$140
million
-
$145
million
FY
2013
CapEx
of
$75
million
-
$85
million
2013 net adds expected to be at or about 2012 net adds
|
 Senior Executives—Wireless Veterans
JIM HYDE
CEO, President and Director
STEB CHANDOR
EVP, CFO and Treasurer
CONRAD HUNTER
EVP, COO
Former CEO, T-Mobile UK
Former T-Mobile USA /
Western Wireless /
VoiceStream Sr. Exec
18 years industry experience
Former CFO, iPCS Wireless
Former CFO, Metro One
Telecommunications
17 years industry experience
Former COO, iPCS Wireless
Former VP of Midwest
Operations, U.S. Cellular
Corporation
33 years industry experience
30
NASDAQ: NTLS
ROBERT McAVOY
EVP, CTO
Former Market General
Manager, PrimeCo
Began career at Bell Atlantic
25 years industry experience |
 Summary
Leading “pure-play”
regional wireless company
31
Strategic asset set
Strong free cash flow
Broad geographic and network technology footprint
Experienced management team
NASDAQ: NTLS
Competitive and diversified business model |
 Appendix |
 33
NASDAQ: NTLS
NTELOS Holdings Corp.
Reconciliation of Net Income Attributable to NTELOS Holdings Corp. to Adjusted EBITDA
Year Ended:
(In thousands)
2012
2011
2010
2009
2008
2007
Net Income Attributable to NTELOS Holdings Corp.
18,387
$
(23,715)
$
44,808
$
63,285
$
44,829
$
32,453
$
Net income attributable to noncontrolling interests
1,941
(1,769)
(1,417)
(851)
Net Income
20,328
(21,946)
46,225
64,136
44,829
32,453
Discontinued operations, net
-
(45,386)
16,882
18,054
16,002
12,638
Income from continuing operations
20,328
23,440
29,343
46,082
28,827
19,815
Interest expense
22,944
23,380
24,728
15,922
17,024
24,520
Loss (gain) on derivatives
-
264
147
(2,100)
9,531
3,527
Income taxes
12,676
16,363
20,251
26,526
20,787
17,161
Corporate financing fees
-
1,567
Other expense (income), net
7,194
1,240
413
971
1,402
2,953
Operating income
63,142
66,254
74,882
87,401
77,571
67,976
Depreciation and amortization
63,258
63,083
58,016
63,015
75,982
70,102
Accretion of asset retirement obligations
637
658
770
695
914
746
Equity-based compensation
6,029
6,072
5,270
3,227
2,729
4,328
Acquisition related charges
-
-
2,815
1,477
570
Business separation charges
1,660
6,997
352
Adjusted EBITDA
134,726
$
143,064
$
142,105
$
155,815
$
157,196
$
143,721
$
1
Charges
for
legal
and
consulting
services
costs
in
connection
with
the
separation
of
the
wireless
and
wireline
operations.
1 |
 34
NASDAQ: NTLS
NTELOS Holdings Corp.
Reconciliation of Net Income Attributable to NTELOS Holdings Corp. to Adjusted EBITDA
(In thousands)
2Q13
1Q13
4Q12
3Q12
2Q12
Net Income Attributable to NTELOS Holdings Corp.
9,386
$
5,493
$
321
$
4,608
$
5,606
$
Net income attributable to noncontrolling interests
541
529
443
488
881
Net Income
9,927
6,022
764
5,096
6,487
Interest expense
7,398
7,361
6,651
5,432
5,433
Income taxes
6,380
3,744
(454)
3,141
4,609
Other expense (income), net
(151)
369
7,038
50
44
Operating income
23,554
17,496
13,999
13,719
16,573
Depreciation and amortization
20,443
18,456
17,440
15,810
15,101
Gain on sale of intangible assets
(4,442)
-
-
-
-
Accretion of asset retirement obligations
173
143
174
163
151
Equity-based compensation
1,460
1,321
1,346
1,478
1,536
Business separation charges
-
-
56
684
635
Adjusted EBITDA
41,188
$
37,416
$
33,015
$
31,854
$
33,996
$
1
Charges for legal and consulting services costs in connection with the separation
of the wireless and wireline operations. 1 |
 35
NASDAQ: NTLS
NTELOS Holdings Corp.
ARPU Reconciliation
Average Monthly Revenue per User (ARPU)
1
2Q13
1Q13
4Q12
3Q12
2Q12
FY 2012
FY 2011
(In thousands, except for subscribers and ARPU)
Operating Revenues
119,859
$
119,345
$
117,398
$
114,466
$
111,585
$
453,989
$
422,629
$
Less: Equipment revenue from sales to new customers
(3,104)
(3,521)
(3,808)
(3,333)
(4,026)
(15,041)
(9,091)
Less: Equipment revenue from sales to existing customers
(2,395)
(3,117)
(3,315)
(3,416)
(3,903)
(15,037)
(17,793)
Less: Wholesale, other and adjustments
(41,179)
(40,918)
(41,488)
(42,380)
(41,061)
(165,765)
(143,477)
Gross subscriber revenue
73,181
71,789
68,787
65,337
62,595
258,146
252,268
Less: prepay subscriber revenue
(15,879)
(15,205)
(14,823)
(14,103)
(14,001)
(56,330)
(48,758)
Less: adjustments to prepay subscriber revenue
(303)
(479)
(237)
(434)
(382)
(1,706)
(1,175)
Gross postpay subscriber revenue
56,999
$
56,105
$
53,727
$
50,800
$
48,212
$
200,110
$
202,335
$
Prepay subscriber revenue
15,879
15,205
14,823
14,103
14,001
56,330
48,758
Plus: adjustments to prepay subscriber revenue
303
479
237
434
382
1,706
1,175
Gross prepay subscriber revenue
16,182
$
15,684
$
15,060
$
14,537
$
14,383
$
58,036
$
49,933
$
Average number of subscribers
453,262
444,244
434,457
427,610
422,247
425,377
422,256
Total ARPU
53.82
$
53.87
$
52.78
$
50.93
$
49.41
$
50.57
$
49.79
$
Average number of postpay subscribers
299,304
298,414
292,668
287,165
284,834
288,428
298,992
Postpay ARPU
63.48
$
62.67
$
61.19
$
58.97
$
56.42
$
57.82
$
56.39
$
Average number of prepay subscribers
153,958
145,831
141,789
140,446
137,413
136,949
123,264
Prepay ARPU
35.04
$
35.85
$
35.41
$
34.50
$
34.89
$
35.31
$
33.76
$
Gross subscriber revenue
73,181
71,789
68,787
65,337
62,595
258,146
252,268
Less: voice and other feature revenue
(43,078)
(42,658)
(41,379)
(39,366)
(37,708)
(156,032)
(171,882)
Data revenue
30,103
$
29,131
$
27,408
$
25,971
$
24,887
$
102,114
$
80,386
$
Average number of subscribers
453,262
444,244
434,457
427,610
422,247
425,377
422,256
Total Data ARPU
22.14
$
21.86
$
21.03
$
20.25
$
19.65
$
20.00
$
15.86
$
Gross postpay subscriber revenue
56,999
56,105
53,727
50,800
48,212
200,110
202,335
Less: postpay voice and other feature revenue
(36,170)
(35,952)
(34,651)
(33,028)
(31,490)
(130,601)
(144,114)
Postpay data revenue
20,829
$
20,153
$
19,076
$
17,772
$
16,722
$
69,509
$
58,221
$
Gross prepay subscriber revenue
16,182
15,684
15,060
14,537
14,383
58,036
49,933
Less: prepay voice and other feature revenue
(6,908)
(6,706)
(6,728)
(6,338)
(6,218)
(25,431)
(27,768)
Prepay data revenue
9,274
$
8,978
$
8,332
$
8,199
$
8,165
$
32,605
$
22,165
$
Average number of postpay subscribers
299,304
298,414
292,668
287,165
284,834
288,428
298,992
Postpay data ARPU
23.20
$
22.51
$
21.73
$
20.63
$
19.57
$
20.08
$
16.23
$
Average number of prepay subscribers
153,958
145,831
141,789
140,445
137,413
136,949
123,264
Prepay data ARPU
20.08
$
20.52
$
19.59
$
19.46
$
19.81
$
19.84
$
14.99
$
1
Average monthly revenue per user (ARPU) is computed by dividing service revenues per period by the
average number of subscribers during that period. ARPU as defined may not be similar to ARPU measures of other companies, is
not a measurement under GAAP and should be considered in addition to, but not as a substitute for, the
information contained in the Company’s consolidated statements of operations. The Company closely monitors the effects of new
rate plans and service offerings on ARPU in order to determine their effectiveness. ARPU provides
management useful information concerning the appeal of NTELOS rate plans and service offerings and the Company’s performance in
attracting and retaining high-value customers. |