Attached files
| file | filename |
|---|---|
| 8-K - FORM 8-K - Virtu KCG Holdings LLC | d596541d8k.htm |
 KCG Holdings, Inc. (NYSE: KCG)
Barclays Global Financial Services Conference
September 11, 2013
Exhibit 99.1 |
 ©
2013 KCG Proprietary and Confidential
Safe Harbor
2
Certain statements contained herein may constitute "forward-looking statements" within the
meaning of the safe harbor provisions of the U.S. Private Securities Litigation Reform Act of
1995. Forward-looking statements are typically identified by words such as "believe," "expect,"
"anticipate," "intend," "target," "estimate," "continue,"
"positions," "prospects" or "potential," by future conditional verbs such as "will," "would,"
"should," "could" or "may," or by variations of such words or by similar
expressions. These "forward-looking statements" are not historical facts and are
based on current expectations, estimates and projections about KCG's industry, management beliefs and certain assumptions made by
management, many of which, by their nature, are inherently uncertain and beyond our control. Any
forward-looking statement contained herein speaks only as of the date on which it is made.
We undertake no obligation to publicly update any forward-looking statement, whether written or
oral, that may be made from time to time, whether as a result of new information, future developments
or otherwise. Accordingly, readers are cautioned that any such forward-looking statements
are not guarantees of future performance and are subject to certain risks, uncertainties and
assumptions that are difficult to predict including, without limitation, risks associated with: (i)
the strategic combination of Knight Capital Group, Inc. ("Knight") and GETCO Holding
Company, LLC ("GETCO"), including, among other things, (a) difficulties and delays in integrating the Knight
and GETCO businesses or fully realizing cost savings and other benefits, (b) the inability to sustain
revenue and earnings growth, and (c) customer and client reactions; (ii) the August 1, 2012
technology issue that resulted in Knight’s broker-dealer subsidiary sending numerous
erroneous orders in NYSE-listed and NYSE Arca securities into the market and the impact to
Knight's capital structure and business as well as actions taken in response thereto and
consequences thereof; (iii) the costs and risks associated with the sale of Knight's institutional fixed
income sales and trading business, the pending sale of KCG’s reverse mortgage origination and
securitization business and the departure of the managers of KCG’s listed derivatives
group; (iv) the ability of KCG's broker-dealer subsidiary to recover all or a portion of the damages that are
attributable to the manner in which NASDAQ OMX handled the Facebook IPO; (v) changes in market
structure, legislative, regulatory or financial reporting rules, including the continuing
legislative and regulatory scrutiny of high-frequency trading; (v) past or future changes to
organizational structure and management; (vi) KCG's ability to develop competitive new products and
services in a timely manner and the acceptance of such products and services by KCG's customers
and potential customers; (vii) KCG's ability to keep up with technological changes; (viii)
KCG's ability to effectively identify and manage market risk, operational risk, legal risk, liquidity risk, reputational risk, counterparty
risk, international risk, regulatory risk, and compliance risk; (ix) the cost and other effects of
material contingencies, including litigation contingencies, and any adverse judicial,
administrative or arbitral rulings or proceedings; and (x) the effects of increased competition and KCG's
ability to maintain and expand market share. The list above is not exhaustive. Readers should
carefully review the risks and uncertainties disclosed in KCG's and Knight's reports with the
SEC, including, without limitation, those detailed under "Certain Factors Affecting Results of
Operations” in KCG’s Quarterly Report on Form 10-Q for the period ended June 30, 2013,
under "Risk Factors" in Knight's Annual Report on Form 10-K for the year-ended
December 31, 2012 and the Current Report on Form 8-K filed by KCG on August 9, 2013, and in other reports or
documents KCG files with, or furnishes to, the SEC from time to time.
For additional disclosures, please see https://www.kcg.com/legal/global-disclosures.
|
 ©
2013 KCG Proprietary and Confidential
KCG: Key Investment Highlights
An established leader in
the fiercely competitive, highly regulated and
technologically advanced U.S. equity market
Diversified revenues from principal and agency trading across asset classes and
regions
Well positioned to compete amid the gradual shift from analog to
digital
trading across the global securities markets
Meaningful expected synergies and strong cash generation
Currently trading at a discount to tangible book value
3 |
 ©
2013 KCG Proprietary and Confidential
KCG At-A-Glance
An independent, pure-play securities
firm formed by the merger between
GETCO and Knight.
KCG engages in market making and
trading to increase efficiencies for
investors deploying capital across the
markets.
The firm works to create more
efficient, resilient markets by applying
advanced technologies to trading
across asset classes and regions.
Inception of trading on July 5
Shares outstanding of 121 million
Trading range of $8.11 to $12.14
Pro forma TBV of $10.87 as of June 30
3Q13 earnings to be released on October
30
4 |
 ©
2013 KCG Proprietary and Confidential
Strategic Rationale
Maximize advantages available to non-banks in securities trading
Leverage combined infrastructure, intellectual capital and liquidity to drive
innovation, scale and performance
Create meaningful synergies:
Generate balanced revenues over time from principal and agency trading
across asset classes and regions
5
Combine technology operations
Eliminate back office redundancies
Rationalize the platform by consolidating broker dealers and integrating
self-clearing functions
Optimize economics from trading on exchanges and ATS’s
|
 ©
2013 KCG Proprietary and Confidential
KCG Structure
Market Making –
Make markets in
global equities, commodities, fixed income,
futures, options and foreign exchange.
Global Execution Services –
Act
primarily as an agency broker and
operator of trading venues across
global equities, foreign exchange, fixed
income, futures and options.
Corporate and Other –
Strategic investments
in financial services-related ventures, interest
income and corporate overhead expenses
6
Market
Making
Global
Execution
Services
Corporate
and Other |
 ©
2013 KCG Proprietary and Confidential
Market Making
Direct market making on behalf of clients
as well as providing market making
liquidity on exchanges, ECNs and other
venues.
Primary offerings:
Client Direct and Exchange Based
Market Making
The retail market leader in executing
Rule 605-eligible U.S. equity orders
A leading DMM at the NYSE
Knight Link
Rapid, off-exchange order execution
GETDirect
Market making on electronic fixed income
platforms
7
†
Source: Thomson Reuters Transaction Analytics
KCG Retail U.S. Exchange-Listed Volume
and Market Share†
KCG Avg. Execution Quality of
U.S. Exchange-Listed Stocks† |
 ©
2013 KCG Proprietary and Confidential
Execution Services
A range of execution-only trading
services, designed to provide access to
liquidity, preserve anonymity and
minimize market impact.
Primary offerings:
Institutional sales trading
KCG EMS
Knight Direct
GETAlpha
8
†
Sources: KCG, BATS Global Markets, Thomson Reuters Autex
100
120
140
160
180
200
220
240
260
280
300
3.5%
4.1%
2012
1H13
KCG EMS / Algorithmic U.S. Equity Volume
and % of Consolidated Tape†
Access to deep, unique liquidity
and trading expertise
-
Broker-neutral execution management
system
Execution algorithms
Execution algorithms
-
-
- |
 ©
2013 KCG Proprietary and Confidential
Venues
Robust platforms for electronic
trading connecting an array of market
participants to generate liquidity and
efficiencies.
Primary offerings:
KCG Hotspot
KCG BondPoint
Knight Match
GETMatched
9
†
Sources: KCG, Thomson Reuters, EBS, TRACE
-
Institutional spot FX ECN
Fixed income ECN
ATS ranked # 6 in Rosenblatt’s Dark
Liquidity Tracker in 1H13
ATS ranked # 11 in Rosenblatt’s Dark
Liquidity Tracker in 1H13
-
-
-
0
5
10
15
20
25
30
35
40
9.55%
10.27%
2012
1H13
KCG Hotspot Volume
and % of Spot FX Volume†
$124.1
$136.4
25
50
75
100
125
150
175
2012
1H13
KCG BondPoint Retail Fixed Income Volume† |
 ©
2013 KCG Proprietary and Confidential
Global Revenue Distribution
The Americas:
84%
Europe:
12%
Asia:
4%
Based on YTD revenues as of June 30, 2013, excluding Urban Financial Group
10 |
 ©
2013 KCG Proprietary and Confidential
Pro Forma Adjusted Revenue and Expense Trends
(in $ thousands)
Full Year 2012
First Half 2013
Revenues
1,496,359
769,520
Expenses
(% of revenues)
(% of revenues)
Employee compensation and benefits
543,679
36%
274,031
36%
Execution and clearance fees
370,790
25%
183,661
24%
Communications and data processing
178,110
12%
86,717
11%
Depreciation and amortization
86,445
6%
39,973
5%
Interest
79,605
5%
39,478
5%
Payments for order flow
66,528
4%
45,209
6%
Professional fees
27,111
2%
9,886
1%
Occupancy and equipment rentals
36,440
2%
17,999
2%
Other
62,583
4%
26,237
3%
Pre-tax income
45,069
3%
46,328
6%
Based on KCG Holdings, Inc. 8-K/A filed September 10, 2013; See Addendum for
Reg G chart 11 |
 ©
2013 KCG Proprietary and Confidential
Pro Forma Balance Sheet
(in $ thousands)
June 30, 2013
Cash and cash equivalents
726,302
Long-term debt
727,133
Stockholders' equity
1,509,247
-
-
-
Debt-to-equity
ratio
†
0.64
-
-
-
Book value
$12.92
Tangible book value
**
$10.87
†
Debt-to-equity ratio incorporates the effect of the $235 million first
lien term loan due within one year, which is included in accrued
expenses and other liabilities
**
Tangible book value is calculated by subtracting pro forma goodwill
and intangible assets from equity
Based on KCG Holdings, Inc. 8-K/A filed September 10, 2013
12 |
 ©
2013 KCG Proprietary and Confidential
Integration Update
Prior to the close:
Post-Closing (In Progress):
13
GETCO recorded a restructuring expense
Knight recorded a restructuring expense, completed an asset sale, discontinued
certain offerings, and created a reserve for legal proceedings
Execution of liquidity strategy across asset classes
Combination of overlapping businesses and functions
Consolidation of broker dealers
Integration of clearing operations
Closing the sale of Urban Financial Group |
 ©
2013 KCG Proprietary and Confidential
KCG: Key Investment Highlights
An established leader in
the fiercely competitive, highly regulated and
technologically advanced U.S. equity market
Diversified revenues from principal and agency trading across asset classes and
regions
Well positioned to compete amid the gradual shift from analog to
digital
trading across the global securities markets
Meaningful expected synergies and strong cash generation
Currently trading at a discount to tangible book value
14 |
 ©
2013 KCG Proprietary and Confidential
Addendum
15 |
 ©
2013 KCG Proprietary and Confidential
Regulation G Reconciliation of Non-GAAP
Financial Measures (Continuing Operations)
Year ended December 31, 2012
GETCO
Knight
Ex-Urban
Other
Adjustments
Debt
Refinancing
Purchase Price
Adjustments
KCG
Pro Forma
(in $ thousands)
Reconciliation of pro forma GAAP to pro forma
non-GAAP pre-tax:
Pro forma GAAP income (loss) from continuing
operations before taxes
26,427
(412,890)
(36,005)
7,895
(34,871)
(11,151)
(460,595)
August 1 trading loss, related costs and professional
and other fees related to the merger
4,318
468,792
-
(7,895)
-
-
465,215
Writedown of goodwill and intangible assets
-
28,733
(1,381)
-
-
-
27,351
Facebook IPO trading losses
-
35,438
-
-
-
-
35,438
Investment gain
(25,092)
(9,992)
-
-
-
-
(35,084)
Writedown of strategic investment
1,360
11,384
-
-
-
-
12,744
Pro forma non-GAAP income (loss) from
continuing operations before income taxes
7,013
121,465
(37,386)
-
(34,871)
(11,151)
45,069
NOTES: Totals may not add due to rounding
16 |
 ©
2013 KCG Proprietary and Confidential
Regulation G Reconciliation of Non-GAAP
Financial Measures (Continuing Operations)
Six months ended June 30, 2013
GETCO
Knight
Ex-Urban
Other
Adjustments
Debt
Refinancing
Purchase Price
Adjustments
Other¹
KCG
Pro Forma
(in $ thousands)
Reconciliation of pro forma GAAP to pro
forma non-GAAP pre-tax:
Pro forma GAAP income (loss) from continuing
operations before taxes
(76,916)
(3,315)
244
45,026
(8,023)
(5,544)
-
(48,528)
14,931
22,497
-
-
-
-
-
37,428
Professional and other fees related to the mergers
and August 1 technology issue
37,129
31,423
-
(45,026)
-
-
-
23,526
Additional interest expense
-
-
-
-
-
-
(6,794)
(6,794)
Strategic investments impairments
9,184
-
-
-
-
-
-
9,184
Writedown of goodwill related to subsidiary Urban
Financial Group
-
17,787
(17,787)
-
-
-
-
-
Reserve for legal proceedings
-
10,000
-
-
-
-
-
10,000
Compensation and other expenses related to
reduction in workforce
8,517
12,995
-
-
-
-
-
21,512
Pro forma non-GAAP income (loss) from
continuing operations before income taxes
(7,155)
91,387
(17,543)
-
(8,023)
(5,544)
(6,794)
46,328
Totals may not add due to rounding
17
1
The unaudited pro forma income statements give effect to the mergers as if they
had occurred on January 1, 2012. As part of that assumption, $235 million of the first lien term loan is
payable in the first year. Therefore, the six months ended June 30, 2013 does not
include interest expense on this portion of the loan. The non-GAAP income (loss) from continuing
operations before income taxes adds back the expected interest expense on the
$235 million loan for the six months ended June 30, 2013. -
and stock-based comp expense due to the mergers
Accelerated deferred comp, unit |
 ©
2013 KCG Proprietary and Confidential
Regulation G Reconciliation of Non-GAAP
Financial Measures (Continuing Operations)
Year ended December 31, 2012
GETCO
Knight
Ex-Urban
Other
Adjustments
Debt
Refinancing
Purchase Price
Adjustments
KCG
Pro Forma
(in $ thousands)
Reconciliation of pro forma GAAP to pro forma
non-GAAP revenue:
Pro forma GAAP revenue
551,536
590,251
(116,096)
1,025,691
August 1 trading loss, related costs and professional
and other fees related to the merger
457,570
457,570
Facebook IPO trading losses
35,438
35,438
Investment gain
(25,092)
(9,992)
(35,084)
Writedown of strategic investment
1,360
11,384
12,744
Pro forma non-GAAP revenue
527,804
1,084,651
(116,096)
1,496,359
NOTES: Totals may not add due to rounding
18 |
 ©
2013 KCG Proprietary and Confidential
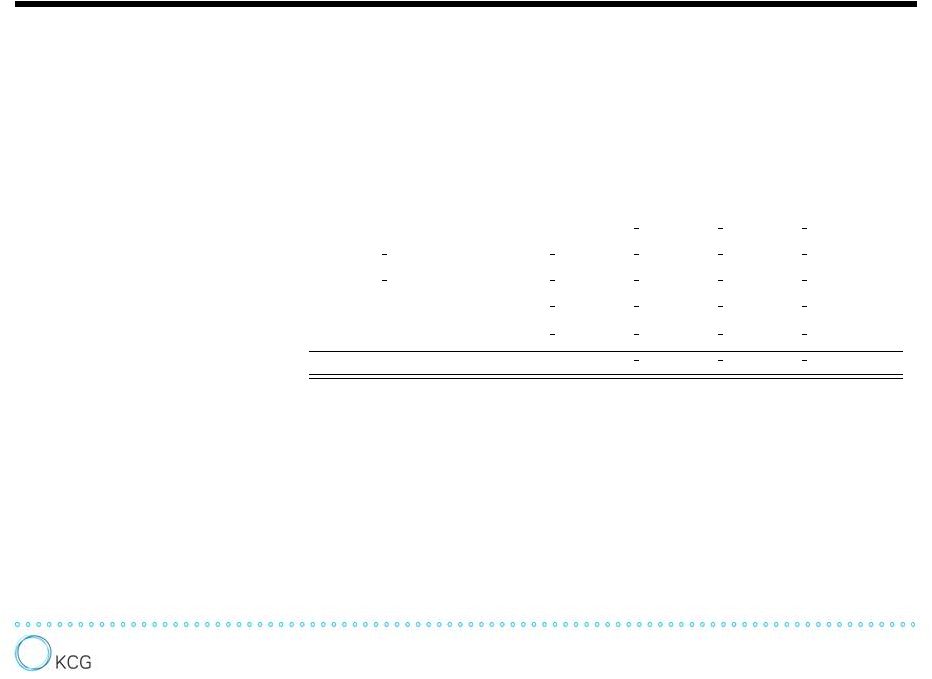
Regulation G Reconciliation of Non-GAAP
Financial Measures (Continuing Operations)
Six months ended June 30, 2013
GETCO
Knight
Ex-Urban
Other
Adjustments
Debt
Refinancing
Purchase Price
Adjustments
KCG
Pro Forma
(in $ thousands)
Reconciliation of pro forma GAAP to pro forma
non-GAAP revenue:
Pro forma GAAP revenue
230,969
599,690
(70,323)
760,336
Writedown of strategic investment
9,184
9,184
Pro forma non-GAAP revenue
240,153
599,690
(70,323)
769,520
NOTES: Totals may not add due to rounding
19 |
 ©
2013 KCG Proprietary and Confidential
20 |
 |