Attached files
| file | filename |
|---|---|
| 8-K - 8-K - INLAND REAL ESTATE CORP | a13-20429_18k.htm |
| EX-99.2 - EX-99.2 - INLAND REAL ESTATE CORP | a13-20429_1ex99d2.htm |
Exhibit 99.1
|
|
Investor Presentation 2Q13 (September 2013) |
|
|
IRC SNAPSHOT Inception 1994 Self administered/managed as of 2000 Listed on NYSE June 2004 Properties in which IRC has ownership interest: 1541 SF under management (154 assets): 15.2 million1 Total assets under management2: $2.8 billion $2.1 billion total market capitalization3 Monthly dividend/common share $0.0475 ($0.57 annual)4 Dividend yield 5.8%4 Central United States Dominant retail REIT owner in 2 top U.S. markets: Chicago & Minneapolis-St. Paul Expanding in other Midwest markets such as Cincinnati & Cleveland History: Geographic Footprint: Portfolio: Market/Stock Information: As of 6/30/13; includes consolidated assets & unconsolidated assets at 100%; excludes development JVs & non-owned IPCC JV properties. As of 6/31013; includes consolidated assets , unconsolidated assets at 100% & assets IRC does not have an ownership interest in, but that we manage on behalf of a third party. Includes pro rata share of debt related to unconsolidated joint ventures as of 6/30/13. Dividend rate & yield as of 9/6/13. 2 |
|
|
INVESTMENT HIGHLIGHTS High-Quality, Diversified Portfolio Strong asset quality driven by high occupancy (94.4% leased)1 and consistent cash flows Diverse tenant base includes a mix of national retailers across a variety of categories Compelling portfolio demographics: dense populations, high incomes, diverse economies Exposure to resilient markets with high barriers to entry and attractive growth prospects; dominant position in primary markets Compelling Internal & External Growth Opportunities Impressive recent same-store net operating income (NOI) growth Continued positive leasing spreads on new leases and renewals Successful redevelopment track record with a robust pipeline in process Strong Liquidity / Debt Maturity Profile Multiple sources of capital to support business plan / strategic growth initiatives Recent initiatives have improved credit metrics and enhanced balance sheet flexibility Well-laddered debt maturity schedule with minimal near-term refinancing risks Experienced Management Team Fully integrated team with deep experience and successful track record operating within the retail sector and public capital markets Note: (1) Total portfolio as of 6/30/13; includes 1 non-retail property & retail properties in unconsolidated joint ventures at 100%. 3 |
|
|
STRATEGIC OBJECTIVES Generate consolidated same store NOI annual growth of 2% to 3% for 2013 Achieve consolidated same store financial occupancy of 89% to 90% at YE 2013 Enhance portfolio growth and valuation metrics Reduce cost & extend term of debt; maintain well-balanced debt maturity schedule Lower overall leverage; target net debt-to-total EBITDA ratio below 7x Longer term goal: achieve investment grade status Improve liquidity, leverage and financial flexibility Redeploy capital from dispositions of ~$30-50M in noncore assets into higher growth opportunities1 Grow assets under management and income via on-balance sheet acquisitions and by leveraging lower cost of capital of institutional joint venture partners Strengthen portfolio’s long-term growth potential through selective sales & acquisitions Notes: Guidance information current as of 2Q13 earnings release dated 8/8/13. (1) Based on current pool of assets sold or targeted for sale in 2013. 4 |
|
|
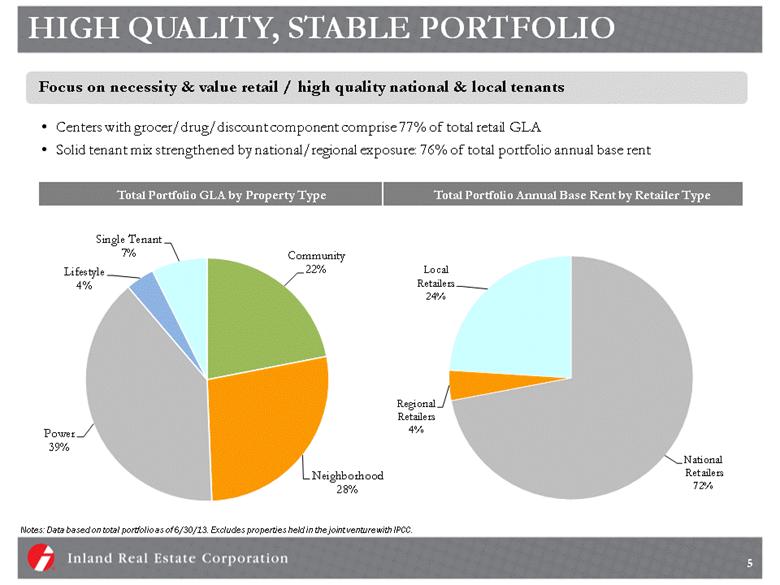
HIGH QUALITY, STABLE PORTFOLIO Centers with grocer/drug/discount component comprise 77% of total retail GLA Solid tenant mix strengthened by national/regional exposure: 76% of total portfolio annual base rent Focus on necessity & value retail / high quality national & local tenants Total Portfolio GLA by Property Type Total Portfolio Annual Base Rent by Retailer Type Notes: Data based on total portfolio as of 6/30/13. Excludes properties held in the joint venture with IPCC. 5 National Retailers 72% Regional Retailers 4% Local Retailers 24% Single Tenant 7% Lifestyle 4% Community 22% Power 39% Neighborhood 28% |
|
|
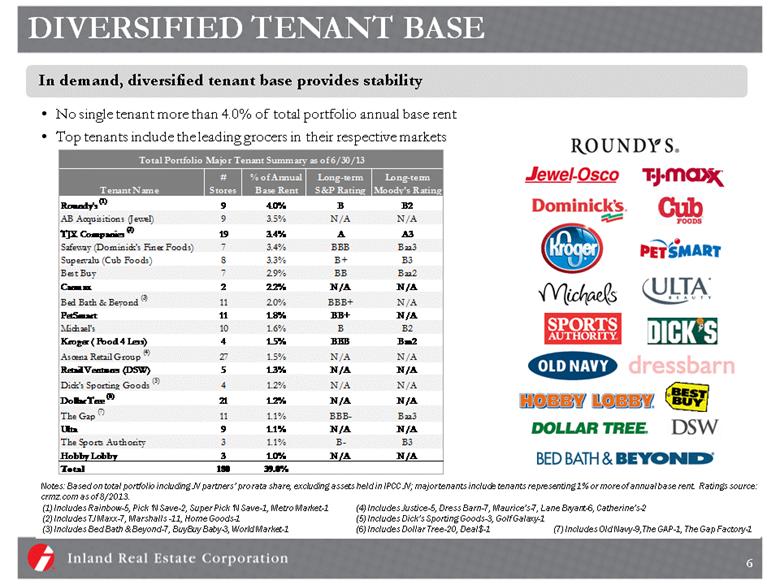
DIVERSIFIED TENANT BASE No single tenant more than 4.0% of total portfolio annual base rent Top tenants include the leading grocers in their respective markets In demand, diversified tenant base provides stability (1) Includes Rainbow-5, Pick ‘N Save-2, Super Pick ‘N Save-1, Metro Market-1 (2) Includes TJ Maxx-7, Marshalls -11, Home Goods-1 (3) Includes Bed Bath & Beyond-7, BuyBuy Baby-3, World Market-1 (4) Includes Justice-5, Dress Barn-7, Maurice’s-7, Lane Bryant-6, Catherine’s-2 (5) Includes Dick’s Sporting Goods-3, Golf Galaxy-1 (6) Includes Dollar Tree-20, Deal$-1 (7) Includes Old Navy-9,The GAP-1, The Gap Factory-1 Notes: Based on total portfolio including JV partners’ pro rata share, excluding assets held in IPCC JV; major tenants include tenants representing 1% or more of annual base rent. Ratings source: crmz.com as of 8/2013. 6 Tenant Name # Stores % of Annual Base Rent Long-term S&P Rating Long-term Moody's Rating Roundy's (1) 9 4.0% B B2 AB Acquisitions (Jewel) 9 3.5% N/A N/A TJX Companies (2) 19 3.4% A A3 Safeway (Dominick's Finer Foods) 7 3.4% BBB Baa3 Supervalu (Cub Foods) 8 3.3% B+ B3 Best Buy 7 2.9% BB Baa2 Carmax 2 2.2% N/A N/A Bed Bath & Beyond (3) 11 2.0% BBB+ N/A PetSmart 11 1.8% BB+ N/A Michael's 10 1.6% B B2 Kroger ( Food 4 Less) 4 1.5% BBB Baa2 Ascena Retail Group (4) 27 1.5% N/A N/A Retail Ventures (DSW) 5 1.3% N/A N/A Dick's Sporting Goods (5) 4 1.2% N/A N/A Dollar Tree (6) 21 1.2% N/A N/A The Gap (7) 11 1.1% BBB- Baa3 Ulta 9 1.1% N/A N/A The Sports Authority 3 1.1% B- B3 Hobby Lobby 3 1.0% N/A N/A Total 180 39.0% Total Portfolio Major Tenant Summary as of 6/30/13 |
|
|
STRONG MARKET DEMOGRAPHICS 3rd highest median 3-mile household income amongst peers Average 3-mile population: 88,770 Solid demographics enhance portfolio’s resiliency and protect it from new supply IRC’s retail centers are supported by strong demographics / high barriers to entry Median 3-Mile Household Income IRC data source: Claritas 3-mile data. IRC data includes retail properties in the total portfolio and is weighted by SF (GLA ). Peer data source: ISI, Real Estate Research: Retail Demographic Analysis, April 2013. Data is weighted by SF. ISI does not report data for IRC or peers not included in chart. 7 $72,299 $69,298 $65,313 $59,488 $58,824 $58,265 $57,896 $55,668 $53,085 FRT REG IRC AKR RPAI KIM EQY DDR WRI |
|
|
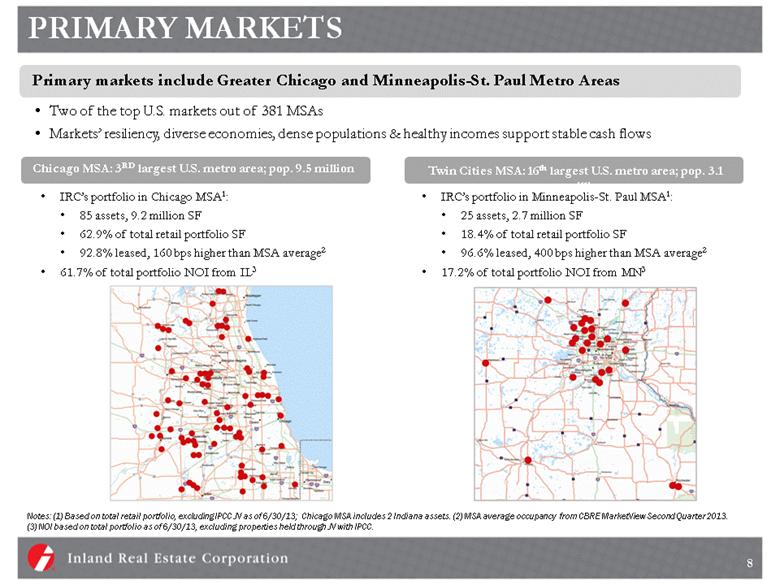
PRIMARY MARKETS Primary markets include Greater Chicago and Minneapolis-St. Paul Metro Areas Two of the top U.S. markets out of 381 MSAs Markets’ resiliency, diverse economies, dense populations & healthy incomes support stable cash flows Notes: (1) Based on total retail portfolio, excluding IPCC JV as of 6/30/13; Chicago MSA includes 2 Indiana assets. (2) MSA average occupancy from CBRE MarketView Second Quarter 2013. (3) NOI based on total portfolio as of 6/30/13, excluding properties held through JV with IPCC. IRC’s portfolio in Chicago MSA1: 85 assets, 9.2 million SF 62.9% of total retail portfolio SF 92.8% leased, 160 bps higher than MSA average2 61.7% of total portfolio NOI from IL3 IRC’s portfolio in Minneapolis-St. Paul MSA1: 25 assets, 2.7 million SF 18.4% of total retail portfolio SF 96.6% leased, 400 bps higher than MSA average2 17.2% of total portfolio NOI from MN3 Chicago MSA: 3RD largest U.S. metro area; pop. 9.5 million Twin Cities MSA: 16th largest U.S. metro area; pop. 3.1 million 8 |
|
|
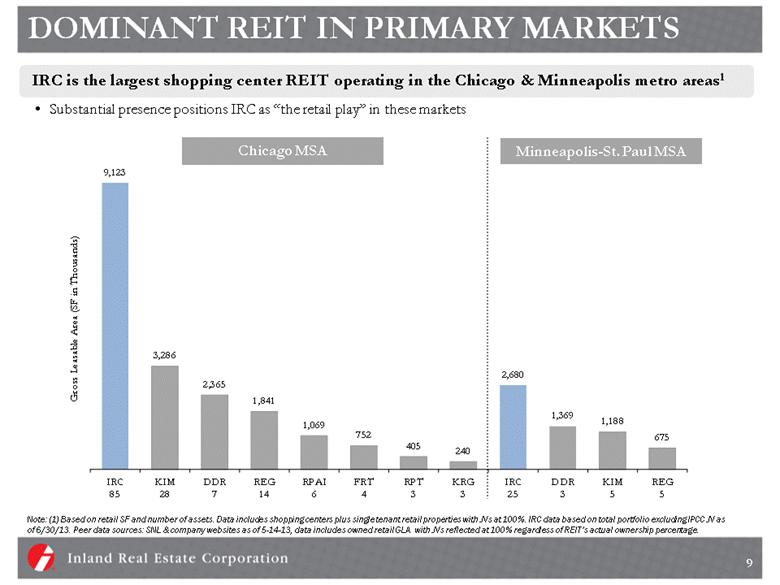
DOMINANT REIT IN PRIMARY MARKETS IRC is the largest shopping center REIT operating in the Chicago & Minneapolis metro areas1 Substantial presence positions IRC as “the retail play” in these markets Minneapolis-St. Paul MSA Note: (1) Based on retail SF and number of assets. Data includes shopping centers plus single tenant retail properties with JVs at 100%. IRC data based on total portfolio excluding IPCC JV as of 6/30/13. Peer data sources: SNL & company websites as of 5-14-13, data includes owned retail GLA with JVs reflected at 100% regardless of REIT’s actual ownership percentage. 9 9,123 3,286 2,365 1,841 1,069 752 405 240 2,680 1,369 1,188 675 IRC 85 KIM 28 DDR 7 REG 14 RPAI 6 FRT 4 RPT 3 KRG 3 IRC 25 DDR 3 KIM 5 REG 5 Gross Leasable Area (SF in Thousands) Chicago MSA |
|
|
OPERATING STRATEGY IN PRIMARY MARKETS Schaumburg Promenade Woodfield Plaza Woodfield Commons Nantucket Square Example: IRC Assets in Schaumburg, IL (1 of 5 Top Submarkets In Chicago MSA) 10 Schaumburg Plaza Acquire critical mass of properties in target markets Market concentration facilitates multiple lease signings for retailer market launches, expansions and relocations Cluster assets within key submarkets Provides leasing flexibility & management efficiencies, including pricing power with vendors Locate on the best corner Premier locations within primary markets make IRC assets highly attractive to retailers |
|
|
INTERNAL GROWTH Positive Rent Spreads Ten consecutive quarters of positive spreads on new leases 1Q11 through 2Q13 & continued positive leasing spreads on renewals Reflects strength of locations & more level playing field with regard to lease negotiations + 8.2% + 5.2% + 5.2% + 25.8% + 39.7% + 14.0% + 11.0% + 2.7% Total Portfolio Rent Spreads On New And Renewal Leases (Average Base Rents) + 15.0% + 10.9% 11 $15.95 $14.52 $13.25 $11.32 $13.96 $11.57 $10.12 $8.76 $12.22 $10.74 $17.26 $15.29 $15.10 $15.81 $14.35 $12.84 $11.64 $9.72 $12.86 $13.52 2Q12 Renewals 2Q12 New 3Q12 Renewals 3Q12 New 4Q12 Renewals 4Q12 New 1Q13 Renewals 1Q13 New 2Q13 Renewals 2Q13 New Former Average Base Rent Per SF New Average Base Rent Per SF |
|
|
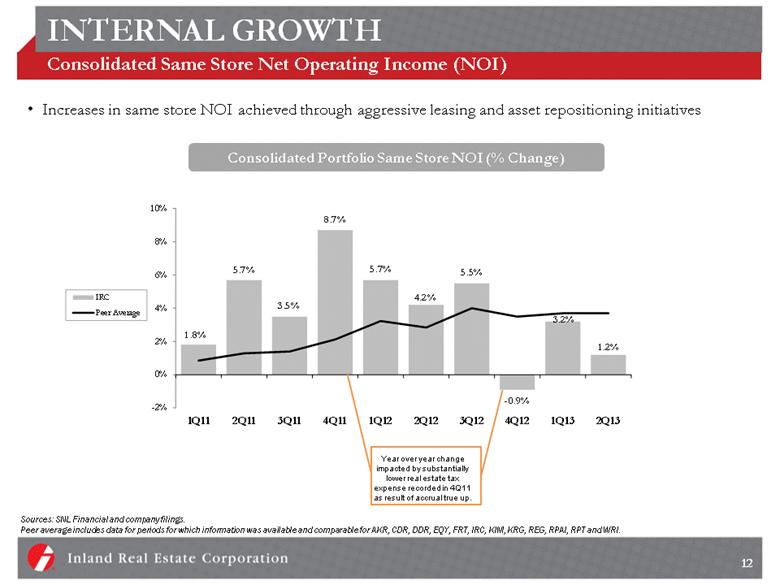
INTERNAL GROWTH Consolidated Same Store Net Operating Income (NOI) Increases in same store NOI achieved through aggressive leasing and asset repositioning initiatives Consolidated Portfolio Same Store NOI (% Change) Sources: SNL Financial and company filings. Peer average includes data for periods for which information was available and comparable for AKR, CDR, DDR, EQY, FRT, IRC, KIM, KRG, REG, RPAI, RPT and WRI. 12 Year over year change impacted by substantially lower real estate tax expense recorded in 4Q11 as result of accrual true up. 1.8% 5.7% 3.5% 8.7% 5.7% 4.2% 5.5% - 0.9% 3.2% 1.2% -2% 0% 2% 4% 6% 8% 10% 1Q11 2Q11 3Q11 4Q11 1Q12 2Q12 3Q12 4Q12 1Q13 2Q13 IRC Peer Average |
|
|
VALUE CREATION Repositioning/Redevelopment Track Record Asset Redevelopment Projects – Case Studies: Cost ROC 1 Before After Crystal Point Crystal Lake, IL Replaced vacant restaurant with multi-tenant outlot building;100% leased to Five Guys, Pot Belly’s & Starbucks Completed 2012 $ 1.6 M 12.2% Salem Square Countryside, IL Repositioning & multi-tenant outlot addition Completed 2011 $ 2.9 M 25.5% Shops of Plymouth Town Center Plymouth, MN Added 16,500 SF of GLA with construction of multi-tenant outlot building;100% leased to 4 new tenants Completed 2009 $ 3.1 M 11.2% Notes: (1) Return on cost (ROC) is based on new capital and related leasing 13 |
|
|
VALUE CREATION Repositioning/Redevelopment Projects in Process Property Value-Add Initiative Cost ROC 1 Est. Completion Bally’s, St. Paul, MN Reposition former Bally’s to multi-tenant charter school & swim school $ 1.4 M 15.8% 2013 Rivertree Court, Vernon Hills, IL 2 phases: theater conversion & GLA expansion for new tenant Gordmans; reposition former Office Depot space with Ross, former Old Country Buffet with Pier One; former Ulta with Shoe Carnival $11.0 M 15.4% 2011 / 2013 Diffley Marketplace, Eagan, MN Add multi-tenant outlot and single-tenant outlot $ 2.9 M 12.0% 2014 Dunkirk Square, Maple Grove, MN Add multi-tenant outlot $ 1.8 M 12.7% 2014 Lansing Square, Lansing, IL Sell portion of property to national discount retailer for development of super store; redevelop remainder of property to add 30K SF for junior anchor $ 1.5 M 13.8% 2014 Aurora Commons, Aurora, IL Reposition Jewel store for multi-tenant apparel/discount retailers $ 2.6 M 19.0% 2014 TOTAL ASSET IMPROVEMENT PROJECTS IN PROCESS: $21.2 M 15.0% Notes: (1) Return on cost (ROC) is based on projected new capital and related leasing 14 Increased number of repositioning/redevelopment projects planned for 2013 ~ 350,000 SF taken out of service in 2013; scheduled to come back on line in 2014 Expect to invest ~21M in 6 projects Anticipated annual return on cost (ROC) on 6 projects: 15.0%1 |
|
|
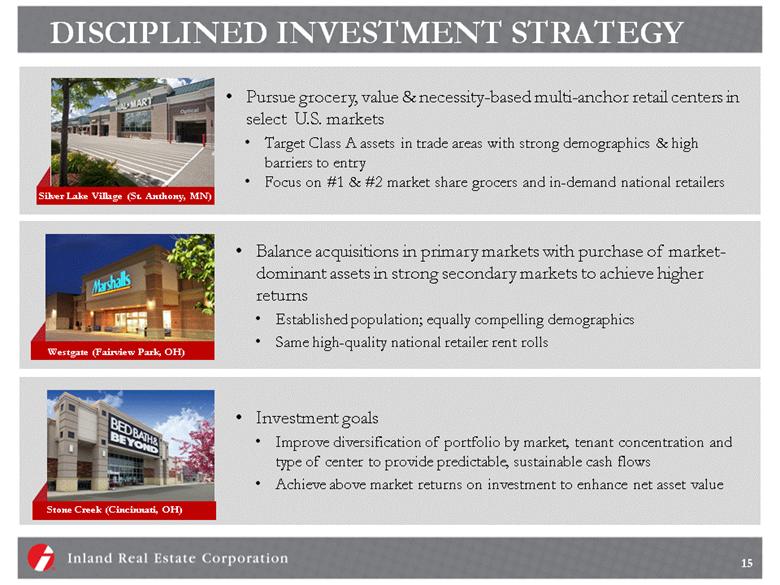
DISCIPLINED INVESTMENT STRATEGY Pursue grocery, value & necessity-based multi-anchor retail centers in select U.S. markets Target Class A assets in trade areas with strong demographics & high barriers to entry Focus on #1 & #2 market share grocers and in-demand national retailers Westgate (Fairview Park, OH) Stone Creek (Cincinnati, OH) 15 Silver Lake Village (St. Anthony, MN) Balance acquisitions in primary markets with purchase of market-dominant assets in strong secondary markets to achieve higher returns Established population; equally compelling demographics Same high-quality national retailer rent rolls Investment goals Improve diversification of portfolio by market, tenant concentration and type of center to provide predictable, sustainable clash flows Achieve above market returns on investment to enhance net asset value |
|
|
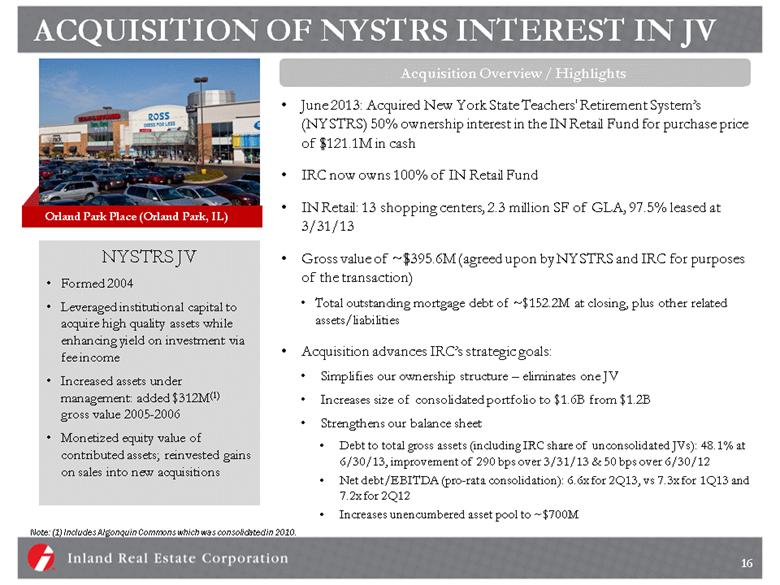
ACQUISITION OF NYSTRS INTEREST IN JV June 2013: Acquired New York State Teachers' Retirement System’s (NYSTRS) 50% ownership interest in the IN Retail Fund for purchase price of $121.1M in cash IRC now owns 100% of IN Retail Fund IN Retail: 13 shopping centers, 2.3 million SF of GLA, 97.5% leased at 3/31/13 Gross value of ~$395.6M (agreed upon by NYSTRS and IRC for purposes of the transaction) Total outstanding mortgage debt of ~$152.2M at closing, plus other related assets/liabilities Acquisition advances IRC’s strategic goals: Simplifies our ownership structure – eliminates one JV Increases size of consolidated portfolio to $1.6B from $1.2B Strengthens our balance sheet Debt to total gross assets (including IRC share of unconsolidated JVs): 48.1% at 6/30/13, improvement of 290 bps over 3/31/13 & 50 bps over 6/30/12 Net debt/EBITDA (pro-rata consolidation): 6.6x for 2Q13, vs 7.3x for 1Q13 and 7.2x for 2Q12 Increases unencumbered asset pool to ~$700M NYSTRS JV Formed 2004 Leveraged institutional capital to acquire high quality assets while enhancing yield on investment via fee income Increased assets under management: added $312M(1) gross value 2005-2006 Monetized equity value of contributed assets; reinvested gains on sales into new acquisitions Note: (1) Includes Algonquin Commons which was consolidated in 2010. 16 Orland Park Place (Orland Park, IL) Acquisition Overview / Highlights |
|
|
JOINT VENTURE GROWTH STRATEGIES Diversify Capital Resources + Expand Platform + Drive Growth Point at Clark (Chicago, IL) Walgreens (Somerset, MA) 17 PGGM Formed 2010; upsized 2012 Acquire premier retail assets using institutional capital: added $309M gross value as of 3/31/13 Captive pipeline of future acquisitions Monetized equity value of contributed assets while retaining operating control; recycled gains on sales into new acquisitions Enhance yield via fee income Potential total JV asset value at full investment ~$900M IRC 55% ownership IPCC Established 2006 Fee structure emphasizing recurring management fees over one-time transaction fees provides more value to IRC Recurring property management fee income of $1.1 M for 2012; anticipate will grow assets added to venture Target annual acquisitions of ~$100M in asset value; IRC equity investment limited to $20-30M at any one time to preserve liquidity IRC ownership reduced to 0% as interests in assets are completely sold to TIC investors |
|
|
JOINT VENTURE FEE INCOME Total joint venture fee income compound annual growth rate 23% (2006-2012) IPCC venture: generated ~$17.8 M of acquisition & property management fee income 2006-2Q131 NYSTRS JV: provided ~$8.7 M of fee income 2006-2Q13 1 PGGM JV: provided ~$4.2 M of fee income 2010-2Q13 1 $3.4 M $3.3 M $1.5 M $4.6 M $3.5 M $5.9 M $1.0 M $1.2 M $1.7 M $1.9 M $2.7 M $2.0 M Total JV Fee Income Property Management JV Fee Income Only $31.5 M $ 16.9 M $5.7 M $4.1 M NYSTRS IPCC PGGM $3.6 M $2.3 M Notes: Amounts may not foot due to rounding issues (1) Property management JV fee income includes asset management and leasing commissions. (2) Not included in this analysis are immaterial fees earned from managing development joint ventures. 18 $1.0 $1.0 $1.4 $1.2 $1.2 $1.1 $1.1 $0.4 $0.2 $0.3 $0.7 $0.6 $0.9 $1.1 $0.7 $0.2 $0.7 $1.9 $1.2 2006 2007 2008 2009 2010 2011 2012 1H13 $1.3 $1.0 $1.4 $1.2 $1.2 $1.1 $1.1 $0.4 $0.2 $2.4 $3.2 $2.1 $2.1 $4.0 $2.6 $2.0 $0.2 $0.8 $2.0 $1.2 2006 2007 2008 2009 2010 2011 2012 1H13 |
|
|
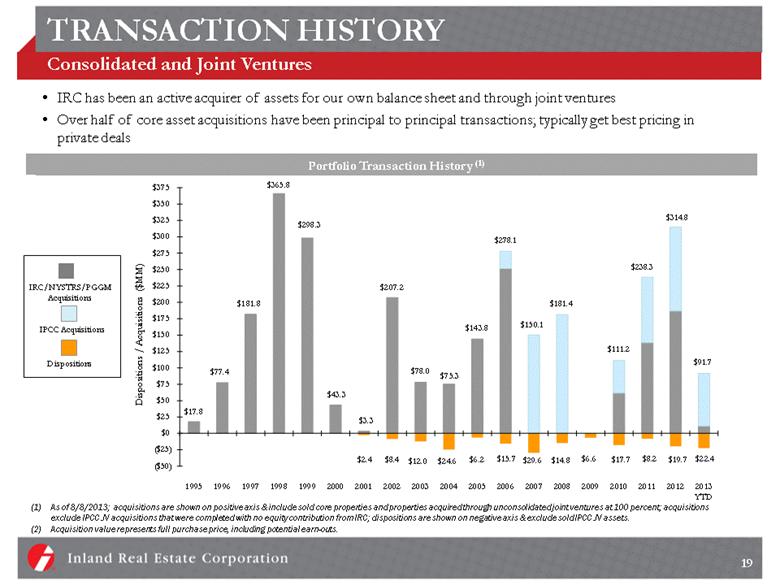
TRANSACTION HISTORY Consolidated and Joint Ventures IRC has been an active acquirer of assets for our own balance sheet and through joint ventures Over half of core asset acquisitions have been principal to principal transactions; typically get best pricing in private deals IRC/NYSTRS/PGGM Acquisitions IPCC Acquisitions Dispositions As of 8/8/2013; acquisitions are shown on positive axis & include sold core properties and properties acquired through unconsolidated joint ventures at 100 percent; acquisitions exclude IPCC JV acquisitions that were completed with no equity contribution from IRC; dispositions are shown on negative axis & exclude sold IPCC JV assets. Acquisition value represents full purchase price, including potential earn-outs. 19 $278.1 $111.2 $238.3 $314.8 $91.7 $17.8 $77.4 $181.8 $365.8 $298.3 $43.3 $3.3 $207.2 $78.0 $75.3 $143.8 $150.1 $181.4 $2.4 $8.4 $12.0 $24.6 $6.2 $15.7 $29.6 $14.8 $6.6 $17.7 $8.2 $19.7 $22.4 ($50) ($25) $0 $25 $50 $75 $100 $125 $150 $175 $200 $225 $250 $275 $300 $325 $350 $375 1995 1996 1997 1998 1999 2000 2001 2002 2003 2004 2005 2006 2007 2008 2009 2010 2011 2012 2013 YTD Dispositions / Acquisitions ($MM) Portfolio Transaction History (1) |
|
|
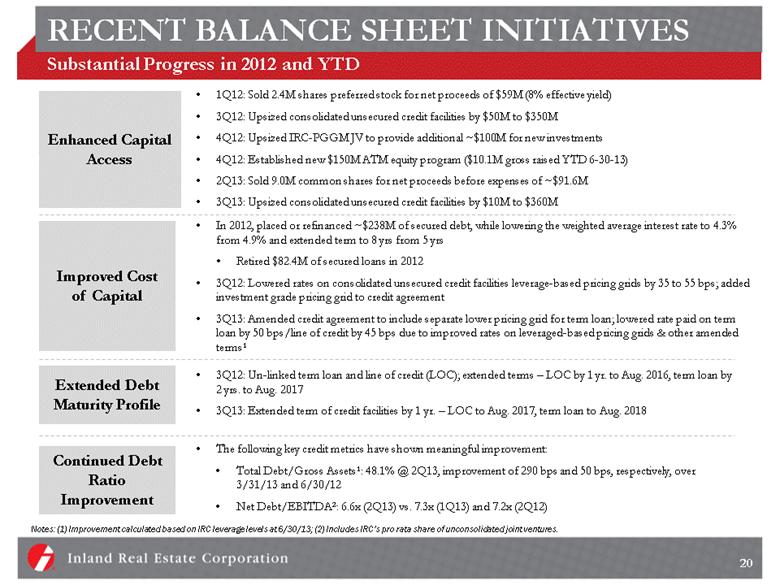
RECENT BALANCE SHEET INITIATIVES Substantial Progress in 2012 and YTD Enhanced Capital Access 1Q12: Sold 2.4M shares preferred stock for net proceeds of $59M (8% effective yield) 3Q12: Upsized consolidated unsecured credit facilities by $50M to $350M 4Q12: Upsized IRC-PGGM JV to provide additional ~$100M for new investments 4Q12: Established new $150M ATM equity program ($10.1M gross raised YTD 6-30-13) 2Q13: Sold 9.0M common shares for net proceeds before expenses of ~$91.6M 3Q13: Upsized consolidated unsecured credit facilities by $10M to $360M Improved Cost of Capital In 2012, placed or refinanced ~$238M of secured debt, while lowering the weighted average interest rate to 4.3% from 4.9% and extended term to 8 yrs from 5 yrs Retired $82.4M of secured loans in 2012 3Q12: Lowered rates on consolidated unsecured credit facilities leverage-based pricing grids by 35 to 55 bps; added investment grade pricing grid to credit agreement 3Q13: Amended credit agreement to include separate lower pricing grid for term loan; lowered rate paid on term loan by 50 bps/line of credit by 45 bps due to improved rates on leveraged-based pricing grids & other amended terms1 Extended Debt Maturity Profile 3Q12: Un-linked term loan and line of credit (LOC); extended terms – LOC by 1 yr. to Aug. 2016, term loan by 2 yrs. to Aug. 2017 3Q13: Extended term of credit facilities by 1 yr. – LOC to Aug. 2017, term loan to Aug. 2018 Continued Debt Ratio Improvement The following key credit metrics have shown meaningful improvement: Total Debt/Gross Assets1: 48.1% @ 2Q13, improvement of 290 bps and 50 bps, respectively, over 3/31/13 and 6/30/12 Net Debt/EBITDA2: 6.6x (2Q13) vs. 7.3x (1Q13) and 7.2x (2Q12) 20 Notes: (1) Improvement calculated based on IRC leverage levels at 6/30/13; (2) Includes IRC’s pro rata share of unconsolidated joint ventures. |
|
|
CONSOLIDATED DEBT MATURITIES Well-Balanced Debt Maturity Profile Consolidated Debt as of 9/3/13 Notes: Consolidated debt as of 9/3/13, with Unsecured Credit Facilities depicted pro forma closing of amended credit facilities agreement on 8/23/13. Secured debt includes principal amortization through maturity; 2013 includes $90.2M of secured debt for Algonquin Commons. $149.0 $230.0 $93.1 21 Secured Debt Term Loan – Wells Fargo Term Loan – Bank Group $100.8 $63.9 $36.8 $43.0 $49.0 $40.4 $70.3 $42.1 $64.5 $11.9 $29.2 $50.0 $180.0 $100.0 2013 2014 2015 2016 2017 2018 2019 2020 2021 2022 2023 Line of Credit Convertible Notes |

|
|
INVESTMENT SUMMARY Assets repositioned with best-in-class retailers Portfolio positioned to provide consistent & dependable income growth Redeveloping assets to meet retailer appetite for new stores Reinvigorated portfolio primed for growth Provides enhanced liquidity & flexibility Progress on reducing cost of debt & extending maturity profile Long term goals: lower overall leverage & secure investment grade status Executing long term capital plan Selling noncore assets & investing proceeds in acquisitions with greater growth potential Leveraging capital-efficient joint ventures to grow portfolio & income Implementing effective growth strategy 22 |
|
|
EXPERIENCED LEADERSHIP TEAM Management Inland Tenure Background / Experience Mark Zalatoris President & CEO 28 yrs. Appointed president & CEO April 2008; EVP & COO 2004-2008; SVP & CFO 1994-2004; extensive knowledge of portfolio Brett Brown Executive Vice President & Chief Financial Officer 9 yrs. (15 yrs. at Great Lakes REIT) Extensive capital markets & public company reporting experience; former Great Lakes REIT SVP, Financial Reporting Scott Carr EVP & Chief Investment Officer, IRC; President, Inland Commercial Property Management Inc. (IRC subsidiary) 25 yrs. Has overseen property management operations since 1994; strong retailer relationships William Anderson Senior Vice President, Transactions 26 yrs. Skilled at analyzing, negotiating retail center acquisitions & dispositions Senior Management Team Averages 25+ Years Real Estate Experience 23 |
|
|
FORWARD-LOOKING STATEMENTS Certain statements in this presentation constitute "forward-looking statements" within the meaning of the Federal Private Securities Litigation Reform Act of 1995. These forward-looking statements are not historical facts but are the intent, belief or current expectations of our management based on their knowledge and understanding of the business and industry, the economy and other future conditions. These statements are not guarantees of future performance, and investors should not place undue reliance on forward-looking statements. Actual results may differ materially from those expressed or forecasted in the forward-looking statements due to a variety of risks, uncertainties and other factors, including but not limited to the factors listed and described under “Risk Factors” in our Annual Report on Form 10-K for the year ended December 31, 2012 as may be updated or supplemented by our Form 10-Q filings. These factors include, but are not limited to: market and economic challenges experienced by the U.S. economy or real estate industry as a whole, including dislocations and liquidity disruptions in the credit markets; the inability of tenants to continue paying their rent obligations due to bankruptcy, insolvency or a general downturn in their business; competition for real estate assets and tenants; impairment charges; the availability of cash flow from operating activities for distributions and capital expenditures; our ability to refinance maturing debt or to obtain new financing on attractive terms; future increases in interest rates; actions or failures by our joint venture partners, including development partners; and other factors that could affect our ability to qualify as a real estate investment trust. We undertake no obligation to update or revise forward-looking statements to reflect changed assumptions, the occurrence of unanticipated events or changes to future operating results. 24 |