Attached files
| file | filename |
|---|---|
| EX-23.1 - EX-23.1 - Textura Corp | a2216555zex-23_1.htm |
| EX-23.2 - EX-23.2 - Textura Corp | a2216555zex-23_2.htm |
Use these links to rapidly review the document
TABLE OF CONTENTS
INDEX TO FINANCIAL STATEMENTS
As filed with the Securities and Exchange Commission on September 10, 2013
Registration No. 333-
UNITED STATES
SECURITIES AND EXCHANGE COMMISSION
Washington, D.C. 20549
Form S-1
REGISTRATION STATEMENT
UNDER
THE SECURITIES ACT OF 1933
Textura Corporation
(Exact name of registrant as specified in its charter)
| Delaware (State or other jurisdiction of incorporation or organization) |
7372 (Primary Standard Industrial Classification Code Number) |
26-1212370 (I.R.S. Employer Identification Number) |
1405 Lake Cook Road
Deerfield, IL 60015
(847) 457-6500
(Address, including zip code and telephone number, including area code, of registrant's principal executive offices)
Patrick J. Allin
Chief Executive Officer
1405 Lake Cook Road
Deerfield, IL 60015
(847) 457-6500
(Name, address, including zip code and telephone number, including area code, of agent for service)
| Copies to: | ||
| David A. Schuette Mayer Brown LLP 71 South Wacker Drive Chicago, IL 60606 (312) 782-0600 |
Christopher D. Lueking Latham & Watkins LLP 233 South Wacker Drive, Suite 5800 Chicago, IL 60606 (312) 876-7700 |
|
Approximate date of commencement of proposed sale to the public:
As soon as practicable after this Registration Statement becomes effective.
If any of the securities being registered on this Form are to be offered on a delayed or continuous basis pursuant to Rule 415 under the Securities Act of 1933 check the following box: o
If this Form is filed to register additional securities for an offering pursuant to Rule 462(b) under the Securities Act, please check the following box and list the Securities Act registration statement number of the earlier effective registration statement for the same offering. o
If this Form is a post-effective amendment filed pursuant to Rule 462(c) under the Securities Act, check the following box and list the Securities Act registration statement number of the earlier effective registration statement for the same offering. o
If this Form is a post-effective amendment filed pursuant to Rule 462(d) under the Securities Act, check the following box and list the Securities Act registration statement number of the earlier effective registration statement for the same offering. o
Indicate by check mark whether the registrant is a large accelerated filer, an accelerated filer, a non-accelerated filer, or a smaller reporting company. See the definitions of "large accelerated filer," "accelerated filer" and "smaller reporting company" in Rule 12b-2 of the Exchange Act. (Check One):
| Large accelerated filer o | Accelerated filer o | Non-accelerated filer ý (Do not check if a smaller reporting company) |
Smaller reporting company o |
CALCULATION OF REGISTRATION FEE
|
||||||||
| Title of Securities Being Registered |
Amount to be Registered(1) |
Estimated Maximum Offering Price Per Share(2) |
Estimated Maximum Aggregate Offering Price(1)(2) |
Amount of Registration Fee |
||||
|---|---|---|---|---|---|---|---|---|
Common Stock $0.001 par value per share |
4,600,000 | $40.02 | $184,092,000 | $25,111 | ||||
|
||||||||
- (1)
- Includes
600,000 shares of common stock that the underwriters have the option to purchase to cover over-allotments, if any.
- (2)
- Estimated solely for the purpose of calculating the registration fee pursuant to Rule 457(c) of the Securities Act of 1933, as amended, based on the average of the high and low sales prices of the registrant's Common Stock on September 4, 2013.
The registrant hereby amends this registration statement on such date or dates as may be necessary to delay its effective date until the registrant shall file a further amendment that specifically states that this registration statement shall thereafter become effective in accordance with Section 8(a) of the Securities Act of 1933, as amended, or until this registration statement shall become effective on such date as the Commission, acting pursuant to said Section 8(a), may determine.
The information in this prospectus is not complete and may be changed. We and the selling stockholders may not sell these securities until the registration statement filed with the Securities and Exchange Commission is effective. This prospectus is not an offer to sell these securities and we and the selling stockholders are not soliciting an offer to buy these securities in any state where the offer or sale is not permitted.
SUBJECT TO COMPLETION, DATED SEPTEMBER 10, 2013
4,000,000 Shares

Textura Corporation
Common Stock
We are selling 1,000,000 shares of common stock and the selling stockholders are selling 3,000,000 shares of common stock in this offering. We will not receive any proceeds from the sale of shares to be offered by the selling stockholders. Our common stock is listed on the New York Stock Exchange under the symbol "TXTR." On September 9, 2013, the last reported sale price of our shares on the New York Stock Exchange was $42.40.
The underwriters have an option to purchase a maximum of 600,000 additional shares to cover over-allotments of shares.
We are an "emerging growth company" as defined under the federal securities laws and, as such, may elect to comply with certain reduced public company reporting requirements.
Investing in our common stock involves risks. See "Risk Factors" beginning on page 11.
| |
Per Share | Total | |||||
|---|---|---|---|---|---|---|---|
Public Offering Price |
$ | $ | |||||
Discounts and commissions to underwriters(1) |
$ | $ | |||||
Offering proceeds to Textura Corporation, before expenses |
$ | $ | |||||
Offering proceeds to selling stockholders, before expenses |
$ | $ | |||||
- (1)
- See "Underwriting" for additional information regarding underwriting compensation.
Delivery of the shares of common stock will be made on or about September , 2013.
Neither the Securities and Exchange Commission nor any state securities commission has approved or disapproved of these securities or determined if this prospectus is truthful or complete. Any representation to the contrary is a criminal offense.
| Credit Suisse | William Blair |
| JMP Securities | Oppenheimer & Co. | Barrington Research |
The date of this prospectus is September , 2013.
You should rely only on the information contained in this prospectus or contained in any related free writing prospectus filed by us with the Securities and Exchange Commission. We, the underwriters and the selling stockholders have not authorized anyone to provide you with additional information or information that is different from that contained in this prospectus or contained in any related free writing prospectus filed by us with the Securities and Exchange Commission. This document may only be used where it is legal to sell these securities. The information in this document may only be accurate on the date of this document.
Information contained in our website does not constitute part of this prospectus.
i
This summary highlights information contained elsewhere in this prospectus and does not contain all of the information that you should consider in making your investment decision. Before investing in our common stock, you should carefully read this entire prospectus, including our consolidated financial statements and related notes included elsewhere in this prospectus and the information set forth under the headings "Risk Factors," "Selected Consolidated Financial Data" and "Management's Discussion and Analysis of Financial Condition and Results of Operations." Unless the context requires otherwise, the words "Textura Corporation," "Textura," "we," "our company," "us" and "our" refer to Textura Corporation, a Delaware corporation, and its subsidiaries. Unless otherwise indicated, all numbers of shares, per share amounts and share prices related to our common stock in this prospectus reflect the 2 for 1 stock split in the form of a stock dividend declared on March 28, 2013.
Overview
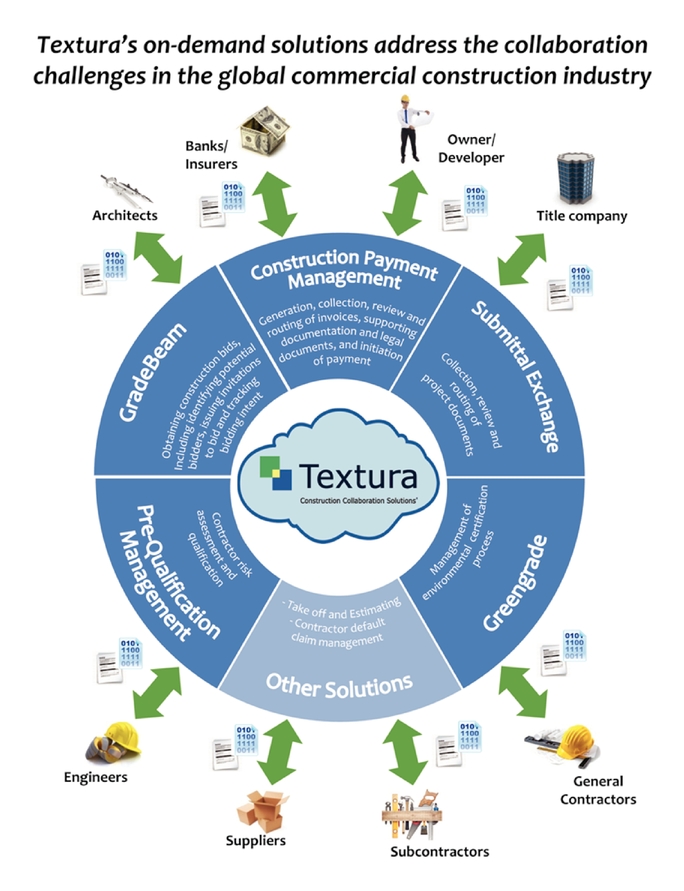
We are a leading provider of on-demand business collaboration software to the commercial construction industry. Our solutions are focused on facilitating collaboration between owners/developers, general contractors and subcontractors. Our solutions increase efficiency, enable better risk management, and provide improved visibility and control of construction activities for our clients.
Our collaboration solutions offer robust functionality, data sharing and exchange capabilities, and workflow tools that support several mission-critical business processes at various stages of the construction project lifecycle:
- •
- Construction Payment Management ("CPM") enables the generation, collection, review and routing of invoices and the
necessary supporting documentation and legal documents, and initiation of payment of invoices.
- •
- Submittal Exchange enables the collection, review and routing of project documents.
- •
- GradeBeam supports the process of obtaining construction bids, including identifying potential bidders, issuing
invitations-to-bid and tracking bidding intent.
- •
- Pre-Qualification Management ("PQM") supports contractor risk assessment and qualification.
- •
- Greengrade facilitates the management of environmental certification processes.
In addition, we offer PlanSwift, a take-off and estimating solution used in preparing construction bids, and Contractor Default Claims Management, which supports the process of documenting a subcontractor default insurance claim.
Each of our collaboration solutions was designed from inception as a software-as-a-service ("SaaS") solution with an on-demand architecture. Our collaboration solutions each use a single code base and we do not customize our solutions for any of our clients. Our technology platform is designed to be highly configurable, scalable, reliable and secure.
We believe we are a leading example of a new generation of on-demand software solutions focused on enablement of business-to-business collaborative processes. Such solutions are by design on-demand, as they require neutral third parties to act as the platform for collaboration by multiple parties and to facilitate the exchange of data and documents.
We believe the construction industry represents a large and growing market for technology solutions of all types. The industry, we believe, is especially attractive for our solutions and our growth because it is underpenetrated by technology solutions that enable construction industry participants to more easily collaborate and operate more effectively. We have established a strong market position serving this industry. As of June 30, 2013, since the date of launch or acquisition of our solutions, our clients have used one or more of our on-demand collaboration solutions to help manage over 15,000
1
commercial construction projects representing more than $140 billion in construction value as reported by our clients. Our collaboration solutions have been used by more than 3,000 general contractors, owners/developers, and architects. This includes 62 of the 100 largest general contractors in North America, ranked as of May 2013 by Engineering News-Record based on annual construction revenues. In addition, based on management estimates, approximately 300,000 subcontractors were active on our solutions during fiscal 2012. Our solutions are used on construction projects of all sizes, from small remodels or renovations to multi-billion dollar developments.
We have achieved significant growth since introducing our solutions to the market. In the fiscal years ended September 30, 2010, 2011 and 2012, we generated revenue of $6.0 million, $10.5 million and $21.7 million, respectively, which represented growth over the prior period of 90.0%, 74.7% and 106.2%, respectively. During the nine months ended June 30, 2012 and 2013, we generated revenue of $15.4 million and $24.7 million, respectively, representing an increase of 60.7% year over year. We had net losses of $15.9 million, $18.9 million, $18.8 million, $14.3 million and $31.3 million, respectively, in the fiscal years ended September 30, 2012, 2011 and 2010 and in the nine months ended June 30, 2012 and 2013. As of June 30, 2013, we had an accumulated deficit of $169.9 million.
On June 12, 2013, we completed an initial public offering of 5,750,000 shares of common stock, including 750,000 shares sold pursuant to the underwriters' option to purchase additional shares, at an offering price of $15.00 per share. We received proceeds from the initial public offering of $80.2 million net of underwriting discounts and commissions but before other offering costs of $2.5 million.
Our Industry
Construction is a major global industry and consists of building new structures, making additions and modifications to existing structures, as well as conducting maintenance, repair and improvements on existing structures. Worldwide construction spending was $8.6 trillion in 2012, according to "Global Construction 2025," a study produced by Global Construction Perspectives, an industry research provider. A total of $153.9 trillion will be spent on construction worldwide during the period from 2012 to 2025, and in 2025 construction is expected to reach more than $15 trillion in annual spending and account for 13.5% of world GDP, according to the same study.
We believe the outlook for the construction industry is strong. The industry currently continues to be impacted in certain markets across the globe by slow economic recovery from the global financial crisis, oversupply of occupiable space, and limited availability of credit. However, long-term trends of population growth, deteriorating infrastructure and changing needs for buildings—driven by both socioeconomic and technological changes—all imply a continuing and growing need for construction activity. In certain markets, including our core markets in North America, the industry's growth rate also is benefitting as a result of the recovery from the factors described above. Overall, global construction spending is expected to grow at a compounded annual growth rate of 4.3% from 2012 to 2025, according to Global Construction Perspectives.
Each construction project requires a complex collaborative effort between the many different participants that play a part throughout or at different stages of the project's lifecycle. The practices used by the industry to manage this complexity have been largely manual, paper-based and inefficient, or have relied on technology solutions not designed for collaboration. As a result, we believe participants face numerous challenges collaborating on construction projects, including significant administrative overhead burdens; disparate standards, procedures and systems; lack of workflow discipline and control; inefficient process coordination; errors, inconsistencies and omissions; limited risk management tools; and siloed applications and data repositories. Furthermore, the industry is changing in response to the many issues it faces, including those resulting from the global financial crisis, new approaches to project delivery and an increased focus on risk management, transparency and efficiency.
2
In order to meet these challenges and as companies seek to support growth while limiting costs, we believe industry participants are increasingly adopting software solutions that can also increase visibility into and control over critical stages of the construction lifecycle. We believe software solutions delivered on an on-demand basis and by a neutral third party are necessary to meet this demand. Such solutions can facilitate the exchange of data and information in a cost-effective, flexible, scalable and secure manner.
We believe therefore there is a significant opportunity to offer comprehensive on-demand collaboration software solutions that are designed to address the evolving needs of the construction industry as it responds to the many challenges it faces and seeks to achieve greater operational and financial efficiencies, better manage risk and grow significantly over the next decade and beyond.
Our Solution
Our on-demand business collaboration software solutions address the several challenges associated with the traditional paper-based and personnel-intensive manual approaches or with technology solutions not designed for collaborative processes, and support many of the trends currently occurring within the commercial construction industry. We believe our solutions benefit our clients because they are:
- •
- Designed specifically for collaborative processes. Our
collaboration solutions facilitate the sharing and exchange of data between and within organizations and provide robust workflow tools to ensure that necessary steps are carried out in the right
sequence by appropriately authorized users.
- •
- Developed to meet the needs of the construction
industry. Our solutions are built to meet the unique requirements of the construction industry and our delivery capabilities have been
organized around the specialized needs of our clients.
- •
- Delivered through a trusted and neutral third party. We
host, provide access to and facilitate the exchange of information, enabling project participants to achieve a common and transparent view of project status.
- •
- Valuable to all participants. Our solutions are designed
to reduce costs, manage risk and improve visibility and decision-making for each participant independent of their specific role or responsibility.
- •
- Interfaced with existing enterprise systems. Our solutions
leverage and protect our clients' existing investments, facilitate their business processes and reduce or eliminate duplicate data entry.
- •
- Easy to implement, use and adopt. Our solutions can be
configured by our clients to meet their specific needs without needing customization, and can be rapidly implemented by our clients across their organizations.
- •
- Accompanied by high levels of training and support to all users. Our client services team provides extensive on-site training for enterprise clients and unlimited remote live support for all end-users.
Our Key Business Attributes
Key attributes of our business include the following:
- •
- Large, attractive market. The construction industry affords us a large market in which to sell our solutions and we believe it is currently underutilizing on-demand business collaboration software solutions.
3
- •
- Next-generation approach to solving the challenges facing our
clients. We believe ours is a disruptive approach to solving business-to-business collaboration challenges and also can be applied to
many processes and industries.
- •
- High recurrence of fees, favorable timing of cash flow and predictable reported
revenue. Our revenue is derived primarily from fees driven by construction project activity and from monthly fees. We increase revenue
both as we add clients and our clients increase the number of their projects on our solutions. We historically have experienced high recurrence of fees, favorable timing of cash flow and predictable
reported revenue.
- •
- Highly defensible market position. We believe our industry
expertise, leading market share, large installed base and strong intellectual property portfolio represent significant barriers to successful competitive entry.
- •
- Ability to differentiate through our business and technology
approach. We believe we are uniquely positioned to integrate our solutions with other enterprise software and support our solutions with
a strong client service capability, and that we have the resources to support significant investment.
- •
- Focus on quality of service. Our solutions support mission-critical processes and time-sensitive interactions and communications, which require timely and accurate client support. Client service and support is a cornerstone of our value proposition, and we believe it is a significant element of our long-term success.
Our Strategy
We intend to leverage our existing solutions and industry presence to become the industry standard for collaboration solutions in the construction industry, both domestically and in targeted international markets. The key elements of our strategy to accomplish these objectives are as follows:
- •
- Increase our market penetration of the construction
industry. We intend to actively pursue new client relationships with owners/developers, general contractors and subcontractors that do
not currently use our solutions. We intend to focus our existing sales and marketing capabilities on large, strategic owners/developers and general contractors, as they can generate significant,
multi-year growth. At the same time, we plan to launch solution and channel initiatives that target smaller industry participants in a cost-effective fashion.
- •
- Expand our suite of solutions. We plan to continue to use
our domain expertise in construction and to work closely with our clients to identify and develop new applications, features and functionality that address business processes we currently do not
support.
- •
- Pursue acquisitions of complementary businesses. We
believe that acquisitions of complementary businesses can help us expand our suite of solutions more rapidly, enter into new markets, expand our client base and increase the knowledge and skill sets
within our organization. We believe we can enhance the value of these solutions through our financial, technical and other resources, industry presence and their integration into our existing suite of
solutions.
- •
- Increase our client penetration. We believe we have a
significant opportunity to cross-sell to our existing clients both our current and our future solutions, and increase the utilization or adoption of our solutions to include a greater number of their
projects. We also plan to integrate both our current and our future solutions into a single platform solution, which we believe will significantly increase the value of our solutions and drive
increased adoption of multiple solutions by our clients.
- •
- Expand globally. We believe a substantial opportunity exists to grow sales of our solutions globally. To date, substantially all of our revenue has been generated from clients located in the
4
- •
- Increase the number of industries we serve. Our solutions are designed for complex collaborative environments with significant subcontracting activity. We believe that these characteristics exist in several industries in addition to the construction industry. While we currently do not operate in these other industries, we believe based on our research that there could be demand for our solutions in these other industries.
United States and Canada. However, in certain markets, due to local business practices and regulations, we believe our value proposition could be even stronger than in our established markets in North America. Certain of our large current and potential construction clients also have or are seeking to establish international operations, and have indicated their interest that we support their current or planned international operations, especially as they seek new growth opportunities outside their traditional North American markets. We believe we have accumulated significant experience with the process necessary to enter new markets successfully.
Our Sales Approach
We generally market and sell our solutions directly to our clients. Our solutions generally provide significantly greater benefits if deployed to manage all of a client's related construction activities, which requires buy-in and commitment at the highest levels of our clients' organizations. In our experience, this requires an in-person, relationship-driven, consultative approach with a high degree of solution and domain expertise on the part of our employees. Certain of our solutions or clients, however, are effectively sold and supported remotely, primarily over the phone and using email, webinars and other appropriate methods. We intend to grow our remote sales and support capability significantly in order to address the market opportunity we believe is available to us, as well as to support new solutions and segment initiatives.
Risks Affecting Us
Our business is subject to a number of risks, which could materially and adversely affect our business, financial condition, results of operations and prospects. You should consider carefully these risks before making an investment decision. These risks are described more fully in the "Risk Factors" section beginning on page 11 and include, but are not limited to, the following:
- •
- we have a history of losses and we do not expect to be profitable for the foreseeable future;
- •
- we may be adversely affected by conditions in the global and domestic economy or a downturn in the construction industry;
- •
- we may not be able to execute our growth strategy including expanding into international markets, successfully acquiring
complementary businesses or entering into new industries;
- •
- we may not succeed in developing the market for our solutions;
- •
- we derive a significant portion of our revenue from a relatively limited number of large client relationships and from a
single software solution; and
- •
- we may be adversely affected if our solutions fail to perform properly.
Recent Developments
In March 2013, we entered into a non-binding letter of intent related to a potential software development arrangement with an existing client. This development arrangement would result in our company acquiring certain intellectual property rights from the client in connection with the further joint development of these intellectual property rights for use by the client and subsequent commercialization by us in the form of a new collaboration solution for the construction market. Over the past few months, we have conducted due diligence with respect to these intellectual property rights
5
and are in the process of negotiating terms of a definitive agreement. We expect that if a definitive agreement is reached, we will issue shares of our common stock with a value of approximately $16 million in consideration for the transfer of the intellectual property rights and the joint development obligations of the client. In addition, we expect that if a definitive agreement is reached, we would pay royalties on certain commercial sales of the new collaboration solution for a ten-year period. This development arrangement is subject to further due diligence by us and the client and the parties' negotiation and agreement to acceptable terms of a definitive agreement. Accordingly, the terms described above are subject to change.
Corporate Information
Our business was founded in 2004 and we were incorporated in Delaware in 2007. Our principal executive offices are located at 1405 Lake Cook Road, Deerfield, IL 60015, and our telephone number is (847) 457-6500. Our website address is www.texturacorp.com. Information contained on our website is not incorporated by reference into this prospectus, and should not be considered to be part of this prospectus.
"Textura," "Textura Construction Payment Management," "Submittal Exchange," "GradeBeam," "Greengrade" and "PlanSwift" are registered trademarks or logos appearing in this prospectus and are the property of Textura Corporation or one of our subsidiaries. All other trademarks, service marks and trade names in this prospectus are the property of their respective owners.
6
The Offering
Common stock we are offering |
1,000,000 shares | |
Common stock offered by the selling stockholders |
3,000,000 shares |
|
Common stock to be outstanding after this offering |
23,798,588 shares (24,398,588 shares if the over-allotment option is exercised in full) |
|
Use of proceeds |
We currently intend to use the net proceeds received by us from this offering for financing our growth, working capital and other general corporate purposes. In addition, we believe that opportunities may exist from time to time to expand our current business through acquisitions of, or investments in, complementary companies, products or technologies. Other than as described in "—Recent Developments," we have no current agreements, commitments or understandings for any specific acquisitions or investments at this time. However, we may use a portion of the net proceeds for these purposes in the future. We will not receive any proceeds from the sale of shares of common stock by selling stockholders. |
|
Underwriters' option to purchase additional shares |
The underwriters have an option to purchase a maximum of 600,000 additional shares of common stock from us to cover over-allotments. The underwriters could exercise this option at any time within 30 days from the date of this prospectus. |
|
Risk Factors |
See "Risk Factors" and other information included in this prospectus for a discussion of factors you should carefully consider before deciding to invest in our common stock. |
|
New York Stock Exchange symbol |
"TXTR" |
The number of shares of common stock that will be outstanding after this offering is based on the number of shares outstanding as of June 30, 2013 and excludes:
- •
- 696,384 shares of common stock issuable upon settlement of restricted stock units outstanding as of June 30,
2013;
- •
- 3,428,601 shares of common stock issuable upon the exercise of stock options outstanding as of June 30,
2013, with a weighted average exercise price of approximately $14.14 per share;
- •
- 1,332,593 shares of common stock issuable upon the exercise of warrants to purchase common stock outstanding as of
June 30, 2013, with a weighted average exercise price of approximately $14.71 per share; and
- •
- 4,906,393 shares of common stock reserved for future awards under our 2013 Long Term Incentive Plan.
Unless otherwise indicated, all information in this prospectus assumes no exercise by the underwriters of their over-allotment option to purchase up to 600,000 additional shares of common stock from us.
7
Summary Consolidated Financial Data
The following summary consolidated financial data should be read together with "Use of Proceeds," "Selected Consolidated Financial Data," "Management's Discussion and Analysis of Financial Condition and Results of Operations" and the consolidated financial statements and related notes included elsewhere in this prospectus. We derived the summary consolidated statement of operations data for each of the years ended September 30, 2010, 2011 and 2012 and the summary consolidated balance sheet data as of September 30, 2012 from our audited consolidated financial statements included elsewhere in this prospectus. We derived the summary consolidated statement of operations data for the nine months ended June 30, 2012 and 2013 and the summary consolidated balance sheet data as of June 30, 2013 from our unaudited condensed consolidated financial statements included elsewhere in this prospectus. The unaudited condensed consolidated financial statements were prepared on a basis consistent with our audited consolidated financial statements and include, in the opinion of management, all adjustments, consisting of only normal recurring adjustments, necessary for a fair statement of the financial information contained in those statements. Our historical results are not necessarily indicative of the results that may be expected in the future.
| |
Years Ended September 30, | Nine Months Ended June 30, |
||||||||||||||
|---|---|---|---|---|---|---|---|---|---|---|---|---|---|---|---|---|
| |
2010 | 2011 | 2012 | 2012 | 2013 | |||||||||||
| |
(in thousands, except per share data) |
|||||||||||||||
Consolidated Statement of Operations Data: |
||||||||||||||||
Revenue(1) |
$ | 6,020 | $ | 10,514 | $ | 21,681 | $ | 15,362 | $ | 24,681 | ||||||
Operating expense: |
||||||||||||||||
Cost of services(2) |
4,187 | 4,395 | 6,152 | 4,361 | 8,222 | |||||||||||
General and administrative |
5,654 | 6,856 | 11,105 | 8,180 | 17,074 | |||||||||||
Sales and marketing |
3,122 | 2,601 | 5,995 | 4,162 | 9,535 | |||||||||||
Technology and development |
4,747 | 6,169 | 11,123 | 8,433 | 13,703 | |||||||||||
Depreciation and amortization |
2,621 | 2,161 | 4,080 | 3,018 | 3,167 | |||||||||||
Total operating expense |
20,331 | 22,182 | 38,455 | 28,154 | 51,701 | |||||||||||
Loss from operations |
(14,311 | ) | (11,668 | ) | (16,774 | ) | (12,792 | ) | (27,020 | ) | ||||||
Other expense, net |
(1,612 | ) | (7,260 | ) | (2,019 | ) | (1,502 | ) | (4,055 | ) | ||||||
Loss before income taxes |
(15,923 | ) | (18,928 | ) | (18,793 | ) | (14,294 | ) | (31,075 | ) | ||||||
Income tax provision |
— | — | — | — | 226 | |||||||||||
Net loss |
(15,923 | ) | (18,928 | ) | (18,793 | ) | (14,294 | ) | (31,301 | ) | ||||||
Less: Net loss attributable to non-controlling interests |
— | — | (2,866 | ) | (1,966 | ) | (2,643 | ) | ||||||||
Net loss attributable to Textura Corporation |
(15,923 | ) | (18,928 | ) | (15,927 | ) | (12,328 | ) | (28,658 | ) | ||||||
Accretion (decretion) of redeemable Series A-1 preferred stock |
(19,802 | ) | 11,486 | 3,373 | 656 | 3,549 | ||||||||||
Accretion of redeemable non-controlling interest |
— | — | — | — | 222 | |||||||||||
Dividends on Series A-2 preferred stock |
480 | 480 | 480 | 360 | 335 | |||||||||||
Undistributed earnings allocated to participating securities |
1,506 | — | — | — | — | |||||||||||
Beneficial conversion of Series A-2 preferred stock |
— | — | — | — | 7,161 | |||||||||||
Net income (loss) available to Textura Corporation common stockholders |
$ | 1,893 | $ | (30,894 | ) | $ | (19,780 | ) | $ | (13,344 | ) | $ | (39,925 | ) | ||
Net income (loss) available to Textura Corporation common stockholders, basic and diluted |
$ | 1,893 | $ | (30,894 | ) | $ | (19,780 | ) | $ | (13,344 | ) | $ | (39,925 | ) | ||
Net income (loss) per share available to Textura Corporation common stockholders: |
||||||||||||||||
Basic |
$ | 0.27 | $ | (4.18 | ) | $ | (2.31 | ) | $ | (1.56 | ) | $ | (3.87 | ) | ||
Diluted |
$ | 0.26 | $ | (4.18 | ) | $ | (2.31 | ) | $ | (1.56 | ) | $ | (3.87 | ) | ||
Weighted average number of common shares outstanding: |
||||||||||||||||
Basic |
6,942 | 7,392 | 8,548 | 8,544 | 10,315 | |||||||||||
Diluted |
7,166 | 7,392 | 8,548 | 8,544 | 10,315 | |||||||||||
8
| |
Years Ended September 30, | Nine Months Ended June 30, |
||||||||||||||
|---|---|---|---|---|---|---|---|---|---|---|---|---|---|---|---|---|
| |
2010 | 2011 | 2012 | 2012 | 2013 | |||||||||||
| |
(dollars in thousands, except where otherwise indicated) |
|||||||||||||||
Operational Data: |
||||||||||||||||
Activity-driven revenue |
$ | 5,705 | $ | 9,875 | $ | 19,064 | $ | 13,484 | $ | 19,773 | ||||||
Organization-driven revenue |
315 | 639 | 2,617 | 1,878 | 4,908 | |||||||||||
Total revenue |
$ | 6,020 | $ | 10,514 | $ | 21,681 | $ | 15,362 | $ | 24,681 | ||||||
Activity-driven revenue: |
||||||||||||||||
Number of projects added |
1,898 | 2,475 | 4,167 | 2,989 | 3,741 | |||||||||||
Client-reported construction value added (billions) |
$ | 18.4 | $ | 19.4 | $ | 33.8 | $ | 25.7 | $ | 32.3 | ||||||
Active projects during period |
2,783 | 3,952 | 6,393 | 5,265 | 7,666 | |||||||||||
Organization-driven revenue: |
||||||||||||||||
Number of organizations |
151 | 945 | 5,204 | 4,594 | 8,210 | |||||||||||
Adjusted EBITDA(3) |
$ | (9,565 | ) | $ | (8,031 | ) | $ | (9,346 | ) | $ | (7,081 | ) | $ | (8,760 | ) | |
Deferred revenue balance as of the end of period |
$ | 2,396 | $ | 5,279 | $ | 14,166 | $ | 12,457 | $ | 18,765 | ||||||
| |
June 30, 2013 | ||||||
|---|---|---|---|---|---|---|---|
| |
Actual | As adjusted(5) | |||||
| |
(in thousands) |
||||||
Consolidated Balance Sheet Data: |
|||||||
Cash |
$ | 68,627 | $ | ||||
Property and equipment, net |
18,701 | ||||||
Goodwill and other intangibles |
34,158 | ||||||
Total assets |
127,035 | ||||||
Deferred revenue, current and long-term |
18,765 | ||||||
Total debt, current and long-term(4) |
11,776 | ||||||
Total Textura Corporation stockholders' equity |
86,550 | ||||||
- (1)
- The
acquisitions of GradeBeam and Submittal Exchange contributed $4.9 million and $3.3 million of revenue for the fiscal year ended
September 30, 2012 and the nine months ended June 30, 2012, respectively. The acquisition of PlanSwift contributed $2.5 million of revenue for the nine months ended
June 30, 2013.
- (2)
- Cost
of services is exclusive of depreciation and amortization, which is shown separately below.
- (3)
- Adjusted
EBITDA represents loss before interest, taxes, depreciation and amortization, share-based compensation expense, acquisition-related expense and
initial public offering-related expense. Adjusted EBITDA is not determined in accordance with accounting principles generally accepted in the United States ("GAAP"), and is a performance measure used
by management in conjunction with traditional GAAP operating performance measures as part of the overall assessment of our performance including:
- •
- for planning purposes, including the preparation of the annual budget;
- •
- to evaluate the effectiveness of business strategies; and
- •
- as a factor when determining management's total compensation.
- We
believe the use of Adjusted EBITDA as an additional operating performance metric provides greater consistency for period-to-period
comparisons of our operations. For our internal analysis, Adjusted EBITDA removes fluctuations caused by changes in our capital structure (interest expense) and non-cash items such as depreciation,
amortization and share-based compensation. These excluded amounts in any given period may not directly correlate to the underlying performance of the business or may fluctuate significantly from
period to period due to the issuance or conversion of convertible debentures, acquisitions, fully amortized tangible or intangible assets, or the timing and pricing of new share-based awards. We also
believe Adjusted EBITDA is useful to investors and securities analysts in evaluating our operating performance as it provides them an additional tool to compare business performance across companies
and periods.
- Adjusted EBITDA is not a measurement under GAAP and should not be considered an alternative to net loss or as an alternative to cash flows from operating activities. The Adjusted EBITDA measurement has limitations as an analytical tool and the method of calculation may vary from company to company.
9
- The following table presents a reconciliation from the most directly comparable GAAP measure, net loss, to Adjusted EBITDA:
| |
Years Ended September 30, | Nine Months Ended June 30, |
||||||||||||||
|---|---|---|---|---|---|---|---|---|---|---|---|---|---|---|---|---|
| |
2010 | 2011 | 2012 | 2012 | 2013 | |||||||||||
| |
(in thousands) |
|||||||||||||||
Net loss |
$ | (15,923 | ) | $ | (18,928 | ) | $ | (18,793 | ) | $ | (14,294 | ) | $ | (31,301 | ) | |
Net interest expense |
1,612 | 7,260 | 2,200 | 1,634 | 4,495 | |||||||||||
Income tax provision |
— | — | — | — | 226 | |||||||||||
Depreciation and amortization |
2,621 | 2,161 | 4,080 | 3,018 | 3,167 | |||||||||||
EBITDA |
(11,690 | ) | (9,507 | ) | (12,513 | ) | (9,642 | ) | (23,413 | ) | ||||||
Share-based compensation expense |
2,125 | 1,468 | 2,676 | 2,078 | 11,228 | |||||||||||
Acquisition-related expense |
— | 8 | 491 | 483 | 414 | |||||||||||
Initial public offering-related expense* |
— | — | — | — | 3,011 | |||||||||||
Adjusted EBITDA |
$ | (9,565 | ) | $ | (8,031 | ) | $ | (9,346 | ) | $ | (7,081 | ) | $ | (8,760 | ) | |
- *
- Initial
public offering-related expense for the nine months ended June 30, 2013 represents one-time cash bonuses of $3.0 million paid to
long-tenured employees in connection with the initial public offering.
- (4)
- Total
debt, representing the current and long-term portions, includes our loan payable to related party for the purchase of land and construction of our
corporate headquarters, notes payable and leases payable.
- (5)
- The as adjusted consolidated balance sheet data gives effect to the sale by us of 1,000,000 shares of common stock in this offering based on the public offering price of $ per share, after deducting underwriting discounts and commissions and estimated offering expenses payable by us and the application of the proceeds therefrom as described in "Use of Proceeds."
10
Investing in our common stock involves a high degree of risk. You should carefully consider the risks and uncertainties described below, together with all of the other information in this prospectus, including our consolidated financial statements and related notes included elsewhere in this prospectus, before making an investment decision. If any of the following risks is realized, our business, financial condition, results of operations and prospects could be materially and adversely affected. In that event, the trading price of our common stock could decline and you could lose part or all of your investment.
Risks Related to Our Business and Industry
We have a history of cumulative losses and we do not expect to be profitable for the foreseeable future.
We have incurred significant losses in each period since our inception in 2004. We incurred net losses of $15.9 million in the fiscal year ended September 30, 2010, $18.9 million in the fiscal year ended September 30, 2011 and $18.8 million in the fiscal year ended September 30, 2012. We incurred a net loss of $31.3 million in the nine months ended June 30, 2013, and as of June 30, 2013, we had an accumulated deficit of $169.9 million. These losses and accumulated deficit reflect the substantial investments we made to acquire new enterprise client relationships and develop our solutions. We expect our operating expenses to increase in the future due to anticipated increases in research and development expenses, sales and marketing expenses, operations costs and general and administrative costs, and, therefore, we expect our losses to continue for the foreseeable future. Although our revenues have increased significantly over the past three years, you should not consider our recent growth as indicative of our future performance. We cannot assure you that we will achieve profitability in the future, nor that, if we do become profitable, we will sustain profitability.
Economic conditions of the global and domestic economy or a substantial or prolonged downturn in the commercial construction business cycle may have a material adverse effect on our business, financial condition, results of operations and prospects.
Economic trends that negatively affect the commercial construction industry may adversely affect our business by reducing the number of commercial construction projects that are occurring, the number of general contractors and subcontractors operating in our markets, or the amount that such clients spend on our solutions. The global and domestic economies currently face a number of economic challenges, including threatened sovereign defaults, credit downgrades, restricted credit for businesses and consumers and potentially falling demand for a variety of products and services. These factors have materially and adversely affected, and may continue to materially and adversely affect, the financial markets and the availability of credit for the commercial construction industry. A reduction in the number of commercial construction projects that are undertaken, the number of general contractors and subcontractors operating in our markets or the amount that clients spend on solutions due to economic conditions could have a material adverse effect on our business, financial condition, results of operations and prospects.
We have experienced rapid growth in recent periods. If we fail to effectively manage our growth, our business and operating results may suffer.
We have experienced, and expect to continue to experience, significant growth. This rapid growth has placed, and will continue to place, significant demands on our management and our operational and financial infrastructure. We intend to further expand our overall business, client base, headcount and operations, both domestically and internationally. We expect that we will be required to continue to commit substantial financial, operational and technical resources to implement our growth strategy. Continued growth could also strain our ability to maintain reliable operation of our solutions for our clients, develop and improve our operational, financial and management controls and recruit, train and retain highly skilled personnel. As our operations grow in size, scope and complexity, we will also need
11
to continue to improve and upgrade our systems and infrastructure, which will require significant expenditures and allocation of valuable management resources. If we fail to effectively manage our growth, our business, financial condition, results of operations and prospects could be materially adversely affected.
We may not succeed in developing the market for our solutions and we may face competition that is harmful to our business.
We face challenges in developing a market for our solutions and from current and potential products developed or sold by third-party competitors. Currently, our largest source of competition for CPM is from existing manual processes or internally-developed systems that our potential clients have been using for a long period of time and from which they may be reluctant to change. In addition, some competitors may address part of CPM's functional capabilities.
For our solutions other than CPM, we face current competition from both traditional, larger software vendors offering enterprise-wide software applications and services and smaller companies offering point solutions for the commercial construction industry. Our principal competitors vary depending on the solution we offer. Some of our competitors enjoy substantial competitive advantages over us, such as greater name recognition, more comprehensive and varied products and services, and substantially greater financial, technical and other resources. Certain of our competitors offer, or may in the future offer, lower priced, or free, products or services that compete with our solutions.
In addition, our industry is highly fragmented, and we believe it is likely that some of our existing competitors will consolidate or will be acquired. Some of our competitors may also enter into new alliances with each other or may establish or strengthen cooperative relationships with systems integrators, third-party consulting firms or other parties. Any such consolidation, acquisition, alliance or cooperative relationship could lead to pricing pressure, reduced profit margins and our loss of market share and could result in one or more competitors with greater financial, technical, marketing, service and other resources, all of which could have a material adverse effect on our business, financial condition, results of operations and prospects.
A significant portion of our revenue is derived from a relatively limited number of large client relationships and any loss of, or decrease in sales related to, these client relationships could harm our results of operations.
A significant portion of our revenue is derived from our relationships with a relatively limited number of large clients, either directly from those clients or from the subcontractors also working on projects that those clients control. Revenue derived from our ten largest client relationships, collectively, accounted for 41.5% of our revenue in fiscal 2012. Our largest client relationship accounted for 10.8% of our revenue in fiscal 2012. This revenue is generated from these clients' use of our CPM solution. We may continue to experience ongoing client concentration, particularly if we are successful in attracting large general contractor clients and in selling additional solutions to our existing clients. In addition, it is possible that revenue from these client relationships, either individually or as a group, may not reach or exceed historical levels in any future period or that one or more of our existing clients may stop utilizing our solutions entirely. We believe that the implementation of our CPM solution results in our clients changing their business processes in ways that make it difficult to discontinue use; however, the loss or significant reduction of business from one or more of our major client relationships would materially adversely affect our business, financial condition, results of operations and prospects.
Our business could be adversely affected if our clients are not satisfied with our solutions.
Our business model depends in large part on our ability to continue to ensure our clients' satisfaction with our solutions and their resulting decision to continue their reliance on our solutions. Our client services group is organized to provide high levels of service and support to our clients.
12
However, if a client is not satisfied with the functionality or quality of our solutions, or with the type of solutions provided, then they may elect to discontinue using our solutions for future projects or we could incur additional costs to address their dissatisfaction. In addition, negative publicity related to our client relationships or the satisfaction of our clients, regardless of its accuracy, may further damage our business by affecting our ability to compete for new enterprise relationships with prospective clients.
If our solutions fail to perform properly, our reputation could be adversely affected, our market share could decline and we could be subject to liability claims.
Our solutions are inherently complex and involve the generation and exchange of legal documentation and facilitation of financial transactions. In particular, clients using our CPM solution rely on us to properly generate lien waivers and initiate payment instructions. Our solutions may contain material defects or errors and rely in part on data entered by our clients, the accuracy of which we do not control. This may result in our solutions failing to perform as intended. Such failure may result in:
- •
- diversion of development and client service resources;
- •
- injury to our reputation;
- •
- loss of existing clients and difficulty in attracting new clients;
- •
- claims by clients that we are liable for any damages to them as a result of such defects or errors;
- •
- increased insurance costs; and
- •
- sales credits or refunds for prepaid amounts related to unused subscription services.
The costs incurred in correcting any material defects or errors or in connection with any of the consequences above might be substantial and could adversely affect our business, financial condition, results of operations and prospects.
The availability or performance of our solutions could be adversely affected by a number of factors, including clients' inability to access the Internet, the failure of our network or software systems, security breaches, variability in user traffic for our solutions or the operation of the ACH Network and other payment clearing systems. Furthermore, because of the large amount of data that we collect and manage, it is possible that hardware failures or errors in our systems could result in data loss or corruption, or cause the information that we collect to be incomplete or contain inaccuracies that our clients regard as significant.
Additionally, our clients may use our solutions together with software and hardware applications and products from other companies. As a result, when problems occur, it may be difficult to determine the cause of the problem, and our solutions, even when not the ultimate cause of the problem, may be misidentified as the problem. If our solutions are misidentified as the source of the problem, we might incur costs associated with litigation or correcting the problem, and our reputation could be damaged, resulting in a loss of clients.
Although we currently carry errors and omissions insurance, such insurance may be inadequate or may not be available in the future on acceptable terms, or at all. In addition, our policy may not cover all claims made against us, and defending a suit, regardless of its merit, could be costly and divert management's attention.
We derive a substantial portion of our revenues from a single software solution.
We derive a substantial portion of our total revenues from sales of CPM. Therefore, any factor adversely affecting sales of this solution, including market acceptance, product competition, performance and reliability, reputation, price competition, or economic and market conditions, could
13
have a disproportionally material adverse effect on our business, financial condition, results of operations and prospects.
We have a long selling cycle to secure a new enterprise relationship for CPM, which requires significant investments of resources.
We typically face a long selling cycle of a year or longer to secure a new enterprise client relationship for CPM, which typically requires significant investment of resources and time by both our clients and us. Our enterprise selling cycle is subject to many risks and delays over which we have little control, including our clients' decisions to choose alternatives to our solutions (including internally-developed solutions) and the timing of our clients' budget cycles and approval processes. Before committing to use our solutions, potential clients require us to spend time and resources educating them on the value of our solutions and assessing the feasibility of integrating our solutions with their existing technology. If a potential client does not ultimately choose our solutions, we are unable to recoup these expenses. Even where we have secured a new enterprise relationship with a general contractor or owner/developer, there are no assurances that the general contractor or owner/developer will choose to use our solutions for any or all of their current or future projects.
Our business, financial condition, results of operations and prospects may be materially adversely affected if we are unable to cross-sell our solutions.
A significant component of our growth strategy is to increase cross-selling of our solutions to current and future clients. We may not be successful in cross-selling our solutions, however, if our clients find our additional solutions to be unnecessary or unattractive. We have invested, and intend to continue to invest, significant resources in developing and acquiring additional solutions, which resources may not be recovered if we are unable to successfully cross-sell these solutions to clients using our existing solutions. Any failure to sell additional solutions to current and future clients could materially adversely affect our business, financial condition, results of operations and prospects.
We may be unable to adequately protect, and we may incur significant costs in defending, our intellectual property and other proprietary rights.
Our success depends, in part, upon our intellectual property rights. We rely upon a combination of trademark, trade secret, copyright, patent and unfair competition laws, as well as license agreements and other contractual provisions, to protect our intellectual property and other proprietary rights. In addition, we attempt to protect our intellectual property and proprietary information by requiring our employees and consultants to enter into confidentiality, non-competition and assignment of inventions agreements. To the extent that our intellectual property and other proprietary rights are not adequately protected, third parties might gain access to our proprietary information, develop and market solutions similar to ours, or use trademarks similar to ours. Existing United States federal and state intellectual property laws offer only limited protection. Moreover, the laws of Canada, Australia, New Zealand, and any other foreign countries in which we may market our solutions in the future, may afford little or no effective protection of our intellectual property. Changes in patent law, such as changes in the law regarding patentable subject matter, could also impact our ability to obtain patent protection for our solutions. In particular, recent amendments to the United States patent law became effective in 2012 and may affect our ability to protect our solutions and defend against claims of patent infringement.
In addition, patents may not be issued with respect to our pending or future patent applications, and our patents may not be upheld as valid, may be contested or circumvented or may not prevent the development of competitive solutions. If we resort to legal proceedings to enforce our intellectual property rights or to determine the validity and scope of the intellectual property or other proprietary rights of others, the proceedings could be burdensome and expensive. Such legal proceedings or reductions in the legal protection available for intellectual property rights could have a material adverse effect on our business, financial condition, results of operations and prospects, and we may not prevail.
14
We could be subject to assertions of infringement or other violations by us of intellectual property rights (whether actual or alleged), which could result in significant costs and substantially harm our business, financial condition, results of operations and prospects.
Software and technology companies are frequently subject to litigation based on allegations of infringement, misappropriation or other violations of intellectual property rights or rights related to use of technology. Some software and technology companies, whether our direct competitors or not, own large numbers of patents, copyrights, trademarks and trade secrets, which they may use to assert claims against us. Third parties may in the future assert that we have infringed, misappropriated or otherwise violated their intellectual property rights, and as we face increasing competition, the possibility of intellectual property rights claims against us grows. Such litigation may involve patent holding companies or other adverse patent owners who have no relevant product revenue, and therefore our own issued and pending patents may provide little or no deterrence to these patent owners in bringing intellectual property rights claims against us. Existing laws and regulations are evolving and subject to different interpretations, and various federal and state legislative or regulatory bodies may expand current or enact new laws or regulations. Although we believe that our solutions do not infringe upon the intellectual property rights of third parties, we cannot assure you that we are not infringing or violating any third-party intellectual property rights or rights related to use of technology.
Any intellectual property infringement or misappropriation claim or assertion against us, our clients or strategic alliance partners, and those from whom we license technology and intellectual property could have a material adverse effect on our business, financial condition, results of operations and prospects regardless of the validity or outcome. If we are forced to defend against any infringement or misappropriation claims, whether they are with or without merit, are settled out of court, or are determined in our favor, we may be required to expend significant time and financial resources on the defense of such claims. Furthermore, an adverse outcome of a dispute may require us to pay damages, potentially including treble damages and attorneys' fees, if we are found to have willfully infringed a party's intellectual property; cease making, licensing or using technology, content or material that is alleged to infringe or misappropriate the intellectual property of others; expend additional development resources to redesign our technology; enter into potentially unfavorable royalty or license agreements in order to obtain the right to use necessary technologies, content or materials; and to indemnify our partners and other third parties. Royalty or licensing agreements, if required or desirable, may be unavailable on terms acceptable to us, or at all, and may require significant royalty payments and other expenditures. In addition, any lawsuits regarding intellectual property rights, regardless of their success, could be expensive to resolve and would divert the time and attention of our management and technical personnel.
We rely on technology and intellectual property of third parties, the loss of which could limit the functionality of our solutions and disrupt our business.
We use technology and intellectual property licensed from unaffiliated third parties in certain of our solutions, and we may license additional third-party technology and intellectual property in the future. Any errors or defects in this third-party technology and intellectual property could result in errors that could harm our brand and business. In addition, licensed technology and intellectual property may not continue to be available on commercially reasonable terms, or at all. The loss of the right to use or allow our clients to use this third party technology could limit the functionality of our solutions and might require us to redesign our solutions.
Further, although we believe that there are currently adequate replacements for the third-party technology and intellectual property we presently use, the loss of our right to use any of this technology and intellectual property could result in delays in producing or providing affected solutions until equivalent technology or intellectual property is identified, licensed or otherwise procured, and integrated. Our business would be disrupted if any technology and intellectual property we license from others or functional equivalents of this software were either no longer available to us or no longer
15
offered to us on commercially reasonable terms. In either case, we would be required either to attempt to redesign our solutions to function with technology and intellectual property available from other parties or to develop these components ourselves, which would result in increased costs and could result in delays in sales and the release of new solution offerings. Alternatively, we might be forced to limit the features available in affected solutions. Any of these results could harm our business and impact our results of operations.
The use of open source software in our solutions and technology may expose us to additional risks and harm our intellectual property.
We use open source software development tools and may incorporate open source software into portions of our technology. Given the nature of open source software, third parties might assert copyright and other intellectual property infringement claims against us based on our use of certain open source software programs. The terms of many open source licenses to which we are subject have not been interpreted by United States or foreign courts, and there is a risk that those licenses could be construed in a manner that imposes unanticipated conditions or restrictions on our ability to commercialize our solutions. In that event, we could be required to seek licenses from third parties in order to continue offering our solutions, to redevelop our solutions, to discontinue sales of our solutions or to release our proprietary software code under the terms of an open source license, any of which could materially and adversely affect our business, financial condition, results of operations and prospects.
Some of our solutions use software development tools that are subject to one or more open source licenses. Open source software is typically freely accessible, usable and modifiable. Certain open source software licenses require a user who intends to distribute the open source software as a component of the user's software to disclose publicly part or all of the source code to the user's software. In addition, certain open source software licenses require the user of such software to make any derivative works of the open source code available to others on unfavorable terms or at no cost. This can subject previously proprietary software to open source license terms. In addition to risks related to license requirements, usage of open source software can lead to greater risks than use of third-party commercial software, as open source licensors generally do not provide warranties or controls on origin of the software.
While we monitor the use of all open source software in our solutions, processes and technology and try to ensure that no open source software is used in such a way as to require us to disclose the source code to the related solution when we do not wish to do so, such use may have inadvertently occurred in deploying our proprietary solutions. Additionally, if a third-party software provider has incorporated certain types of open source software into software we license from such third party for our products and solutions, we could, under certain circumstances, be required to disclose the source code to our solutions. This could harm our intellectual property position and have a material adverse effect on our business, financial condition, results of operations and prospects.
Certain of our solutions are dependent on the use and acceptance of electronic signatures, which are governed by relatively new laws and their acceptance in the commercial construction industry may not be complete.
In the United States, the enforceability of electronic transactions is primarily governed by the Electronic Signatures in Global and National Commerce Act, a federal law enacted in 2000 that largely preempts inconsistent state law, and the Uniform Electronic Transactions Act, a uniform state law that was finalized by the National Conference of Commissioners on Uniform State Laws in 1999 and has now been adopted by most states. If, in the United States or other markets where we offer our solutions, a court were to find that electronic signatures are insufficient to establish that the documents generated by our system have been signed by an authorized person, existing laws were to change, or participants in the commercial construction industry were unwilling to rely on electronic signatures, then acceptance of our solutions would be adversely affected.
16
Our business is substantially dependent on market demand for, and acceptance of, the on-demand model for the use of software in the commercial construction industry.
We sell our collaboration solutions as on-demand solutions, which are an alternative to traditional licensed hardware and software solutions, and solutions developed in-house to which many of our clients or potential clients are accustomed. Our collaboration solutions rely on the acceptance and proliferation of web-based software, which may not be widespread or happen in a timely fashion. Under the perpetual or periodic license model for software procurement, users of the software typically run applications on their hardware. Because commercial construction companies utilizing these perpetual or periodic license models may be predisposed to maintaining control of their IT systems and infrastructure, there may be resistance to the concept of accessing the functionality of software provided as a service through a third party.
Furthermore, many commercial construction companies currently conduct the business processes that our collaboration solutions support using paper-based processes and a combination of mail services, telephone, facsimile, email and the Internet. Growth in the demand for our collaboration solutions depends on the adoption of our technology-enabled commercial construction management solutions and we may not be able to persuade these prospective clients to change their traditional processes. If our collaboration solutions are not accepted by the commercial construction industry or if the market for on-demand solutions fails to grow, or grows more slowly than we currently anticipate, demand for our collaboration solutions could be negatively affected.
If we are not successful in expanding our international business, we may incur additional losses and our revenue growth could be materially adversely affected.
Our future results depend, in part, on our ability to expand into international markets. We currently operate in the United States and Canada and, effective October 2012, we entered into a joint venture to begin operations in Australia and New Zealand. We also have a number of distributor and reseller relationships for our PlanSwift solution in international markets. Our ability to expand internationally will depend upon our ability to deliver solution functionality and foreign language translations that reflect the needs of the local commercial construction industries of the international clients that we target. Our ability to expand internationally involves various risks, including the need to invest significant resources in such expansion, the possibility that returns on such investments will not be achieved in the near future or in unfamiliar competitive environments. We may also choose to conduct our international business through strategic alliances. If we are unable to identify strategic alliance partners or negotiate favorable alliance terms, our international growth may be hampered. In addition, we have incurred and may continue to incur significant expenses in advance of generating material revenues as we attempt to establish our presence in particular international markets.
Expansion internationally will also require significant attention from our management and will require us to add additional management and other resources in these markets. Our ability to expand our business and to attract talented employees and strategic alliances in an increasing number of international markets requires considerable management attention and resources and is subject to the particular challenges of supporting a rapidly growing business in an environment of multiple languages, cultures, customs, legal systems, alternative dispute systems, regulatory systems, commercial infrastructures and technology infrastructure. If we are unable to grow our international operations in a timely manner, we may incur additional losses and our revenue growth could be materially adversely affected.
As we expand internationally, our business will become more susceptible to risks associated with international operations.
We currently operate in the United States and Canada and, effective October 2012, we entered into a joint venture to begin operations in Australia and New Zealand. We also have a number of
17
distributor and reseller relationships for our PlanSwift solution in international markets. Our limited experience in operating our business outside the United States increases the risk that our current and future international expansion efforts may not be successful. In particular, our business model may not be successful in particular countries or regions outside the United States for reasons that we currently are unable to anticipate. In addition, conducting international operations subjects us to risks that we have not generally faced in the United States. These include:
- •
- fluctuations in currency exchange rates;
- •
- unexpected changes in foreign regulatory requirements;
- •
- difficulties in managing the staffing of international operations;
- •
- potentially adverse tax consequences, including the complexities of foreign value added tax systems, restrictions on the
repatriation of earnings and changes in tax rates;
- •
- dependence on strategic alliance partners to increase client acquisition;
- •
- the burdens of complying with a wide variety of foreign laws and different legal standards;
- •
- data privacy laws that require that client data be stored and processed in a designated territory;
- •
- increased financial accounting and reporting burdens and complexities;
- •
- political, social and economic instability abroad;
- •
- laws and business practices favoring local competitors;
- •
- terrorist attacks and security concerns in general; and
- •
- reduced or varied protection for intellectual property rights in some countries.
The occurrence of any one of these risks could negatively affect our international business and, consequently, our operating results. Additionally, operating in international markets requires significant management attention and financial resources. We cannot be certain that the investment and additional resources required to operate in other countries will produce desired levels of revenue or profitability.
We have made strategic acquisitions in the past and intend to do so in the future. If we are unable to find suitable acquisitions or partners or to achieve expected benefits from such acquisitions or partnerships, there could be a material adverse effect on our business, financial condition, results of operations and prospects.
As part of our ongoing business strategy to expand our suite of solutions and acquire new technology, we frequently engage in discussions with third parties regarding, and enter into agreements relating to, possible acquisitions, strategic alliances and joint ventures. In October 2011, November 2011 and January 2013, we acquired new technology, know-how and solutions through our acquisitions of GradeBeam, Submittal Exchange and PlanSwift, respectively. There may be significant competition for acquisition targets in our industry, or we may not be able to identify suitable acquisition candidates, negotiate attractive terms for acquisitions or complete acquisitions on expected timelines, or at all. If we are unable to complete strategic acquisitions or do not realize the expected benefits of the acquisitions we do complete, it could have a material adverse effect on our business, financial condition, results of operations and prospects.
Even if we are able to complete acquisitions or enter into alliances and joint ventures that we believe will be successful, such transactions are inherently risky. Significant risks to these potential transactions, as well as our acquisition of PlanSwift in January 2013, include the following:
- •
- integration and restructuring costs, both one-time and ongoing;
- •
- maintaining sufficient controls, policies and procedures;
- •
- diversion of management's attention from ongoing business operations;
18
- •
- establishing new informational, operational and financial systems to meet the needs of our business;
- •
- losing key employees of the acquired businesses;
- •
- failing to achieve anticipated synergies, including with respect to complementary products or services;
- •
- our inability to maintain the key business relationships and the reputations of the businesses we acquire;
- •
- uncertainty of entry into markets in which we have limited or no prior experience and in which competitors have stronger
market positions;
- •
- our dependence on unfamiliar affiliates and partners of the companies we acquire;
- •
- insufficient revenue to offset our increased expenses associated with acquisitions;
- •
- our responsibility for the liabilities of the businesses we acquire; and
- •
- unanticipated and unknown liabilities.
If we are not successful in completing acquisitions in the future or do not realize the expected benefits of the acquisitions we do complete, we may be required to reevaluate our acquisition strategy. We also may incur substantial expenses and devote significant management time and resources in seeking to complete acquisitions, some of which may ultimately not be consummated or not result in expected benefits. The occurrence of any of these acquisition-related risks could have a material adverse effect on our business, financial condition, results of operations and prospects.
If we are unsuccessful in increasing the number of industries we serve, our growth could be materially adversely affected.
Our future growth depends, in part, on our ability to successfully penetrate new industries. In order to grow our business, we expect to expand to other project-focused adjacent industries in which we have little or no experience, such as mining or oil and gas. Expanding into new industries may require considerable investment of technical, financial and marketing resources, the scope of which is difficult to predict. Failure to successfully enter new industries could have a material adverse effect on our business, financial condition, results of operations and prospects.
Because we recognize revenues over future periods, downturns or upturns in new sales will not be immediately reflected in our operating results and may be difficult to discern.
We generally recognize as revenue fees from clients ratably over future periods, which could be as long as twenty-nine months. As a result, a significant portion of the revenues we report in each quarter is derived from the recognition of deferred revenue relating to payments received during previous quarters. Consequently, downturns or upturns in the commercial construction industry, or increases or decreases to our new sales, in any single quarter will likely have only a small impact on our revenue results for that quarter, but will continue to affect our revenues in future quarters. Our fee model also makes it difficult for us to rapidly increase our revenues through additional sales in any period. Accordingly, the effect of changes in the commercial construction industry impacting our business or changes we experience in our new sales may not be reflected in our short-term results of operations.
We may be unable to develop and bring to market new solutions in a timely manner.
Our growth and success depends, in part, upon our ability to develop and bring to market new solutions. The length of the development cycle varies depending on the nature and complexity of a solution, the availability of development resources, solution management and other internal resources, and the role, if any, of strategic partners. The time, expense and resources associated with developing
19
and bringing to market new solutions may be greater than we anticipate and we may therefore be unable to develop and bring additional solutions to market in a timely manner or at all. The foregoing could result in a loss of market share to competitors who are able to offer these additional solutions, rejection of our solutions, damage to our reputation, loss of revenues, diversion of development resources, and increases in service and support costs, each of which could have a material adverse effect on our business, financial condition, results of operations and prospects.
The loss of key members of our senior management team could disrupt the management of our business and materially impair the success of our business.
We believe that our success depends on the continued contributions of the members of our senior management team. We rely on our executive officers and other key managers for the successful performance of our business. The loss of the services of Patrick Allin, our Chairman of the Board and Chief Executive Officer, or one or more of our other executive officers or key managers could have a material adverse effect on our business, financial condition, results of operations and prospects. Although we have employment arrangements with members of our senior management team, none of these arrangements prevents any of our employees from leaving us. The loss of any executive officer or key manager could materially impair our ability to perform successfully, including achieving satisfactory operating results and maintaining our growth.
We may fail to attract and retain qualified employees to support our operations, which could have an adverse effect on our ability to expand our business and service our clients.
We plan to continue to expand our work force to increase our client base and revenue. We believe that there is significant competition for qualified personnel with the skills and technical knowledge that we require. Our ability to achieve significant revenue growth will depend, in large part, on our success in recruiting, training and retaining sufficient numbers of personnel to support our growth. New hires require significant training and, in most cases, take significant time before they achieve full productivity. Our recent hires and planned hires may not become as productive as we expect, and we may be unable to hire or retain sufficient numbers of qualified individuals. If our recruiting, training and retention efforts are not successful or do not generate a corresponding increase in revenue, it may have a material adverse effect on our business, financial condition, results of operations and prospects.
Government regulation of the Internet and e-commerce is evolving, and unfavorable changes in or our failure to comply with regulations could harm our operating results.
The future success of our business depends upon the continued use of the Internet as a primary medium for commerce, communication and business applications. Federal, state or foreign government bodies or agencies have in the past adopted, and may in the future adopt, laws or regulations affecting the use of the Internet as a commercial medium. Changes in these laws or regulations could require us to modify our solutions in order to comply with these changes. In addition, government agencies or private organizations may begin to impose taxes, fees or other charges for accessing the Internet or commerce conducted via the Internet. These laws or charges could limit the growth of Internet-related commerce or communications generally or result in reductions in the demand for Internet-based solutions such as ours.
Our success depends on the development and maintenance of the Internet infrastructure.
The success of our collaboration solutions depends on the development and maintenance of the Internet infrastructure. This includes maintenance of a reliable network backbone with the necessary speed, data capacity and security, as well as the timely development of complementary products for providing reliable Internet access and services. The Internet has experienced, and is likely to continue to experience, significant growth in the number of users and amount of traffic. The Internet infrastructure may be unable to support such demands. In addition, increasing numbers of users,
20
increasing bandwidth requirements or problems caused by viruses, worms, malware and similar programs may harm the performance of the Internet. The Internet has experienced a variety of outages and other delays as a result of damage to portions of its infrastructure, and it could face outages and delays in the future. These outages and delays could reduce the level of Internet usage generally as well as the level of usage of our services, which could materially adversely affect our business, financial condition, results of operations and prospects.
Our future success depends on continued growth in the use of the Internet by our clients, our clients' access to the Internet and their confidence that other participants in the commercial construction industry have such access.
Because our collaboration solutions are designed to work over the Internet, our revenue growth depends on the ability of our clients and other participants in the commercial construction industry to access to the Internet. If potential clients do not have reliable access to the Internet or are not willing to use the Internet for business purposes, we will not be able to sell our collaboration solutions to them. Additionally, our potential and current clients may be reluctant to adopt or continue to use our collaboration solutions if they are not confident that other participants in the commercial construction industry have access to the Internet, as this would limit the ability of these participants to use our collaboration solutions.
Because construction sites are sometimes in remote and isolated locations, our current and potential clients may have additional reason to believe that access to the Internet by some participants in the commercial construction industry may be unreasonably difficult or impossible. The future delivery of our collaboration solutions will therefore depend, in part, on third-party Internet service providers continuing to expand the availability of Internet services, maintaining a reliable network with the necessary speed, data capacity and security, and developing complementary products and services for providing reliable and timely Internet access and services. If access to the Internet by participants in the commercial construction industry is not readily available, demand for our collaboration solutions could be negatively affected.
Interruptions or delays in the services provided by third-party data centers and/or Internet service providers could impair the delivery of our solutions and our business could suffer.
The primary data center supporting our CPM and PQM solutions is located at a third-party site in Oak Brook, Illinois. Although we maintain a backup facility at our corporate headquarters in Deerfield, Illinois, both facilities are located in the same metropolitan area and could be subject to the same damage or service interruptions that may be caused by fire, flood, severe storm, earthquake, power loss, telecommunications failures, unauthorized intrusion, system error, computer viruses and disabling devices, natural disasters, war, criminal act, military action, terrorist attack and other similar events beyond our control. A prolonged service disruption affecting our collaboration solutions for any of the foregoing reasons, or for any other reason, could damage our reputation with current and potential clients, expose us to liability, cause us to lose clients from whom we receive recurring revenue or otherwise adversely affect our business. We may also incur significant costs for using alternative equipment or taking other actions in preparation for, or in reaction to, events that damage the data centers we use.
Our collaboration solutions are accessed by a large number of clients often at the same time. As we continue to expand the number of our clients and solutions available to our clients, we may not be able to scale our technology to accommodate the increased capacity requirements, which may result in interruptions or delays in service. In addition, the failure of our third-party data centers or third-party Internet service providers to meet our capacity requirements could result in interruptions or delays in access to our collaboration solutions or impede our ability to scale our operations. In the event that our data center or third-party Internet service provider arrangements are terminated, or there is a lapse of service, interruption of Internet service provider connectivity, or damage to such facilities, we could
21
experience interruptions in access to our collaboration solutions as well as delays and additional expense in arranging new facilities and services.
We face risks related to the storage of our clients' confidential and proprietary information.
Our collaboration solutions are designed to maintain the confidentiality and security of our clients' confidential and proprietary information that is stored on our systems, including financial information, information regarding their business plans and other critical data. However, any accidental or willful security breaches or other unauthorized access to this data could expose us to liability for the loss of such information, time-consuming and expensive litigation and other possible liabilities as well as negative publicity. Techniques used to obtain unauthorized access or to sabotage systems change frequently and generally are difficult to recognize and react to. We and our third-party data center facilities may be unable to anticipate these techniques or to implement adequate preventative or reactionary measures. We could be subject to legal claims or harm to our reputation if we or our third-party service providers fail to comply or are seen as failing to comply with our policies concerning confidential and proprietary information or if our policies are inadequate.
Our limited operating history makes it difficult to evaluate our current business and future prospects.
We have been in existence since 2004, and much of our growth has occurred in recent periods. Our limited operating history makes it difficult for you to evaluate our current business and our future prospects. We have encountered and will continue to encounter risks and difficulties frequently experienced by growing companies in rapidly changing industries, including increasing and unforeseen expenses as we continue to grow our business. If we do not manage these risks successfully, our business, financial condition, results of operations and prospects may be materially adversely affected.
Our current and future debt agreements contain or may contain covenants that may impose operating and financial restrictions on us, including our ability to raise additional capital in the future, and we have previously failed to satisfy certain of such covenants. We may seek to renegotiate or refinance our current debt agreement or otherwise raise additional capital and we may be unable to do so on acceptable terms or at all.
Our current construction loan with First Midwest Bank contains various restrictive and financial covenants, including a ratio of net cash flow from operations to debt service of not less than 1.10 to 1.00, as well as a covenant that requires lender consent for certain future equity issuances. Our net cash flow from operations for fiscal 2012 and the nine months ended June 30, 2013 was negative, and we consequently did not satisfy the debt service covenant. Compliance with the debt service covenant and any related default was waived by First Midwest Bank until December 31, 2013. Following the completion of this offering, we intend to renegotiate the terms of the loan and/or seek proposals from other lenders to refinance the loan. However, there can be no assurance that we will be able to do so on acceptable terms or at all.
We intend to continue to make investments to support our business growth and may require additional funds to respond to business challenges, including the need to develop new features for our existing solutions or new solutions, or acquire complementary businesses, personnel and technologies. We therefore may need to engage in equity or debt financings to secure additional capital. Any debt financing we secure in the future also could include restrictive covenants relating to our capital raising activities and other financial and operational matters, which may make it more difficult for us to obtain additional capital and to pursue such business opportunities. On the other hand, we may not be able to obtain additional financing on terms favorable to us, or at all. If we are unable to obtain adequate financing or financing on terms satisfactory to us when we require it, our ability to continue to support our business growth and to respond to business challenges could be significantly impaired, and our business may be harmed.
22
Risks Related to this Offering and Ownership of Our Common Stock
Our directors, executive officers and principal stockholders have substantial control over us and could delay or prevent a change in corporate control.
After this offering, our directors, executive officers and holders of more than 5% of our common stock, together with their affiliates, will beneficially own, in the aggregate, approximately % of our outstanding common stock assuming no exercise by the underwriters of their over-allotment option. As a result, these stockholders, if acting together, would have significant influence over the outcome of matters submitted to our stockholders for approval, including the election of directors and any merger, consolidation or sale of all or substantially all of our assets. In addition, these stockholders, if acting together, would have significant influence over the management and affairs of our company. Accordingly, this concentration of ownership might harm the market price of our common stock by, among other things:
- •
- delaying, deferring or preventing a change in corporate control;
- •
- impeding a merger, consolidation, takeover or other business combination involving us; or
- •
- discouraging a potential acquiror from making a tender offer or otherwise attempting to obtain control of us.
We will continue to incur increased costs and demands upon management as a result of complying with the laws and regulations that affect public companies, which could materially adversely affect our business, financial condition, results of operations and prospects.
As a public company and particularly after we cease to be an "emerging growth company," we will continue to incur significant legal, accounting and other expenses that we did not incur as a private company, including costs associated with public company reporting and corporate governance requirements. These requirements include compliance with certain provisions of the Sarbanes-Oxley Act of 2002 (the "Sarbanes-Oxley Act"), as well as rules implemented by the Securities and Exchange Commission (the "SEC") and the New York Stock Exchange ("NYSE"). In addition, our management team will also continue to adapt to the requirements of being a public company. We expect that compliance with these rules and regulations will substantially increase our legal and financial compliance costs and will make some activities more time-consuming and costly.
The increased costs associated with operating as a public company will decrease our net income or increase our net loss, and may require us to reduce costs in other areas of our business or increase the prices of our solutions. Additionally, if these requirements divert our management's attention from other business concerns, they could have a material adverse effect on our business, financial condition, results of operations and prospects.
Additionally, as a public company, it continues to be more difficult and expensive for us to obtain director and officer liability insurance, and we may be required to accept reduced policy limits and coverage or incur substantially higher costs to obtain the same or similar coverage. As a result, it may be more difficult for us to attract and retain qualified individuals to serve on our board of directors or as our executive officers.
As an "emerging growth company," we may rely on the reduced disclosure requirements applicable to emerging growth companies, which may make our common stock less attractive to investors.
As an "emerging growth company," we may take advantage of certain exemptions from various reporting requirements that are applicable to other public companies that are not "emerging growth companies" including not being required to comply with the auditor attestation requirements of Section 404(b) of the Sarbanes-Oxley Act, reduced disclosure obligations regarding executive compensation in our periodic reports and proxy statements and exemptions from the requirements of
23
holding a nonbinding advisory vote on executive compensation and stockholder approval of any golden parachute payments not previously approved. We will remain an "emerging growth company" for up to five years, although if the market value of our common stock that is held by non-affiliates exceeds $700 million as of any March 31 before that time, or if we have total annual gross revenues of $1 billion or more during any fiscal year before that time, we would cease to be an "emerging growth company" as of the end of that fiscal year, or if we issue more than $1 billion in non-convertible debt in a three-year period, we would cease to be an "emerging growth company" immediately. We cannot predict if investors will find our common stock less attractive because we may rely on these exemptions. If some investors find our common stock less attractive as a result, there may be a less active trading market for our common stock and our stock price may be more volatile.
In addition, Section 107 of the Jumpstart Our Business Startups Act (the "JOBS Act") also provides that an "emerging growth company" can take advantage of the extended transition period provided in Section 7(a)(2)(B) of the Securities Act of 1933, as amended (the "Securities Act") for complying with new or revised accounting standards. An "emerging growth company" can therefore delay the adoption of certain accounting standards until those standards would otherwise apply to private companies. However, we have chosen to "opt out" of such extended transition period, and as a result, we will comply with new or revised accounting standards on the relevant dates on which adoption of such standards is required for non-emerging growth companies. Section 107 of the JOBS Act provides that our decision to opt out of the extended transition period for complying with new or revised accounting standards is irrevocable.
If we fail to comply with the reporting requirements under the Exchange Act or maintain adequate internal control over financial reporting in accordance with Section 404 of the Sarbanes-Oxley Act, it could result in late or non-compliant filings or inaccurate financial reporting and have a negative impact on the price of our common stock or our business.
Effective internal controls are necessary for us to provide timely, reliable financial reporting and prevent fraud. Prior to becoming a public company, we were not required to comply with the reporting requirements of the Securities Exchange Act of 1934, as amended (the "Exchange Act"), or with the standards adopted by the Public Company Accounting Oversight Board in compliance with the requirements of Section 404 of the Sarbanes-Oxley Act regarding internal control over financial reporting. As a public company, we are required to report our financial results on the timeline and in the form prescribed by the Exchange Act and to evaluate and report on our internal control over financial reporting beginning with our Annual Report on Form 10-K for the year ending September 30, 2014. Our independent registered public accounting firm will not be required to formally attest to the effectiveness of our internal control over financial reporting until we are no longer an "emerging growth company," as described above. At such time that an attestation is required, our independent registered public accounting firm may issue a report that is adverse in the event that we have one or more material weaknesses. Our remediation efforts may not enable us to avoid material weaknesses in the future.
The process of documenting and further developing our internal controls to become compliant with Section 404 will take a significant amount of time and effort to complete and will require significant attention of management. Completing implementation of new controls, documentation of our internal control system and financial processes, remediation of control deficiencies, and management testing of internal controls will require substantial effort by us. We may experience higher than anticipated operating expenses, as well as increased independent auditor and other fees and expenses during the implementation of these changes and thereafter.
24
If we do not remediate our material weaknesses in internal controls, it could result in late or non-compliant filings or inaccurate financial reporting and have a negative impact on the price of our common stock or our business.
In preparation for this offering and for future compliance with Section 404 of the Sarbanes-Oxley Act, we concluded that a material weakness in internal control over financial reporting related to our control environment existed as of September 30, 2012 as described below.
A material weakness is a deficiency, or combination of deficiencies, in internal control over financial reporting, such that there is a reasonable possibility that a material misstatement of our annual or interim consolidated financial statements will not be prevented, or detected and corrected on a timely basis.
- •
- We did not maintain a sufficient complement of personnel with the appropriate level of accounting knowledge, experience, and training in the application of GAAP commensurate with our financial reporting requirements. Specifically, we did not maintain adequate qualified personnel with regard to certain significant complex transactions and technical accounting matters and we lacked adequate controls regarding training in the relevant accounting guidance, review and documentation of certain complex accounting transactions and review of related accounting disclosures such as the accounting for convertible debenture financing agreements, including any embedded features, business combinations and share-based compensation transactions in accordance with GAAP.
This material weakness in our control environment contributed to the following individual material weaknesses in our internal control over financial reporting:
- •
- We did not maintain effective internal controls related to our accounting for convertible debentures to provide reasonable
assurance that (a) the instruments were valued correctly and (b) all pertinent factors related to the convertible debentures, including the impact of conversion and redemption or other
embedded or derivative features, were identified and considered for appropriate accounting in accordance with GAAP. Specifically, this material weakness resulted in material misstatements and audit
adjustments of non-cash interest expense, convertible debenture and derivative liabilities and additional paid-in capital to the consolidated financial statements for the
fiscal years ended September 30, 2010, 2011 and 2012.
- •
- We did not maintain effective internal controls related to the accounting for business acquisitions to provide reasonable assurance that (a) business combination accounting identified and considered all pertinent factors related to all classes of securities of the acquired entity, including any non-controlling interests and (b) there was appropriate review of the purchase price allocation entries recorded in the consolidated financial statements. Specifically, this material weakness resulted in material misstatements and audit adjustments to non-controlling interest and the related income (loss) attributable to our company and the non-controlling interest, additional paid-in capital, deferred revenue and revenue, goodwill, intangible assets and the related amortization expense to the consolidated financial statements for the fiscal year ended September 30, 2012.
These material weaknesses could result in misstatements of the aforementioned accounts that would result in a material misstatement to the annual or interim consolidated financial statements that would not be prevented or detected on a timely basis.
The large number of shares eligible for public sale in the near future could depress the market price of our common stock.
The market price of our common stock could decline as a result of sales of a large number of shares of our common stock in the market after this offering, and the perception that these sales could
25
occur may also depress the market price of our common stock. Based on shares outstanding as of June 30, 2013, we will have 23,798,588 shares of common stock outstanding after this offering. Of these shares, the 5,750,000 shares of common stock sold in our initial public offering and the 4,000,000 shares of common stock sold in this offering will be freely tradable in the United States, except for any shares purchased by our "affiliates" as defined in Rule 144 under the Securities Act. The remaining 14,048,588 shares of common stock will be "restricted securities" within the meaning of the federal securities laws. In connection with our initial public offering, holders of substantially all of these restricted securities agreed with the underwriters, subject to certain exceptions, not to dispose of or hedge any of their common stock during the 180-day period beginning on June 6, 2013, except with the prior written consent of Credit Suisse Securities (USA) LLC. In addition, in connection with this offering, our directors and executive officers, the selling shareholders in this offering, and certain other significant stockholders, who collectively hold approximately % of these restricted securities, have agreed with the underwriters, subject to certain exceptions, not to dispose or hedge any of their common stock during the period beginning on the date of the prospectus related to this offering, and ending on the later of (i) January 6, 2014 and (ii) 90 days after the date of the prospectus related to this offering (the "Lockup Period"). After the expiration of the 180-day restricted period related to the initial public offering and, if applicable, the Lockup Period, these restricted shares may be sold in the public market in the United States, subject to prior registration in the United States, if required, or reliance upon an exemption from United States registration, including, in the case of shares held by affiliates or control persons, compliance with the volume restrictions of Rule 144.
In addition to the foregoing shares of common stock, based on options and warrants to purchase common stock outstanding as of June 30, 2013, we will have outstanding upon completion of this offering options and warrants to purchase an aggregate of shares of common stock. In connection with our initial public offering, holders of options and warrants to purchase substantially all of these shares of common stock agreed with the underwriters, subject to certain exceptions, not to dispose of or hedge any of their common stock during the 180-day period beginning on June 6, 2013, except with the prior written consent of Credit Suisse Securities (USA) LLC. In addition, in connection with this offering, our directors and executive officers, the selling stockholders in this offering, and certain other significant stockholders, who collectively hold approximately % of these options and warrants, have agreed with the underwriters, subject to certain exceptions, not to dispose or hedge of any of their common stock during the Lockup Period.
We have filed a registration statement to register approximately 8.4 million of the shares reserved for issuance under our 2008 Stock Incentive Plan and 2013 Long Term Incentive Plan. Subject to the satisfaction of applicable exercise periods and, in certain cases, lock-up agreements with the representatives of the underwriters referred to above, the shares of common stock issued upon exercise of outstanding options or issued in satisfaction of other share-based awards under such plans will be available for immediate resale in the United States in the open market.
Sales of our common stock, as the restrictions described above end, may cause our stock price to fall and make it more difficult for you to sell shares of our common stock.
Anti-takeover provisions contained in our certificate of incorporation and bylaws, as well as provisions of Delaware law, could impair a takeover attempt.
Our certificate of incorporation and bylaws contain provisions that could have the effect of delaying or preventing changes in control or changes in our management without the consent of our board of directors. These provisions include:
- •
- a classified board of directors with three-year staggered terms, which may delay the ability of stockholders to change the membership of a majority of our board of directors;
26
- •
- the exclusive right of our board of directors to elect a director to fill a vacancy created by the expansion of our board
of directors or the resignation, death or removal of a director, which prevents stockholders from being able to fill vacancies on our board of directors;
- •
- the ability of our board of directors to determine to issue shares of preferred stock and to determine the price and other
terms of those shares, including preferences and voting rights, without stockholder approval, which could be used to significantly dilute the ownership of a hostile acquiror;
- •
- a prohibition on stockholder action by written consent, which forces stockholder action to be taken at an annual or
special meeting of our stockholders; and
- •
- advance notice procedures that stockholders must comply with in order to nominate candidates to our board of directors or to propose matters to be acted upon at a stockholders' meeting, which may discourage or deter a potential acquiror from conducting a solicitation of proxies to elect the acquiror's own slate of directors or otherwise attempting to obtain control of us.
We are also subject to certain anti-takeover provisions under Delaware law. Under Delaware law, a corporation may not, in general, engage in a business combination with any holder of 15% or more of its capital stock unless the holder has held the stock for three years or, among other things, the board of directors has approved the transaction.
Purchasers in this offering will experience immediate and substantial dilution in the book value of their investment.
The public offering price is substantially higher than the net tangible book value per share of our common stock. If you purchase shares of our common stock in this offering, you will pay a price per share that substantially exceeds the net tangible book value per share of our common stock. Investors purchasing common stock in this offering will incur immediate and substantial dilution of $ per share, based on the public offering price of $ per share. Further, investors purchasing common stock in this offering will contribute approximately % of the total amount invested by stockholders since our inception, but will own only approximately % of the shares of common stock outstanding.
This dilution is due in large part to the fact that some of our earlier investors paid substantially less than the price of the shares being sold in this offering when they purchased their shares of our capital stock. You will experience additional dilution upon the exercise of warrants held by existing investors and options to purchase common stock and the issuance of restricted stock and restricted stock units to our employees under our equity incentive plans. In addition, we may utilize our common stock as consideration to fund future acquisitions, which could cause you to experience further dilution. See "Dilution."
If we issue additional securities to raise capital, it may have a dilutive effect on your investment.
If we raise additional capital through further issuances of equity or convertible debt securities, our existing stockholders could suffer significant dilution in their percentage ownership of us. Moreover, any new equity securities (other than common stock) we issue could have rights, preferences and privileges senior to those of holders of our common stock, including shares of common stock sold in this offering.
If securities analysts do not publish research or reports about our company and our industry, or if they issue unfavorable commentary about us or our industry or downgrade our common stock, the price of our common stock could decline.
The trading price for our common stock is influenced by research or reports that industry or financial analysts publish about us and our business, our industry, or technology companies in general.
27
If any of the analysts who cover us or may cover us in the future change their recommendation regarding our stock adversely, or provide more favorable relative recommendations about our competitors, our stock price would likely decline. If any analyst who covers us or may cover us in the future were to cease coverage of our company or fail to regularly publish reports on us, we could lose visibility in the financial markets, which in turn could cause our stock price or trading volume to decline.
Our management will have broad discretion over the use of the proceeds we receive in this offering and might not apply the proceeds in ways that increase the value of your investment.
We currently intend to use the net proceeds received by us in this offering for financing our growth, working capital and other general corporate purposes. However, we have not determined the specific allocation of the remainder of the net proceeds among the various uses described in this prospectus. Our management will have broad discretion over the use and investment of the proceeds, and, accordingly, investors in this offering will need to rely upon the judgment of our management with respect to the use of the proceeds, with only limited information concerning management's specific intentions. See "Use of Proceeds."
We do not intend to pay dividends for the foreseeable future.
We have never declared or paid any cash dividends on our common stock and do not intend to pay any cash dividends in the foreseeable future. We anticipate that we will retain all of our future earnings for use in the operation of our business and for general corporate purposes. Any determination to pay dividends in the future will be at the discretion of our board of directors. Accordingly, investors must rely on sales of their common stock after price appreciation, which may never occur, as the only way to realize any gains on their investments for the foreseeable future.
Our stock price may be volatile, and you may not be able to resell your shares at or above the public offering price.
The trading price of our common stock following this offering may fluctuate substantially. The price of the common stock that will prevail in the market after this offering may be higher or lower than the price you pay, depending on many factors, some of which are beyond our control and may not be related to our operating performance. The fluctuations could cause you to lose part or all of your investment in our common stock. Factors that could cause fluctuations in the trading price of our common stock include, but are not limited to:
- •
- fluctuations in our quarterly financial results or the quarterly financial results of companies perceived to be similar to
us;
- •
- changes in market valuations of similar companies;
- •
- success of competitive products or services;
- •
- changes in our capital structure, such as future issuances of debt or equity securities;
- •
- announcements by us, our competitors or our clients of significant product releases, contracts, acquisitions, strategic
alliances or capital commitments;
- •
- loss of one or more significant clients or strategic alliances;
- •
- changes in laws or regulations relating to our solutions;
- •
- litigation involving our company, our general industry or both;
- •
- changes in general economic, industry and market conditions, including events pertaining to the commercial construction industry;
28
- •
- investors' general perception of us; and
- •
- additions or departures of key employees.
In addition, if the stock market in general experiences a loss of investor confidence, the trading price of our common stock could decline for reasons unrelated to our business, financial condition or results of operations. If any of the foregoing occurs, it could cause our stock price to fall and may expose us to class action lawsuits that, even if unsuccessful, could be costly to defend and a distraction to management. As a result, you could lose all or part of your investment.
If we fail to forecast the timing of our revenues or expenses accurately, our operating results could be materially lower than anticipated, which may cause our stock price to decline.
We use a variety of factors in our forecasting and planning processes, including historical trends, recent client history, expectations of client buying decisions, client implementation schedules and plans, analyses by our sales and service teams, maintenance renewal rates, our assessment of economic or market conditions and many other factors. While these analyses have historically provided and may continue to provide us with some guidance in business planning and expense management, these estimates are inherently imprecise and may not accurately predict our revenue or expenses in a particular quarter or over a longer period of time. A variation in any or all of these factors could cause us to inaccurately forecast our revenues or expenses and could result in expenditures without corresponding revenue. As a result, our operating results could be materially lower than anticipated in our quarterly or annual forecasts, which could materially adversely affect our business, financial condition, results of operations and prospects and could prevent us from meeting or exceeding the expectations of research analysts or investors, which may cause our stock price to decline.
29
CAUTIONARY NOTE REGARDING FORWARD-LOOKING STATEMENTS
This prospectus includes forward-looking statements. The words "believe," "may," "could," "estimate," "continue," "anticipate," "intend," "expect," "predict," "potential," "will" and similar expressions, as they relate to our company, our business and our management, are intended to identify forward-looking statements. We have based these forward-looking statements largely on our current expectations and projections about future events and financial trends affecting the financial condition of our business. Forward-looking statements should not be read as a guarantee of future performance or results, and will not necessarily be accurate indications of the times at, or by, which such performance or results will be achieved. Forward-looking statements are based on information available at the time those statements are made and/or management's good faith belief as of that time with respect to future events, and are subject to risks and uncertainties that could cause actual performance or results to differ materially from those expressed in or suggested by the forward-looking statements. Important factors that could cause such differences include, but are not limited to:
- •
- trends in the global and domestic economy and the commercial construction industry;
- •
- our ability to effectively manage our growth;
- •
- our ability to develop the market for our solutions;
- •
- competition with our business;
- •
- our dependence on a limited number of client relationships for a significant portion of our revenues;
- •
- our dependence on a single software solution for a substantial portion of our revenues;
- •
- the length of the selling cycle to secure new enterprise relationships for CPM, which requires significant investment of
resources;
- •
- our ability to cross-sell our solutions;
- •
- the continued growth of the market for on-demand software solutions;
- •
- our ability to develop and bring to market new solutions in a timely manner;
- •
- our success in expanding our international business and entering new industries; and
- •
- the availability of suitable acquisitions or partners and our ability to achieve expected benefits from such acquisitions or partnerships, including our acquisition of PlanSwift in January 2013.
In light of these risks and uncertainties, the forward-looking events and circumstances discussed in this prospectus may not occur and actual results could differ materially from those anticipated or implied in the forward-looking statements.
All forward-looking statements are expressly qualified in their entirety by the cautionary statements set forth above. Forward-looking statements speak only as of the date of this prospectus. You should not put undue reliance on any forward-looking statements. We assume no obligation to update forward-looking statements to reflect actual results, changes in assumptions or changes in other factors affecting forward-looking information, except to the extent required by applicable laws. If we update one or more forward-looking statements, no inference should be drawn that we will make additional updates with respect to those or other forward-looking statements.
30
Unless otherwise indicated, information contained in this prospectus concerning our industry and the markets in which we operate, including our general expectations and data regarding the market size of the construction industry, market position and market opportunity, is based on information from various sources, on assumptions that we have made that are based on those sources, and on our knowledge of the markets for our solutions. These sources include Global Construction Perspectives, Gartner, Inc., Engineering News-Record, the United States Census Bureau and the United States Department of Commerce. This information involves a number of assumptions and limitations, and you are cautioned not to give undue weight to such information. We have not independently verified any third-party information and cannot assure you of its accuracy or completeness. While we believe this information to be generally reliable, such information is inherently imprecise and we cannot give you any assurance that any of the projected data will be achieved. In addition, projections, assumptions and estimates of the future performance of the industry in which we operate is necessarily subject to a high degree of uncertainty and risk due to a variety of factors, including those described in "Risk Factors" and elsewhere in this prospectus. These and other factors could cause results to differ materially from those expressed in the estimates made by the independent parties and by us.
31
We estimate that our net proceeds from the sale of our common stock in this offering, based on an assumed public offering price of $ , which was the closing price of our common stock on the NYSE on September , 2013, will be approximately $ million, after deducting underwriting discounts and commissions and estimated offering expenses payable by us. If the underwriters exercise their option to purchase additional shares from us in full, we estimate that our net proceeds will be approximately $ million.
We currently intend to use the net proceeds received by us in this offering to finance our growth, working capital, and other general corporate purposes, although we have not yet determined with certainty the manner in which we will allocate the net proceeds received by us in this offering. In addition, we believe that opportunities may exist from time to time to expand our current business through acquisitions of, or investments in, complementary companies, products or technologies. Other than as described in "Summary—Recent Developments," we have no current agreements, commitments or understandings for any specific acquisitions or investments at this time. However, we may use a portion of the net proceeds for these purposes in the future. See "Risk Factors—Our management will have broad discretion over the use of the proceeds we receive in this offering and might not apply the proceeds in ways that increase the value of your investment."
Each $1.00 increase (decrease) in the assumed public offering price of $ per share would increase (decrease) the net proceeds to us from this offering by approximately $ million, assuming the number of shares offered, as set forth on the cover page of this prospectus, remains the same and after deducting underwriting discounts and commissions and estimated offering expenses payable by us.
Pending use of the proceeds as described above, we intend to invest the proceeds in short-term interest-bearing, investment-grade securities, certificates of deposit or direct or guaranteed obligations of the United States government, or hold as cash.
We will not receive any proceeds from the sale of shares of common stock by selling stockholders.
32
Our common stock has been listed on the NYSE, under the symbol "TXTR" since June 7, 2013. Prior to that date, there was no public trading market for our common stock. The following table sets forth for the periods indicated the high and low sales prices per share of our common stock as reported on the NYSE:
| |
High | Low | |||||
|---|---|---|---|---|---|---|---|
Third Quarter (from June 7, 2013) |
$ | 27.63 | $ | 19.68 | |||
Fourth Quarter (through September 9, 2013) |
$ | 43.83 | $ | 25.90 | |||
On September 9, 2013, the last reported sale price of our common stock on the NYSE was $42.40 per share.
33
We have never declared or paid cash dividends on our capital stock. We currently intend to retain any future earnings for use in the operation of our business and do not intend to declare or pay any cash dividends in the foreseeable future. Any further determination to pay dividends on our capital stock will be at the discretion of our board of directors, subject to applicable laws and any restrictions in our current or future financing arrangements and will depend on our financial condition, results of operations, capital requirements, general business conditions and other factors that our board of directors considers relevant.
34
The following table sets forth our cash and cash equivalents and capitalization as of June 30, 2013:
- •
- on an actual basis;
- •
- on an as adjusted basis to give effect to the issuance and sale by us of 1,000,000 shares of common stock in this offering, based on an assumed public offering price of $ , which was the closing price of our common stock on the NYSE on September , 2013, after deducting underwriting discounts and commissions and estimated offering expenses payable by us and the application of proceeds therefrom as described in "Use of Proceeds."
You should read this table in conjunction with the sections entitled "Management's Discussion and Analysis of Financial Condition and Results of Operations" and "Description of Capital Stock" and our consolidated financial statements and related notes included elsewhere in this prospectus.
| |
As of June 30, 2013 | ||||||
|---|---|---|---|---|---|---|---|
| |
Actual | As Adjusted(1) | |||||
| |
(in thousands, except share and per share data) |
||||||
Cash and cash equivalents |
$ | 68,627 | $ | ||||
Notes and leases payable, including current portion |
1,307 |
1,307 |
|||||
Loan payable to related party, including current portion |
10,469 | 10,469 | |||||
Redeemable non-controlling interest |
366 | 366 | |||||
Stockholders' equity: |
|||||||
Preferred stock; $0.001 par value: 10,000,000 shares authorized; no shares issued or outstanding, actual and as adjusted |
— | — | |||||
Common stock; $.001 par value: 90,000,000 shares authorized, 23,260,368 shares issued and 22,798,588 shares outstanding, actual; 24,260,368 shares issued and 23,798,588 shares outstanding, as adjusted |
23 | ||||||
Additional paid-in capital |
262,294 | ||||||
Treasury stock at cost |
(5,831 | ) | (5,831 | ) | |||
Accumulated deficit |
(169,910 | ) | (169,910 | ) | |||
Total Textura Corporation stockholders' equity |
86,550 | ||||||
Total capitalization |
$ | 98,692 | $ | ||||
- (1)
- If the underwriters' option to purchase additional shares to cover over-allotments is exercised in full, the as adjusted amount of cash and cash equivalents, additional paid-in capital, total stockholders' equity and total capitalization would increase by approximately $ million, after deducting underwriting discounts and commissions, and we would have 24,860,368 shares of common stock issued and 24,398,588 shares outstanding, as adjusted.
Each $1.00 increase (decrease) in the assumed public offering price of $ per share, would increase (decrease) each of cash and cash equivalents, additional paid-in capital, total stockholders' equity and total capitalization by approximately $ million, assuming that the number of shares offered by us, as set forth on the cover page of this prospectus, remains the same, and after deducting underwriting discounts and commissions and estimated offering expenses payable by us. The as adjusted information discussed above is illustrative only and will adjust based on the actual offering price and other terms of this offering determined at pricing.
35
The table above excludes the following shares:
- •
- 696,384 shares of common stock issuable upon settlement of restricted stock units outstanding as of June 30,
2013;
- •
- 3,428,601 shares of common stock issuable upon the exercise of stock options outstanding as of June 30,
2013, with a weighted average exercise price of approximately $14.14 per share;
- •
- 1,332,593 shares of common stock issuable upon the exercise of warrants to purchase common stock outstanding as of
June 30, 2013, with a weighted average exercise price of approximately $14.71 per share; and
- •
- 4,906,393 shares of common stock reserved for future awards under our 2013 Long Term Incentive Plan.
36
If you invest in our common stock, your interest will be diluted to the extent of the difference between the public offering price per share of our common stock and the pro forma net tangible book value per share of our common stock immediately after this offering.
Our net tangible book value as of June 30, 2013 was $52.8 million, or $2.31 per share of common stock. Our net tangible book value per share represents the amount of our total tangible assets reduced by the amount of our total liabilities and divided by the total number of shares of our common stock outstanding as of June 30, 2013.
After giving effect to our sale in this offering of 1,000,000 shares of common stock at an assumed public offering price of $ , which was the closing price of our common stock on the NYSE on September , 2013, after deducting underwriting discounts and commissions and estimated offering expenses payable by us, our pro forma net tangible book value as of June 30, 2013 would have been approximately $ million, or $ per share of common stock. This represents an immediate increase in net tangible book value of $ per share to our existing stockholders and an immediate dilution of $ per share to investors purchasing shares in this offering.
The following table illustrates this per share dilution.
Assumed public offering price per share |
$ | ||||||
Net tangible book value per share as of June 30, 2013 |
$ | ||||||
Increase in net tangible book value per share attributable to investors purchasing shares in this offering |
|||||||
Pro forma net tangible book value per share after this offering |
$ | ||||||
Dilution in pro forma net tangible book value per share to investors in this offering |
$ | ||||||
Each $1.00 increase (decrease) in the assumed public offering price of $ per share would increase (decrease) our pro forma net tangible book value by approximately $ million, or approximately $ per share, and the dilution per share to new investors purchasing common stock in this offering by approximately $ per share, assuming that the number of shares offered by us, as set forth on the cover page of this prospectus, remains the same and after deducting underwriting discounts and commissions and estimated offering expenses payable by us. The pro forma information discussed above is illustrative only and will adjust based on the actual public offering price and other terms of this offering determined at pricing.
If the underwriters exercise their over-allotment option in full, the pro forma net tangible book value per share after giving effect to this offering would be approximately $ per share, and the dilution in pro forma net tangible book value per share to investors in this offering would be approximately $ per share.
The following table summarizes, as of June 30, 2013, the differences between the number of shares of our common stock purchased from us, the total cash consideration paid and the average price per share paid by our existing stockholders and by our new investors purchasing shares in this offering, before deducting underwriting discounts and commissions and offering expenses payable by us:
| |
|
|
Total Consideration | |
||||||||||||
|---|---|---|---|---|---|---|---|---|---|---|---|---|---|---|---|---|
| |
Shares Purchased | |
||||||||||||||
| |
Amount (millions) |
|
Average Price Per Share |
|||||||||||||
| |
Number | Percent | Percent | |||||||||||||
Existing stockholders |
$ | % | $ | |||||||||||||
New investors |
% | % | ||||||||||||||
Total |
% | $ | 100 | % | ||||||||||||
37
If the underwriters exercise their over-allotment option in full, our existing stockholders would own % and our new investors would own % of the total number of shares of our common stock outstanding after this offering.
The above table and discussions are based on the number of shares of our common stock outstanding as of June 30, 2013, and exclude the following shares:
- •
- 696,384 shares of common stock issuable upon settlement of restricted stock units outstanding as of June 30,
2013;
- •
- 3,428,601 shares of common stock issuable upon the exercise of stock options outstanding as of June 30,
2013, with a weighted average exercise price of approximately $14.14 per share;
- •
- 1,332,593 shares of common stock issuable upon the exercise of warrants to purchase common stock outstanding as of
June 30, 2013, with a weighted average exercise price of approximately $14.71 per share; and
- •
- 4,906,393 shares of common stock reserved for future awards under our 2013 Long Term Incentive Plan.
To the extent that any outstanding options or warrants are exercised, new investors will experience further dilution.
38
SELECTED CONSOLIDATED FINANCIAL DATA
The consolidated statements of operations data for the years ended September 30, 2010, 2011 and 2012 and the consolidated balance sheet data as of September 30, 2011 and 2012 are derived from our audited consolidated financial statements included elsewhere in this prospectus. The consolidated statements of operations data for the nine months ended June 30, 2012 and 2013 and the consolidated balance sheet data as of June 30, 2013 are derived from our unaudited condensed consolidated financial statements included elsewhere in this prospectus. The unaudited condensed consolidated financial statements were prepared on a basis consistent with our audited consolidated financial statements and include, in the opinion of management, all adjustments, consisting of only normal recurring adjustments, necessary for a fair statement of the financial information contained in those statements. Our historical results are not necessarily indicative of the results to be expected in the future. The following selected consolidated financial data should be read in conjunction with "Management's Discussion and Analysis of Financial Condition and Results of Operations" and the consolidated financial statements, related notes and other financial information included elsewhere in this prospectus.
| |
Years Ended September 30, | Nine Months Ended June 30, | ||||||||||||||
|---|---|---|---|---|---|---|---|---|---|---|---|---|---|---|---|---|
| |
2010 | 2011 | 2012 | 2012 | 2013 | |||||||||||
| |
(in thousands, except per share data) |
|||||||||||||||
Consolidated Statement of Operations Data |
||||||||||||||||
Revenue(1) |
$ | 6,020 | $ | 10,514 | $ | 21,681 | $ | 15,362 | $ | 24,681 | ||||||
Operating expense: |
||||||||||||||||
Cost of services(2) |
4,187 | 4,395 | 6,152 | 4,361 | 8,222 | |||||||||||
General and administrative |
5,654 | 6,856 | 11,105 | 8,180 | 17,074 | |||||||||||
Sales and marketing |
3,122 | 2,601 | 5,995 | 4,162 | 9,535 | |||||||||||
Technology and development |
4,747 | 6,169 | 11,123 | 8,433 | 13,703 | |||||||||||
Depreciation and amortization |
2,621 | 2,161 | 4,080 | 3,018 | 3,167 | |||||||||||
Total operating expense |
20,331 | 22,182 | 38,455 | 28,154 | 51,701 | |||||||||||
Loss from operations |
(14,311 | ) | (11,668 | ) | (16,774 | ) | (12,792 | ) | (27,020 | ) | ||||||
Other expense, net |
(1,612 | ) | (7,260 | ) | (2,019 | ) | (1,502 | ) | (4,055 | ) | ||||||
Loss before income taxes |
(15,923 | ) | (18,928 | ) | (18,793 | ) | (14,294 | ) | (31,075 | ) | ||||||
Income tax provision |
— | — | — | — | 226 | |||||||||||
Net loss |
(15,923 | ) | (18,928 | ) | (18,793 | ) | (14,294 | ) | (31,301 | ) | ||||||
Less: Net loss attributable to non-controlling interests |
— | — | (2,866 | ) | (1,966 | ) | (2,643 | ) | ||||||||
Net loss attributable to Textura Corporation |
(15,923 | ) | (18,928 | ) | (15,927 | ) | (12,328 | ) | (28,658 | ) | ||||||
Accretion (decretion) of redeemable Series A-1 preferred stock |
(19,802 | ) | 11,486 | 3,373 | 656 | 3,549 | ||||||||||
Accretion of redeemable non-controlling interest |
— | — | — | — | 222 | |||||||||||
Dividends on Series A-2 preferred stock |
480 | 480 | 480 | 360 | 335 | |||||||||||
Undistributed earnings allocated to participating securities |
1,506 | — | — | — | — | |||||||||||
Beneficial conversion of Series A-2 preferred stock |
— | — | — | — | 7,161 | |||||||||||
Net income (loss) available to Textura Corporation common stockholders |
$ | 1,893 | $ | (30,894 | ) | $ | (19,780 | ) | $ | (13,344 | ) | $ | (39,925 | ) | ||
39
| |
Years Ended September 30, | Nine Months Ended June 30, | ||||||||||||||
|---|---|---|---|---|---|---|---|---|---|---|---|---|---|---|---|---|
| |
2010 | 2011 | 2012 | 2012 | 2013 | |||||||||||
| |
(in thousands, except per share data) |
|||||||||||||||
Net income (loss) available to Textura Corporation common stockholders, basic and diluted |
$ | 1,893 | $ | (30,894 | ) | $ | (19,780 | ) | $ | (13,344 | ) | $ | (39,925 | ) | ||
Net income (loss) per share available to Textura Corporation common stockholders: |
||||||||||||||||
Basic |
$ | 0.27 | $ | (4.18 | ) | $ | (2.31 | ) | $ | (1.56 | ) | $ | (3.87 | ) | ||
Diluted |
$ | 0.26 | $ | (4.18 | ) | $ | (2.31 | ) | $ | (1.56 | ) | $ | (3.87 | ) | ||
Weighted average number of common shares outstanding: |
||||||||||||||||
Basic |
6,942 | 7,392 | 8,548 | 8,544 | 10,315 | |||||||||||
Diluted |
7,166 | 7,392 | 8,548 | 8,544 | 10,315 | |||||||||||
| |
As of September 30, | |
||||||||
|---|---|---|---|---|---|---|---|---|---|---|
| |
As of June 30, 2013 |
|||||||||
| |
2011 | 2012 | ||||||||
| |
(in thousands) |
|
||||||||
Consolidated Balance Sheet Data: |
||||||||||
Cash |
$ | 5,941 | $ | 4,174 | $ | 68,627 | ||||
Property and equipment, net |
19,515 | 17,775 | 18,701 | |||||||
Goodwill and other intangibles |
— | 25,671 | 34,158 | |||||||
Total assets |
27,305 | 51,099 | 127,035 | |||||||
Deferred revenue, current and long-term |
5,279 | 14,166 | 18,765 | |||||||
Total debt, current and long-term(3) |
13,183 | 26,607 | 11,776 | |||||||
Redeemable Series A-1 preferred stock |
39,762 | 43,135 | — | |||||||
Total Textura Corporation stockholders' equity (deficit) |
(36,422 | ) | (51,084 | ) | 86,550 | |||||
- (1)
- The
acquisitions of GradeBeam and Submittal Exchange contributed $4.9 million and $3.3 million of revenue for the year ended
September 30, 2012 and the nine months ended June 30, 2012, respectively. The acquisition of PlanSwift contributed $2.5 million of revenue for the nine months ended
June 30, 2013.
- (2)
- Cost
of services is exclusive of depreciation and amortization, which is shown separately below.
- (3)
- Total debt, representing the current and long-term portions, includes our loan payable to related party for the purchase of land and construction of our corporate headquarters, convertible debentures, notes payable and leases payable. The convertible debentures converted to common stock and certain notes were paid in connection with the initial public offering in June 2013.
40
MANAGEMENT'S DISCUSSION AND ANALYSIS OF
FINANCIAL CONDITION AND RESULTS OF OPERATIONS
The following discussion and analysis of our financial condition and results of operations should be read together with the "Selected Consolidated Financial Data" and the consolidated financial statements and related notes that are included elsewhere in this prospectus. This discussion contains forward-looking statements based upon current expectations that involve risks and uncertainties. Our actual results may differ materially from those anticipated in these forward-looking statements as a result of various factors, including those set forth under "Risk Factors" or in other parts of this prospectus. Our fiscal years ended September 30, 2010, 2011, 2012 and 2013 are referred to herein as fiscal 2010, fiscal 2011, fiscal 2012 and fiscal 2013.
Overview
We are a leading provider of on-demand business collaboration software to the commercial construction industry. Our solutions are focused on facilitating collaboration between owners/developers, general contractors and subcontractors. Our solutions increase efficiency, enable better risk management, and provide improved visibility and control of construction activities for our clients.
Our collaboration solutions offer robust functionality, data sharing and exchange capabilities, and workflow tools that support several mission-critical business processes at various stages of the construction project lifecycle:
- •
- Construction Payment Management ("CPM") enables the generation, collection, review and routing of invoices and the
necessary supporting documentation and legal documents, and initiation of payment of the invoices.
- •
- Submittal Exchange enables the collection, review and routing of project documents.
- •
- GradeBeam supports the process of obtaining construction bids, including identifying potential bidders, issuing
invitations-to-bid and tracking bidding intent.
- •
- Pre-Qualification Management ("PQM") supports contractor risk assessment and qualification.
- •
- Greengrade facilitates the management of environmental certification.
In addition, we offer PlanSwift, a take-off and estimating solution used in preparing construction bids, and Contractor Default Claims Management, which supports the process of documenting a subcontractor default insurance claim.
We derive substantially all of our revenue from fees related to the use by our clients of our software solutions. We classify our revenue into activity-driven revenue and organization-driven revenue:
- •
- Owners/developers, general contractors and subcontractors using our CPM, Submittal Exchange and Greengrade solutions pay
us fees that are dependent on the value of the construction project or contract and are collected at the start of activity. In addition, owners/developers and general contractors typically pay us
monthly fees that are dependent on the value and total number of projects managed using our system. We typically invoice and collect these monthly fees in advance on a six-month basis. We
refer to these fees collectively as activity-driven revenue as they depend on the construction activity of our clients.
- •
- Participants using our GradeBeam and PQM solutions pay us subscription fees. These fees are dependent on a number of characteristics of the organization, which may include size, complexity, type or number of users, and are typically generated on a subscription basis. We typically invoice and collect these subscription fees in advance on a twelve-month basis. We also receive a combination of license fees, maintenance fees, subscription fees and claims fees for our
41
other solutions. We refer to these fees collectively as organization-driven revenue as they do not depend on the construction activity of our clients but rather the number and characteristics of the organizations using the solutions.
Both our activity-driven and organization-driven revenue have historically exhibited certain characteristics that are beneficial to managing our business:
- •
- Our collaboration solutions are integral to our clients' operation of their business. We seek to establish enterprise
relationships with our clients so that all their current and future projects will be managed on our collaboration solutions. This historically has resulted in recurring additions of new projects and
the ongoing management of these projects on our solutions by our clients. Because our revenue is derived primarily from fees driven by construction project activity, monthly fees and subscription
fees, we historically have experienced a high recurrence of our fees.
- •
- Clients typically pay us fees upfront or in advance of solution usage. We also generally collect the majority of these
fees electronically, which historically has reduced our invoicing and collection activity and accelerated our cash flow.
- •
- The nature of the construction industry and our clients' operation of their business historically has in general resulted in low volatility over reporting periods in the number and construction value of projects each client is working on. Our close working relationship with our clients historically has provided us additional insight into their business activity and the number and construction value of projects each client will manage on our system. In addition, because we have a large number of clients, the aggregate number of new projects added to, and of projects being managed on, our solutions historically has benefited from a portfolio effect. Furthermore, projects with similar construction value historically have generated like amounts of fees over their duration. These factors, combined with the high recurrence of our fees discussed above and our recognition of revenue ratably over future periods, have historically resulted in predictable reported revenue. For example, over the eight quarters ended June 30, 2013, a period over which the compounded quarterly growth rate of our reported activity-driven revenue was 13.0%, between 92% and 95% of our reported activity-driven revenue in each quarter resulted from projects that were added to our solutions in prior periods.
While we have historically experienced these favorable characteristics, there can be no assurance that our future results will exhibit these same characteristics.
Our company was formed in 2004 and initially focused on developing CPM, our solution for facilitating the invoicing process for commercial construction projects. We launched CPM commercially in mid-2006. Since that time, we have experienced rapid growth and increasing acceptance of CPM in the marketplace and we have continued to invest significantly in order to broaden its applicability and functional capabilities. In October 2009, we introduced PQM, our solution that supports the collection of data to undertake effective contractor risk assessment and qualification. In October 2011 and November 2011, we further expanded our suite of solutions via the acquisitions of GradeBeam and Submittal Exchange, respectively. These acquisitions added complementary on-demand software solutions focused on the processes of soliciting bids for potential construction work and collecting, reviewing and routing project documents among project participants, respectively. In January 2013, we expanded the suite of solutions we offer that are focused on subcontractors and material suppliers by acquiring PlanSwift. The PlanSwift solution facilitates the preparation of accurate bids through advanced digital take-off and estimating functionality.
Since our founding, our strategy has been to devote considerable resources to the development and enhancement of our solutions. We believe this has resulted in a robust suite of solutions, well positioned for the migration of technology solutions to an on-demand environment in the construction
42
industry. While we believe the adoption of technology solutions generally, and on-demand software solutions in particular, in the construction industry is gaining traction, it remains at a relatively early stage. In addition, there is a low level of penetration of our collaboration solutions in our existing client base and current target markets. We believe this presents us with a significant opportunity to grow our business through sales of our solutions. We believe our existing and potential clients are increasingly looking to technology to achieve operational and financial efficiencies, better manage risk and improve visibility into and control of their business processes. As part of our strategy to expand our suite of business collaboration solutions for the construction industry, and to expand our market reach, we intend to continue to allocate increasing resources to our technology and development efforts and to expanding our sales and support capabilities. This strategy has resulted in a history of operating losses and accumulated deficit, which have increased as we have increased the substantial investments we are making to acquire new enterprise relationships and develop new solutions in response to our assessment of our market opportunity. These operating losses, however, have declined over time as a percentage of revenue. While we expect our operating expenses to continue to increase in the future, we intend to manage operating expenses and leverage our fixed costs to decrease operating losses.
We market and sell our solutions to our clients through a number of different sales channels, tailored to reflect the solution and the clients we are selling to. We generally seek to establish an enterprise relationship with owners/developers and general contractors for their use of our solutions, particularly in the case of our CPM, PQM and GradeBeam offerings. We have found that this requires an in-person, relationship-driven, consultative approach with a high degree of solution and domain expertise on the part of our employees. Certain of our other solutions in contrast are well suited to be used on a single project and do not require enterprise-wide deployment. Our Submittal Exchange and Greengrade solutions in particular are primarily sold on a project-by-project basis, largely to existing customers with a high level of repeat business. In addition, sales of our GradeBeam, PQM, and PlanSwift solutions to the subcontractor community are generally transactional and reflect the lower cost and complexity of these solutions and the organizations to which we sell them. To address these markets we operate direct sales groups that market to, contact and support prospective clients remotely, primarily using email, webinars, telephone and other appropriate methods. We also have a number of distributor and reseller relationships for our PlanSwift solution in international markets.
Our revenue growth has been driven by an increase in the number of construction projects being managed on our solutions, the aggregate client-reported construction value of such projects, and the number of organizations using our solutions. In addition, the acquisitions of GradeBeam and Submittal Exchange contributed to our revenue growth in fiscal 2012 and the acquisition of PlanSwift contributed to our growth in the second and the third quarters of fiscal 2013.
We are focused on growing our business by pursuing the significant market opportunity for on-demand software collaboration solutions in the construction industry. We plan to grow our revenue by adding new clients and helping our existing clients increase the number of projects and volume of construction activity managed on our solutions. We also plan to expand our client base to include geographic regions and client segments beyond those which we currently serve.
43
Key Business Metrics
In addition to traditional financial measures, we regularly review the following key metrics to evaluate our business, measure our performance, identify trends affecting our business, formulate financial projections and make strategic decisions. These metrics reflect the impact of the acquisition of GradeBeam in October 2011, Submittal Exchange in November 2011 and PlanSwift in January 2013 as described in more detail in "—Results of Operations."
| |
Years Ended September 30, | Nine Months Ended June 30, |
||||||||||||||
|---|---|---|---|---|---|---|---|---|---|---|---|---|---|---|---|---|
| |
2010 | 2011 | 2012 | 2012 | 2013 | |||||||||||
| |
(dollars in thousands, except where otherwise indicated) |
|||||||||||||||
Activity-driven revenue |
$ | 5,705 | $ | 9,875 | $ | 19,064 | $ | 13,484 | $ | 19,773 | ||||||
Organization-driven revenue |
315 | 639 | 2,617 | 1,878 | 4,908 | |||||||||||
Total revenue |
$ | 6,020 | $ | 10,514 | $ | 21,681 | $ | 15,362 | $ | 24,681 | ||||||
Activity-driven revenue: |
||||||||||||||||
Number of projects added |
1,898 | 2,475 | 4,167 | 2,989 | 3,741 | |||||||||||
Client-reported construction value added (billions) |
$ | 18.4 | $ | 19.4 | $ | 33.8 | $ | 25.7 | $ | 32.3 | ||||||
Active projects during period |
2,783 | 3,952 | 6,393 | 5,265 | 7,666 | |||||||||||
Organization-driven revenue: |
||||||||||||||||
Number of organizations |
151 | 945 | 5,204 | 4,594 | 8,210 | |||||||||||
Adjusted EBITDA |
$ |
(9,565 |
) |
$ |
(8,031 |
) |
$ |
(9,346 |
) |
$ |
(7,081 |
) |
$ |
(8,760 |
) |
|
Deferred revenue balance as of the end of period |
$ |
2,396 |
$ |
5,279 |
$ |
14,166 |
$ |
12,457 |
$ |
18,765 |
||||||
Activity-driven revenue
Number of projects added. This metric represents the total number of construction projects added by our clients to our CPM, Submittal Exchange and Greengrade solutions during the reporting period. Each project on our system is created by the client and represents a unit of work they have elected to manage on our system as a single project. As a result, an individual development, structure or remodeling program may result in the creation of multiple projects on our system. A project added to our system does not necessarily become active immediately. We use the number of projects added to our solutions during a reporting period to measure the success of our strategy of further penetrating the construction market with these solutions. Also, activity-driven revenue is dependent in part on the number of projects using our solutions.
Client-reported construction value added. This metric represents the total client-entered dollar value of construction projects added by our clients to our CPM, Submittal Exchange and Greengrade solutions during the reporting period. We use client-reported construction value added to measure the success of our strategy of increasing the volume of construction activity managed with these solutions. In addition, we use this metric in conjunction with number of projects added to monitor average project size. Also, activity-driven revenue is dependent in part on project size.
Active projects during period. This metric represents the number of construction projects that have been active during the reporting period on our CPM, Submittal Exchange and Greengrade solutions. Especially with our CPM solution, clients may elect to add a new project on our system before their project activity begins. Accordingly, there may be an interval between when a project is included as a new project added and when we would consider it an active project. We use active projects during period to evaluate our penetration of the construction market with these solutions, to monitor growth
44
from period to period. Also, activity-driven revenue is dependent in part on the number of active projects on our solutions.
We derive the metrics above from a number of sources, including information entered into our solutions by our clients, our historical data and our analysis of the actions of our clients on our solutions. Clients may adjust or update previously-entered information periodically. In particular, client-reported construction value may be modified by the client during the lifetime of the project to revise initial estimates of construction value or reflect changes in the scope or cost of the project, and client-reported construction value may increase or decrease as a result. Since these metrics are based on information available at the time they are prepared, metrics may reflect updates from those previously reported for prior periods. Historically, these updates have not been significant in amount or percentage. In addition, management is unable to independently verify the construction value data entered by our clients. As a result, undue reliance on these metrics by us would carry the risk that we incorrectly evaluate our business performance or the success of our strategies as outlined above. Notwithstanding these limitations, based on our historical experience management believes that these metrics are valuable indicators of the overall progress of the business and the success of our various strategies.
Organization-driven revenue
Number of organizations. This metric includes the number of organizations that are active subscribers on our GradeBeam and PQM solutions as of the end of the reporting period, as measured by the number of active subscriptions. An organization may be a single corporate entity or an operating unit within an entity. These clients pay an upfront fee for a fixed period of access. This metric also includes the number of organizations that have an active subscription or maintenance contract for our PlanSwift solution, or that have purchased a license within the period. We use this metric to measure the success of our strategy of further penetrating the construction market with these solutions. Also, our organization-driven revenue is dependent in part on the number of organizations using our solutions.
Additional metrics
Adjusted EBITDA. We define this metric as loss before interest, taxes, depreciation and amortization, share-based compensation expense, acquisition-related expense, and initial public offering-related expense. We believe that the use of Adjusted EBITDA as an additional operating performance metric is useful because it provides greater consistency for period-to-period comparisons of our business operations. Adjusted EBITDA is not determined in accordance with GAAP, and should not be considered as a substitute for or superior to financial measures determined in accordance with GAAP. For further discussion regarding Adjusted EBITDA and a reconciliation of Adjusted EBITDA to net
45
income, refer to the table below and footnote 3 to "Prospectus Summary—Summary Consolidated Financial Data."
| |
Years Ended September 30, | Nine Months Ended June 30, |
||||||||||||||
|---|---|---|---|---|---|---|---|---|---|---|---|---|---|---|---|---|
| |
2010 | 2011 | 2012 | 2012 | 2013 | |||||||||||
| |
(in thousands) |
|||||||||||||||
Net loss |
$ | (15,923 | ) | $ | (18,928 | ) | $ | (18,793 | ) | $ | (14,294 | ) | $ | (31,301 | ) | |
Net interest expense |
1,612 | 7,260 | 2,200 | 1,634 | 4,495 | |||||||||||
Income tax provision |
— | — | — | — | 226 | |||||||||||
Depreciation and amortization |
2,621 | 2,161 | 4,080 | 3,018 | 3,167 | |||||||||||
EBITDA |
(11,690 | ) | (9,507 | ) | (12,513 | ) | (9,642 | ) | (23,413 | ) | ||||||
Share-based compensation expense |
2,125 | 1,468 | 2,676 | 2,078 | 11,228 | |||||||||||
Acquisition-related expense |
— | 8 | 491 | 483 | 414 | |||||||||||
Initial public offering-related expense* |
— | — | — | — | 3,011 | |||||||||||
Adjusted EBITDA |
$ | (9,565 | ) | $ | (8,031 | ) | $ | (9,346 | ) | $ | (7,081 | ) | $ | (8,760 | ) | |
- *
- Initial public offering-related expense for the nine months ended June 30, 2013 represents one-time cash bonuses of $3.0 million paid to long-tenured employees in connection with the initial public offering.
Deferred revenue balance. Our deferred revenue consists of amounts that have been invoiced but that have not yet been recognized as revenue as of the end of a reporting period. Our deferred revenue balance consists of activity-driven and organization-driven revenue that is recognized ratably over the estimated life of a project or contractual service period. We monitor our deferred revenue balance because it represents a significant portion of revenue to be recognized in future periods.
Key Components of Consolidated Statements of Operations
Revenue
We classify our revenue into activity-driven revenue and organization-driven revenue.
Activity-driven revenue. Activity-driven revenue is generated as a direct result of project activity on our CPM, Submittal Exchange and Greengrade solutions. Such revenue includes project fees and monthly fees, paid by the owner/developer, general contractor or architect; and usage fees, paid by subcontractors. For each project added to our CPM, Submittal Exchange and Greengrade solutions, we generate project fees that are based on the construction dollar value of the project. In addition, for each project that is active on our CPM solution, we generate monthly fees that are based on the construction dollar value of a project and the total number of active projects on our system for the client. Subcontractors pay us a usage fee for each contract managed using our CPM solution, which is based on the value of the contract.
We collect project fees and usage fees in advance, when a project becomes active and a contract is accepted by the subcontractor, respectively. We invoice our clients for monthly fees in advance in six-month intervals. We record deferred revenue for these upfront fees which corresponds to our obligation to provide services over the relevant period. We recognize project fees and usage fees ratably over the average estimated life of the project and contract, respectively, and recognize monthly fees in each period during which the project is active on our system.
Organization-driven revenue. Organization-driven revenue is generated when clients subscribe to our GradeBeam and PQM solutions. These fees are dependent on a number of characteristics of the
46
organization, which may include size, complexity, type, or number of users. We invoice these fees in advance. We record deferred revenue for these upfront fees which corresponds to our obligation to provide services over the relevant period. These fees are recognized ratably over the applicable service period.
Organization-driven revenue also includes revenue from the sale of software licenses and related maintenance and training for our PlanSwift solution. License revenue is recognized upon delivery of the license, maintenance revenue is recognized ratably over the period of the maintenance contract, which is generally one year, and training revenue is recognized when the services are delivered to the client. For subscription-based licenses, which include maintenance and support, we recognize the subscription fees ratably over the applicable subscription period.
Operating Expense
Cost of Services. Cost of services represents costs related to hosting our solutions, licensing fees, client implementation and ongoing support and other service-related costs, including bank and telecommunication fees. In the case of CPM, cost of service includes all activities performed by our client services group. These costs consist primarily of personnel-related expenses, including salaries, benefits, bonuses and share-based compensation. Cost of services is exclusive of depreciation and amortization which is presented as a separate line item.
General and Administrative. Our general and administrative expenses consist of costs of our finance, legal, business development and administration functions. These expenses consist primarily of personnel-related expenses, including salaries, benefits, bonuses and share-based compensation; legal, accounting and consulting third-party professional fees; insurance premiums; and facilities expenses.
Sales and Marketing. Sales and marketing expenses consist primarily of personnel-related expenses for sales and marketing staff, including salaries, commissions, benefits, bonuses and share-based compensation. Sales and marketing expenses also include costs of lead generation activities, marketing and other promotional events, product marketing and other brand-building activities.
Technology and Development. Technology and development expenses represent costs to support our solutions, including ongoing maintenance and feature development. These costs consist primarily of personnel-related expenses, including salaries, benefits, bonuses and share-based compensation; the cost of certain third-party contractors; and software and license costs.
Depreciation and Amortization. Depreciation and amortization expenses consist primarily of depreciation of fixed assets; amortization of internally-developed software; and amortization of intangible assets. The amounts are amortized on a straight line basis over the anticipated useful life of the related asset.
Other Expense, Net. Other expense, net consists primarily of interest expense incurred on our loan payable to related party for our headquarters, interest expense on convertible debentures and interest related to other notes payable and capital leases. The interest expense consists primarily of the stated interest; amortization of discounts resulting from detachable warrants; amortization of discounts resulting from beneficial conversion features and fair value of embedded derivatives, if applicable; and recognition of unamortized discounts upon conversion of debentures containing beneficial conversion features.
Critical Accounting Policies and Estimates
Our consolidated financial statements are prepared in accordance with GAAP. The preparation of these consolidated financial statements requires our management to make estimates and assumptions that affect the reported amounts of assets, liabilities, revenue and expenses and related disclosures.
47
Management bases its estimates on historical experience and on various other factors that are believed to be reasonable under the circumstances. Different assumptions and judgments would change the estimates used in the preparation of our consolidated financial statements, which, in turn, could change the results from those reported. In some instances, changes in the accounting estimates are reasonably likely to occur from period-to-period. Our management evaluates its estimates and assumptions on an ongoing basis.
We believe that there are several accounting policies that are critical to understanding our business and prospects for future performance, as these policies affect the reported amounts of revenue and other significant areas that involve management's judgment and estimates. These significant policies and our procedures related to these policies are described in detail below. For further information on all of our significant accounting policies, please see Note 2 of the accompanying notes to our audited consolidated financial statements included elsewhere in this prospectus.
Revenue Recognition
We classify our revenue into activity-driven revenue and organization-driven revenue.
Activity-driven revenue. Activity-driven revenue is generated as a direct result of project activity on our CPM, Submittal Exchange and Greengrade solutions. Such revenue includes project fees and monthly fees, paid by the owner/developer, general contractor or architect; and usage fees, paid by subcontractors. We recognize activity-driven revenue when there is evidence that project or contracting activity has occurred on our system, the fee is fixed and determinable, delivery of our services has occurred and collection of payment from the project participant is reasonably assured. We recognize project fees and usage fees ratably over the average estimated life of the project and contract, respectively, and recognize monthly fees in each period during which the project is active on our system. The average estimated life of the project and contract is estimated by management based on periodic review and analysis of historical data. The applicable estimated life is based on the project or contract value falling within certain predetermined ranges, as well as the solution on which the project is being managed. We perform periodic reviews of actual project and contract data and revise our estimates as necessary. The estimated life of the projects on our solutions historically has ranged from 5 to 29 months, and depends on the construction value of the project and the solution being utilized. The estimated life of the contracts on our CPM solution historically has ranged from 5 to 15 months, and depends on the value of the contract.
Organization-driven revenue. Organization-driven revenue is generated when clients subscribe to our GradeBeam and PQM solutions. We recognize organization-driven revenue when there is evidence of a subscription arrangement on our system, the fee is fixed and determinable, delivery of our services has occurred, and collection of payment from the organization is reasonably assured. These fees are recognized ratably over the applicable service period, ranging from 12 to 24 months.
Organization-driven revenue also includes revenue from the sale of software licenses and related maintenance and training for our PlanSwift solution. We recognize license revenue upon delivery of the license, we recognize maintenance revenue ratably over the period of the maintenance contract, which is generally one year, and we recognize training revenue when the services are delivered to the client. For multiple-element arrangements that include a perpetual license and either maintenance or both maintenance and training, we use the residual method to determine the amount of license revenue to be recognized. Under the residual method, consideration is allocated to the undelivered elements based upon vendor-specific objective evidence of fair value ("VSOE") of those elements with the residual of the arrangement fee allocated to and recognized as license revenue. For subscription-based licenses, which include maintenance, we recognize the subscription fees ratably over the subscription periods, which typically range from 1 to 6 months.
48
We have established VSOE based on our historical pricing and discounting practices for maintenance or training when sold separately. In establishing VSOE, we require that a substantial majority of the selling prices for these services fall within a reasonably narrow pricing range. The application of VSOE methodologies requires judgment, including the identification of individual elements in multiple element arrangements and whether there is VSOE for some or all elements. Changes to the elements in our sales arrangements, or our ability to establish VSOE for those elements, may impact the timing of revenue recognition, which may result in a material change to the amount of revenue recorded in a given period.
Share-Based Compensation
We account for stock options granted to employees and directors by recording compensation expense based on the award's fair value, estimated on the date of grant using the Black-Scholes option-pricing model. Share-based compensation expense is recognized on a straight-line basis over the requisite service period of the award, which generally equals the vesting period.
Determining the fair value of stock options under the Black-Scholes option-pricing model requires judgment, including estimating the fair value per share of our common stock as a private company prior to our initial public offering in June 2013, volatility, expected term of the awards, dividend yield and the risk-free interest rate. The assumptions used in calculating the fair value of stock options represent our best estimates, based on management's judgment and subjective future expectations. These estimates involve inherent uncertainties. If any of the assumptions used in the model change significantly, share-based compensation recorded for future awards may differ materially from that recorded for awards granted previously.
We developed our assumptions as follows:
- •
- Fair value of common stock. Prior to the initial public
offering, given the absence of an active market for our common stock, our board of directors was required to estimate the fair value of our common stock at the time of each grant of stock-based awards
as discussed in "—Valuation of Common Stock" below.
- •
- Volatility. The expected price volatility for our common
stock was estimated by taking the median historic price volatility for industry peers based on daily prices over a period equivalent to the expected term of the stock option grants.
- •
- Expected term. The expected term was estimated to be the
mid-point between the vesting date and the expiration date of the award. We believe use of this approach is appropriate as we have no prior history of option exercises upon which to base an expected
term.
- •
- Risk-free interest rate. The risk free interest rate is
based on the yields of United States Treasury securities with maturities similar to the expected term of the options.
- •
- Dividend yield. We have never declared or paid any cash dividends and do not presently plan to pay cash dividends in the foreseeable future. Consequently, we used an expected dividend yield of zero.
We estimate potential forfeitures of stock options and adjust share-based compensation expense accordingly. The estimate of forfeitures is adjusted over the requisite service period to the extent that actual forfeitures differ from the prior estimates. We estimate forfeitures based upon our historical experience and, at each period, review the estimated forfeiture rate and make changes as factors affecting the forfeiture rate calculations and assumptions change.
Refer to Note 13 to our audited consolidated financial statements included elsewhere in this prospectus for the grant date fair value per option, assumptions used in calculating the grant date fair value and other information relating to option activity during the years ended September 30, 2010, 2011
49
and 2012. The following table summarizes the number of options granted and the fair value of our common stock at each grant date for grants since October 1, 2011 and prior to our initial public offering in June 2013:
Grant Date
|
Options Granted |
Exercise Price per Option |
Fair Value per Share |
|||||||
|---|---|---|---|---|---|---|---|---|---|---|
October 2011 |
60,000 | $ | 15.00 | $ | 12.96 | |||||
November 2011 |
125,000 | $ | 15.00 | $ | 13.03 | |||||
January 2012 |
484,486 | $ | 13.03 | $ | 13.03 | |||||
August 2012 |
40,000 | $ | 13.03 | $ | 13.03 | |||||
September 2012 |
20,000 | $ | 13.03 | $ | 13.03 | |||||
October 2012 |
10,000 | $ | 13.92 | $ | 13.92 | |||||
January 2013 |
10,000 | $ | 13.92 | $ | 13.92 | |||||
February 2013 |
20,000 | $ | 14.24 | $ | 14.24 | |||||
In connection with the initial public offering, we granted stock options to purchase 1,020,597 shares of our common stock at our initial public offering price of $15.00.
We also grant Restricted Stock Units ("RSUs") to eligible employees and directors. For RSUs granted prior to the initial public offering, the stated vesting of these grants generally ranged from immediate to three years and only became payable in cash or shares of company stock, at our option, upon either a change in control of our company, as defined in the RSU award agreements, or upon termination of the agreements in connection with an initial public offering of our stock. As neither event had been probable in any period prior to our initial public offering, we had not recognized any share-based compensation expense related to these RSU awards. In connection with our initial public offering in June 2013, all outstanding RSUs were terminated in accordance with their terms and became payable one year following the initial public offering, and we recognized share-based compensation expense of $9.4 million.
Refer to Note 13 to our audited consolidated financial statements included elsewhere in this prospectus for information relating to RSU activity during the years ended September 30, 2010, 2011 and 2012. The following table summarizes the number of RSUs granted and the fair value of our common stock at each grant date for grants since October 1, 2011 and prior to our initial public offering in June 2013:
Grant Date
|
RSUs Granted |
Fair Value per Share |
|||||
|---|---|---|---|---|---|---|---|
November 2011 |
49,600 | $ | 13.03 | ||||
January 2012 |
225,736 | $ | 13.03 | ||||
August 2012 |
10,000 | $ | 13.03 | ||||
February 2013 |
6,400 | $ | 14.24 | ||||
In connection with the initial public offering, we granted 73,010 RSUs with a vesting period ranging from one to three years.
Valuation of Common Stock
Given the absence of an active market for our common stock prior to our initial public offering in June 2013, our board of directors was required to estimate the fair value of our common stock at the date of each grant of share-based awards. Our board of directors considered relevant objective and subjective factors it deemed important in each valuation, exercising significant judgment and reflecting our board of directors' best estimates at the time. These factors included:
- •
- our current and historical operating performance;
50
- •
- our expected future operating performance;
- •
- our financial condition at the grant date;
- •
- any recent privately negotiated sales of our debt securities and related warrants;
- •
- input from management;
- •
- the lack of marketability of our common stock; and
- •
- the likelihood of achieving different liquidity events or remaining a private company.
Valuation Methodologies Used in Determining Fair Value. Our board of directors considered contemporaneous valuations in arriving at the estimated fair value of our common stock. Using the Probability Weighted Expected Result Method ("PWERM") methodology, the value of our common stock was estimated based upon analysis of our company assuming various future outcomes, including an initial public offering at various dates, a sale of our company, as well as the continuation of our company as a private enterprise. Fair value per common share was based upon the probability-weighted present value of these expected outcomes, as well as the rights of each class of preferred stock, common stock, convertible debentures, options and warrants.
October 2011. Our board of directors granted options to purchase 60,000 shares of common stock with an exercise price per share of $15.00 in October 2011. The fair value of our common stock as of September 2011 was determined by our board to be $12.96.
The primary valuation considerations were:
- •
- Total equity value of $214.8 million, which was determined based on the income approach using the PWERM method.
- •
- A discount rate of 22%, our cost of equity.
- •
- Liquidity event scenario probabilities of 25% for an early initial public offering date in November 2012 including
successful completion of two pending acquisitions as of the valuation date, 30% for a late initial public offering taking place in March 2013 including successful completion of two pending
acquisitions as of the valuation date, 20% for an initial public offering date in March 2014 excluding any pending acquisitions, 15% for a sale or merger and 10% for a continuation of our company as a
private enterprise.
- •
- The status of two acquisitions that were in negotiations as of September 2011 and the impact that these acquisitions would
have on our revenue growth rates and operating results if successfully completed.
- •
- The improvement in our operating performance during fiscal 2011.
November 2011. Our board of directors granted options to purchase 125,000 shares of common stock with an exercise price per share of $15.00 in November 2011. The fair value of our common stock as of November 2011 was determined by our board to be $13.03, an increase of 0.5% from $12.96.
The primary valuation considerations were:
- •
- Total equity value of $229.3 million, which was determined based on the income approach using the PWERM method.
- •
- A discount rate of 26%, our cost of equity.
- •
- Liquidity event scenario probabilities of 25% for an early initial public offering date in September 2012, 50% for a late initial public offering taking place in March 2013, 15% for a sale or merger and 10% for a continuation of our company as a private enterprise.
51
- •
- The completion of two acquisitions in October and November 2011, and the impact that these acquisitions were forecasted to have on our revenue growth rates and operating results if successfully integrated.
January, August and September 2012. Our board of directors granted options to purchase 484,486 shares of common stock with an exercise price per share of $13.03 in January 2012, 40,000 shares of common stock with an exercise price per share of $13.03 in August 2012 and 20,000 shares of common stock with an exercise price per share of $13.03 in September 2012, all based on the most recent estimated fair value of our common stock available. No significant events occurred that caused our board of directors and management to believe that the estimated fair value of common stock had changed since November 2011.
October 2012 and January 2013. Our board of directors granted options to purchase 10,000 shares of common stock with an exercise price per share of $13.92 in October 2012 and January 2013. The fair value of our common stock at that time was determined by our board to be $13.92, an increase of 6.9% from $13.03. We performed a valuation of our common stock in connection with our fiscal year beginning October 1, 2012. The increase in the fair value of our common stock was driven primarily by changes in assumptions related to the timing of a liquidity event and adjusted financial projections, which were refined after nearly a year of ownership experience with Submittal Exchange and GradeBeam.
The primary valuation considerations were:
- •
- Total equity value of $250.8 million, which was determined based on the income approach using the PWERM method.
- •
- A discount rate of 24%, our cost of equity.
- •
- Liquidity event scenario probabilities of 30% for an early initial public offering date in May 2013, 50% for a late
initial public offering taking place in September 2013, 15% for a sale or merger and 5% for a continuation of our company as a private enterprise.
- •
- The results of our fiscal 2012 operations.
February 2013. Our board of directors granted options to purchase 20,000 shares of common stock with an exercise price per share of $14.24 in February 2013. The fair value of our common stock at that time was determined by our board to be $14.24. The increase in the fair value of our common stock was driven primarily by changes in our capital structure resulting from the conversion of certain of our convertible debentures in December 2012 and the closer proximity of the valuation date to a potential liquidity event.
The primary valuation considerations were:
- •
- Total equity value of $262.5 million, which was determined based on the income approach using the PWERM method.
- •
- A discount rate of 24%, our cost of equity.
- •
- Liquidity event scenario probabilities of 30% for an early initial public offering date in May 2013, 50% for a late
initial public offering taking place in September 2013, 15% for a sale or merger and 5% for a continuation of our company as a private enterprise.
- •
- The results of operations for our first quarter of fiscal 2013.
52
Accretion of Redemption Premium
Prior to the completion of our initial public offering in June 2013, our redeemable Series A-1 preferred stock was redeemable at the election of the majority of the preferred stock holders beginning in October 2014. To the extent that redemption was requested, the holders would have received the greater of the fair value of the preferred stock at the time of redemption plus cumulative unpaid dividends, regardless if declared or undeclared, or the original issuance price plus cumulative unpaid dividends. We accreted the carrying value of the redeemable Series A-1 preferred stock to the redemption value each reporting period through a decrease or increase to additional paid-in capital. Upon completion of our initial public offering, the redeemable preferred shares automatically converted to common shares at a fixed conversion rate of 1:2.84 and, therefore, we will not record any further accretion. Our board of directors determined the fair value of our redeemable Series A-1 preferred stock concurrent with and considering the same factors as the determination of our common stock as described above.
Accounting for Convertible Debentures
We issued convertible debentures with detachable warrants to purchase common stock on various dates throughout fiscal 2010, 2011 and 2012. We evaluated features of the convertible debentures to determine whether embedded derivatives must be bifurcated and accounted for separately. Separately-accounted-for derivative financial instruments were recorded at fair value as of the issuance date of the convertible debentures, as a debt discount, and remeasured to fair value as of each subsequent balance sheet date. We determined the fair value of derivative financial instruments using the binomial lattice pricing model. We determined the fair value of the debt using a discounted cash flow analysis based on the stated interest rate of the debt and scheduled principal payments, applying our incremental borrowing rate as the discount factor, and the fair value of the detachable warrants using the Black-Scholes model. The assumptions we used in the binomial model and the Black-Scholes model were the fair value of our common stock, as described above, an expected term equal to the contractual term of the derivative or warrant, volatility based on industry peer data as well as assumptions we expect market participants would make in pricing the warrant, risk-free interest rate corresponding to the contractual term, and a dividend yield of zero. Proceeds remaining after recording any derivative financial instruments were allocated to the convertible debentures and the detachable warrants based on their relative fair values at the time of issuance. The debt discount was amortized to interest expense from the issuance date through the various maturity dates of the convertible debentures.
We calculated the amount of any beneficial conversion feature as the difference between the fair value of common stock at the issuance date and the accounting conversion price, multiplied by the number of shares of common stock the investor can receive under the terms of the agreement. The beneficial conversion feature was recorded as a reduction to the convertible debenture's net carrying value and was amortized over the period from the date of issuance to the maturity date of the convertible debenture.
Upon conversion, the unamortized debt discount for debentures that included a beneficial conversion feature was recorded as interest expense, and the unamortized debt discount for debentures that did not include a beneficial conversion feature was recorded in equity. All convertible debentures that were outstanding prior to June 2013 converted to common stock in connection with the completion of our initial public offering.
Goodwill
We test goodwill for impairment separately on an annual basis in the fourth quarter or whenever events and circumstances indicate that goodwill may be impaired. We test goodwill for impairment at a
53
single reporting unit level and we have not reported any goodwill impairments to date. Based on our testing, the fair value of our reporting unit substantially exceeded its carrying value.
We evaluated both qualitative and quantitative characteristics in determining our reporting units. Based on this evaluation, we determined that we have one reporting unit. Each of the components within this reporting unit was determined to have similar economic characteristics and therefore should be aggregated. We reached this conclusion because the components utilize a common distribution platform that enables sharing of resources and development across our solutions, provide for the expansion of our suite of solutions to various stages of the construction process lifecycle to a similar customer base and, in the long-term, are expected to have comparable earnings before tax and interest percentages. In addition, the majority of the components utilize a common distribution platform that enables sharing of resources and development across solutions. We also believe that goodwill is recoverable from the overall operations given the economies of scale and leveraging capabilities of the various components.
The process of evaluating the potential impairment of goodwill requires significant judgment at many points during the analysis. To determine estimated fair value of our reporting unit, we used the income approach, under which fair value was calculated based on estimated discounted future cash flows. The income approach was determined to be the most representative valuation technique that would be utilized by a market participant in an assumed transaction. Significant assumptions are based on historical and forecasted results of operations, and consider estimates of cash flows consistent with the plans and estimates used to manage the business, including significant assumptions as to revenue growth, operating costs and expenses and operating cash flows, as well as various assumptions for attrition, weighted average cost of capital and terminal growth.
If management's estimates of future operating results change, if there are changes in identified reporting units or if there are changes to other significant assumptions, the estimated carrying values of such reporting units and the estimated fair value of goodwill could change significantly, and could result in an impairment charge.
Intangible Assets
Intangible assets consist of acquired developed product technologies, acquired client relationships, non-competition agreements and trade names. We record intangible assets at fair value and amortize them over their estimated useful lives. We estimate the useful lives of acquired developed product technologies, existing client relationships and trade names based on factors that include the planned use of and the expected pattern of future cash flows to be derived from each of them. The useful lives of non-competition agreements are equal to their contractual lives. We include amortization of intangible assets in depreciation and amortization expenses in our consolidated statement of operations.
We assess the impairment of identifiable intangible assets whenever events or changes in circumstances indicate that an asset's carrying amount may not be recoverable. Examples of such events or circumstances include, but are not limited to, significant underperformance relative to historical or projected future results, significant negative changes in the manner of use of the acquired assets in our business or material negative changes in relationships with significant customers. An impairment loss would be recognized when the sum of the undiscounted estimated future cash flows expected to result from the use of the asset and its eventual disposition is less than its carrying amount. Such impairment loss would be measured as the difference between the carrying amount of the asset and its fair value. Cash flow assumptions are based on historical and forecasted revenue, operating costs and other relevant factors. If management's estimates of future operating results change, or if there are changes to other assumptions, the estimate of the fair value of our intangible assets could change significantly. Such change could result in impairment charges in future periods, which could have a significant impact on our operating results and financial condition. We have not recorded any impairment charges to date.
54
During fiscal 2012, the actual operating results for GradeBeam met assumptions management used to determine the purchase price of the acquisition, but underperformed compared to GradeBeam's revenue forecast at the time of acquisition. In preparing projected future results and analysis of recent actual results, we believe a triggering event had occurred requiring an impairment analysis. The impairment analysis of GradeBeam's developed technology and customer relationship carrying values during the fourth quarter of 2012 indicated there was no impairment.
Results of Operations
The following tables set forth our results of operations for the periods presented and as a percentage of our revenue for those periods. The period-to-period comparison of financial results is not necessarily indicative of future results.
| |
Years Ended September 30, | Nine Months Ended June 30, |
||||||||||||||
|---|---|---|---|---|---|---|---|---|---|---|---|---|---|---|---|---|
| |
2010 | 2011 | 2012 | 2012 | 2013 | |||||||||||
| |
(dollars in thousands) |
|||||||||||||||
Revenue |
$ | 6,020 | $ | 10,514 | $ | 21,681 | $ | 15,362 | $ | 24,681 | ||||||
Operating expense: |
||||||||||||||||
Cost of services |
4,187 | 4,395 | 6,152 | 4,361 | 8,222 | |||||||||||
General and administrative |
5,654 | 6,856 | 11,105 | 8,180 | 17,074 | |||||||||||
Sales and marketing |
3,122 | 2,601 | 5,995 | 4,162 | 9,535 | |||||||||||
Technology and development |
4,747 | 6,169 | 11,123 | 8,433 | 13,703 | |||||||||||
Depreciation and amortization |
2,621 | 2,161 | 4,080 | 3,018 | 3,167 | |||||||||||
Total operating expense |
20,331 | 22,182 | 38,455 | 28,154 | 51,701 | |||||||||||
Loss from operations |
(14,311 | ) | (11,668 | ) | (16,774 | ) | (12,792 | ) | (27,020 | ) | ||||||
Other expense, net |
(1,612 | ) | (7,260 | ) | (2,019 | ) | (1,502 | ) | (4,055 | ) | ||||||
Loss before income taxes |
(15,923 | ) | (18,928 | ) | (18,793 | ) | (14,294 | ) | (31,075 | ) | ||||||
Income tax provision |
— | — | — | — | 226 | |||||||||||
Net loss |
(15,923 | ) | (18,928 | ) | (18,793 | ) | (14,294 | ) | (31,301 | ) | ||||||
Less: Net loss attributable to non-controlling interests |
— | — | (2,866 | ) | (1,966 | ) | (2,643 | ) | ||||||||
Net loss attributable to Textura Corporation |
(15,923 | ) | (18,928 | ) | (15,927 | ) | (12,328 | ) | (28,658 | ) | ||||||
Accretion (decretion) of redeemable Series A-1 preferred stock |
(19,802 | ) | 11,486 | 3,373 | 656 | 3,549 | ||||||||||
Accretion of redeemable non-controlling interest |
— | — | — | — | 222 | |||||||||||
Dividends on Series A-2 preferred stock |
480 | 480 | 480 | 360 | 335 | |||||||||||
Undistributed earnings allocated to participating securities |
1,506 | — | — | — | — | |||||||||||
Beneficial conversion of Series A-2 preferred stock |
— | — | — | — | 7,161 | |||||||||||
Net income (loss) available to Textura Corporation common stockholders |
$ | 1,893 | $ | (30,894 | ) | $ | (19,780 | ) | $ | (13,344 | ) | $ | (39,925 | ) | ||
55
| |
Years Ended September 30, | Nine Months Ended June 30, |
||||||||||||||
|---|---|---|---|---|---|---|---|---|---|---|---|---|---|---|---|---|
| |
2010 | 2011 | 2012 | 2012 | 2013 | |||||||||||
Revenue |
100.0 | % | 100.0 | % | 100.0 | % | 100.0 | % | 100.0 | % | ||||||
Operating expense: |
||||||||||||||||
Cost of services |
69.6 | % | 41.8 | % | 28.4 | % | 28.4 | % | 33.3 | % | ||||||
General and administrative |
93.9 | % | 65.2 | % | 51.2 | % | 53.2 | % | 69.2 | % | ||||||
Sales and marketing |
51.9 | % | 24.7 | % | 27.7 | % | 27.1 | % | 38.6 | % | ||||||
Technology and development |
78.9 | % | 58.7 | % | 51.3 | % | 54.9 | % | 55.5 | % | ||||||
Depreciation and amortization |
43.5 | % | 20.6 | % | 18.8 | % | 19.6 | % | 12.8 | % | ||||||
Total operating expense |
337.7 | % | 211.0 | % | 177.4 | % | 183.3 | % | 209.5 | % | ||||||
Income (loss) from operations |
(237.7 | )% | (111.0 | )% | (77.4 | )% | (83.3 | )% | (109.5 | )% | ||||||
Other expense, net |
(26.8 | )% | (69.1 | )% | (9.3 | )% | (9.8 | )% | (16.4 | )% | ||||||
Income (loss) before taxes |
(264.5 | )% | (180.0 | )% | (86.7 | )% | (93.0 | )% | (125.9 | )% | ||||||
Income tax provision |
— | — | — | — | 0.9 | % | ||||||||||
Net income (loss) |
(264.5 | )% | (180.0 | )% | (86.7 | )% | (93.0 | )% | (126.8) | % | ||||||
Less: Net loss attributable to non-controlling interests |
— | — | (13.2 | )% | (12.8 | )% | (10.7 | )% | ||||||||
Net loss attributable to Textura Corporation |
(264.5 | )% | (180.0 | )% | (73.5 | )% | (80.2 | )% | (116.1 | )% | ||||||
Accretion (decretion) of redeemable Series A-1 preferred stock |
(328.9 | )% | 109.2 | % | 15.6 | % | 4.3 | % | 14.4 | % | ||||||
Accretion of redeemable non-controlling interest |
— | — | — | — | 0.9 | % | ||||||||||
Dividends on Series A-2 preferred stock |
8.0 | % | 4.6 | % | 2.2 | % | 2.3 | % | 1.4 | % | ||||||
Undistributed earnings allocated to participating securities |
25.0 | % | — | — | — | — | ||||||||||
Beneficial conversion of Series A-2 preferred stock |
— | — | — | — | 29.0 | % | ||||||||||
Net income (loss) available to Textura Corporation common stockholders |
31.4 | % | (293.8 | )% | (91.2 | )% | (86.9 | )% | (161.8 | )% | ||||||
Years ended September 30, 2010, 2011 and 2012
Revenue
| |
Years Ended September 30, | Change from prior period |
||||||||||||||
|---|---|---|---|---|---|---|---|---|---|---|---|---|---|---|---|---|
| |
2010 | 2011 | 2012 | 2011 | 2012 | |||||||||||
| |
(dollars in thousands, except where otherwise indicated) |
|
|
|||||||||||||
Activity-driven revenue |
$ | 5,705 | $ | 9,875 | $ | 19,064 | 73.1 | % | 93.1 | % | ||||||
Organization-driven revenue |
315 | 639 | 2,617 | 102.9 | % | 309.5 | % | |||||||||
Total revenue |
$ | 6,020 | $ | 10,514 | $ | 21,681 | 74.7 | % | 106.2 | % | ||||||
Activity-driven revenue: |
||||||||||||||||
Number of projects added |
1,898 | 2,475 | 4,167 | 30.4 | % | 68.4 | % | |||||||||
Client-reported construction value added (billions) |
$ | 18.4 | $ | 19.4 | $ | 33.8 | 5.4 | % | 74.2 | % | ||||||
Active projects during period |
2,783 | 3,952 | 6,393 | 42.0 | % | 61.8 | % | |||||||||
Organization-driven revenue: |
||||||||||||||||
Number of organizations |
151 | 945 | 5,204 | 525.8 | % | 450.7 | % | |||||||||
56
Activity-driven revenue. Activity-driven revenue increased $9.2 million, or 93.1%, in fiscal 2012 as compared to fiscal 2011, primarily due to an increase of 68.4% in projects added and an increase of 74.2% in client-reported construction value added. Our acquisition of Submittal Exchange in November 2011 generated $2.8 million of revenue in fiscal 2012 and increased the number of projects added and client-reported construction value added by 1,239 and $9.3 billion, respectively. The remainder of the increase was the result of recently added clients adding their projects to our solutions and our success in adding new clients. Activity-driven revenue also continued to benefit from a change in pricing structure for our subcontractor clients that took effect during fiscal 2011 and is described below.
Activity-driven revenue increased $4.2 million, or 73.1%, in fiscal 2011 as compared to fiscal 2010. This increase was due to a number of factors, including a change in our pricing structure for our subcontractor clients on our CPM solution that took effect during fiscal 2011, an increase of 30.4% in projects added and an increase of 5.4% in client-reported construction value added. Management instituted a change in our pricing structure for our subcontractor clients that affected all projects added to our CPM solution after December 31, 2010. This change in pricing structure was implemented to make our fees simpler and more transparent. Previously, we charged subcontractors a fee for each payment processed on our system. Under the new structure, we charge subcontractors a fee based on a percentage of their contract value. This change resulted in increased fees for certain subcontractors and decreased fees for others, but the overall effect was to increase the total fees received from subcontractors using our CPM solution. Growth in projects added and client-reported construction value added was unfavorably impacted during the year by our decision to modify our sales approach. Management reviewed prior sales activity and determined that sales being part of our client services group and executive team responsibilities would be more effective than a direct sales approach. This change in organizational responsibilities and headcount, however, resulted in a temporary reduction in sales activity.
Organization-driven revenue. Organization-driven revenue increased $2.0 million, or 309.5%, in fiscal 2012 as compared to fiscal 2011, primarily due to the acquisition of GradeBeam in October 2011, which added $2.1 million of revenue in fiscal 2012 and increased the number of organizations by 3,633.
Organization-driven revenue increased $0.3 million, or 102.9%, in fiscal 2011 as compared to fiscal 2010, primarily due to increased adoption of our PQM solution that was launched in October 2009.
Cost of services
| |
Years Ended September 30, | Change from prior period |
||||||||||||||
|---|---|---|---|---|---|---|---|---|---|---|---|---|---|---|---|---|
| |
2010 | 2011 | 2012 | 2011 | 2012 | |||||||||||
| |
(dollars in thousands) |
|
|
|||||||||||||
Cost of services |
$ | 4,187 | $ | 4,395 | $ | 6,152 | 5.0 | % | 40.0 | % | ||||||
Percent of revenue |
69.6 | % | 41.8 | % | 28.4 | % | ||||||||||
Cost of services increased $1.8 million, or 40.0%, from fiscal 2011 to fiscal 2012. The increase was primarily attributable to $1.0 million in increased personnel and related expense due to the addition of employees through the acquisitions of GradeBeam and Submittal Exchange and subsequent hiring and $0.5 million of increased hosting and licensing expenses to support the technology acquired in these acquisitions. Aside from the increased costs associated with these acquisitions, our cost structure has been generally consistent. As a result, cost of services as a percentage of revenue has decreased over the periods reflected in the table above primarily due to revenue growth.
Cost of services increased $0.2 million, or 5.0%, from fiscal 2010 to fiscal 2011. In April 2010, we streamlined and reorganized our client services group, resulting in an increase in productivity and improvement in our ability to provide service to our customers. This led to a decrease of $0.7 million in employee-related costs from fiscal 2010 to fiscal 2011, despite growth of our business and the increase
57
in our revenue over that same time period. This decrease was offset by $1.0 million in accrued bonuses for fiscal 2011.
General and administrative
| |
Years Ended September 30, | Change from prior period |
||||||||||||||
|---|---|---|---|---|---|---|---|---|---|---|---|---|---|---|---|---|
| |
2010 | 2011 | 2012 | 2011 | 2012 | |||||||||||
| |
(dollars in thousands) |
|
|
|||||||||||||
General and administrative |
$ | 5,654 | $ | 6,856 | $ | 11,105 | 21.3 | % | 62.0 | % | ||||||
Percent of revenue |
93.9 | % | 65.2 | % | 51.2 | % | ||||||||||
General and administrative expenses increased $4.2 million, or 62.0%, from fiscal 2011 to fiscal 2012. The increase was primarily attributable to $0.5 million in personnel-related expenses, $0.8 million in professional services fees, and $0.6 million in share-based compensation expense. The acquisitions of Submittal Exchange and GradeBeam resulted in $1.7 million in additional general and administrative expenses post-acquisition, including $0.8 million for employee-related costs, $0.6 million for occupancy and general office expenses, $0.1 million in professional service fees, and $0.1 million in travel expenses.
General and administrative expenses increased $1.2 million, or 21.3%, from fiscal 2010 to fiscal 2011, attributable to increased employee-related costs from greater headcount and accrued bonuses.
Sales and marketing
| |
Years Ended September 30, | Change from prior period |
||||||||||||||
|---|---|---|---|---|---|---|---|---|---|---|---|---|---|---|---|---|
| |
2010 | 2011 | 2012 | 2011 | 2012 | |||||||||||
| |
(dollars in thousands) |
|
|
|||||||||||||
Sales and marketing |
$ | 3,122 | $ | 2,601 | $ | 5,995 | (16.7 | )% | 130.5 | % | ||||||
Percent of revenue |
51.9 | % | 24.7 | % | 27.7 | % | ||||||||||
Sales and marketing expenses increased $3.4 million, or 130.5%, from fiscal 2011 to fiscal 2012. The increase was primarily attributable to the acquisitions of GradeBeam and Submittal Exchange, including $2.9 million in increased personnel-related expense due to the addition of employees through these acquisitions and subsequent hiring, and $0.3 million in increased marketing and promotional expenses. Both GradeBeam and Submittal Exchange have a higher sales and marketing cost as a percentage of revenue than our other solutions. This increase in sales and marketing expense in fiscal 2012 was partially offset by reduced sales headcount resulting from our decision during the year to change our sales approach for certain of our solutions to an enterprise relationship focus performed by our client services group and executive team.
Sales and marketing expenses decreased $0.5 million, or 16.7%, from fiscal 2010 to fiscal 2011, primarily due to reduced share-based compensation costs and recruiting fees, as a result of the decision to streamline our direct sales group.
Technology and development
| |
Years Ended September 30, | Change from prior period |
||||||||||||||
|---|---|---|---|---|---|---|---|---|---|---|---|---|---|---|---|---|
| |
2010 | 2011 | 2012 | 2011 | 2012 | |||||||||||
| |
(dollars in thousands) |
|
|
|||||||||||||
Technology and development |
$ | 4,747 | $ | 6,169 | $ | 11,123 | 30.0 | % | 80.3 | % | ||||||
Percent of revenue |
78.9 | % | 58.7 | % | 51.3 | % | ||||||||||
Technology and development expenses increased $5.0 million, or 80.3%, from fiscal 2011 to fiscal 2012. The increase was primarily attributable to increased employee-related expenses as we added
58
headcount and utilized third-party contractors to enhance the functionality of our suite of solutions. The acquisitions of Submittal Exchange and GradeBeam also contributed to the increase in expenses and headcount. Headcount increased by 112% in fiscal 2012 over the prior year.
Technology and development expenses increased $1.4 million, or 30.0%, from fiscal 2010 to fiscal 2011. The increase was primarily attributable to increased employee-related expenses as we added headcount and utilized third-party contractors to enhance the functionality of our suite of solutions.
Depreciation and amortization
| |
Years Ended September 30, | Change from prior period |
||||||||||||||
|---|---|---|---|---|---|---|---|---|---|---|---|---|---|---|---|---|
| |
2010 | 2011 | 2012 | 2011 | 2012 | |||||||||||
| |
(dollars in thousands) |
|
|
|||||||||||||
Depreciation and amortization |
$ | 2,621 | $ | 2,161 | $ | 4,080 | (17.6 | )% | 88.8 | % | ||||||
Percent of revenue |
43.5 | % | 20.6 | % | 18.8 | % | ||||||||||
Depreciation and amortization expenses increased $1.9 million, or 88.8%, from fiscal 2011 to fiscal 2012. The increase was principally attributable to amortization of intangible assets acquired through the acquisitions of GradeBeam and Submittal Exchange in fiscal 2012.
Depreciation and amortization expenses decreased $0.5 million, or 17.6%, from fiscal 2010 to fiscal 2011. The decrease was primarily attributable to a reduction in depreciation expense as various assets were fully depreciated in fiscal 2010.
Other expense, net
| |
Years Ended September 30, | Change from prior period |
||||||||||||||
|---|---|---|---|---|---|---|---|---|---|---|---|---|---|---|---|---|
| |
2010 | 2011 | 2012 | 2011 | 2012 | |||||||||||
| |
(dollars in thousands) |
|
|
|||||||||||||
Other expense, net |
$ | (1,612 | ) | $ | (7,260 | ) | $ | (2,019 | ) | 350.4 | % | (72.2) | % | |||
Other expense, net decreased $5.2 million, or 72.2%, from fiscal 2011 to fiscal 2012. The decrease was principally attributable to the $4.6 million of interest expense in fiscal 2011 recognized upon conversion of convertible debentures. There were no convertible debentures converted in fiscal 2012.
Other expense, net increased $5.6 million, or 350.4%, from fiscal 2010 to fiscal 2011. The increase was attributable to $4.6 million of interest expense in fiscal 2011 recognized upon conversion of convertible debentures. There were no convertible debentures converted in fiscal 2010.
Additional metrics
Adjusted EBITDA
| |
Years Ended September 30, | Change from prior period |
||||||||||||||
|---|---|---|---|---|---|---|---|---|---|---|---|---|---|---|---|---|
| |
2010 | 2011 | 2012 | 2011 | 2012 | |||||||||||
| |
(dollars in thousands) |
|
|
|||||||||||||
Adjusted EBITDA |
$ | (9,565 | ) | $ | (8,031 | ) | $ | (9,346 | ) | 16.0 | % | 16.4 | % | |||
Adjusted EBITDA decreased $1.3 million, or 16.4%, from fiscal 2011 to fiscal 2012. The decrease was primarily due to the business developments described above, which led to an increase in loss from operations of $5.1 million, offset by an increase in depreciation and amortization expense of $1.9 million as described above and an increase in share-based compensation expense of $1.2 million.
Adjusted EBITDA increased $1.5 million, or 16.0%, from fiscal 2010 to fiscal 2011. The increase was primarily due to the business developments described above, which led to a decreased loss from
59
operations of $2.6 million, offset by a decrease in depreciation and amortization expense of $0.5 million as described above and a decrease in share-based compensation expense of $0.7 million.
Deferred revenue balance
| |
As of September 30, | Change from prior period |
||||||||||||||
|---|---|---|---|---|---|---|---|---|---|---|---|---|---|---|---|---|
| |
2010 | 2011 | 2012 | 2011 | 2012 | |||||||||||
| |
(dollars in thousands) |
|
|
|||||||||||||
Deferred revenue, current and long-term |
$ | 2,396 | $ | 5,279 | $ | 14,166 | 120.3 | % | 168.3 | % | ||||||
Deferred revenue increased $8.9 million, or 168.3%, from September 30, 2011 to September 30, 2012. The increase was attributable in part to the growth from increased billings in CPM usage fees to subcontractors. The increase also was attributable to $2.8 million in deferred revenue acquired through the acquisitions of GradeBeam and Submittal Exchange in 2012, and an increase of these balances post acquisition of $2.5 million resulting from continued growth.
Deferred revenue increased $2.9 million, or 120.3%, from September 30, 2010 to September 30, 2011. The increase was primarily attributable to growth from increased billings in CPM usage and project fees.
Nine months ended June 30, 2012 and 2013
Revenue
| |
Nine Months Ended June 30, |
|
||||||||
|---|---|---|---|---|---|---|---|---|---|---|
| |
2012 | 2013 | % Change | |||||||
| |
(dollars in thousands, except where otherwise indicated) |
|
||||||||
Activity-driven revenue |
$ | 13,484 | $ | 19,773 | 46.6 | % | ||||
Organization-driven revenue |
1,878 | 4,908 | 161.3 | % | ||||||
Total revenue |
$ | 15,362 | $ | 24,681 | 60.7 | % | ||||
Activity-driven revenue: |
||||||||||
Number of projects added |
2,989 | 3,741 | 25.2 | % | ||||||
Client-reported construction value added (billions) |
$ | 25.7 | $ | 32.3 | 25.7 | % | ||||
Active projects during period |
5,265 | 7,666 | 45.6 | % | ||||||
Organization-driven revenue: |
||||||||||
Number of organizations |
4,594 | 8,210 | 78.7 | % | ||||||
Activity-driven revenue. Activity-driven revenue increased $6.3 million, or 46.6%, in the nine months ended June 30, 2013 as compared to the nine months ended June 30, 2012. The increase was primarily due to a 25.2% increase in the number of projects added to our solutions, a 45.6% increase in the number of active projects during the period, and a 25.7% increase in client-reported construction value added.
Organization-driven revenue. Organization-driven revenue increased $3.0 million, or 161.3%, in the nine months ended June 30, 2013 as compared to the nine months ended June 30, 2012. Our acquisition of PlanSwift on January 31, 2013 generated $2.5 million of revenue and increased the number of organizations by 3,081 in the nine months ended June 30, 2013. The remainder of the increase was primarily due to an increase in the number of organizations using our other solutions.
60
Cost of services
| |
Nine Months Ended June 30, |
|
||||||||
|---|---|---|---|---|---|---|---|---|---|---|
| |
2012 | 2013 | % Change | |||||||
| |
(dollars in thousands) |
|
||||||||
Cost of services |
$ | 4,361 | $ | 8,222 | 88.5 | % | ||||
Percent of revenue |
28.4 | % | 33.3 | % | ||||||
Cost of services increased $3.9 million, or 88.5%, in the nine months ended June 30, 2013 as compared to the nine months ended June 30, 2012. The increase in cost of services was primarily due to a $3.5 million increase in personnel-related expenses, driven by stock-based compensation and one-time bonuses paid to long-tenured employees in connection with the initial public offering as well as increased headcount. In addition, other service-related costs increased $0.3 million due to revenue growth for our solutions, including revenue from the PlanSwift solution.
General and administrative
| |
Nine Months Ended June 30, |
|
||||||||
|---|---|---|---|---|---|---|---|---|---|---|
| |
2012 | 2013 | % Change | |||||||
| |
(dollars in thousands) |
|
||||||||
General and administrative |
$ | 8,180 | $ | 17,074 | 108.7 | % | ||||
Percent of revenue |
53.2 | % | 69.2 | % | ||||||
General and administrative expenses increased $8.9 million, or 108.7%, in the nine months ended June 30, 2013 as compared to the nine months ended June 30, 2012. The increase was primarily due to a $5.3 million increase in personnel-related expenses and a $1.6 million increase related to legal and accounting costs to support the preparation for our initial public offering. The increase in personnel expenses was due primarily to stock-based compensation and one-time bonuses paid to long-tenured employees in connection with the initial public offering as well as an increase in headcount as additional resources have been added to support the initial public offering process. In addition, facilities and rent expense increased by $0.3 million, equipment and maintenance expense increased by $0.2 million, travel expense increased by $0.1 million, and other miscellaneous overhead expenses increased by $1.4 million.
Sales and marketing
| |
Nine Months Ended June 30, |
|
||||||||
|---|---|---|---|---|---|---|---|---|---|---|
| |
2012 | 2013 | % Change | |||||||
| |
(dollars in thousands) |
|
||||||||
Sales and marketing |
$ | 4,162 | $ | 9,535 | 129.1 | % | ||||
Percent of revenue |
27.1 | % | 38.6 | % | ||||||
Sales and marketing expenses increased $5.4 million, or 129.1%, in the nine months ended June 30, 2013 as compared to the nine months ended June 30, 2012. The increase was primarily due to a $4.9 million increase in personnel-related expenses which related to stock-based compensation and one-time bonuses paid to long-tenured employees in connection with the initial public offering as well as expenses from the acquisition of PlanSwift and subsequent hiring. In addition, promotional activities and travel expenses each increased by $0.2 million.
61
Technology and development
| |
Nine Months Ended June 30, |
|
||||||||
|---|---|---|---|---|---|---|---|---|---|---|
| |
2012 | 2013 | % Change | |||||||
| |
(dollars in thousands) |
|
||||||||
Technology and development |
$ | 8,433 | $ | 13,703 | 62.5 | % | ||||
Percent of revenue |
54.9 | % | 55.5 | % | ||||||
Technology and development expenses increased $5.3 million, or 62.5%, in the nine months ended June 30, 2013 as compared to the nine months ended June 30, 2012. The increase was primarily due to a $6.0 million increase in personnel-related expenses, driven by stock-based compensation and one time bonuses paid to long-tenured employees in connection with the initial public offering as well as additional headcount, and a $0.1 million increase in equipment and maintenance expenses. These increases in technology and development expenses were partially offset by a $0.8 million decrease in third-party development fees as a portion of the development projects performed by outside developers in previous periods were either completed prior to the current period or performed by the internal development staff.
Depreciation and amortization
| |
Nine Months Ended June 30, |
|
||||||||
|---|---|---|---|---|---|---|---|---|---|---|
| |
2012 | 2013 | % Change | |||||||
| |
(dollars in thousands) |
|
||||||||
Depreciation and amortization |
$ | 3,018 | $ | 3,167 | 4.9 | % | ||||
Percent of revenue |
19.6 | % | 12.8 | % | ||||||
Depreciation and amortization expenses increased by $0.1 million, or 4.9%, in the nine months ended June 30, 2013 as compared to the nine months ended June 30, 2012. The increase was due primarily to a $0.6 million increase in amortization expenses related to the intangible assets acquired in the acquisition of PlanSwift in the second quarter of fiscal 2013 and a $0.1 million increase in expense related to a full three quarters' amortization of Submittal Exchange intangible assets acquired in the three months ended December 31, 2011. These increases were partially offset by a $0.6 million decrease in amortization expense due to certain internal software that had become fully amortized in September 2012.
Other expense, net
| |
Nine Months Ended June 30, |
|
||||||||
|---|---|---|---|---|---|---|---|---|---|---|
| |
2012 | 2013 | % Change | |||||||
| |
(dollars in thousands) |
|
||||||||
Other expense, net |
$ | (1,502 | ) | $ | (4,055 | ) | 170.0 | % | ||
Other expense, net, increased by $2.6 million, or 170.0%, in the nine months ended June 30, 2013 as compared to the nine months ended June 30, 2012. The increase was due primarily to $2.3 million in interest expense recognized upon the conversion of convertible debentures in December 2012 and June 2013, as well as $0.8 million in interest recognized on notes that were issued in the second quarter of fiscal 2013 and repaid in connection with the initial public offering. These increases in other expense, net, were partially offset by a $0.4 million non-cash gain related to the change in the fair value of derivatives.
62
Additional metrics
| |
Nine Months Ended June 30, |
|
||||||||
|---|---|---|---|---|---|---|---|---|---|---|
| |
2012 | 2013 | % Change | |||||||
| |
(dollars in thousands) |
|
||||||||
Adjusted EBITDA |
$ | (7,081 | ) | $ | (8,760 | ) | 23.7 | % | ||
Adjusted EBITDA decreased $1.7 million, or 23.7%, from the nine months ended June 30, 2012 to the nine months ended June 30, 2013. The decreases were due primarily to higher personnel-related and professional services expenses incurred in connection with the initial public offering and to support the process of becoming a public company, partially offset by higher revenue.
| |
As of September 30, 2012 |
As of June 30, 2013 |
% Change | |||||||
|---|---|---|---|---|---|---|---|---|---|---|
| |
(dollars in thousands) |
|
||||||||
Deferred revenue, current and long-term |
$ | 14,166 | $ | 18,765 | 32.5 | % | ||||
Deferred revenue increased $4.6 million, or 32.5%, from September 30, 2012 to June 30, 2013. The increase was due primarily to an increase in sales for our Submittal Exchange solution during the period and, to a lesser extent, due to our acquisition of PlanSwift.
Unaudited Quarterly Information
The following tables set forth our unaudited quarterly condensed consolidated statements of operations data for each of the nine quarters in the period ended June 30, 2013. The data has been prepared on the same basis as the audited consolidated financial statements and related notes and the unaudited condensed consolidated financial statements and related notes included elsewhere in this prospectus, and you should read the following tables together with such financial statements. The quarterly results of operations include, in the opinion of management, all adjustments, consisting of only normal recurring adjustments, necessary for a fair presentation of this data. Results of interim periods are not necessarily indicative of results for the entire year and are not necessarily indicative of future results.
| |
Three Months Ended | |||||||||||||||||||||||||||
|---|---|---|---|---|---|---|---|---|---|---|---|---|---|---|---|---|---|---|---|---|---|---|---|---|---|---|---|---|
| |
June 30, 2011 |
September 30, 2011 |
December 31, 2011 |
March 31, 2012 |
June 30, 2012 |
September 30, 2012 |
December 31, 2012 |
March 31, 2013 |
June 30, 2013 |
|||||||||||||||||||
| |
(dollars in thousands) |
|||||||||||||||||||||||||||
Revenue |
$ | 2,726 | $ | 3,284 | $ | 4,488 | $ | 5,185 | $ | 5,689 | $ | 6,319 | $ | 6,771 | $ | 8,548 | $ | 9,362 | ||||||||||
Operating expense |
||||||||||||||||||||||||||||
Cost of services |
1,096 | 1,089 | 1,252 | 1,536 | 1,573 | 1,791 | 1,688 | 1,780 | 4,754 | |||||||||||||||||||
General and administrative |
1,735 | 1,768 | 2,538 | 2,853 | 2,789 | 2,925 | 3,705 | 4,561 | 8,808 | |||||||||||||||||||
Sales and marketing |
642 | 572 | 1,077 | 1,432 | 1,653 | 1,833 | 1,818 | 2,284 | 5,433 | |||||||||||||||||||
Technology and development |
1,573 | 1,715 | 2,803 | 2,742 | 2,888 | 2,690 | 2,995 | 3,350 | 7,358 | |||||||||||||||||||
Depreciation and amortization |
528 | 551 | 900 | 1,063 | 1,055 | 1,062 | 760 | 1,113 | 1,294 | |||||||||||||||||||
Total operating expense |
5,574 | 5,695 | 8,570 | 9,626 | 9,958 | 10,301 | 10,966 | 13,088 | 27,647 | |||||||||||||||||||
Loss from operations |
(2,848 | ) | (2,411 | ) | (4,082 | ) | (4,441 | ) | (4,269 | ) | (3,982 | ) | (4,195 | ) | (4,540 | ) | (18,285 | ) | ||||||||||
Other expense, net |
(5,568 | ) | (473 | ) | (487 | ) | (502 | ) | (513 | ) | (517 | ) | (1,813 | ) | (306 | ) | (1,936 | ) | ||||||||||
Loss before income taxes |
(8,416 | ) | (2,884 | ) | (4,569 | ) | (4,943 | ) | (4,782 | ) | (4,499 | ) | (6,008 | ) | (4,846 | ) | (20,221 | ) | ||||||||||
Income tax provision (benefit) |
— | — | — | — | — | — | 35 | 49 | 142 | |||||||||||||||||||
Net loss |
(8,416 | ) | (2,884 | ) | (4,569 | ) | (4,943 | ) | (4,782 | ) | (4,499 | ) | (6,043 | ) | (4,895 | ) | (20,363 | ) | ||||||||||
Less: Net loss attributable to non-controlling interest |
— | — | (416 | ) | (692 | ) | (858 | ) | (900 | ) | (1,046 | ) | (711 | ) | (886 | ) | ||||||||||||
Net loss attributable to Textura Corporation |
$ | (8,416 | ) | $ | (2,884 | ) | $ | (4,153 | ) | $ | (4,251 | ) | $ | (3,924 | ) | $ | (3,599 | ) | $ | (4,997 | ) | $ | (4,184 | ) | $ | (19,477 | ) | |
63
| |
Three Months Ended | |||||||||||||||||||||||||||
|---|---|---|---|---|---|---|---|---|---|---|---|---|---|---|---|---|---|---|---|---|---|---|---|---|---|---|---|---|
Percentage of revenue:
|
June 30, 2011 |
September 30, 2011 |
December 31, 2011 |
March 31, 2012 |
June 30, 2012 |
September 30, 2012 |
December 31, 2012 |
March 31, 2013 |
June 30, 2013 |
|||||||||||||||||||
Revenue |
100 | % | 100 | % | 100 | % | 100 | % | 100 | % | 100 | % | 100 | % | 100 | % | 100 | % | ||||||||||
Operating expense |
||||||||||||||||||||||||||||
Cost of services |
40 | % | 33 | % | 28 | % | 30 | % | 28 | % | 28 | % | 25 | % | 21 | % | 51 | % | ||||||||||
General and administrative |
64 | % | 54 | % | 57 | % | 55 | % | 49 | % | 46 | % | 55 | % | 53 | % | 94 | % | ||||||||||
Sales and marketing |
24 | % | 17 | % | 24 | % | 28 | % | 29 | % | 29 | % | 27 | % | 27 | % | 58 | % | ||||||||||
Technology and development |
58 | % | 52 | % | 62 | % | 53 | % | 51 | % | 43 | % | 44 | % | 39 | % | 79 | % | ||||||||||
Depreciation and amortization |
19 | % | 17 | % | 20 | % | 21 | % | 19 | % | 17 | % | 11 | % | 13 | % | 14 | % | ||||||||||
Total operating expense |
204 | % | 173 | % | 191 | % | 186 | % | 175 | % | 163 | % | 162 | % | 153 | % | 295 | % | ||||||||||
Loss from operations |
(104 | )% | (73 | )% | (91 | )% | (86 | )% | (75 | )% | (63 | )% | (62 | )% | (53 | )% | (195 | )% | ||||||||||
Other expense, net |
(204 | )% | (14 | )% | (11 | )% | (10 | )% | (9 | )% | (8 | )% | (27 | )% | (4 | )% | (21 | )% | ||||||||||
Loss before income taxes |
(309 | )% | (88 | )% | (102 | )% | (95 | )% | (84 | )% | (71 | )% | (89 | )% | (57 | )% | (216 | )% | ||||||||||
Income tax provision (benefit) |
0 | % | 0 | % | 0 | % | 0 | % | 0 | % | 0 | % | 1 | % | 1 | % | 2 | % | ||||||||||
Net loss |
(309 | )% | (88 | )% | (102 | )% | (95 | )% | (84 | )% | (71 | )% | (89 | )% | (57 | )% | (218 | )% | ||||||||||
Less: Net loss attributable to non-controlling interest |
0 | % | 0 | % | (9 | )% | (13 | )% | (15 | )% | (14 | )% | (15 | )% | (8 | )% | (9 | )% | ||||||||||
Net loss attributable to Textura Corporation |
(309 | )% | (88 | )% | (93 | )% | (82 | )% | (69 | )% | (57 | )% | (74 | )% | (49 | )% | (208 | )% | ||||||||||
The following table sets forth our key business metrics for each of the nine quarters in the period ended June 30, 2013.
| |
June 30, 2011 |
September 30, 2011 |
December 31, 2011 |
March 31, 2012 |
June 30, 2012 |
September 30, 2012 |
December 31, 2012 |
March 31, 2013 |
June 30, 2013 |
|||||||||||||||||||
|---|---|---|---|---|---|---|---|---|---|---|---|---|---|---|---|---|---|---|---|---|---|---|---|---|---|---|---|---|
| |
(dollars in thousands, except where otherwise indicated) |
|||||||||||||||||||||||||||
Activity-driven revenue |
$ | 2,635 | $ | 3,171 | $ | 3,978 | $ | 4,518 | $ | 4,988 | $ | 5,581 | $ | 5,986 | $ | 6,772 | $ | 7,015 | ||||||||||
Organization-driven revenue |
91 | 113 | 510 | 667 | 701 | 738 | 785 | 1,776 | 2,347 | |||||||||||||||||||
Total revenue |
$ | 2,726 | $ | 3,284 | $ | 4,488 | $ | 5,185 | $ | 5,689 | $ | 6,319 | $ | 6,771 | $ | 8,548 | $ | 9,362 | ||||||||||
Activity-driven revenue: |
||||||||||||||||||||||||||||
Number of projects added |
644 | 680 | 799 | 967 | 1,226 | 1,175 | 1,048 | 1,245 | 1,467 | |||||||||||||||||||
Client-reported construction value added (billions) |
$ | 4.9 | $ | 4.9 | $ | 8.4 | $ | 7.7 | $ | 8.5 | $ | 9.2 | $ | 7.3 | $ | 10.6 | $ | 13.6 | ||||||||||
Active projects during period |
2,488 | 2,789 | 3,128 | 3,551 | 4,143 | 4,731 | 5,046 | 5,263 | 5,701 | |||||||||||||||||||
Organization-driven revenue: |
||||||||||||||||||||||||||||
Number of organizations |
971 | 945 | 3,974 | 4,029 | 4,594 | 5,204 | 5,412 | 6,997 | 8,210 | |||||||||||||||||||
Deferred revenue as of the end of period |
$ | 3,996 | $ | 5,279 | $ | 8,604 | $ | 10,894 | $ | 12,457 | $ | 14,166 | $ | 14,146 | $ | 16,963 | $ | 18,765 | ||||||||||
Our revenue has increased in each of the quarters presented above as a result of growth in the number of projects and client-reported construction value added to and managed on our solutions, as well as an increase in the number of organizations using our solutions. This growth was in part due to our acquisitions of GradeBeam and Submittal Exchange in the three months ended December 31, 2011 and PlanSwift in the three months ended March 31, 2013. In addition, beginning in the three months ended June 30, 2011, revenue increased in part due to a change in the pricing structure for our subcontractor clients using our CPM solution effective for projects added to our system after January 1, 2011.
Cost of services was generally consistent in the three months ended June 30, 2011 and the three months ended September 30, 2011. Beginning in the three months ended December 31, 2011, the increases in cost of services were primarily due to increased headcount resulting from the acquisitions of GradeBeam and Submittal Exchange. Cost of services increased in the three months ended March 31, 2013 primarily due to increased personnel-related expenses driven by additional headcount. Cost of services increased in the three months ended June 30, 2013 primarily due to an increase in personnel-related expenses, driven by stock-based compensation and one-time bonuses paid to long-tenured employees in connection with the initial public offering. Except for the increased costs associated with the acquisitions in the three months ended December 31, 2011 and costs incurred in connection with the initial public offering, our cost structure has generally not changed. As a result,
64
cost of services as a percentage of revenue has decreased over the periods reflected in the table above primarily due to revenue growth.
General and administrative expenses were generally consistent in the three months ended June 30, 2011 and the three months ended September 30, 2011. General and administrative expenses increased in the three months ended December 31, 2011 due to the acquisitions of GradeBeam and Submittal Exchange during this period and the associated professional services fees. During the three months ended March 31, 2012, general and administrative expenses increased primarily due to our ownership of GradeBeam and Submittal Exchange for a full quarterly period. The increase in general and administrative expenses during the three months ended September 30, 2012 related primarily to increased personnel expenses driven by higher headcount during the period. General and administrative expenses increased in the three months ended December 31, 2012 and March 31, 2013 due to increased professional fees and headcount to support the process of becoming a public company and, to a lesser extent, increased personnel expenses driven by higher headcount related to the acquisition of PlanSwift in January 2013. General and administrative expenses increased in the three months ended June 30, 2013 due to an increase in personnel-related expenses as well as an increase in legal and accounting costs to support the preparation for our initial public offering.
Sales and marketing expenses generally increased over the course of the quarters presented in the table above due to the acquisitions of GradeBeam and Submittal Exchange in the three months ended December 31, 2011. Additionally, we increased staffing in order to support our growth initiatives following these acquisitions. Prior to these acquisitions, during the three months ended September 30, 2011, sales and marketing expenses decreased due to lower marketing and travel expenses. This was a result of the change in our sales approach for certain of our solutions to an enterprise relationship focus performed by our client services group and executive team. Sales and marketing expenses increased in the three months ended March 31, 2013 primarily due to the acquisition of PlanSwift. Sales and marketing expenses increased in the three months ended June 30, 2013 primarily due to an increase in personnel-related expenses, which related to stock-based compensation and one-time bonuses paid to long-tenured employees in connection with the initial public offering as well as expenses from the acquisition of PlanSwift and subsequent hiring.
Technology and development expenses generally increased over the course of the quarters presented in the table above primarily due to increased headcount and higher consulting fees related to the enhancement of our solutions. In addition, technology and development expenses increased beginning in the three months ended December 31, 2011 as a result of the acquisitions of GradeBeam and Submittal Exchange during this period. Technology and development expenses increased in the three months ended March 31, 2013 primarily due to increased headcount, in part driven by our acquisition of PlanSwift in January 2013. Technology and development expenses increased in the three months ended June 30, 2013 primarily due to an increase in personnel-related expenses, driven by stock-based compensation and one-time bonuses paid to long-tenured employees in connection with the initial public offering as well as additional headcount.
Depreciation and amortization expenses were generally consistent in the three months ended June 30, 2011 and the three months ended September 30, 2011. Depreciation and amortization expense increased beginning in the three months ended December 31, 2011 due to the amortization of intangible assets acquired through the GradeBeam and Submittal Exchange acquisitions. Depreciation and amortization expenses decreased in the three months ended December 31, 2012 due to lower amortization expense, as internal software had become fully amortized in September 2012. Depreciation and amortization expenses increased beginning in the three months ended March 31, 2013 due to the amortization of intangible assets acquired through the PlanSwift acquisition in January 2013.
65
Liquidity and Capital Resources
We have financed our operations primarily through the issuance of equity securities, including $77.7 million in net proceeds received in connection with our initial public offering in June 2013, private placements of subordinated convertible debentures, notes payable, leases payable and cash provided by operating activities. Our primary source of liquidity as of June 30, 2013 consisted of $68.6 million of cash and cash equivalents.
Our principal uses of liquidity have been to fund our operations, working capital requirements, capital expenditures, acquisitions and to service our loan payable to related party. We expect that working capital requirements, acquisitions and capital expenditures will continue to be our principal needs for liquidity over the near term.
Over the next 12 months, we have planned capital expenditures of $3.5 million and expected debt service obligations of $2.3 million. We believe that our existing cash and cash equivalents and cash flow from operations will be sufficient to fund our operations, including these capital expenditures and debt service obligations.
The following table sets forth a summary of our cash flows for the periods indicated:
| |
Years Ended September 30, | Nine Months Ended June 30, |
||||||||||||||
|---|---|---|---|---|---|---|---|---|---|---|---|---|---|---|---|---|
| |
2010 | 2011 | 2012 | 2012 | 2013 | |||||||||||
| |
(in thousands) |
|||||||||||||||
Net cash used in operating activities |
$ | (9,842 | ) | $ | (1,909 | ) | $ | (3,403 | ) | $ | (3,176 | ) | $ | (11,234 | ) | |
Net cash used in investing activities |
(184 | ) | (426 | ) | (12,842 | ) | (12,808 | ) | (1,553 | ) | ||||||
Net cash provided by financing activities |
8,194 | 5,200 | 14,478 | 14,414 | 77,279 | |||||||||||
Net Cash Used in Operating Activities
Our net loss and cash flows from operating activities are significantly influenced by our investments in headcount and infrastructure to drive future revenue growth and support that anticipated growth.
Our cash flows from operating activities are affected within the fiscal year by the timing of our invoicing of, and our receipt of payments from, our clients. In particular, our billing cycles for general contractor monthly fees on our CPM solution are concentrated in the second and fourth quarters and are largely collected by the end of the respective quarter. Accordingly, we experience relatively lower levels of billing and client payments in the first and third quarters of each year. We expect this pattern of cash flow from our operating activities to continue in the future.
In the nine months ended June 30, 2013, $17.6 million, or 56.2%, of our net loss of $31.3 million consisted of non-cash items, including $3.2 million of depreciation and amortization expense, $3.2 million of non-cash interest expense and the change in fair value of derivatives and $11.2 million of share-based compensation expense. Working capital changes included a $4.1 million increase in deferred revenue, partially offset by a $0.2 million decrease in accounts payable and accrued expenses and a $1.4 million increase in current and other assets. The increase of $8.1 million in cash used in operating activities from the nine months ended June 30, 2012 to the nine months ended June 30, 2013 was primarily a result of higher expenses incurred both in connection with the initial public offering, including one-time cash bonuses of $3.0 million paid to long-tenured employees, and to support the process of becoming a public company, partially offset by higher revenue during the period, and changes in working capital balances year over year.
In fiscal 2012, $8.1 million, or 43.1%, of our net loss of $18.8 million, consisted of non-cash items, including $4.1 million of depreciation and amortization expense, $2.7 million of share-based compensation expense and $1.3 million of non-cash interest expense on convertible debentures and change in fair value of derivatives. Working capital changes included the $6.1 million increase in
66
deferred revenue, and a $1.9 million increase in accrued expenses, including a bonus accrual for management and employees. The increase of $1.5 million in cash used in operating activities from fiscal 2011 to fiscal 2012 was a result of expenditures made to enhance the functionality of our suite of solutions, as well as the post-acquisition investments made in GradeBeam and Submittal Exchange.
In fiscal 2011, $10.2 million, or 54.0%, of our net loss of $18.9 million, consisted of non-cash items, including $6.6 million of non-cash interest expense on convertible debentures, $2.2 million in depreciation and amortization expense and $1.5 million of share-based compensation expense. Working capital changes included a $2.9 million increase in deferred revenue and a $3.7 million increase in accrued expenses, including a bonus accrual for management and employees. The decrease of $7.9 million in cash used in operating activities from fiscal 2010 to fiscal 2011 was a result of revenue growth from increased project activity primarily driven by recently added clients adding their projects to our solutions. In addition, we changed our pricing structure for our subcontractor clients using our CPM solution, effective on all projects added to system after January 1, 2011. This change accelerated cash receipts and had a positive impact on cash used in operating activities.
In fiscal 2010, $5.8 million, or 36.4%, of our net loss of $15.9 million, consisted of non-cash items, including $2.6 million of depreciation and amortization expense, $2.1 million of share-based compensation expense and $1.0 million of non-cash interest expense related to convertible debentures. Changes in working capital included a $0.2 million increase in accounts receivable due to increased sales and decreases of $0.3 million and $0.4 million in accounts payable and accrued expenses, respectively. These uses of cash were offset by a $1.3 million increase in deferred revenue, due to higher project activity.
Net Cash Used In Investing Activities
Our primary investing activities have consisted of cash used for acquisitions and capital expenditures in support of expanding our infrastructure and workforce. As our business grows, we expect our investment activity to continue to increase.
In the nine months ended June 30, 2013, cash used in investing activities was $1.6 million, which primarily related to $1.0 million in cash paid in connection with our acquisition of PlanSwift in January 2013, capital expenditures of $0.7 million and an increase in restricted cash of $0.2 million. This cash used in investing activities was partially offset by the joint venture partner's cash investment of $0.4 million in our joint venture, which we consolidate in our financial statements. In the nine months ended June 30, 2012, cash used in investing activities was due primarily to the acquisitions of GradeBeam and Submittal Exchange in the three months ended December 31, 2011 and capital expenditures of $0.4 million.
In fiscal 2012, we used $12.8 million of cash in investing activities, which consisted of $2.4 million of net cash consideration for our acquisition of Submittal Exchange, $10.0 million of cash consideration for our acquisition of GradeBeam and $0.4 million of capital expenditures.
In fiscal 2011, we used $0.4 million of cash in investing activities, primarily consisting of $0.3 million of capital expenditures.
In fiscal 2010, we used $0.2 million of cash in investing activities, which were capital expenditures.
Net Cash Provided by Financing Activities
In the nine months ended June 30, 2013, net cash provided by financing activities was $77.3 million, which primarily consisted of $79.0 million in proceeds from the initial public offering, net of underwriting discounts and commissions and other offering costs that we have paid through June 30, 2013, and proceeds from the issuance of long-term notes totaling $6.9 million. These cash inflows were partially offset by $8.0 million in debt repayments and $0.6 million paid for the repurchase of
67
outstanding common shares. In the nine months ended June 30, 2012, cash provided by financing activities was due primarily to proceeds of $14.6 million from the issuance of convertible debentures.
In fiscal 2012, cash provided by financing activities was $14.5 million, primarily due to the issuance of $14.7 million of convertible debentures, of which $1.8 million was allocated to the beneficial conversion feature and the detachable warrants issued in connection with the convertible debentures, partially offset by $0.5 million in payments on the mortgage for our headquarters. The majority of these activities occurred in the three months ended December 31, 2011.
In fiscal 2011, cash provided by financing activities was $5.2 million, primarily due to the issuance of $5.5 million of convertible debentures, of which $0.7 million was allocated to the beneficial conversion feature and the detachable warrants issued in connection with the convertible debentures, partially offset by $0.2 million in payments on the mortgage for our headquarters.
In fiscal 2010, cash provided by financing activities was $8.2 million, primarily due to the issuance of $8.4 million of convertible debentures, of which $1.3 million was allocated to the beneficial conversion feature and the detachable warrants issued in connection with the convertible debentures, partially offset by $0.2 million in payments on the mortgage for our headquarters.
Off-Balance Sheet Arrangements
As part of our ongoing business, we do not have any relationships with other entities or financial partnerships that have been established for the purpose of facilitating off-balance sheet arrangements. We are therefore not exposed to any financing, liquidity, market or credit risk that could arise if we had engaged in those types of relationships.
Contractual Obligations
The following table describes our contractual obligations as of June 30, 2013 (in thousands):
| |
Total | Less Than 1 Year |
1 - 3 years | 3 - 5 years | More than 5 years |
|||||||||||
|---|---|---|---|---|---|---|---|---|---|---|---|---|---|---|---|---|
Loan payable to related party(1) |
$ | 10,469 | $ | 500 | $ | 1,000 | $ | 8,969 | — | |||||||
Interest on loan payable(1) |
1,692 | 560 | 1,038 | 94 | — | |||||||||||
Notes payable |
179 | 21 | 42 | 116 | — | |||||||||||
Lease obligations(2) |
3,575 | 1,192 | 1,639 | 634 | 109 | |||||||||||
Total contractual obligations |
$ | 15,915 | $ | 2,273 | $ | 3,719 | $ | 9,813 | $ | 109 | ||||||
- (1)
- The loan payable to First Midwest Bank has been used exclusively for the purchase of land and the construction of the corporate headquarters facility in Deerfield, Illinois. Interest under the loan is payable at the greater of the 30-day LIBOR plus 4.5% or 5.5%. Estimated interest payments assume the September 30, 2012 interest rate on the loan of 5.5%. The agreement includes a debt service covenant requiring us to maintain a ratio of net cash flow from operations to debt service (both terms as defined in the agreement) of not less than 1.10 to 1.00, and an equity issuance covenant that could limit future equity issuances. Our net cash flow from operations for fiscal 2012 was negative, and we consequently did not satisfy the debt service covenant. We estimate that the additional net cash flow from operations required to satisfy the ratio for the four fiscal quarters ended June 30, 2013 was at least $11.7 million. Compliance with the debt service covenant and any related default was waived by First Midwest Bank through December 31, 2013. Although we do not currently intend to repay the loan, we believe we have sufficient cash to do so in the event we are unable to obtain further waivers or a permanent modification of the debt service covenant. Accordingly, we do not expect that any failure to satisfy such covenant in the future would have a material adverse effect on our operations.
68
- (2)
- Lease obligations include office leases in Chicago, Illinois, Des Moines, Iowa, Phoenix, Arizona and Salt Lake City, Utah and other office furniture and equipment leases.
Internal Control over Financial Reporting
In preparation for our initial public offering and for future compliance with Section 404 of the Sarbanes-Oxley Act, we concluded that a material weakness in internal control over financial reporting related to our control environment existed as of September 30, 2012 as described below.
A material weakness is a deficiency, or combination of deficiencies, in internal control over financial reporting, such that there is a reasonable possibility that a material misstatement of our annual or interim consolidated financial statements will not be prevented, or detected and corrected on a timely basis.
- •
- We did not maintain a sufficient complement of personnel with the appropriate level of accounting knowledge, experience, and training in the application of GAAP commensurate with our financial reporting requirements. Specifically, we did not maintain adequate qualified personnel with regard to certain significant complex transactions and technical accounting matters and we lacked adequate controls regarding training in the relevant accounting guidance, review and documentation of certain complex accounting transactions and review of related accounting disclosures such as the accounting for convertible debenture financing agreements, including any embedded features, business combinations and share-based compensation transactions in accordance with GAAP.
This material weakness in our control environment contributed to the following individual material weaknesses in our internal control over financial reporting:
- •
- We did not maintain effective internal controls related to our accounting for convertible debentures to provide reasonable
assurance that (a) the instruments were valued correctly and (b) all pertinent facts related to the convertible debentures, including the impact of conversion and redemption or other
embedded or derivative features, were identified and considered for appropriate accounting in accordance with GAAP. Specifically, this material weakness resulted in material misstatements and audit
adjustments of non-cash interest expense, convertible debenture and derivative liabilities and additional paid-in capital to the consolidated financial statements for the
fiscal years ended September 30, 2010, 2011 and 2012.
- •
- We did not maintain effective internal controls related to the accounting for business acquisitions to provide reasonable assurance that (a) business combination accounting identified and considered all pertinent factors related to all classes of securities of the acquired entity, including any non-controlling interests and (b) there was appropriate review of the purchase price allocation entries recorded in the consolidated financial statements. Specifically, this material weakness resulted in material misstatements and audit adjustments to non-controlling interest and the related income (loss) attributable to our company and the non-controlling interest, additional paid-in capital, deferred revenue and revenue, goodwill, intangible assets net and the related amortization expense to the consolidated financial statements for the fiscal year ended September 30, 2012.
These material weaknesses could result in misstatements of the aforementioned accounts that would result in a material misstatement to the annual or interim consolidated financial statements that would not be prevented or detected on a timely basis.
Plan for Remediation of the Material Weaknesses
We are currently in the process of implementing our remediation plans. To date, we have implemented and are continuing to implement a number of measures to address the material weaknesses identified. In January 2013, we hired a corporate controller with appropriate experience
69
applying GAAP technical accounting guidance, and we have hired additional accounting personnel over the past several months. We are also designing additional controls around identification, documentation and application of technical accounting guidance with particular emphasis on events outside the ordinary course of business. These controls are expected to include the implementation of additional supervision and review activities by qualified personnel, the preparation of formal accounting memoranda to support our conclusions on technical accounting matters, and the development and use of checklists and research tools to assist in compliance with GAAP with regard to complex accounting issues. We intend to complete the implementation of our remediation plan during fiscal 2013.
In addition, in June 2013, we engaged a third-party provider to help us assess and improve our internal controls for complying with the Sarbanes-Oxley Act. The process of designing and implementing an effective financial reporting system is a continuous effort that requires us to anticipate and react to changes in our business and the economic and regulatory environments and to expend significant resources to maintain a financial reporting system that is adequate to satisfy our reporting obligations. As we continue to evaluate and take actions to improve our internal control over financial reporting, we may determine to take additional actions to address control deficiencies or determine to modify certain of the remediation measures described above.
We cannot assure you that the measures we have taken to date, or any measures we may take in the future, will be sufficient to remediate the material weaknesses we have identified or avoid potential future material weaknesses.
Quantitative and Qualitative Disclosures About Market Risk
Interest Rate Risk
We are exposed to market risk related to changes in interest rates.
At September 30, 2012, we had a loan payable to related party outstanding of $10.7 million and convertible debentures outstanding with principal amounts of $17.2 million. Our convertible debentures converted to common stock in connection with the initial public offering. Our loan payable to related party bears interest at the greater of the 30-day LIBOR plus 4.5% or 5.5%. At September 30, 2012, the interest rate on the loan was 5.5%. Increases in the LIBOR rates would affect operating results and cash flows to the extent LIBOR plus 4.5% exceeds 5.5%. A hypothetical 1.0% increase in the 30-day LIBOR of 0.2143% relative to interest rates at September 30, 2012 would result in an increase of less than $25,000 in interest expense for fiscal 2012. Our interest rate risk has not changed significantly from September 30, 2012 to June 30, 2013.
Foreign Currency Risk
We do not believe that fluctuation in the exchange rates of currencies other than the U.S. dollar has had a material effect on our business, financial condition or results of operations. Less than 10% of our revenues, those derived from clients located in Canada, currently are denominated in a currency other than the U.S. dollar. The effect of an immediate 10% adverse change in foreign exchange rates would not be material to our financial condition or results of operations.
Nonetheless, if we are successful in expanding our global presence, an increasing portion of our future revenue and operating expenses may be denominated in currencies other than the U.S. dollar. If our international operations grow, our risks associated with fluctuation in currency rates would become greater, and we would reassess our approach to managing this risk. In addition, currency fluctuations or a weakening U.S. dollar could increase the costs of our international expansion. To date, we have not entered into any foreign currency hedging contracts, since exchange rate fluctuations have not had a material impact on our operating results and cash flows. Based on our current international operations, we do not plan on engaging in hedging activities in the near future.
70
Inflation Risk
We do not believe that inflation has had a material effect on our business, financial condition or results of operations. Nonetheless, if our costs were to become subject to significant inflationary pressures, we may not be able to fully offset such higher costs through price increases. Our inability or failure to do so could harm our business, financial condition and results of operations.
71
Overview
We are a leading provider of on-demand business collaboration software solutions to the commercial construction industry. Our solutions are focused on facilitating collaboration between owners/developers, general contractors and subcontractors. Our solutions increase efficiency, enable better risk management and provide improved visibility and control of construction activities for our clients, and support several mission-critical business processes at various stages of the construction project lifecycle.
We believe we are a leading example of a new generation of on-demand software solutions focused on enablement of business-to-business collaborative processes. Such solutions are by design on-demand, as they require neutral third parties to act as the platform for collaboration by multiple parties and to facilitate the exchange of data and documents.
We address a large and growing end market. The construction industry was an approximately $1 trillion industry in North America in 2012 and was $8.6 trillion globally in 2012, according to the most recent data available from the United States Census Bureau and "Global Construction 2025," a study produced by Global Construction Perspectives, and represents an important component of developed economies. The industry currently continues to be impacted in certain markets across the globe by slow economic recovery from the global financial crisis, oversupply of occupiable space, and limited availability of credit. However, we believe the business outlook for the industry is strong, driven by demographics, economic growth and aging infrastructure, as well as by changing preferences and new technologies being applied to buildings and structures, which include an increased focus on environmental considerations and lower costs of operation and ownership. We believe the construction industry represents a large and growing market for technology solutions of all types, and is especially attractive for our solutions and our growth as a result of being underpenetrated by those technology solutions that enable construction companies to collaborate with each other to operate more effectively.
We have established a strong market position. As of June 30, 2013, since the date of launch or acquisition of our solutions, our clients have used one or more of our on-demand collaboration solutions to help manage over 15,000 commercial construction projects representing more than $140 billion in construction value as reported by our clients. During fiscal 2012, our clients used one or more of our on-demand solutions to help manage over 4,100 commercial construction projects representing more than $33 billion in construction value as reported by our clients. Our collaboration solutions have been used by more than 3,000 general contractors, owners/developers, and architects. This includes 62 of the 100 largest general contractors in North America, ranked as of May 2013 by Engineering News-Record based on annual construction revenues. In addition, based on management estimates, approximately 300,000 subcontractors were active on our solutions during fiscal 2012. Our solutions are used on construction projects of all sizes, from small remodels or renovations to multi-billion dollar developments.
Our collaboration solutions provide robust functionality, data sharing and exchange capabilities, and workflow tools that support several mission-critical business processes undertaken by our clients:
- •
- Construction Payment Management ("CPM") is our most widely-used solution. Based on shared entry of—and access to—project data and our workflow tools, CPM enables a disciplined, standardized online approach to generating, collecting, reviewing and routing invoices and the necessary supporting documentation and legal documents, and initiation of payment of the invoices. We recently launched CPM-Business, a new version of CPM specifically created to address the needs of mid-market owners and general contractors. The existing CPM solution is now called CPM—Enterprise.
72
- •
- Submittal Exchange is a highly configurable step-by-step workflow tool for collecting, reviewing
and routing project documents among project participants. This solution can be applied to any phase of the construction process and used to manage any type of document including submittals, requests
for information, daily reports, drawings and specifications, architects' supplements and any other document typically exchanged on a project.
- •
- GradeBeam supports the process of obtaining construction bids by allowing those seeking bids to identify potential
bidders, send out invitations-to-bid and track the bidding intent of potential bidders.
- •
- Pre-Qualification Management ("PQM") supports the collection and review of data for effective contractor risk
assessment and qualification, and can be used on a project-by-project basis or as part of an ongoing qualification process.
- •
- Greengrade is our solution to facilitate the workflow and data and document collection necessary to manage the Leadership in Energy and Environmental Design ("LEED") Certification process for construction projects.
In addition, we offer PlanSwift, a take-off and estimating solution used in preparing construction bids, and Contractor Default Claims Management, which supports the process of documenting a subcontractor default insurance claim. We also recently launched BidOrganizer, a new solution designed to help contractors save time and money by providing a central, online location to prioritize, track, and schedule all bid invitations.
We intend to continue expanding our portfolio of solutions to support additional business processes and to develop the capabilities of our existing solutions to provide further value to our clients.
Our revenue model has several attractive characteristics. Our revenue is derived primarily from fees driven by construction project activity, monthly fees and subscription fees. We increase revenue both as we add clients and our clients increase the number of their projects on our solutions. We historically have experienced high recurrence of fees, favorable timing of cash flow and predictable reported revenue.
We engage directly with our clients to sell our solutions, and we have achieved significant growth since introducing our solutions to the market. In the fiscal years ended September 30, 2010, 2011 and 2012, we generated revenue of $6.0 million, $10.5 million and $21.7 million, respectively, which represented growth over the prior period of 90.0%, 74.7% and 106.2%, respectively. In those same periods, we had net losses of $15.9 million, $18.9 million and $18.8 million, respectively. See "Prospectus Summary—Summary Consolidated Financial Data."
Our solutions have global applicability and we are an international business: in fiscal 2012, 10.1% of our revenue was derived from clients located outside the United States, principally Canada, and in October 2012 we entered into a joint venture to begin operations in Australia and New Zealand, attractive construction markets with significant further expansion opportunities. PlanSwift also is offered in several international markets through a network of distributors and resellers.
We believe we have a very large opportunity available to us. Our strategy is to leverage our existing solutions and industry presence to become the industry standard for collaboration and related solutions in the commercial construction industry. We intend to penetrate further our existing markets and capture additional revenue from our clients and expand our suite of solutions through both internal development and the acquisition of complementary businesses. We also plan to increase our market opportunity by expanding both globally and into other industries that experience similar collaboration environments and challenges.
73
We have a strong focus on our industry and its needs, and on client service and satisfaction. Our management team has extensive operational and business development experience, and we believe has the skills and expertise to execute our growth strategies.
Our Industry
The construction industry is large and growing
Construction is a major global industry and consists of building new structures, making additions and modifications to existing structures, as well as conducting maintenance, repair and improvements on existing structures. Worldwide construction spending was $8.6 trillion in 2012, according to the Global Construction 2025 study. A total of $153.9 trillion will be spent on construction worldwide during the period from 2012 to 2025, and in 2025 construction is expected to reach more than $15 trillion in annual spending and account for 13.5% of world GDP, according to the same study. The following sets forth data in the geographic markets we currently serve:
- •
- In the United States, as of December 2012, the annualized value of commercial construction put in place, which
excludes single-family residential construction, was $740 billion, according to the United States Census Bureau.
- •
- In Canada, as of 2012, construction output was $328 billion, according to Global Construction Perspectives.
- •
- In Australia, as of 2012, construction output was $270 billion, according to Global Construction Perspectives.
We believe the outlook for the construction industry is strong. The industry currently continues to be impacted in certain markets across the globe by slow economic recovery from the global financial crisis, oversupply of occupiable space, and limited availability of credit. However, long-term trends of population growth, deteriorating infrastructure and changing needs for buildings—driven by both socioeconomic and technological changes—all imply a continuing and growing need for construction activity. Overall, global construction spending is expected to grow at a compounded annual growth rate of 4.3% from 2012 to 2025, according to Global Construction Perspectives.
Many diverse participants are involved in construction
A construction project involves the participation of many different organizations, in various roles. The principal participants in the construction process include:
- •
- Owners and Developers. The construction process begins
with an owner or developer deciding to undertake the construction of a new building or other structure, or to make improvements or modifications to an existing building or structure. In the case of an
owner, the building will be for the owner's use; and in the case of a developer, the building will be sold or leased to another party. Effectively, any organization can become an owner or developer.
The owner or developer will hire architects and obtain financing, insurance and planning permission, but will generally not undertake or oversee the construction activities. For this, the owner or
developer will look to hire a general contractor.
- •
- General Contractors. General contractors are selected by the owner or developer to oversee the successful completion of the construction process. General contractors take responsibility for the completion of the project from the owner or developer. They may do a portion of the work themselves, often through wholly-owned subsidiaries, but they generally subcontract the significant majority of the work to subcontractors. General contractors often specialize in one or more types of construction such as residential or commercial building, and may further specialize in, for example, healthcare facilities or highways. General contractors range from those that
74
- •
- Subcontractors. Specialty trade contractors perform
specialized activities related to all types of construction such as site preparation and excavation, mechanical, HVAC, plumbing, electrical and landscaping work. Specialty trade contractors are most
commonly referred to as subcontractors as the general contractor is subcontracting out the work. Subcontractors may elect to further subcontract out portions of their work, creating the potential for
a multi-tiered pyramid of participants, all overseen and coordinated by the general contractor, who in turn reports to the owner/developer. Subcontractors can be large multinational organizations, but
are more typically small businesses with just a few employees.
- •
- Other Participants. Many other organizations also are involved in the undertaking of a construction project. These may include material suppliers, architects, financing companies, insurance companies, title companies, owners' representatives, cost engineers and many others. Each fulfills a specific and essential role, at specific stages or throughout the construction project, and has to work in a coordinated manner with other participants to contribute to the project's successful completion.
manage just a few projects in a single market to multi-billion dollar revenue multi-national organizations.
The construction industry can be divided into two segments: commercial construction, which includes the construction of buildings, such as offices, factories, warehouses, schools, hospitals and multi-family residential complexes, and the construction of infrastructure such as roads, bridges, sewers, tunnels and other projects; and single-family residential construction, representing the construction of single-family homes. Single-family residential construction is often performed by a specialized set of developers, general contractors and subcontractors, especially in the United States and Canada, and it typically does not require the types of complex collaboration typically found in the commercial construction segment. Accordingly, we view the market for our collaboration solutions as being primarily the commercial construction segment.
Participants face complex collaboration challenges
Each construction project requires a complex collaborative effort between the many different participants that play a part throughout or at different stages of the project's lifecycle. The participants involved in a project may be working together for the first time, have different working practices, procedures, technology and software solutions, and have limited information about each other. The interaction between the participants begins well in advance of the construction itself—encompassing design, bidding, qualification, contracting and pre-construction—and continues through construction, to eventual close-out and operation. Each step in the process involves multiple, changing participants. The work itself is also ever-changing, with client requirements and in-the-field adjustments often resulting in a large number of modifications to the design and build of the structure, and changes to the scope, sequence and interdependence of participants' tasks.
The practices used by the industry to manage this complexity have been largely manual, paper-based and inefficient, or have relied on technology solutions not designed for collaboration. As a result, we believe participants face numerous challenges collaborating on construction projects, including:
- •
- Significant administrative overhead burden. The manual
processes or technology solutions currently used by project participants are often personnel-intensive and time-consuming and can lead to increased administrative costs.
- •
- Disparate standards, procedures and systems. Inconsistent approaches to sharing information, managing tasks and exchanging critical documentation often lead to miscommunication, inaccuracies, inefficiencies, delays and higher costs.
75
- •
- Lack of workflow discipline and control. Manual processes
make it difficult to ensure that workflows occur in defined steps and desired sequence, and provide limited visibility for effective management and decision-making.
- •
- Inefficient process coordination. In the absence of a
common process framework, participants are likely to utilize their own business processes, documentation, information systems and communication methods. This results in inefficiency, duplicative
effort and potential confusion about responsibilities.
- •
- Errors, inconsistencies and omissions. Processes such as
manually entering data, completing, submitting and reviewing paper documents, verifying conformity of paper documentation with specified requirements and reconciling invoices with work orders often
will result in human error requiring data to be reentered, work to be redone, payments to be cancelled or rerouted and further reconciliation to be conducted.
- •
- Limited risk management tools. The inability to access
timely, accurate and relevant information concerning project status, tasks and participants limits the ability to evaluate and manage the many elements of financial, operational and legal risk each
participant is exposed to on the project, an issue exacerbated when an organization's entire portfolio of construction activities is considered.
- •
- Siloed applications and data repositories. Lack of integration between systems being used by project participants hinders the collection, exchange and sharing of information. As a result, organizations do not have the visibility and control they need to manage construction projects in an efficient manner, exacerbating the other challenges identified above.
The industry is changing in response to the many issues it faces
New challenges as a result of the global financial crisis
The global financial crisis had, and continues to have, a significant and multifaceted impact on the construction industry. Significant downward pressure on construction revenue and profits, the pursuit of business outside of areas of traditional focus and competency, and greater financial instability among the universe of contractors have each required industry participants to significantly change the way they operate. Compounding these challenges, in response to the crisis, many contractors have reduced staff levels significantly, especially in corporate and administrative functions, including information technology departments.
We believe as a result there has been an ever greater emphasis on risk management, efficiency and improved decision making. In response to lower construction volumes but with prospects of recovery, we believe construction executives are placing greater focus on remaining competitive and managing growth while controlling growth in expenses, especially in the back-office.
New approaches to project delivery
There also has been an acceleration of the existing trend in the industry to employ new methods to deliver and finance projects at lower costs and more consistently on a timely basis to owners and developers. These methods often involve greater risk sharing and business collaboration. An example of new ways of organizing project delivery teams is Integrated Project Delivery, a highly collaborative approach in which the participants assembled to construct a building or other structures jointly manage the construction process, enter into multiparty agreements and sometimes share contingencies and profits. Another example is Public Private Partnerships, which are partnerships between a governmental entity and private party in which the private party provides a public service or project, and which are increasingly being used to address challenges in financing projects.
76
Today's construction managers require technology solutions to support these new approaches to collaboration, project delivery and financing methods. We believe these solutions must enable project participants to collaborate more effectively, improve accountability and increase productivity.
The industry also is making increased use of technology to achieve these objectives of lower cost and more consistently timely delivery of projects. Tools such as Building Information Modeling for design, laptops and tablets for on-site access to information, adoption of cloud computing to lower technology costs, and geo-location and radio frequency identification technologies on-site and to manage assets are being used ever more frequently.
New focus on risk management, transparency and efficiency
The recent challenges faced by the construction industry have heightened the importance of effective risk management as a critical element of success and profitability for all organizations. We believe senior-level executives involved in managing construction processes now recognize enterprise risk management as a core business process and competency.
A growing number of owners and contractors we believe also recognize the opportunity to drive efficiency in the construction process through a more transparent and automated procurement and delivery process. Contractors benefit by taking on less risk, while owners avoid unwelcome surprises and gain greater control of the project outcome.
Reduced construction volumes and more intense competition have put direct pressure on profit margins, resulting in an increased focus on both reducing costs and aligning costs to project volumes, eliminating fixed costs and non value-added support and administrative activities.
New opportunity for on-demand business collaboration solutions
The ability to navigate today's construction complexities, and to effectively facilitate the coordination and collaboration of project participants is critical to increasing productivity, lowering costs, managing risk and enhancing transparency. In order to meet this challenge and as companies seek to support growth while limiting costs, we believe industry participants are increasingly willing to adopt software solutions. The importance of these solutions to participants throughout the construction industry and each construction project creates an opportunity for new approaches and solutions focused on collaborative processes, and for solution providers to experience significant demand and capture a greater share of the industry's technology spend.
We believe software solutions delivered on an on-demand basis and by a neutral third party—rather than as the in-house solution of a particular project participant—are necessary to meet this demand. Such solutions can facilitate the exchange of data and information between and within participants in a cost-effective, flexible, scalable and secure manner.
Gartner, an industry research firm, estimates worldwide total end-user spending for cloud application services within the enterprise application software markets will grow at a CAGR of 19.1% from $10.7 billion in 2010 to $32.2 billion in 2016. Gartner also has identified the construction industry as being among those sectors taking the least advantage of technology, spending only 1.1% of revenue as compared to more than 6.0% for the leaders in technology usage such as the banking and financial services industry. We believe the trends described above will drive the construction industry to increase its investment in technology at an accelerating rate.
Our Solution
We are a leading provider of on-demand business collaboration software solutions to the construction industry. Our solutions are focused on facilitating collaboration between owners/developers, general contractors, subcontractors, architects and the many other participants on a
77
construction project. Our solutions address the several challenges associated with the traditional paper-based and personnel-intensive manual approaches or with technology solutions that were not designed for collaborative processes, and support many of the trends currently occurring within the industry. Our solutions combine the ease-of-use and ease-of-deployment of on-demand technology with our industry-specific process expertise and comprehensive client support to deliver immediate and substantial benefits to our clients. We believe our solutions benefit our clients because they are:
- •
- Designed specifically for collaborative processes. Our
collaboration solutions facilitate the sharing and exchange of data between and within organizations, and interface with organizations' existing accounting, enterprise resource planning and other
systems. Data, documents and information can be shared between organizations so that all parties have a single view of the status of the project. All our solutions include robust workflow tools to
ensure that necessary steps are carried out in the right sequence by appropriately authorized users.
- •
- Developed to meet the needs of the construction
industry. Construction projects and the commercial construction industry have specific business processes and practices that require
unique solutions to effectively support them. Non industry-specific invoicing, document management or contract management solutions typically do not have these features. Our solutions are built with
the unique requirements of construction in mind, and we have a strong and knowledgeable client services team responsible for sales, implementation and ongoing support that has specialized expertise in
the needs of our clients.
- •
- Delivered through a trusted and neutral third party. With
our collaboration solutions, we act as a neutral third party in hosting, providing access to and facilitating the exchange of information that is valuable to the participants interacting in the
construction process. These participants may, however, have potentially conflicting incentives and interests, and differing views as to the status of their interaction. We believe our success in
driving adoption of our collaboration solutions derives in part from the benefits that all participants see in having a single shared, negotiated-and-agreed-upon
and transparent view of a project.
- •
- Valuable to all participants. It is a core principle of
our application design that our solutions provide benefits to all users, independent of their specific role or responsibilities on the project. Our solutions seek to achieve reduced costs,
better-managed risk, and improved visibility and better decision-making for each owner/developer, general contractor, subcontractor, architect, material supplier and other third parties involved in
the construction project.
- •
- Interfaced with existing enterprise systems. Our solutions
recognize that our clients have existing systems for enterprise resource planning, accounting, document management, project management and project scheduling, among others, that represent significant
investments for our clients and support business processes that would be highly disruptive to change. As a result, we interface our solutions with these systems in order to leverage and protect
existing investments, facilitate business processes and reduce or eliminate duplicate data entry.
- •
- Easy to implement. Our collaboration solutions are offered
on-demand over the Internet, and can be fully configured to meet clients' specific needs and business practices without customization. This allows our clients to deploy our solutions
enterprise-wide and for all construction projects without significant upfront capital investment, involvement of the organization's IT departments, or professional services implementation
or customization activities. Our clients can begin to use our solutions and then fully deploy them across their organization in a very short period of time.
- •
- Easy to use and adopt. Our solutions are designed to be intuitive and easy-to-use, utilize terminology, processes and forms that are familiar to construction industry participants, and feature a web-based interface that is familiar to most computer users. Our solutions are
78
- •
- Accompanied by high levels of training and support to all
users. Our solutions are used by many participants with various roles and expertise. To support this, our client services teams provide
extensive initial and ongoing training and support for all end-users, regardless of their role on a project.
- •
- Secure, robust and auditable. Our solutions support mission-critical processes and handle sensitive data that must be available and yet secure. We have designed our systems and infrastructure to provide enterprise-class security and uptime. Our platform has undergone periodic security audits and evaluations by our clients and independent auditors, in conjunction with our ongoing SSAE 16 compliance program. The security and vulnerability of our solutions also is tested and assessed periodically by qualified independent third parties. All events undertaken by users in our system are logged, providing a level of auditability of actions and interactions unavailable with traditional processes.
configurable through various parameters to meet the specific needs of the client, and we are able to leverage our extensive experience of implementation within the construction industry to quickly achieve implementation in conformance with best practices. We find that clients are highly self-sufficient with our solutions within a short period of time.
Our Key Business Attributes
Our business of providing software solutions to the construction industry has the following key attributes:
- •
- Large, attractive market. The construction industry is an
important part of the global economy and affords us a large market in which to sell our solutions both in our current markets of North America and Australia and New Zealand, and in new
geographies. The industry continues to lag in its use of technology, and we also will seek to add to our suite of solutions to expand our value proposition to our clients and create new revenue
opportunities for us.
- •
- Next-generation approach to solving the collaboration challenges facing our
clients. We believe ours is a disruptive approach to solving business-to-business collaboration challenges,
which is enabled by the emergence of on-demand solutions as a reliable solution delivery method and is founded on the principles of a neutral third-party solution providing benefits to all
participants. We believe this approach can be applied to many processes and industries.
- •
- High recurrence of fees. Our collaboration solutions are
integral to our clients' operation of their business. We seek to establish enterprise relationships with our clients so that all their current and future projects will be managed on our collaboration
solutions. This results in recurring additions of new projects and the ongoing management of these projects on our solutions by our clients. Because our revenue is derived primarily from fees driven
by construction project activity, monthly fees and subscription fees, this in turn results in a high recurrence of our fees.
- •
- Favorable timing of cash flow. Clients typically pay us
fees upfront or in advance of solution usage. We also generally collect the majority of these fees electronically thereby reducing invoicing and collection activity and accelerating our cash flow.
- •
- Predictable reported revenue. The nature of the construction industry and our clients' operation of their business generally results in low volatility over reporting periods in the number and construction value of projects each client is working on. Our close working relationship with our clients has provided us additional insight into their business activity and the number and construction value of projects each client will manage on our system. In addition, because we have a large number of clients, the aggregate number of new projects added to, and of projects being managed on, our solutions benefits from a portfolio effect. Furthermore, projects with similar construction value historically have generated like amounts of fees over their duration.
79
- •
- Highly defensible market position. We believe our industry
expertise, leading market share, large installed base and strong intellectual property portfolio represent significant barriers to successful competitive entry. In addition, our ability to interface
with our clients' other enterprise systems further enhances our competitive position. Our client services, technology and development resources are dedicated to creating, enhancing and optimizing a
balanced value proposition for all of our clients and supporting collaborative processes in our target markets.
- •
- Ability to differentiate through our business and technology
approach. There are many technology providers targeting the construction industry that offer point solutions. However, these providers
generally do not integrate their solutions with other enterprise software, do not support their solutions with a strong client service capability, and do not have the resources to support significant
investment. We believe that our business capabilities and technological approach allow us to address these issues, for both our internally-developed and acquired solutions. As demonstrated by the
acquisitions we have made since 2010, we are able to successfully identify and acquire companies and software solutions that add to our existing capabilities and suite of solutions, and whose business
opportunities are enhanced by being part of our organization.
- •
- Focus on quality of service. Our focus is to consistently
deliver high-quality service to our clients. Our solutions support mission-critical processes and time-sensitive interactions and communications. As such it is essential to our
clients' satisfaction with our solutions that we provide all our clients timely and accurate responses to their support requests, effective training and successful implementation and
roll-out of our solutions. Client service and support is a cornerstone of our value proposition, and we believe it is a significant differentiator versus other technology providers in the
construction industry and an essential element of our long-term success.
- •
- Experienced, proven management team. Our senior management team has significant operating and service delivery experience. Using this experience, we have focused on delivering benefits to our clients through our solutions, making improvements to our existing solutions, expanding our suite of offerings to our clients, and expanding our client base. Management's extensive knowledge of the industry and their ability to identify opportunities for growth through both internal product development and strategic acquisitions has enabled us to establish a strong market position. Our founders occupy leadership positions in our company and continue to shape the vision and culture of our organization.
These factors, combined with the high recurrence of our fees and our recognition of revenue ratably over future periods, have historically resulted in predictable reported revenue. For example, over the eight quarters ended June 30, 2013, a period over which the compounded quarterly growth rate of our reported activity-driven revenue was 13.0%, between 92% and 95% of our reported activity-driven revenue in each quarter resulted from projects that were added to our solutions in prior periods.
Our Strategy
We intend to leverage our existing solutions and industry presence to become the industry standard for collaboration and related solutions in the construction industry, both domestically and in targeted international markets. Longer term, we also intend to apply our solutions to other industries in which similarly complex collaboration and contractual arrangements exist to expand the scope and size of our market opportunity. The key elements of our strategy to accomplish these objectives are as follows:
- •
- Increase our market penetration of the construction industry. We intend to actively pursue new client relationships with owners/developers, general contractors and subcontractors that do not currently use our solutions. Use of our solutions is frequently mandated by one organization to other project participants. We believe this provides us with the opportunity to demonstrate the
80
- •
- Expand our suite of solutions. We believe we have the
opportunity to expand the scope of our solutions to address business processes we currently do not support and to integrate our solutions into a single platform solution to increase the benefits and
value of our solutions to our clients. We plan to continue to use our domain expertise in construction and to work closely with our clients to identify and develop new applications, features and
functionality. Examples may include project management, expanded functionality for bid management, management of disadvantaged business enterprise programs and requirements, and data solutions and
analytics.
- •
- Pursue acquisitions of complementary businesses. We
believe that acquisitions of complementary businesses can help us expand our suite of solutions more rapidly, enter into new markets, expand our client base and increase the knowledge and skill sets
within our organization. We believe we can enhance the value of acquired solutions through our financial, technical and other resources, industry presence and their integration into our existing suite
of solutions. We have previously completed three acquisitions, GradeBeam, Submittal Exchange, and PlanSwift, as part of this strategy. We believe there are several technology providers that we
potentially could acquire and integrate into our suite of solutions. We intend to continue to selectively evaluate opportunities to acquire businesses and technologies that may help us accomplish
these and other strategic objectives.
- •
- Increase our client penetration. We believe that our broad portfolio of solutions and strong client relationships create a significant opportunity for us to cross-sell additional solutions to our existing clients, as very few of our clients currently use more than one of our solutions. We also intend to add additional solutions to our technology suite that would address additional processes in the construction lifecycle, and we plan to integrate both our current and our future solutions into a single platform solution. We believe these initiatives will significantly increase the value of our solutions to our clients, further strengthen our competitive position and drive increased adoption of multiple solutions by our clients.
value of our solutions to participants that are not our clients and to expand that initial contact into a sales process. For example, we estimate that of the 100 largest general contractors in the United States, based on data reported by Engineering News-Record, 34 have been a participant on a construction project that used CPM for invoice management, but that only approximately one-third of these general contractors are enterprise clients for CPM.
We intend to focus our existing sales and marketing capabilities on large, strategic owners/developers and general contractors, as such clients can generate significant, multi-year growth. At the same time, we plan to launch solution and channel initiatives that target smaller industry participants in a cost-effective fashion. We also intend to selectively pursue large-scale individual project opportunities that we believe can provide the basis for exposure to new potential clients.
- •
- Expand globally. We believe a substantial opportunity exists to grow sales of our solutions globally. We have developed, through both our internal efforts and as a result of close relationships with multinational clients, an understanding of the structure and practices of the construction industry in many other countries and believe that the value proposition of our solutions applies to these markets. To date, substantially all of our revenue has been generated from clients located in the United States and Canada. However, in certain markets, due to local
Furthermore, we believe there are opportunities at many of our clients to increase the utilization or adoption of our solutions to include a greater number of their projects. Examples include expanding into additional areas of our clients' construction business, making it easier for our clients to drive use of our solutions with their business partners, increasing usage of our solutions on smaller projects and increasing the number of client locations or users that are using our solutions.
81
- •
- Increase the number of industries we serve. Our solutions are designed for complex collaborative environments with significant subcontracting activity. We believe that these characteristics exist in several industries in addition to the construction industry. While we currently do not operate in these other industries, we believe based on our research, which consisted of our review of publicly available industry studies and interactions with companies operating in these industries, that there could be demand for our solutions in these other industries. Specifically, we believe that the mining and the oil and gas exploration and production industries experience many of the same challenges faced in the commercial construction industry. We believe that our joint venture in Australia, and certain existing construction clients in North America that also currently operate in these industries, can provide us a means of entering these adjacent industries. We also may seek to establish new partnerships or joint ventures, or pursue acquisitions of complementary businesses to facilitate our entry into these markets.
business practices and regulations, we believe our value proposition could be even stronger than in our established markets in North America. For example, in Australia, our CPM solution can help clients address their legal obligations under securities of payments legislation and manage the significant related administrative burdens. Certain of our large current and potential construction clients also have or are seeking to establish international operations, and have indicated their interest that we support their current or planned international operations, especially as they seek new growth opportunities outside their traditional North American markets. We have served clients in Canada since 2009, and in October 2012, we entered into a joint venture to begin operations in Australia and New Zealand. PlanSwift also is offered in several international markets through a network of distributors and resellers. We believe we have accumulated significant experience with the process necessary to enter new markets successfully.
Our Suite of Solutions
We currently offer a suite of on-demand software solutions as part of an overall portfolio and strategy to support project participants' business processes and interactions at various stages of the construction process, as well as the subsequent operation, maintenance and remodeling of a structure. Our current suite of solutions includes:
Construction Payment Management
CPM facilitates the exchange of invoice documents, supporting documentation and lien waivers for fast, secure electronic payment, which reduces errors, administrative overhead and the risk of claims.
CPM was our first solution—introduced in 2006—and remains our most widely-used solution, accounting for 94.8%, 93.9% and 75.0% of revenue in fiscal 2010, 2011 and 2012, respectively. The decline in 2012 reflects the addition of Submittal Exchange and GradeBeam to our suite of solutions. CPM has been used on over 13,000 projects, representing approximately $120 billion in construction value, by more than 300 major general contractors and the more than 45,000 subcontractors that worked on those projects. Based on management estimates, approximately $2.5 billion in invoices are managed on our solution monthly, with peak daily volumes of payments initiated by our CPM solution in excess of $100 million.
Our CPM solution provides the following capabilities and features to participants involved in construction projects:
- •
- A disciplined, standardized online approach to generating, collecting, reviewing and routing invoices based on shared
entry of and access to data and sophisticated workflow tools.
- •
- Electronic exchange of data and documents, and automated creation and storage of all monthly invoice and supporting documents.
82
- •
- Sophisticated and highly configurable tools to manage subcontractor compliance with project-specific requirements.
- •
- Secure disbursement approval, automated generation of payment instruction files and upload of those files to the applicable financial institution to effect secure payment.
A key differentiator of CPM from other solutions in the marketplace is its ability to handle the generation and exchange of lien waivers or equivalent documents. In the United States, when general contractors, subcontractors (including subtier contractors) and other project participants perform work during a construction project, a lien is automatically generated under state law. The lien attaches to the real property in order to protect the contractor's right to payment for its efforts. This process creates a security interest, or lien, in the property, which will continue to exist until it has been satisfied or waived. Lien waivers are the mechanism by which the claimant's rights under state law are extinguished, and are therefore critical legal documents. The process by which such liens are created and performed varies by jurisdiction, and hence the forms of these waivers vary by jurisdiction and client preferences. Accordingly, the proper preparation and presentation of lien waivers is a key element in the process by which general contractors and subcontractors are compensated.
Historically, participants have exchanged lien waivers through a paper-based manual process that occurs with each invoicing cycle. The paper-based process can result in the exchange of improper and incorrectly or partially completed forms, resulting in a significant lien-related risk and a significant administrative burden to manage this process.
CPM allows owner/developers or general contractors to select the appropriate form of lien waiver for the project, ensures that the right information is included and ensures that the amount shown on the lien waiver matches the agreed invoice amount. These are all significant challenges for the traditional paper-based manual process. Furthermore, CPM facilitates collection and tracking of subtier lien waivers and the application of payment holds if the waivers are missing. Management of the subtier lien waiver process can be particularly challenging with manual processes.
Although such liens do not exist outside of the United States, similar concepts apply in other jurisdictions, such as security of payments legislation in Australia. Our CPM solution is designed to be able to support both the United States lien paradigm and other applicable legal frameworks.
Our solution ensures that, in the creation and exchange of invoices, lien waivers or their equivalent, and other supporting documents, the documents specified by the general contractor or owner/developer are correctly completed and not modified in the process. Our clients provide and specify the forms of legal documents exchanged on a project-by-project basis.
CPM also helps project participants in monitoring and submitting evidence of compliance with project-specific requirements. These are requirements that are established by general contractors on each construction project as part of their business practices and in response to owner/developer mandates, applicable regulations, insurance or other items. These requirements can also include items such as disadvantaged business entity certifications and safety, payroll and contract documentation. This process is often referred to in the construction industry under the broad label of "compliance management." CPM provides automated notification of impending compliance document expiry, automated payments holds for non-compliance as selected by the general contractor and significantly enhances subcontractor visibility into their compliance status.
Upon completion of the invoicing process, we arrange for funds to be disbursed from the payor's bank account directly to the payee's bank account. To do this, we utilize the ACH Network in the United States and similar systems in other countries. Under our current business model, however, we do not take custody of the funds in the transfer process.
83
We recently launched CPM-Business, a new version of CPM specifically created to address the needs of mid-market owners and general contractors. The current CPM solution is now called CPM—Enterprise.
The functional capabilities of CPM are summarized in the illustration below. This illustration shows the interaction as occurring between a general contractor and a subcontractor, but applies equally to the collaboration processes between any two participants involved in a construction project:
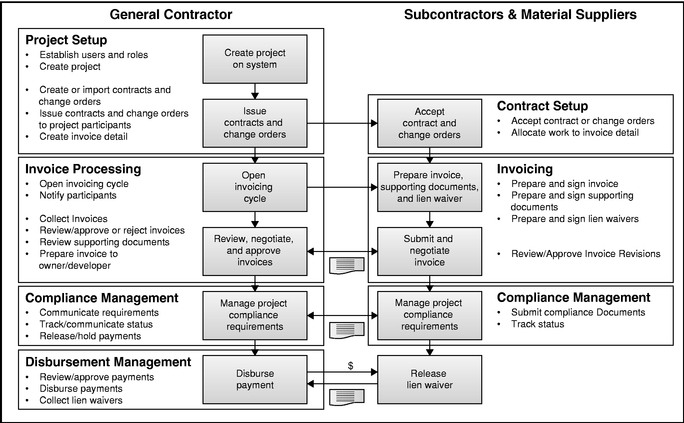
Submittal Exchange
The Submittal Exchange family of solutions—which includes Submittal Exchange, Submittal Exchange for Design and Submittal Exchange for Subcontractors—are our project management solutions. They provide functionality that facilitates the exchange of critical project documents (such as construction submittals, requests for information, supplementary information, daily reports, contracts, change orders, meeting minutes, drawings, specifications and photographs), thereby increasing efficiency, facilitating communication and ensuring proper audit trails and archival.
These products became part of our suite of solutions as a result of the acquisition of Submittal Exchange, LLC in November 2011.
Submittal Exchange is extensively used by owners/developers and architects in addition to general contractors and subcontractors, and has been deployed on over 3,500 projects since its launch in July 2005. These solutions cover the entire lifecycle of a project and provide the following capabilities and features to participants involved in construction projects:
- •
- Highly configurable step-by-step workflow tools for collecting, reviewing, tracking and routing
project documents.
- •
- Single document repository with version control and document history.
84
- •
- Comprehensive design document sharing and detailed upload and download histories.
- •
- Automatic workflow notifications, generation of cover sheets and supporting documents, and full audit history of all workflow actions.
The functional capabilities of Submittal Exchange are summarized in the illustration below.
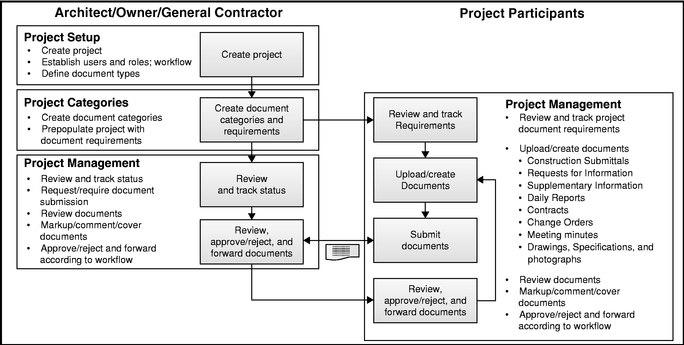
Bid Management
GradeBeam enables general contractors to efficiently identify suitable subcontractors and to invite them to bid on project work, resulting in better bids as well as more opportunities for subcontractors. We believe GradeBeam is one of the largest online networks of industry contractors, as measured by the number of organizations in our solution's database and based on data either reported by our competitors or estimated by us. As a result, we believe GradeBeam provides our clients better opportunities to identify suitable contractors for the work for which they are seeking bids. The solution is used to issue over 9 million bid invitations annually.
We acquired substantially all of the assets of GradeBeam LLC including its GradeBeam invitation-to-bid solution in October 2011.
GradeBeam is focused on the bidding phase of a project and provides the following capabilities and features:
- •
- A database of more than 550,000 construction organizations with detailed profile data, such as trade capabilities, areas
of geographic coverage and other relevant bidding selection criteria.
- •
- Sophisticated search tools to identify suitable potential bidders.
- •
- Tools for managing interactions with bidders, including automated generation and delivery of customized invitations-to-bid to potential bidders.
85
The functional capabilities of the GradeBeam solution are summarized in the illustration below. This illustration shows the interaction as occurring between a general contractor and subcontractor, but applies equally to the collaboration processes between any two participants in a bidding situation:
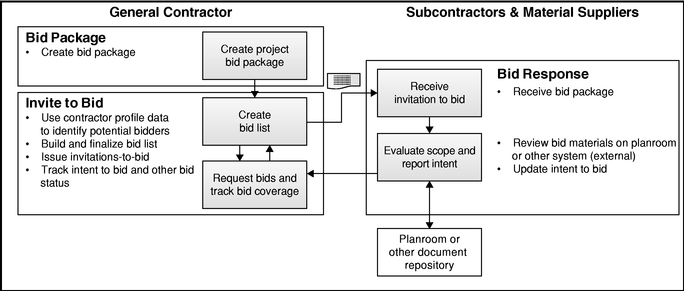
Other Solutions
Pre-Qualification Management
PQM addresses the challenges facing owner/developers and general contractors in effectively assessing potential project participants' qualifications for and ability to successfully execute a construction job. We introduced PQM in October 2009.
Our solution allows for the collection, review and evaluation of prequalification information, including financial and safety information, according to specific business requirements, while also allowing subcontractors to fulfill multiple requests from a set of information that they need enter only once. PQM provides significant efficiency gains for all participants and increased visibility as to prequalification status. Most importantly, we believe the collection and effective evaluation of prequalification information is the single greatest opportunity to manage risk on a construction project.
Greengrade
Greengrade significantly simplifies and streamlines the collection and submission of information necessary to obtain LEED Certification in the United States and Canada. According to the United States Green Building Council, which administers LEED in the United States, nearly 50,000 projects are currently participating in the program. We added Greengrade to our solution portfolio as part of the acquisition of Submittal Exchange, LLC in November 2011.
Greengrade provides workflow and document management tools that enable a user to manage task creation and achievement against the specific criteria and points system utilized in awarding different levels of LEED certification.
PlanSwift
In order to generate an accurate bid for construction work, the plan drawings must be reviewed and an accurate determination of dimensions, such as the length and height of a wall or the square footage of an area, and of units, such as the number of electrical outlets, must be made. This process is referred to as take-off. Prices per unit, wastage rates, and other factors can then be applied to take-off
86
results, and by adding other costs such as labor, overhead and other items, a complete estimate of the cost of the work to be performed can be obtained.
PlanSwift provides advanced functionality that enables users to perform complex take-off tasks from digital plans, and to use the quantities thus determined as the basis for estimation of material, labor, and other costs associated with a project. This approach replaces and improves the traditional method of manual measurement and unit count from printed plans and the use of paper or spreadsheet-based methods for estimating costs. Take-off and estimating is an activity performed by subcontractors, material suppliers, manufacturers, and general contractors.
Contractor Default Claims Management
Contractor Default Claims Management supports the process of documenting a claim under Zurich North America's ("Zurich") industry-leading proprietary subcontractor default insurance program, Subguard. We developed this solution for Zurich and will host and operate it on its behalf. The system leverages our CPM and PQM solutions to automate much of the document creation for claimants. We believe the benefits will include time savings, reduced claim preparation and review costs, better transparency and communication between the claimant and claim reviewer and faster claims payment. The application is scheduled to launch in calendar 2013.
BidOrganizer
We recently launched BidOrganizer, a new solution designed to help contractors save time and money by providing a central, online location to prioritize, track, and schedule all bid invitations. Designed specifically for contractors, BidOrganizer centralizes and organizes all bid invitation information—independently of the system used to issue the invitation—including grouping multiple invitations by project, and tracking bid due and other critical dates. BidOrganizer allows the contractor to grade bidding opportunties and plan cash flow and resource needs. By presenting the information in an online dashboard and consolidating information across the entire organization, BidOrganizer allows contractors to identify the right opportunities to pursue instead of allocating time and resources on unsuitable bid invitations.
Interfaces
Interfaces are an integral part of our solution strategy. Our solutions interface with a variety of job cost, accounting, scheduling, planroom, imaging and document management systems. Information that is exchanged includes contracts, owner change orders, subcontractor change orders, invoices, payments, compliance and document images.
By enabling our solutions to interface with existing systems, we reduce duplicative data entry, resulting in significant efficiencies and eliminating data re-entry errors. In addition this allows us to protect and leverage the investment our clients already have made in these systems, limit the extent of the business process re-engineering required within the client organization and ensure these systems contain correct and up-to-date data. Interfacing with our clients' systems, we believe, increases the value of our solutions, embeds our solutions into their processes and increases the stickiness of the relationship.
Our Clients
We offer our solutions to the many different participants involved in construction. These participants may include owners/developers, general contractors, subcontractors, architects, material suppliers and others. Our collaboration solutions have been used by more than 3,000 general contractors, owners/developers, and architects. This includes 62 of the 100 largest general contractors in North America, as ranked as of May 2013 by Engineering News-Record based on annual construction
87
revenues. In addition, based on management estimates, approximately 300,000 subcontractors were active on our solutions during fiscal 2012. No single customer directly accounted for more than ten percent of our revenues in 2012. When we include the revenues generated both directly from a client and from the subcontractors working on projects the client controls, then the construction project activity of our top ten client relationships accounted for 41.5% of our revenue in fiscal 2012 and our single largest client relationship, with the PCL family of companies, accounted for 10.8% of our revenue in fiscal 2012.
Our Focus on Client Support
Our solutions support critical processes and time-sensitive interactions. As such, we have prioritized high levels of client support and created a client service organization and culture that provide timely, thorough and personalized support for every participant who comes in contact with our solutions. Client service and support is a cornerstone of our value proposition, and we believe a significant differentiator from alternative approaches and an essential element of our long-term success.
Our client services team provides live phone-based support for all users. In addition, our large owner/developer and general contractor clients are each assigned an account team that works with the client from planning through implementation and ongoing support. This approach provides continuity and in-depth knowledge of the client's processes and the solution configurations applied to support them.
We provide unlimited training and support, which for CPM and PQM often requires a significant amount of in-person, on-site time to effectively support large owner/developer and general contractor clients. Subcontractors using CPM or PQM and users of our other solutions are generally implemented and supported over the phone or the web. We utilize a variety of training and support methods including on-site classroom training, online tutorials, webinars and phone support.
Our Technology, Operations and Development
Technology
Each of our collaboration solutions was designed from inception as a software-as-a-service ("SaaS") solution with an on-demand architecture. Our clients access our collaboration solutions through a standard web browser. Our solutions each use a single code base, which results in all of our clients running on the current version of the software. We do not offer our collaboration software for purchase or behind-the-firewall operation, nor do we customize our collaboration solutions for any of our clients.
Our technology platform is designed to deliver several key success factors:
- •
- Configurability. Our approach has been to design our
collaboration solutions to be highly configurable, in order to support our clients' existing business processes, workflows and organizational hierarchies without the need for customization.
- •
- Scalability. Our existing infrastructure supports large
transaction volumes and peaks in site traffic as required to meet our clients' requirements. Spikes in traffic are handled by allocating capacity automatically using server virtualization and other
infrastructure capacity management techniques. We closely monitor utilization of all aspects of our collaboration solutions and our platform to ensure our clients experience good performance and for
capacity planning purposes. Our infrastructure has been designed with sufficient capacity to meet current and near-term capacity needs, and to be expanded to support our future growth.
- •
- Reliability. Our infrastructure is designed to provide high levels of uptime, performance and redundancy.
88
- •
- Security. Our solutions—and in particular our CPM solution—handle mission-critical business processes and sensitive data. Security is of paramount importance to us. We enforce a consistent approach to roles and rights within our solutions, and these restrictions limit access to functionality to only those individuals as authorized by our clients. We also employ multiple standard technologies, protocols and processes to monitor, test and certify the security of our infrastructure continuously, including periodic security audits and penetration tests conducted by our clients and third parties.
Technology and development
Our technology and development organization is focused on developing new solutions and enhancing existing solutions, interfacing our solutions to clients' existing software, conducting software and quality assurance testing and improving our core technology.
Our development methodology, in combination with our on-demand delivery model, allows us to release new and enhanced software features on a quarterly or more frequent basis. We follow a well-defined communications process to support our clients with release management. We patch our software on a regular basis. Because all of our clients are running on a single version of each of our solutions, we do not need to maintain multiple engineering teams to support multiple versions of the code.
As a result of our market position, we believe that our research and development efforts are uniquely positioned to benefit from input from our clients and prospects. This input enables us to continually develop new functionality while enhancing and maintaining our existing solutions.
Our technology and development organization is located primarily at our Deerfield, Illinois and Des Moines, Iowa facilities. We also employ a small number of research and development staff that are located remotely to our offices.
Our technology and development expenses were $4.7 million in fiscal 2010, $6.2 million in fiscal 2011 and $11.1 million in fiscal 2012. As a percentage of revenue, our technology and development expenses were 78.9% in fiscal 2010, 58.7% in fiscal 2011 and 51.3% in fiscal 2012. We have focused our technology and development efforts on continuously improving our solutions, including functionality innovations as well as platform extension. We expect technology and development expenses to increase as we expand our suite of solutions and enhance our technology infrastructure.
Operations
We deliver our solutions to our clients using two primary approaches:
- •
- For CPM, PQM, and GradeBeam, we own the operating infrastructure. This infrastructure is physically hosted at secure third-party data center facilities operated by Latisys Corp and located in Oak Brook, Illinois, for CPM and PQM, and operated by Savvis and located in Chicago, Illinois, for GradeBeam. We contract for the use of these data center facilities, and we believe there are several alternative providers.
We engineer and architect the actual computer, storage and network systems upon which our suite operates and deploy them to the data center facility, which provides physical security, including manned security, 365 days a year, 24 hours a day, seven days a week. We provide system security, including firewalls and encryption technology, and conduct regular system tests and vulnerability assessments and provide advance notice when maintenance is performed. In the event of a failure, we have engineered our CPM and PQM technology architecture to operate out of backup data center facility located at our headquarters in Deerfield, Illinois. This data center also hosts our development and testing environments. We conduct regular tests of the efficacy of these failover arrangements for business continuity.
89
- •
- Our other collaboration solutions utilize third-party on-demand cloud services, specifically Amazon's Elastic Compute Cloud service. This has allowed us to scale the operating infrastructure on an as-needed basis to efficiently and cost-effectively support our growth. We also utilize the Amazon Elastic Compute Cloud service to provide backup infrastructure for our GradeBeam solution.
The security and vulnerability of our collaboration solutions is tested and assessed periodically by qualified independent third parties. We believe that we have not experienced any unauthorized access to our systems. We have been subjected to various intrusion attempts and other actions designed to disrupt our ability to deliver service to our clients but these have not to our knowledge had any material effect.
Our Sales Approaches
Sales
We market and sell our construction collaboration solutions to our clients through the following sales channels, each tailored to reflect the solution and our clients' preferences.
Enterprise Relationships
We generally seek to establish an enterprise relationship with owners/developers and general contractors, particularly in the case of our CPM, PQM and GradeBeam offerings. These solutions provide significantly greater benefits if deployed to manage all of the client's construction projects. Enterprise relationships require buy-in and commitment at the highest levels of our clients' organizations and a commitment to enterprise-wide deployment of the solution. In our experience, this requires an in-person, relationship-driven, consultative approach with a high degree of product and domain expertise on the part of our employees. Furthermore, both our clients and we desire to ensure continuity between the sales activities, business process reengineering, implementation and configuration, and training and ongoing support.
We have therefore structured our organization such that enterprise relationship prospecting, sales, account management and support activities are performed by our client services group. This group consists of professionals organized by geography, with responsibility both for specific owner/developer and general contractor clients, and for contributing to supporting our subcontractor client base on an as-needed basis. Through both our training activities and exposure to our clients, our client services professionals become experts in our solutions and in their application to the construction industry.
As of June 30, 2013, our client services group consisted of 72 professionals. We intend to continue to grow our client services group in order to expand our client base and ensure a continuing high level of service and support to our clients.
Remote Sales
Certain of our products are well suited to be used on a single project and do not require enterprise-wide deployment. Our Submittal Exchange and Greengrade solutions in particular are primarily sold on a project-by-project basis, although more than 80% of new projects are from existing clients and represent recurring activity, often without sales activity or intervention by us.
In addition, our sales to the subcontractor community of GradeBeam, PQM, and PlanSwift are generally transactional and reflect the lower cost and complexity of these solutions.
To address this market we operate dedicated direct sales groups that market to, contact and support prospective clients remotely, primarily using email, webinars, telephone and other appropriate methods. As of June 30, 2013, our direct sales force consisted of 76 employees. We intend to grow this
90
capability significantly in order to address the market opportunity we believe is available to us, as well as to support new product and segment initiatives.
Marketing
Our marketing efforts and lead generation activities consist primarily of client referrals, Internet advertising, telemarketing, trade shows, industry events and press releases. Our marketing programs target existing and prospective clients' executives and senior business leaders.
Strategic Relationships
We have entered into a limited number of strategic relationships that we believe allow us to provide our clients with a better experience, increase our visibility and reach in the commercial construction industry, and facilitate our geographic expansion.
Enterprise Resource Planning System Providers
Our CPM solutions are frequently interfaced with enterprise resource planning or accounting systems already in use by our clients.
In order to facilitate the set up and operation of these interfaces, we have established strategic relationships with several of the enterprise resource planning providers that are prevalent in the commercial construction industry, including CMiC, Viewpoint Construction Software, Sage North America and Computer Guidance Corporation. We are able to interface our systems to vendors with which we do not have such a relationship, but have found these relationships to be helpful in providing a more rapid and effective implementation and improved ongoing operational experience for our clients, and expect to continue to pursue such relationships. In particular, we intend to establish additional relationships in international geographies in which local enterprise resource planning providers may have significant market share or otherwise enable us to provide our clients with a better experience.
Industry Associations
Several industry associations exist that serve the commercial construction industry. We have sought and will continue to seek to establish strong working relationships with these associations, such as those we have established with several chapters of the Associated General Contractors of America and the American Subcontractors Association. We believe that these relationships can provide us with considerable insight into the needs of their members, allowing us to prioritize and develop solutions that better address the needs of the industry, and that these associations can help us market to their members. In some cases, we have established relationships that include endorsement of our solutions and a referral program for the associations or their chapters to reflect their role in assisting us in selling to their members.
Minter Ellison Joint Venture
Minter Ellison is a leading law firm based in Australia serving clients in Asia Pacific and across the world. Minter Ellison has a construction industry practice that advises extensively on construction and infrastructure development, particularly in project delivery models (including relationship-based and collaborative models), traditional procurement methods and risk management strategies. Minter Ellison's technology-focused subsidiary, Safetrac Pty. Ltd., offers on-demand software solutions, providing a range of legal compliance, policy compliance, risk management and behavioral compliance training and testing products.
In October 2012, we established a joint venture with Minter Ellison and Safetrac to form Textura Australasia Pty. Ltd. to bring our construction collaboration solutions to the Australia and New
91
Zealand markets. We believe that the local relationships, infrastructure and support capabilities of Minter Ellison and Safetrac, combined with our expertise and solutions, will facilitate our entry into these markets.
Zurich North America
We have a strategic relationship with Zurich North America ("Zurich"), a leading provider of insurance products to the construction industry. Zurich provides clients of its proprietary Subguard risk management product with a premium discount if they implement both CPM and PQM. We believe this reflects Zurich's recognition of the value of using our CPM and PQM solutions in mitigating its insurance clients' risk profiles. We do not receive compensation from Zurich for this arrangement. In addition, we have built a claims management system, Contractor Default Claims Management, that Zurich uses in connection with Subguard.
Our Competition
The intensity and nature of our competition varies significantly across our different solutions. We face competition both from point solution providers, including traditional software vendors and other on-demand software vendors, and from enterprise resource planning and project management solution providers that may address several functional elements of our solutions, but that may not be designed specifically for the construction market. We also compete with internally-developed and maintained technology solutions. Our current principal competitors include:
- •
- CPM. We face limited competition due in large part, we
believe, to the complexity of the required solution, the specific needs of the construction industry and the absence of third-party solutions that provide our lien waiver functionality. Competitive
solutions that may address part of our functional capabilities include GC Pay in the North American market and ProgressClaim.com in Australia; enterprise resource planning solutions both specialized
to the construction industry such as Viewpoint, the Sage family of products, CMiC Open Enterprise and eCMS and other non-specialized solutions, such as JD Edwards Enterprise One, and
various solutions offered by Oracle and SAP; and document management solutions such as Aconex.
- •
- Submittal Exchange. We face competition from several
project management solution providers, in particular from those that are specialized in the construction industry. Such competitors include Meridian Systems, Newforma and Procore Technologies.
- •
- GradeBeam. We face competition from other
invitation-to-bid systems for commercial construction, including iSqFt and SmartBidNet. Certain project management and enterprise resource planning solutions also have
invitation-to-bid or bid management functionality.
- •
- PQM. PQM is most often being used to replace paper-based
processes or to establish prequalification processes that do not currently exist. Available alternatives include in-house solutions using online form submission tools,
invitation-to-bid systems and vendor review and verification services.
- •
- Greengrade. We face competition from other LEED submission management technology solutions including LoraxPro and GreenWizard. Greengrade also faces competition from services provided by many specialized consulting firms, architecture firms and construction management consultancies.
In addition, PlanSwift competes with several take-off and estimating solution providers including On Center Software, eTakeoff and Cloud Takeoff; trade-specific take-off solutions such as ConEst (for electrical trades); and the estimating capabilities or modules of enterprise resource planning solutions such as Viewpoint, the Sage family of products, CMiC Open Enterprise and eCMS.
92
The principal competitive factors in our industry include solution functionality and scope, level of integration with other enterprise systems, ease of implementation and use, performance, security, scalability and reliability of service, brand, reputation, domain expertise, relationships within the construction industry, and financial resources of the provider. We believe total cost of ownership to be a lesser factor for most general contractors; however, cost is a significant factor in competing for subcontractors. We believe that we compete favorably with our competitors on the basis of these factors. However, some of our existing or potential competitors may have greater financial, technical, marketing and other resources, and there is no assurance that we will be able to continue to compete effectively.
Our Intellectual Property
Our intellectual property and proprietary rights are important to our business. To safeguard them, we rely on a combination of patent, trademark, copyright and trade secret laws in the United States and other jurisdictions, as well as confidentiality procedures and contractual provisions.
We hold 41 granted patents and allowed applications in the United States and internationally. Our patents cover systems and methods relating to various aspects of document generation, transfer and storage as well as the management of payments for construction projects in a computer-based system. Among other things, our patents address document storage and access, management of invoicing and direct payment in hierarchically tiered projects, single system-level user and organization registration, automated alerts and notification-based workflow process management. Although originating in a web-based construction project payment management context, several of our patents contemplate and extend to other technologies (e.g., handheld devices), customized user/organization environments and even some non-construction project situations. We will also continue to assess appropriate occasions for seeking patent and other intellectual property protections for those aspects of our technology and service that we believe constitute innovations providing significant competitive advantages.
We have 54 additional patents pending with the United States Patent and Trademark Office and international patent offices. We will also continue to assess appropriate occasions for seeking patent and other intellectual property protections for those aspects of our technology and service that we believe constitute innovations providing significant competitive advantages.
We have registered our "Textura," "Textura Construction Payment Management," "Submittal Exchange," "GradeBeam," "Greengrade," and "PlanSwift" trademarks and logos with the United States Patent and Trademark Office and in several jurisdictions outside the United States. We have also registered other trademarks in the United States and in other jurisdictions outside the United States.
Though we rely in part on these patents, trademarks and other intellectual property, we believe that factors such as the skills and expertise of our employees, our established presence and market share, our reputation for high levels of client service and the functionality of and frequent enhancements to our solutions also contribute significantly to our success in the marketplace.
Our Employees
As of June 30, 2013, we had 338 employees, including 72 in client services and support, 108 in sales and marketing and 118 in technology and development. This is a 72.4% increase from the 196 employees we had as of June 30, 2012. This increase was primarily attributable to the acquisition of PlanSwift, additional headcount in our technology and development department to enhance the functionality of our suite of solutions and an investment in additional sales and marketing resources following our acquisition of Submittal Exchange. None of our employees is covered by a collective bargaining agreement. We have never experienced a strike or similar work stoppage, and we consider our relations with our employees to be good.
93
Our Facilities
Our principal offices are located in Deerfield, Illinois and Des Moines, Iowa, where we occupy approximately 63,000 square feet and 18,000 square feet of office space, respectively. We own our facility in Deerfield, Illinois and occupy the space in Des Moines, Iowa under a lease that expires in February 2017. We occupy additional leased facilities in Chicago, Illinois, Phoenix, Arizona and Centerville, Utah. We believe that our facilities are sufficient for our current needs and that suitable additional or substitute space will be available as needed to accommodate expansion of our operations.
Our Legal Matters
From time to time, we are subject to various legal proceedings, claims and litigation arising in the ordinary course of business. We are not party to any currently pending legal proceeding the outcome of which is likely to have a material adverse effect on our financial position, results of operations or cash flows.
94
MANAGEMENT AND BOARD OF DIRECTORS
MANAGEMENT
Executive Officers and Directors
The following table provides information regarding our executive officers and directors as of June 30, 2013:
Name
|
Age | Position(s) | |||
|---|---|---|---|---|---|
Executive Officers |
|||||
Patrick J. Allin |
62 | Chairman and Chief Executive Officer |
|||
William Eichhorn |
61 | Executive Vice President |
|||
Howard Niden |
56 | Executive Vice President and Chief Solutions Architect |
|||
Jillian Sheehan |
35 | Executive Vice President and Chief Financial Officer |
|||
Franco Turrinelli |
49 | Executive Vice President, Corporate Development |
|||
Michael Antis |
35 | Executive Vice President, Client Services |
|||
Jonathan Halloran |
43 | Executive Vice President, Client Services |
|||
David Kelly |
44 | Executive Vice President, Client Services |
|||
Matthew Ostanik |
35 | President, Submittal Exchange |
|||
Ryan Lawrence |
33 | Senior Vice President, Chief Legal Officer |
|||
Non-Employee Directors |
|||||
Gregory J. Besio |
55 | Director |
|||
Matthew J. Botica |
62 | Director |
|||
Edward K. Chandler |
55 | Director |
|||
David Habiger |
44 | Director |
|||
R. Michael Murray, Jr. |
73 | Director |
|||
General Peter Pace |
67 | Director |
|||
David G. Patterson |
66 | Director |
|||
Robert P. Wayman |
68 | Director |
|||
Executive Officers
Patrick J. Allin has been our Chairman and Chief Executive Officer since co-founding our company in September 2004. Prior to co-founding Textura, Mr. Allin served as a senior client delivery partner, Chief Operating Officer and Chief Financial Officer of the Global Consulting Practice at PricewaterhouseCoopers LLP. Earlier in his career, Mr. Allin served in a number of executive positions, including President, at Moore Business Forms North America and as an audit partner at PriceWaterhouse. Mr. Allin holds a Bachelor of Commerce degree in commerce and economics from the University of Toronto and is a Canadian Chartered Accountant. Mr. Allin brings to our board of directors extensive experience with Textura's business and operations as a founder of our company.
William Eichhorn is a co-founder of Textura and has been an Executive Vice President since October 2004. Prior to joining Textura, Mr. Eichhorn was a partner at PricewaterhouseCoopers LLP, where he served as the North American e-Business and Midwest Strategy Practices Leader amongst other roles. Earlier in his career, Mr. Eichhorn was a consultant with McKinsey & Company. Mr. Eichhorn holds a B.A. in biology and English from Brandeis University and an M.B.A. from the University of Chicago.
Howard Niden is a co-founder of Textura and rejoined our company in June 2011 as an Executive Vice President and serves as our Chief Solutions Architect. From August 2004 to May 2011, Mr. Niden was the Global Chief Information Officer for Mayer Brown LLP, an international law firm. Earlier in his career, Mr. Niden held numerous positions with PricewaterhouseCoopers LLP including Global
95
Chief Technology Officer for the consulting business. Mr. Niden holds an A.B. in political science and an M.B.A. from the University of Chicago.
Jillian Sheehan has been an Executive Vice President and our Chief Financial Officer since March 2011. Ms. Sheehan served as our Senior Vice President-Finance from March 2009 until March 2011 and as our Finance Manager from February 2006 until March 2009. Prior to joining Textura, Ms. Sheehan held accounting positions at Arthur Andersen LLP and Pasquesi Sheppard LLC. Ms. Sheehan holds a B.S. in accounting from Marquette University and an M.B.A. from DePaul University.
Franco Turrinelli has been our Executive Vice President of Corporate Development since January 2010. Prior to joining Textura, from July 1996 to December 2009, Mr. Turrinelli was at William Blair & Company LLC, an investment banking firm, where he held a number of positions in Equity Research including as a technology company analyst and Group Head of Technology Research. Mr. Turrinelli holds a Bachelor of Engineering in chemical engineering from Imperial College London and an M.B.A. from the University of Chicago.
Mike Antis has been an Executive Vice President of Client Services since April 2012. From March 2008 to April 2012, Mr. Antis served as our Vice President, Operations-U.S. West. Mr. Antis also held numerous other client service roles since joining Textura in July 2005. Prior to joining Textura, Mr. Antis was a Manager for Paragon Consulting Group, Inc. and Braun Consulting, Inc. Mr. Antis holds a B.S. in business process management and marketing from Indiana University.
Jonathan Halloran has been an Executive Vice President of Client Services since June 2011. Prior to joining Textura, Mr. Halloran served as the Vice President of Construction Specialties for Zurich North America's Construction business unit from October 2000 to May 2011. Prior to joining Textura, Mr. Halloran held a series of managerial, sales and operational positions in Zurich's construction underwriting and engineering units. Mr. Halloran holds a B.A. in history and a B.S. in civil engineering from the University of Notre Dame and an M.B.A. from INSEAD.
David Kelly has been an Executive Vice President of Client Services since April 2012. From March 2008 to April 2012, Mr. Kelly served as our Vice President, Operations-U.S. Southwest and began his career in March 2005, as the manager of our first two clients. Prior to joining Textura, Mr. Kelly was a Senior Manager at Paragon Consulting Group, Inc. Mr. Kelly holds a B.S. in accounting from Eastern Illinois University.
Matt Ostanik has been the President of Submittal Exchange since its acquisition by Textura in November 2011. Prior to joining Textura, Mr. Ostanik was the Chief Executive Officer of Submittal Exchange, a company he founded in 2003. Mr. Ostanik holds a Bachelor of Architecture and an M.B.A. from Iowa State University.
Ryan Lawrence has been our Senior Vice President, Chief Legal Officer since February 2013. Prior to joining Textura, Mr. Lawrence served as the Assistant General Counsel of Oil-Dri Corporation of America from April 2012 to February 2013. From September 2006 to April 2012, Mr. Lawrence was an Associate in the Corporate and Securities Group at Mayer Brown LLP. Mr. Lawrence holds a B.S. in organizational business administration from the University of Illinois and a J.D. from The John Marshall Law School.
Board of Directors
Gregory J. Besio has been a director since June 2011. Since July 2011, Mr. Besio has been the Executive Vice President and Chief Human Resources Officer of Aon plc, a global risk management, insurance, and human resources solution company. From May 2007 to July 2011, Mr. Besio held a number of executive positions at Aon, including head of global strategy and Chief Administrative Officer. Previously, Mr. Besio worked for Motorola, a technology solutions company, where he held
96
roles including Corporate Vice President, Mobile Devices Software and global head of Motorola's Corporate Strategy team. Mr. Besio received a B.S. in chemical engineering from the University of Notre Dame, an M.A. and a Ph.D. from Princeton University in the same discipline, and an M.B.A. from the University of Chicago. Mr. Besio brings to our board extensive experience in corporate strategy and technology gained as a business executive.
Matthew J. Botica has been a director since March 2013. From 1998 until January 2013, Mr. Botica served as a partner in the restructuring and insolvency group of Winston & Strawn LLP, an international law firm. Prior to joining Winston & Strawn, Mr. Botica served as the managing partner of Hopkins & Sutter, a Chicago-based law firm. Mr. Botica serves on a number of civic and charitable boards of directors, including Boston College and the Chicago Jesuit Academy. Mr. Botica is a fellow of the American College of Bankruptcy and has been honored numerous times in The Best Lawyers in America for bankruptcy and credit-debtor rights law and in the Chambers USA directory. Mr. Botica received a B.A. in economics from Boston College and a J.D. from Harvard Law School. Mr. Botica acted as a legal advisor to our company and our board in recent years. In addition to his knowledge of our company, Mr. Botica brings to our board more than 30 years of legal experience in the debt capital markets and other related areas working with institutional lenders, trustees, government agencies and others.
Edward K. Chandler has been a director since December 2012. Since 1996, Mr. Chandler has been a Managing Director of Portage Venture Partners, a venture capital firm he founded; additionally he is a Managing Director of the general partner of the Portage Venture Funds, the Graystone Venture Fund and the Draper Fisher Jurvetson Portage Fund. Prior to that, Mr. Chandler formed Prairie Capital to acquire the venture portfolio of the Continental Illinois Bank, whose venture capital affiliates he joined in 1984. Mr. Chandler serves on a number of not-for-profit boards of directors, including The Wetlands Initiative and the Greater Chicago Food Depository, as well as the boards of directors of a number of private companies. Mr. Chandler received a B.A. in economics from Yale University and an M.B.A. from Harvard Business School. Mr. Chandler brings to our board extensive knowledge of rapidly-growing technology companies and experience as a venture capitalist.
David Habiger has been a director since December 2012. From July 2011 until its sale in August 2012, Mr. Habiger served as the Chief Executive Officer of NDS Group, a software solutions company for the pay television industry. From 2005 to March 2011, Mr. Habiger was the President and Chief Executive Officer of Sonic Solutions, a computer software company. Mr. Habiger is a Senior Advisor to Silver Lake Partners and a Venture Partner at New World Ventures. Mr. Habiger serves on the advisory board for the Polsky Center for Entrepreneurship at the University of Chicago, and on the boards of directors of a number of private companies. Mr. Habiger has been a director of Echo Global Logistics, Inc., a leading transportation management provider, since December 2012. Mr. Habiger has been a director of RealD Inc., a global licensor of 3D technologies, since August 2011, and served as a director of Sonic Solutions from October 2010 until March 2011. Mr. Habiger received a B.B.A. in business media from St. Norbert College and an M.B.A. from the University of Chicago. Mr. Habiger brings to our board extensive experience with the growth and development of technology companies, including service as a CEO at public and private companies.
R. Michael Murray, Jr. has been a director since May 2006. Mr. Murray has, since 1999, been a Director Emeritus of McKinsey & Company, a global management consulting company, a firm he joined in 1967. From 1981 to 1990, he managed the firm's Chicago office, and has also led McKinsey's Strategy Practice and Organization Practice. He served on the firm's Director Committee for ten years and its Shareholder Committee for nine years. Mr. Murray serves on a number of civic and charitable boards of directors and committees thereof, including Boston College and the Aspen Music Festival. Mr. Murray received a B.S. in physics and an M.A. in mathematics from Boston College and an M.B.A. from the Wharton School of the University of Pennsylvania. Mr. Murray brings to our board extensive management, leadership and advisory experience gained over an extensive business career.
97
General Peter Pace (ret.) has been a director since December 2012. From January 2008 to December 2011, General Pace was CEO of Steven Myers and Associates Strategic Advisors, a consulting firm. General Pace retired from active duty on October 1, 2007, after more than 40 years of service in the United States Marine Corps, most recently as the Chairman of the Joint Chiefs of Staff from September 2005 until October 2007 and prior to that as the Vice Chairman of the Joint Chiefs of Staff from October 2001 to August 2005. Earlier in his career, General Pace held numerous leadership positions in the Marine Corps, including Commander, U.S. Marine Corps Forces, Atlantic/Europe/South, and Deputy Commander/Chief of Staff, U.S. Forces Japan, and served in Somalia, Vietnam, Thailand, and Korea. In June 2008, General Pace was awarded the Presidential Medal of Freedom, the United States' highest civilian honor. General Pace has served on the boards of directors of numerous charitable and civic organizations, including the Secretary of Defense's Defense Policy Board and the Marine Corps Law Enforcement Foundation. General Pace also serves on the boards of directors of several private companies. General Pace has served as a director of AAR Corp, a provider of products and services to the aviation and defense markets, since January 2011; Qualys, Inc., a provider of cloud security and compliance solutions, since May 2009; and Pike Electric Corporation, a provider of energy solutions, since February 2010. General Pace holds a B.S. in engineering from the United States Naval Academy. He holds an M.S.A. from George Washington University, attended the Harvard University Senior Executives in National and International Security program, and graduated from the National War College. General Pace brings to our board extensive leadership and management skills, as well as broad international service and experience.
David G. Patterson has been a director since August 2010. Since 1989, Mr. Patterson has served as the Chief Executive Officer and Chairman of Northwater Capital Management, Inc., a venture capital company he founded in 1989. Previously, Mr. Patterson served as the President of Security Pacific Futures Inc. and Director of Futures and Options at Burns Fry Limited. Mr. Patterson is a former Governor of The Montreal Exchange and Chairman of the Commodity Futures Advisory Board of Ontario of the Ontario Securities Commission. Mr. Patterson also serves on the boards of directors of a number of private companies. Mr. Patterson received an Honours B.A. from Trent University, and an M.B.A. from the University of Toronto. Mr. Patterson brings to our board extensive experience in investments and corporate finance.
Robert P. Wayman has been a director since September 2008. In January 2007, Mr. Wayman retired from his position as Chief Financial Officer of Hewlett-Packard Company, a multinational information technology company, a position he held since 1984, and as HP's Executive Vice President, Finance and Administration, a position he held since 1992. During his 36-year career with HP, Mr. Wayman also served as HP's interim Chief Executive Officer from February 2005 until March 2005, and as a member of HP's board of directors from 1993 to 2002 and from February 2005 until March 2007. Mr. Wayman is currently a director of Affymetrix, Inc. and CareFusion Corporation and previously served as a director of Sybase Inc. Mr. Wayman received a B.S. in engineering and an M.B.A. from Northwestern University. Mr. Wayman brings to our board extensive business and executive leadership experience, including as a chief financial officer.
Board of Directors Composition
Current Board Composition
Our board currently consists of nine members. Pursuant to a voting agreement by and among holders of a majority of our voting capital stock, the Northwater Funds (as defined herein) and First Midwest Bancorp, Inc., each as holders of redeemable Series A-1 preferred stock (the "A-1 Holders"), and an affiliate of Aon plc, were each entitled to designate a member of our board of directors. Pursuant to such agreement, the Northwater Funds designated Mr. Patterson and an affiliate of Aon designated Mr. Besio. The voting agreement further provided that an additional three directors were to be designated by our chief executive officer and the directors chosen by the A-1 Holders.
98
Mr. Chandler, Mr. Habiger and Mr. Murray were so designated. The voting agreement terminated upon completion of our initial public offering.
Classified Board of Directors Following this Offering
Our restated certificate of incorporation, as amended, and our amended and restated bylaws provide for a classified board of directors consisting of three classes of directors, each serving staggered three-year terms. Our directors are divided among the three classes as follows:
- •
- Class I directors, who are Mr. Chandler, Mr. Habiger and General Pace, whose initial term will expire
at the annual meeting of stockholders to be held in 2014;
- •
- Class II directors, who are Mr. Besio, Mr. Botica and Mr. Patterson, whose initial term will
expire at the annual meeting of stockholders to be held in 2015; and
- •
- Class III directors, who are Mr. Allin, Mr. Murray and Mr. Wayman, whose initial term will expire at the annual meeting of stockholders to be held in 2016.
Directors in a particular class are elected for three-year terms at the annual meeting of stockholders in the year in which their terms expire. As a result, only one class of directors will be elected at each annual meeting of our stockholders, with the other classes continuing for the remainder of their respective three-year terms. Each director's term continues until the election and qualification of his successor, or his earlier death, resignation or removal.
Our restated certificate of incorporation, as amended, and our amended and restated bylaws provide that only our board of directors may increase or decrease the size of our board of directors and fill vacancies on our board of directors until the next annual meeting of stockholders. Any additional directorships resulting from an increase in the authorized number of directors would be distributed among the three classes so that, as nearly as possible, each class would consist of one-third of the authorized number of directors.
The classification of our board of directors and provisions described above may have the effect of delaying or preventing a change in control of our company. See "Description of Capital Stock—Anti-Takeover Provisions."
Director Independence
Our common stock is listed on the New York Stock Exchange (the "NYSE"). The listing rules of this stock exchange generally require that a majority of the members of a listed company's board of directors be independent within specified periods following the closing of an initial public offering. We have fully complied with these independence requirements by having a majority of independent directors as of the date of this prospectus. In addition, the listing rules generally require that, subject to specified exceptions, each member of a listed company's audit, compensation and nominating and corporate governance committees be independent. We have complied with this requirement as of the date of this prospectus.
Audit committee members must also satisfy the independence criteria set forth in Rule 10A-3 under the Exchange Act. In order to be considered independent for purposes of Rule 10A-3, a member of an audit committee of a listed company may not, other than in his or her capacity as a member of the audit committee, the board of directors, or any other board committee: accept, directly or indirectly, any consulting, advisory, or other compensatory fee from the listed company or any of its subsidiaries, or be an affiliated person of the listed company or any of its subsidiaries. All of the members of our audit committee satisfy these criteria.
99
Board Committees
Our board of directors has established an audit committee, a compensation committee and a nominating and corporate governance committee. Each of these committees has the composition and responsibilities described below. Members serve on these committees until their resignations or until otherwise determined by our board of directors.
Audit Committee
Our audit committee is comprised of Mr. Besio, Mr. Chandler and Mr. Wayman. Mr. Wayman is the chairman of our audit committee and is an audit committee financial expert, as that term is defined under SEC rules. The designation does not impose on him any duties, obligations or liabilities that are greater than are generally imposed on members of our audit committee and our board of directors. Our audit committee assists in the oversight of matters relating to our financial reporting processes and systems. Specific tasks include overseeing the quality and integrity of our financial statements, our compliance with certain regulatory requirements and internal accounting controls. The committee also reviews the performance of our independent registered public accounting firm and oversees policies associated with financial risk assessment and risk management.
Compensation Committee
Our compensation committee is comprised of Mr. Botica, Mr. Habiger and Mr. Murray. Mr. Murray is the chairman of our compensation committee. Our compensation committee determines the various elements of executive compensation. The committee maintains authority and responsibility for the administration of our executive compensation programs, including our 2008 Stock Incentive Plan and 2013 Long Term Incentive Plan.
Nominating and Corporate Governance Committee
Our nominating and corporate governance committee is comprised of Mr. Botica, Mr. Patterson and General Pace. Mr. Botica is the chairman of our nominating and corporate governance committee. Our nominating and corporate governance committee considers matters related to corporate governance, develops general criteria regarding the qualifications and selection of board members and recommends candidates for election to our board of directors.
Board Leadership Structure
Our board of directors believes that our Chief Executive Officer, Mr. Allin, is best situated to serve as Chairman of the Board because he is the director most familiar with our business and industry, and most capable of effectively identifying strategic priorities and leading the discussion and execution of strategy. Our board of directors believes that unification of these positions provides for a single vision for our company and results in an effective and efficient organizational structure.
Role of Board in Risk Oversight
Risk assessment and oversight are integral parts of our governance and management processes. Our board of directors encourages management to promote a culture that incorporates risk management into our corporate strategy and day-to-day business operations. Management discusses strategic and operational risks at regular management meetings, and conducts specific strategic planning and review sessions during the year that include a focused discussion and analysis of the risks facing us. From time to time, senior management reviews these risks with our board of directors at regular board meetings as part of management presentations that focus on particular business functions, operations or strategies and presents the steps taken by management to address such risks. Our board of directors does not have a standing risk management committee, but rather administers this oversight function
100
directly through our board of directors as a whole, as well as through various standing committees of our board of directors that address risks inherent in their respective areas of oversight.
Code of Business Conduct and Ethics
We have adopted a code of business conduct and ethics that applies to all of our employees, including our executive officers and directors, and those employees responsible for financial reporting. The code of business conduct and ethics are available on our website at www.texturacorp.com. To the extent required by law, any amendments to the code, or any waivers of its requirements, are also disclosed on our website.
101
2012 Summary Compensation Table
The following table sets forth information regarding the compensation awarded to, earned by, or paid to certain of our executive officers during the year ended September 30, 2012. As an "emerging growth company," we have opted to comply with the executive compensation disclosure rules applicable to "smaller reporting companies" as such term is defined in the rules promulgated under the Securities Act, which require compensation disclosure for our principal executive officer and the two most highly compensated executive officers other than our principal executive officer. Throughout this prospectus, these three officers are referred to as our named executive officers.
Name and Principal Position
|
Year | Salary | Bonus(1) | Stock Awards(2) |
Option Awards(3) |
All Other Compensation(4) |
Total | |||||||||||||||
|---|---|---|---|---|---|---|---|---|---|---|---|---|---|---|---|---|---|---|---|---|---|---|
Patrick J. Allin |
2012 | $ | 455,000 | $ | 690,000 | $ | 0 | $ | 677,899 | $ | 8,926 | $ | 1,831,825 | |||||||||
Chairman and Chief Executive Officer |
||||||||||||||||||||||
Howard Niden |
2012 | $ | 320,000 | $ | 165,000 | $ | 0 | $ | 423,682 | $ | 8,407 | $ | 917,089 | |||||||||
Executive Vice President and Chief Solutions Architect |
||||||||||||||||||||||
Jillian Sheehan |
2012 | $ | 253,750 | $ | 215,000 | $ | 0 | $ | 362,048 | $ | 8,120 | $ | 838,918 | |||||||||
Executive Vice President and Chief Financial Officer |
||||||||||||||||||||||
- (1)
- Bonus
amount earned in fiscal 2012 to be paid over fiscal 2013 and fiscal 2014.
- (2)
- During
fiscal 2012, we awarded restricted stock units to Mr. Allin, Mr. Niden and Ms. Sheehan in the amount of 78,750, 10,938 and
18,692 units, respectively. The grant date fair value of the restricted stock units was $1,025,719 for Mr. Allin, $142,467 for Mr. Niden and $243,463 for Ms. Sheehan.
However, the restricted stock units were awarded with a contingency that they would not become payable in cash or shares of our stock unless there were a change in control of our company or our
company completed an initial public offering and the agreements were terminated in connection with the initial public offering. As neither a change in control nor initial public offering was
determined to be probable, we did not recognize any share-based compensation expense for these awards until June 2013 in connection with the Company's initial public offering. Accordingly, the amount
of compensation reflected in the Stock Awards column in this table is $0.
- (3)
- During
fiscal 2012, we awarded options to Mr. Allin, Mr. Niden and Ms. Sheehan in the amount of 104,686, 65,428 and
55,910 options, respectively. The disclosed amounts represent the grant date fair value of options granted during fiscal 2012. The assumptions used in determining the grant date fair value of
options are described in Note 13 of our audited consolidated financial statements included elsewhere in this prospectus.
- (4)
- Includes 401(k) plan matching contributions and the cost of life insurance premiums for each executive.
The total compensation of our named executive officers for fiscal 2012, including the amount of equity awards, was determined by our board of directors in accordance with the recommendation of our compensation committee.
The restricted stock units granted in 2012 would normally have vested in three equal annual installments on the first, second and third anniversaries of the grant date (or termination due to death or disability); however, the restricted stock units became fully vested upon termination of the restricted stock unit agreements in connection with our initial public offering. The vested restricted stock units are payable one year following the initial public offering.
102
The exercise price of the stock options granted in 2012 is $13.03 per share, the fair market value of our stock on the grant date, as determined by us. These stock options generally vest in quarterly installments on each three-month anniversary of the grant date over a three-year period from the grant date. The executive must be employed on the applicable vesting date in order to vest in the stock options. Both unvested and vested stock options are forfeited immediately upon the executive's termination of employment for cause. The stock options expire on the 10th anniversary of the grant date, unless they are exercised before then or expire prior thereto pursuant to the terms of the grant.
Our 2008 Stock Incentive Plan defines "cause" as gross negligence, personal dishonesty, incompetence, willful misconduct, any breach of fiduciary duty involving personal profit, intentional failure to perform stated duties, or the willful violation of any law, rule or regulation (other than traffic violations or similar offenses); provided, however, that if an executive has an employment agreement with us and such employment agreement defines a termination for "cause," then "cause" has the same meaning as set forth in the employment agreement.
Outstanding Equity Awards at Fiscal Year-End
The following table shows all outstanding equity awards held by each of our named executive officers on September 30, 2012.
| |
Option Awards | Stock Awards | ||||||||||||||||||||||||||
|---|---|---|---|---|---|---|---|---|---|---|---|---|---|---|---|---|---|---|---|---|---|---|---|---|---|---|---|---|
Name
|
Number of Securities Underlying Unexercised Options- Exercisable |
Number of Securities Underlying Unexercised Options- Unexercisable (1) |
Equity Incentive Plan Awards: Number of Securities Underlying Unexercised Unearned Options- Unexercisable |
Option Exercise Price |
Option Expiration Date |
Number of Shares or Units of Stock That Have Not Vested |
Market Value of Shares or Units of Stock That Have Not Vested (4) |
Equity Incentive Plan Awards: Number of Unearned Shares, Units or Other Rights That Have Not Vested |
Equity Incentive Plan Awards: Market or Payout Value of Unearned Shares, Units or Other Rights That Have Not Vested |
|||||||||||||||||||
Patrick J. Allin |
277,830 | — | — | $ | 16.26 | 5/2/2018 | 78,750(2 | ) | $ | 1,096,200 | — | — | ||||||||||||||||
|
76,668 | — | — | $ | 16.26 | 8/8/2018 | — | — | — | — | ||||||||||||||||||
|
58,706 | — | — | $ | 16.26 | 10/29/2019 | — | — | — | — | ||||||||||||||||||
|
12,916 | — | — | $ | 10.03 | 9/10/2020 | — | — | — | — | ||||||||||||||||||
|
27,168 | 38,036 | — | $ | 10.03 | 6/2/2021 | — | — | — | — | ||||||||||||||||||
|
26,170 | 78,516 | — | $ | 13.03 | 1/18/2022 | — | — | — | — | ||||||||||||||||||
Howard Niden |
25,000 | 55,000 | — | $ | 10.03 | 6/13/2021 | 10,938(2 | ) | $ | 152,257 | — | — | ||||||||||||||||
|
16,356 | 49,072 | — | $ | 13.03 | 1/18/2022 | 20,000(3 | ) | $ | 278,400 | — | — | ||||||||||||||||
Jillian Sheehan |
8,000 | — | — | $ | 12.38 | 8/3/2017 | 18,692(2 | ) | $ | 260,193 | — | — | ||||||||||||||||
|
6,000 | — | — | $ | 16.26 | 8/8/2018 | — | — | — | — | ||||||||||||||||||
|
35,000 | 5,000 | — | $ | 16.26 | 5/21/2019 | — | — | — | — | ||||||||||||||||||
|
4,400 | 4,400 | — | $ | 10.03 | 9/10/2020 | — | — | — | — | ||||||||||||||||||
|
13,124 | 16,876 | — | $ | 10.03 | 12/7/2020 | — | — | — | — | ||||||||||||||||||
|
13,976 | 41,934 | — | $ | 13.03 | 1/18/2022 | — | — | — | — | ||||||||||||||||||
- (1)
- Options
granted to Mr. Allin vest as follows: 38,036 options vest in seven installments on December 2, 2012, March 2, 2013,
June 2, 2013, September 2, 2013, December 2, 2013, March 2, 2014, and June 2, 2014; and 78,516 options vest in nine installments on January 18, 2013,
April 18, 2013, July 18, 2013, October 18, 2013, January 18, 2014, April 18, 2014, July 18, 2014, October 18, 2014, and January 18, 2015.
- Options granted to Mr. Niden vest as follows: 55,000 options vest in eleven installments on December 13, 2012, March 13, 2013, June 13, 2013, September 13, 2013, December 13, 2013, March 13, 2014, June 13, 2014, September 13, 2014, December 13, 2014, March 13, 2015, and June 13, 2015; and 49,072 options vest in nine installments on January 18, 2013, April 18, 2013,
103
July 18, 2013, October 18, 2013, January 18, 2014, April 18, 2014, July 18, 2014, October 18, 2014, and January 18, 2015.
- Options
granted to Ms. Sheehan vest as follows: 5,000 options vest in two installments on February 21, 2013 and
May 21, 2013; 4,400 options vest in eight installments on December 10, 2012, March 10, 2013, June 10, 2013, September 10, 2013, December 10, 2013,
March 10, 2014, June 10, 2014, and September 10, 2014; 16,876 options vest in nine installments on December 7, 2012, March 7, 2013, June 7, 2013,
September 7, 2013, December 7, 2013, March 7, 2014, June 7, 2014, September 7, 2014, and December 7, 2014; and 41,934 options vest in nine installments
on January 18, 2013, April 18, 2013, July 18, 2013, October 18, 2013, January 18, 2014, April 18, 2014, July 18, 2014, October 18, 2014, and
January 18, 2015.
- (2)
- The
restricted stock units were terminated and became payable as described in the text following the 2012 Summary Compensation Table.
- (3)
- Restricted
stock units would normally have vested quarterly on each three-month anniversary of the grant date provided Mr. Niden remained employed
through the vesting date (or termination due to death or disability); however, the restricted stock units became fully vested upon their termination in connection with our initial public offering. The
restricted stock units are payable one year following the initial public offering.
- (4)
- Based on the fair value of our common stock of $13.92 per share as determined as of September 30, 2012.
In addition to the stock awards listed in the table above, Mr. Allin, Mr. Niden and Ms. Sheehan owned the following RSUs as of September 30, 2012: Mr. Allin (8,626), Mr. Niden (10,000) and Ms. Sheehan (18,692). These RSUs are fully vested and are payable one year following the initial public offering.
Defined Contribution Plan
We maintain a tax-qualified defined contribution plan that covers all eligible employees who are over age 21. The plan permits employees to make pre-tax contributions and provides for discretionary employer matching contributions and profit sharing contributions. Employer contributions vest over five years. We do not maintain any nonqualified pension plans for our named executive officers. In addition, we do not maintain any qualified or non-qualified defined benefit pension plans.
Employment Agreements with Executive Officers
Patrick J. Allin. We entered into an employment agreement (the "2010 Agreement") with Patrick J. Allin, our Chief Executive Officer, on October 1, 2010.
The 2010 Agreement with Mr. Allin specified an annual base salary of $455,000, with an annual review by our board of directors or compensation committee, to determine whether to adjust Mr. Allin's base salary.
The 2010 Agreement specified that Mr. Allin would be eligible to participate in any performance bonus plans, long-term incentive plans and equity-based compensation plans established by our company for its officers. The agreement specified that Mr. Allin would be eligible for a target bonus contingent upon achievement of performance goals set by our company, as determined by our board of directors or a relevant committee of the board. The agreement provided that Mr. Allin's target bonus for years subsequent to fiscal 2010 would not be less than 200% of base salary. However, for fiscal 2012 our board of directors and Mr. Allin agreed to a revised target bonus of 162.5% of base salary.
We entered into a new employment agreement (the "2013 Agreement") with Mr. Allin on March 28, 2013 and such agreement superseded the 2010 Agreement described above.
104
The 2013 Agreement continues until September 30, 2016, and is automatically extended for two-year periods commencing October 1, 2016, unless we or Mr. Allin deliver a notice of non-continuation before March 31, 2016 or any subsequent March 31 prior to the expiration of the applicable two-year period.
The 2013 Agreement maintains Mr. Allin's annual base salary of $455,000. The base salary will be reviewed annually by our board of directors or compensation committee to determine whether to adjust Mr. Allin's base salary; provided that the annual base salary cannot be reduced without Mr. Allin's consent.
The 2013 Agreement specifies that Mr. Allin is eligible to participate in any performance bonus plans, long term incentive plans and equity-based compensation plans established by our company for its officers. The 2013 Agreement further specifies that Mr. Allin is eligible for a target bonus contingent upon achievement of performance goals set by our company, as determined by our board of directors or a relevant committee of the board. The 2013 Agreement provides that Mr. Allin's target bonus for each fiscal year during the term of the agreement will not be less than 125% of his base salary; provided that the actual amount of such bonus may range from 0% to 187.5% of his base salary depending on the level of achievement of the performance goals set by our company.
Under the 2013 Agreement, Mr. Allin is eligible to participate in all employee benefits plans and other benefits programs made available to similarly situated executive employees.
As part of the 2013 Agreement, Mr. Allin is entitled to payments upon termination of his employment for death or disability, termination by us without cause or termination by him for good reason. If Mr. Allin's employment is terminated due to his death or disability, he, or his estate, as applicable, will receive a lump sum payment equal to the higher of his actual bonus paid for the immediately preceding year or the target bonus for the year of termination. If we terminate Mr. Allin's employment other than for cause, or he terminates for good reason, he will receive (a) salary continuation for 24 months, (b) a bonus payment for the year of his termination equal to the greater of the target bonus for the year of termination or the average bonus received by Mr. Allin for the last three completed fiscal years prior to the year of termination, (c) 24 months of medical, dental and vision coverage at the same cost to Mr. Allin as in effect on the day of his termination, (d) immediate vesting of any outstanding equity and equity-based awards (other than awards intended to satisfy the requirements for performance-based compensation under Section 162(m) of the Internal Revenue Code of 1986, as amended (the "Code")) and an extended period to exercise options and (e) outplacement services with a value not to exceed $25,000. If we do not renew Mr. Allin's employment agreement and terminate his employment without cause in connection with such non-renewal, he will receive the same benefits as described in the previous sentence except that the salary continuation and the medical, dental and vision coverage will only be provided for 12 months rather than 24 months. Finally, if we terminate Mr. Allin's employment other than for cause (including following a nonrenewal of his employment agreement), or he terminates for good reason, in each case during the 24 month period following a change in control of the company, he will receive (a) salary continuation for 24 months, (b) a bonus payment for the year of his termination equal to two times the greater of (i) the target bonus for the year of termination or the year in which the change in control event occurred or (ii) the average bonus received by Mr. Allin for the last three completed fiscal years prior to the year of termination, (c) 24 months of medical, dental and vision coverage at the same cost to Mr. Allin as in effect on the day of his termination, (d) immediate vesting of any outstanding equity and equity-based awards (other than awards intended to satisfy the requirements for performance-based compensation under Section 162(m) of the Code) and an extended period to exercise options and (e) outplacement services with a value not to exceed $25,000. Severance benefits are generally conditioned on Mr. Allin's execution and delivery of a release of claims.
105
"Good reason" is generally defined as a material diminution in base compensation, authority, duties or responsibilities as CEO, or the budget over which he retains authority, a change in the location at which Mr. Allin must work for our company to a location outside of the Chicago metropolitan area or a material breach by us of the 2013 Agreement. A termination is only treated as a termination for good reason if Mr. Allin provides notice to our company within 90 days of the initial existence of a condition constituting good reason, we fail to cure such condition within 30 days following such notice and Mr. Allin terminates his employment within six months of the initial existence of such condition. "Cause" is generally defined as willful and continued failure to satisfactorily perform his duties after a written demand from us, willful misconduct or dishonesty, which injures our company, engaging in egregious misconduct involving serious moral turpitude, his refusal or failure to substantially comply with our rules, policies or code of business conduct, commission of an act that could result in his disqualification from being employed by our company, failure to cooperate in any internal investigation or external proceeding, or conviction or plea of no contest to a felony or other crime involving moral turpitude.
The 2013 Agreement requires Mr. Allin to reimburse us for certain compensation received by Mr. Allin and for certain profits realized by Mr. Allin from the sale of our stock in the event that we are required to prepare an accounting restatement which is due to material noncompliance with any financial reporting requirement under federal securities laws and which is a result of misconduct. The reimbursement obligation includes reimbursing us for (a) any bonuses, incentive-based compensation or equity-based compensation received from us during the 12 month period following the filing or public issuance of the document embodying such financial reporting requirement and (b) any profits realized by Mr. Allin from the sale of our stock during such 12 month period. Additionally, Mr. Allin agrees that any payments made to him in connection with his employment shall be subject to any compensation recovery policy adopted by us to comply with applicable law, including, without limitation, the Dodd-Frank Wall Street Reform and Consumer Protection Act or to comport with good corporate governance practices, as such policy may be amended from time to time.
The 2013 Agreement, among other things, also includes confidentiality provisions of an unlimited duration and non-competition, non-solicitation and non-disparagement restrictive covenants that extend for a period of two years following termination of Mr. Allin's employment. Finally, the 2013 Agreement provides Mr. Allin with the right to receive a tax gross-up payment in the event that any payments due to Mr. Allin pursuant to the 2013 Agreement or any other agreement between us and Mr. Allin are subject to the excise tax imposed pursuant to Sections 280G and 4999 of the Code by reason of being contingent on a change in control. The tax gross-up payment will be sufficient to cover the cost of such excise tax payment and any resulting taxes imposed on such payment.
Howard Niden. Mr. Niden rejoined our company in June 2011 as an Executive Vice President and our Chief Solutions Architect. Mr. Niden's offer letter provided for a base salary of $320,000 annually and a target bonus of 100% of base salary. The offer letter also provided for the grant of 30,000 restricted stock units, which were awarded on June 13, 2011. 10,000 of the restricted stock units vested on the first anniversary of the grant date, while the remainder will vest on a quarterly basis on each three-month anniversary of the grant date through June 2015. The restricted stock units that are vested become payable upon a change in control of our company or pursuant to a termination of the agreements in connection with the completion of an initial public offering by our company. Additionally, the offer letter provided for a grant of stock options to purchase 80,000 shares of common stock at an exercise price of $10.03, with the following vesting schedule: 25% to vest at the end of 12 months and ratable quarterly vesting thereafter for 36 months, exercisable for five years.
Other Executive Officers. We entered into an employment agreement (the "Form Agreement") with Mr. Niden, Jillian Sheehan, our Executive Vice President and Chief Financial Officer, and certain other executive officers of our company in April 2013. For Mr. Niden, the Form Agreement with us superseded the offer letter described above. Pursuant to the terms of the applicable agreement,
106
Mr. Niden's annual base salary will be $320,000, and Ms. Sheehan's annual base salary will be $280,000, in each case with an annual review by our board of directors or compensation committee, to determine whether to adjust such base salary; provided that the base salary amount cannot be reduced without the executive's consent.
Except for title and the amount of base salary specified above, the terms of the Form Agreement are generally the same for each executive as described below. The Form Agreement continues until the termination of employment of the executive pursuant to the terms of the agreement.
The Form Agreement specifies that the executive is eligible to participate in any performance bonus plans, long-term incentive plans and equity-based compensation plans established by our company for its officers. The Form Agreement further specifies that the executive is eligible for a target bonus contingent upon achievement of performance goals set by our company, as determined by our board of directors or a relevant committee of the board. The Form Agreement provides that the target bonus for each fiscal year during the term of the employment agreement will not be less than 70% of the executive's base salary; provided that the actual amount of such bonus may range from 0% to 105% of base salary depending on the level of achievement of the performance goals set by our company.
Under the Form Agreement, the executive is eligible to participate in all employee benefits plans and other benefits programs made available to similarly situated executive employees.
As part of the Form Agreement, the executive is entitled to payments upon termination of employment for death or disability, termination by us without cause or termination by the executive for good reason. If the executive's employment is terminated due to his or her death or disability, the executive, or his or her estate as applicable, will receive a lump sum payment equal to the higher of the actual bonus paid for the immediately preceding year or the target bonus for the year of termination. If we terminate the executive's employment other than for cause, or he or she terminates for good reason, the executive will receive (a) salary continuation for 12 months (18 months if the executive has been employed by the company for at least 5 years as of the date of termination), (b) a bonus payment for the year of termination equal to the greater of the target bonus for the year of termination or the average bonus received by the executive for the last three completed fiscal years prior to the year of termination, (c) 12 months (18 months if the executive has been employed by the company for at least 5 years as of the date of termination) of medical, dental and vision coverage at the same cost to the executive as in effect on the day of his or her termination, (d) immediate vesting of any outstanding equity and equity-based awards (other than awards intended to satisfy the requirements for performance-based compensation under Section 162(m) of the Code) and an extended period to exercise options and (e) outplacement services with a value not to exceed $25,000. Finally, if we terminate the executive's employment other than for cause, or he or she terminates for good reason, in each case during the 24 month period following a change in control of the company, the executive will receive (a) salary continuation for 24 months, (b) a bonus payment for the year of termination equal to two times the greater of the target bonus for the year of termination or the average bonus received for the last three completed fiscal years prior to the year of termination, (c) 24 months of medical, dental and vision coverage at the same cost to the executive as in effect on the day of his or her termination, (d) vesting of any outstanding equity and equity-based awards (other than awards intended to satisfy the requirements for performance-based compensation under Section 162(m) of the Code) and an extended period to exercise options and (e) outplacement services with a value not to exceed $25,000. Severance benefits are generally conditioned on the executive's execution and delivery of a release of claims.
"Good reason" is generally defined as a material diminution in base compensation, authority, duties or responsibilities, a change in the location at which the executive must work for our company to a location outside of the Chicago metropolitan area or a material breach by us of the Form Agreement.
107
A termination is only treated as a termination for good reason if the executive provides notice to our company within 90 days of the initial existence of a condition constituting good reason, we fail to cure such condition within 30 days following such notice and the executive terminates his or her employment within six months of the initial existence of such condition. "Cause" is generally defined as willful and continued failure to satisfactorily perform the executive's duties after a written demand from us, willful misconduct or dishonesty, which injures our company, engaging in egregious misconduct involving serious moral turpitude, the executive's refusal or failure to substantially comply with our rules, policies or code of business conduct, commission of an act that could result in his or her disqualification from being employed by our company, failure to cooperate in any internal investigation or external proceeding, or conviction or plea of no contest to a felony or other crime involving moral turpitude.
The Form Agreement requires the executive to reimburse us for certain compensation received by the executive and for certain profits realized by the executive from the sale of our stock in the event that we are required to prepare an accounting restatement which is due to material noncompliance with any financial reporting requirement under federal securities laws and which is a result of misconduct. The reimbursement obligation includes reimbursing us for (a) any bonuses, incentive-based compensation or equity-based compensation received from us during the 12 month period following the filing or public issuance of the document embodying such financial reporting requirement and (b) any profits realized by the executive from the sale of our stock during such 12 month period. Additionally, the executive agrees that any payments made to him or her in connection with his or her employment shall be subject to any compensation recovery policy adopted by us to comply with applicable law, including, without limitation, the Dodd-Frank Wall Street Reform and Consumer Protection Act or to comport with good corporate governance practices, as such policy may be amended from time to time.
The Form Agreement, among other things, also includes confidentiality provisions of an unlimited duration and non-competition, non-solicitation and non-disparagement restrictive covenants that extend for a period of one year following termination of the executive's employment. Finally, the Form Agreement provides us with the right to reduce any payments to the executive in the event that any payments that would otherwise be made pursuant to the Form Agreement or any other agreement between us and the executive would be subject to the excise tax imposed pursuant to Sections 280G and 4999 of the Code by reason of being contingent on a change in control. We will only have the right to reduce such payments if, as a result of such reduction, the executive would receive a net after-tax payment amount that is greater than the amount the executive would receive if no reductions were made and the executive had to pay such excise tax.
2008 Stock Incentive Plan
We initially adopted our 2008 Stock Incentive Plan in October 2007, at the beginning of our 2008 fiscal year. Our board of directors amended and restated and our stockholders approved an amendment and restatement of our 2008 Stock Incentive Plan in 2009. Our 2008 Stock Incentive Plan provides for the grant of non-statutory stock options, stock, restricted stock units, and stock appreciation rights, to our employees, directors, and independent contractors.
Authorized Shares
A total of 3,400,000 shares of our common stock and Series A-2 preferred stock have been reserved for issuance pursuant to our 2008 Stock Incentive Plan. As of March 31, 2013, 2,442,514 options to purchase our common stock and 623,834 restricted stock units were outstanding. No awards relating to our Series A-2 preferred stock have been granted.
108
Plan Administration
The compensation committee of our board of directors administers our 2008 Stock Incentive Plan. Subject to the provisions of our 2008 Stock Incentive Plan, the committee has the power to administer the plan, including but not limited to the power to establish, amend, suspend and waive such rules and regulations as it deems necessary for the proper administration of the 2008 Stock Incentive Plan, to make whatever determinations and interpretations in connection with the 2008 Stock Incentive Plan it deems necessary or advisable with respect to participants, and to determine the terms of the awards, including the exercise price, the number and type of shares subject to each such award, the exercisability of the awards, vesting or other restrictions applicable to the award, the time period within which the option may be exercised, and the form of consideration, if any, payable upon exercise. The committee may extend the time period within which the option may be exercised for a period not exceeding five years past the end date of the original option period and in accordance with any applicable provisions of Section 409A of the Code. The committee also has the authority to amend existing awards to comply with Section 409A of the Code or for other reasons, provided that such amendment may not materially and adversely affect the rights of a participant under such award.
Stock Options
Our 2008 Stock Incentive Plan provides that the exercise price of options granted thereunder must at least be equal to the fair market value of our stock on the date of grant, unless the committee provides otherwise in the specified award, in which case the terms of such option shall comply with the requirements of Section 409A of the Code to avoid the additional taxes referenced therein. The committee determines the methods of payment of the exercise price of an option, which may include cash or shares. Our 2008 Stock Incentive Plan also provides that after the termination of service of an employee, director, or independent contractor, he or she may exercise his or her options for the period of time stated in his or her option agreement up to 90 days following termination. Additionally, all options will terminate upon termination for cause. Subject to the provisions of our 2008 Stock Incentive Plan, the committee determines the other terms of options.
If a participant pays for all or any portion of the aggregate option purchase price by withholding a number of shares upon exercise of an option, the committee may grant a reload option. Such reload option may grant the participant a new option for the number of shares equal to the number tendered as consideration for the purchase of shares under the former option under terms satisfactory to the committee.
Options may be exercised through payment of the exercise price in cash or in a cashless exercise by withholding of shares otherwise deliverable upon exercise of the option.
Stock Appreciation Rights
A stock appreciation right granted under our 2008 Stock Incentive Plan shall confer on the holder thereof a right to receive upon exercise thereof the excess of (i) the fair market value on the date of exercise (or, if the committee shall so determine, at any time during a specified period before or after the date of exercise) over (ii) the grant price of the stock appreciation right as specified by the committee, which price shall not be less than 100% of the fair market value on the date of grant of the stock appreciation right. Subject to the terms of our 2008 Stock Incentive Plan and any applicable award, the grant price, term, methods of exercise, dates of exercise, methods of settlement and any other terms and conditions of any stock appreciation right shall be as determined by the committee. The committee may impose such conditions or restrictions on the exercise of any stock appreciation right as it may deem appropriate.
109
Stock Grants
Shares of our common stock or Series A-2 preferred stock that vest in accordance with terms and conditions established by the committee may be granted under our 2008 Stock Incentive Plan. The committee determines the number of shares of stock granted to any employee, director, or independent contractor and, subject to the provisions of our 2008 Stock Incentive Plan, determines the terms and conditions of such awards. The committee may impose whatever conditions to vesting it determines to be appropriate (for example, the committee may set restrictions based on the achievement of specific performance goals or continued service to us); provided, however, that the committee, in its sole discretion, may accelerate the time at which any restrictions will lapse or be removed. Recipients of stock grants generally have voting and dividend rights with respect to such shares upon grant without regard to vesting, unless the committee provides otherwise, except that the dividends shall be accumulated in an escrow account and shall not be paid to the participant unless and until the expiration of any restrictions or satisfaction of any performance requirements. Unless the Committee provides otherwise in the specified award or otherwise consents in writing, all of the shares of stock covered by a stock grant shall be forfeited if the applicable restrictions or performance obligations do not expire or are not satisfied. Upon forfeiture of shares of stock, such shares shall be transferred back to us without further action by the participant.
Restricted Stock Units
A restricted stock unit confers on the holder a right to receive a share of common stock (or other converted ownership interest as may be provided under the restricted stock unit agreement) or a cash payment equal to the value of a share of common stock, if and when the restricted stock unit becomes payable. Subject to the provisions of our 2008 Stock Incentive Plan, the committee determines the terms and conditions of restricted stock units, including the vesting criteria and the form and timing of payment.
Outside Directors
Our 2008 Stock Incentive Plan provides that non-employee directors are eligible to receive all types of awards under our 2008 Stock Incentive Plan.
Non-Transferability of Awards
Unless the committee provides otherwise, our 2008 Stock Incentive Plan generally does not allow for the transfer of awards and only the recipient of an award may exercise an award during his or her lifetime.
Certain Adjustments
In the event of certain changes in our capitalization, to prevent diminution or enlargement of the benefits or potential benefits available under our 2008 Stock Incentive Plan, the committee will adjust the number and class of shares that may be delivered under our 2008 Stock Incentive Plan and/or the number, class and price of shares covered by each outstanding award, and the numerical share limits set forth in our 2008 Stock Incentive Plan.
Change in Control
Unless the committee provides otherwise in the specified award, upon 30 days advance written notice by us to the participant of our intent to consummate a change in control, we shall have the right, exercisable in our sole discretion, to require that the participant exercise his or her right to purchase all the shares that the participant has a vested right to purchase under an existing award within the 10-day period following the expiration of the advance notice period. If the participant fails to
110
exercise such right as to all the shares that the participant has a vested right to purchase within such 10-day period, then to the extent not so exercised, all remaining purchase rights under the outstanding options (regardless of their vested status) shall be immediately forfeited.
No acceleration of vesting will occur upon a change in control unless the committee provides otherwise in the specified award or otherwise consents in writing. In the event we merge with or into another corporation, or we experience a change in control, unless the award agreement provides otherwise, each outstanding award may be assumed or an equivalent award substituted by the successor corporation or a parent or subsidiary of the successor corporation.
The committee may, without obtaining participant consent, require that each option that is outstanding on the date of a change in control be terminated as of the date of the change in control in exchange for a cash payment to the participant equal to the product of (a) the number of shares that the participant has a vested and, if approved by the committee, the unvested right to purchase under the award as of the date of the change in control and (b) the excess (if any) of the price paid for a share of common stock or Series A-2 preferred stock in the change in control transaction (as determined by the committee) over the purchase price per share under such option. Each option that is outstanding and unexercised immediately prior to the change in control, whether vested or unvested, that has an exercise price greater than or equal to the price paid for a share of common stock or Series A-2 preferred stock in the change in control (as determined by the committee), may be cancelled at such time, without obtaining participant consent, by the committee.
"Change in control" means the occurrence of the following events, subject to certain exceptions: (a) any person (other than us, a trustee or other fiduciary holding securities under an employee benefit plan of our company or an underwriter) is or becomes the "beneficial owner" (as defined in Rule 13d-3 under the Exchange Act), directly or indirectly, of our securities representing more than 70% of the total voting power of our company; (b) the consummation of a merger or consolidation of our company with or into any other corporation or any other corporate reorganization if more than 70% of the combined voting power of our voting securities or such surviving entity (or any parent thereof) outstanding immediately after such merger, consolidation or reorganization is owned by persons who were not stockholders of our company immediately prior to such merger, consolidation or reorganization; (c) the complete liquidation or dissolution of our company; or (d) the sale or disposition of all or substantially all of our assets.
Amendments; Terminations
The committee has the authority to amend, suspend or terminate our 2008 Stock Incentive Plan provided such action does not impair the existing rights of any participant. Our 2008 Stock Incentive Plan automatically terminates in 2017, unless we terminate it sooner; provided, however, that no new awards will be made under the 2008 Stock Incentive Plan after our common stock becomes publicly traded pursuant to an initial public offering.
2013 Long Term Incentive Plan
We adopted our 2013 Long Term Incentive Plan (the "2013 Long Term Incentive Plan") in March 2013 to provide for grants of equity and cash awards effective upon the initial public offering. The 2013 Long Term Incentive Plan provides for the grant of stock options (both nonqualified stock options and incentive stock options), stock appreciation rights ("SARs"), full value awards (as described below, including restricted stock, restricted stock units, deferred stock units, performance stock, and performance stock units), and cash incentive awards (as described below). Awards may be made under the 2013 Long Term Incentive Plan to any of our officers, directors or other employees (and those of our affiliates with respect to which we are connected through ownership interests of at least 50%, sometimes called "related companies"), consultants, independent contractors or agents of us or a related company, and persons who are expected to become officers, employees, directors, consultants,
111
independent contractors or agents of us or a related company, including non-employee directors. No award, however, may be effective earlier than the date on which the person begins to provide services to us or a related company.
Effective Date and Duration
The 2013 Long Term Incentive Plan became effective in May 2013 when it was approved by our stockholders. The 2013 Long Term Incentive Plan will remain in effect as long as any shares of common stock awarded under it are outstanding; provided, however, that no new awards will be made under the 2013 Long Term Incentive Plan on or after the tenth anniversary of the effective date.
Authorized Shares and Limitations
A total of 6,000,000 shares of our common stock have been reserved for issuance under the 2013 Long Term Incentive Plan. Generally, any shares of our common stock that are subject to an award under the 2013 Long Term Incentive Plan which for any reason is forfeited, expires or is terminated without issuance of shares of our common stock (including shares that are attributable to awards that are settled in cash) or is tendered or withheld as to any shares in payment of the exercise price of the grant or the taxes payable with respect to the exercise or vesting of the award will be available for further grants under the 2013 Long Term Incentive Plan. In addition, the following limitations will apply:
- •
- A total of 6,000,000 shares of our common stock may be delivered pursuant to the 2013 Long Term Incentive Plan with
respect to incentive stock options.
- •
- The maximum number of shares of our common stock that may be covered by awards granted to any one participant during any
one calendar-year period pursuant to stock options or SARs will be 1,000,000 shares if the awards are intended to constitute performance-based compensation for purposes of
section 162(m) of the Code ("Performance-Based Compensation").
- •
- The maximum number of shares of our common stock that may be delivered pursuant to full value awards granted to any one
participant during any one calendar year period (regardless of whether settlement occurs prior to, at, or after the time of vesting) will be 40,000 shares if the awards are intended to be
Performance-Based Compensation.
- •
- For cash incentive awards that are intended to be Performance-Based Compensation, the maximum amount payable to any participant with respect to any twelve month performance period shall equal $4,000,000 (pro rated for performance periods that are greater or lesser than twelve months).
In the event of certain corporate transactions that affect our common stock, including a stock dividend, stock split, reverse stock split, extraordinary cash dividend, recapitalization, reorganization, merger, consolidation, split-up, spin-off, exchange of shares, sale of assets or subsidiaries, or combination such that the Committee (as described below) determines, in its sole discretion, that an adjustment is warranted in order to preserve the benefits or prevent the enlargement of benefits of awards under the 2013 Long Term Incentive Plan, the Committee shall, in the manner it determines equitable in its sole discretion: (a) adjust the number and kind of shares which may be delivered under the 2013 Long Term Incentive Plan (including adjustments to the number and kind of shares that may be granted to an individual during any specified time as described above), adjust the number and kind of shares subject to outstanding awards; (c) adjust the exercise price of outstanding stock options and SARs, and make any other adjustments that the Committee (as defined below) determines to be equitable (which may include, without limitation: (i) replacement of awards with other awards which the Committee determines have comparable value and which are based on stock of a company resulting from the transaction, and (ii) cancellation of the award in return for cash payment of the current value
112
of the award, determined as though the award is fully vested at the time of payment, provided that in the case of a stock option or SAR, the amount of such payment may be the excess of value of the shares of our common stock subject to the stock option or SAR at the time of the transaction over the exercise prices).
Plan Administration
Generally, the 2013 Long Term Incentive Plan is administered by the compensation committee of our board of directors (the "Committee"); provided, however, that for purposes of awards to non-employee directors the Committee is the board of directors. Subject to the provisions of the 2013 Long Term Incentive Plan, the Committee has the authority and discretion to (i) select eligible individuals who will receive awards under the 2013 Long Term Incentive Plan, (ii) determine the time or times of receipt of awards, (iii) determine the types of awards and the number of shares of our common stock covered by the awards, (iv) establish the terms, conditions, performance targets, restrictions, and other provisions of awards, (v) modify the terms of, cancel or suspend awards, (vi) reissue or repurchase awards, and (vii) accelerate the exercisability or vesting of any award. The Committee also has the authority and discretion to conclusively interpret the 2013 Long Term Incentive Plan, to establish, amend and rescind any rules and regulations relating to the 2013 Long Term Incentive Plan, to determine the terms and provisions of any agreements made pursuant to the 2013 Long Term Incentive Plan and to make all other determinations that may be necessary or advisable for the administration of the 2013 Long Term Incentive Plan.
Stock Options and SARs
The 2013 Long Term Incentive Plan provides that the exercise price of stock options and SARs granted thereunder must at least be equal to the fair market value of our common stock on the date of grant. The Committee determines the terms and conditions of exercise of stock options and SARs, including the methods of payment of the exercise price of a stock option, which may include payment in cash, shares or cash equivalents. The 2013 Long Term Incentive Plan also provides that after the termination of service, a participant may exercise his or her stock options or SARs for up to 90 days following termination (one year in the case of death or disability) or such other period specified by the Committee; provided, however, that if the termination is a result of termination by us for cause (as defined in the 2013 Long Term Incentive Plan), the stock option or SAR will expire immediately on the termination date.
The 2013 Long Term Incentive Plan provides that, except as approved by our stockholders, the exercise price of a stock option and or SAR granted under the 2013 Long Term Incentive Plan may not be reduced after the date of grant, an outstanding stock option or SAR may not be surrendered to us as consideration for the grant of a replacement stock option or SAR with a lower exercise price or a full value award and a stock option or SAR may not be surrendered to us in consideration for a cash payment if, at the time of the surrender, the exercise price exceeds the fair market value of a share of our common stock. The foregoing restrictions do not apply to adjustments made pursuant a corporate transaction as permitted under the 2013 Long Term Incentive Plan.
Full Value Awards
A "full value award" is the grant of a right to receive one or more shares of our common stock in the future (including restricted stock, restricted stock units, deferred stock units, performance stock and performance stock units). Full value awards may be subject to certain terms and conditions, including that they may be granted in consideration of previously performed services or surrender of other compensation, contingent on achievement of performance or other objectives during a specified time (including completion of a period of service), or subject to a substantial risk of forfeiture or other restrictions. The Committee may determine other terms and conditions applicable to full value awards.
113
Except for (a) awards granted in lieu of other compensation, or (b) awards that are a form of payment of earned performance awards or other incentive compensation, if (i) an employee's right to become vested in a full value award is conditioned on the completion of a specified period of service with us or one of our affiliates, without achievement of performance targets or other performance objectives (whether or not related to performance criteria) being required as a condition of vesting, then the required period of service for full vesting shall be not less than three years and (ii) if an employee's right to become vested in a full value award is conditioned upon the achievement of performance targets or other performance objectives (whether or not related to performance criteria) being required as a condition of vesting, then the required vesting period shall be at least one year, subject, to the extent provided by the Committee, to pro rated vesting over the course of such three or one year period, as applicable, and to acceleration of vesting in the event of the participant's death, disability, involuntary termination, retirement or in connection with a change in control.
Cash Incentive Awards
A "cash incentive award" is the grant of a right to receive a payment of cash (or in the discretion of the Committee, shares of our common stock having value equivalent to the cash otherwise payable) that is contingent on achievement of performance objectives over a specified period established by the Committee. The grant of cash incentive awards may also be subject to such other conditions, restrictions and contingencies, as determined by the Committee, including provisions relating to deferred payment.
Performance-Based Compensation
We anticipate that, for a period of time following the initial public offering, grants of awards under the 2013 Long Term Incentive Plan will be exempt from the requirements of section 162(m) of the Code (which limits a public company's deduction for non-performance-based compensation to certain of its executives) pursuant to transition rules applicable under section 162(m) of the Code. The 2013 Long Term Incentive Plan, however, includes provisions that are intended to satisfy the Performance-Based Compensation requirements of section 162(m) of the Code from and after the effective date of the 2013 Long Term Incentive Plan. The following describes these provisions.
Generally, we expect that any compensation payable in connection with exercises of stock options or the exercise or settlement of SARs under the 2013 Long Term Incentive Plan will qualify as Performance-Based Compensation although we reserve the right to grant stock options or SARs that do not qualify as Performance-Based Compensation.
Full value awards and cash incentive awards granted under the 2013 Long Term Incentive Plan may be designated and structured as Performance-Based Compensation although we reserve the right to grant full value awards and cash incentive awards that do not qualify as Performance-Based Compensation. Any full value award or cash incentive award that is intended to be Performance-Based Compensation once the section 162(m) transition period does not apply must be conditioned on the achievement of one or more performance targets as determined by the Committee, which performance targets will be based on one or more of the following performance criteria:
(i) earnings including operating income, net operating income, earnings before or after taxes, earnings before or after interest, depreciation, amortization, or extraordinary or special items or book value per share (which may exclude nonrecurring items) or net earnings; (ii) pre-tax income or after-tax income; (iii) earnings per share (basic or diluted); (iv) operating profit; (v) revenue, revenue growth or rate of revenue growth; (vi) return on assets (gross or net), return on investment (including cash flow return on investment), return on capital (including return on total capital or return on invested capital), or return on equity; (vii) returns on sales or revenues; (viii) operating expenses; (ix) stock price appreciation; (x) cash flow (before or after dividends), free cash flow, cash flow return on investment (discounted or otherwise), net cash provided by
114
operations, cash flow in excess of cost of capital or cash flow per share (before or after dividends); (xi) implementation or completion of critical projects or processes; (xii) economic value created; (xiii) cumulative earnings per share growth; (xiv) operating margin or profit margin; (xv) stock price or total stockholder return; (xvi) cost targets, reductions and savings, productivity and efficiencies; (xvii) strategic business criteria, consisting of one or more objectives based on meeting specified market penetration, geographic business expansion, customer satisfaction, employee satisfaction, human resources management, supervision of litigation and other legal matters, information technology, and goals relating to contributions, dispositions, acquisitions, development and development related activity, capital markets activity and credit ratings, joint ventures and other private capital activity including generating incentive and other fees and raising equity commitments, and other transactions, and budget comparisons; (xviii) personal professional objectives, including any of the foregoing performance targets, the implementation of policies and plans, the negotiation of transactions, the development of long term business goals, formation and reorganization of joint ventures and other private capital activity including generating incentive and other fees and raising equity commitments, research or development collaborations, and the completion of other corporate transactions; (xix) economic value added (or an equivalent metric); (xx) stock price performance; (xxi) improvement in or attainment of expense levels or working capital levels; (xxii) operating metrics including projects added, construction value added, active projects and number of organizations, or (xxiii) any combination of, or a specified increase in, any of the foregoing.
Where applicable, the performance targets may be expressed in terms of attaining a specified level of the particular criteria or the attainment of a percentage increase or decrease in the particular criteria, and may be applied to one or more of us, a related company, or one of our divisions or strategic business units, or may be applied to our performance relative to a market index, a group of other companies or a combination thereof, all as determined by the Committee. The performance targets may include a threshold level of performance below which no payment will be made (or no vesting will occur), levels of performance at which specified payments will be made (or specified vesting will occur), and a maximum level of performance above which no additional payment will be made (or at which full vesting will occur). Each of the foregoing performance targets shall be determined in accordance with generally accepted accounting principles, if applicable, and shall be subject to certification by the Committee; provided that the Committee shall have the authority to exclude the impact of charges for restructurings, discontinued operations, extraordinary items and other unusual or non-recurring events, the cumulative effects of tax or accounting principles and identified in financial statements, notes to financial statements, management's discussion and analysis or other SEC filings and items that may not be infrequent or unusual but which may have inconsistent effects on performance and which are in accordance with applicable disclosure requirements under Regulation G issued under the Sarbanes-Oxley Act of 2002.
Non-Transferability
Awards under the 2013 Long Term Incentive Plan are not transferable except as designated by the participant by will or by the laws of descent and distribution or, if provided by the Committee, pursuant to a qualified domestic relations order (within the meaning of the Code and applicable rules thereunder). To the extent that a participant who receives an award under the 2013 Long Term Incentive Plan has the right to exercise such award, the award may be exercised during the lifetime of the participant only by the participant. The Committee may provide that awards may be transferred to or for the benefit of the participant's family (including, without limitation, to a trust or partnership for the benefit of a participant's family), subject to such procedures as the Committee may establish.
115
Change in Control
The terms and conditions of an award in the event of a change in control are to be specified by the Committee at the time of grant or otherwise in accordance with the terms of the 2013 Long Term Incentive Plan.
Amendment and Termination
Our board of directors may, at any time, amend or terminate the 2013 Long Term Incentive Plan, and the board or the Committee may amend any award; provided, however, that no amendment or termination (other than adjustments in connection with a corporate transaction or restructuring) may, in the absence of written consent to the change by the affected participant (or, if the participant is not then living, the participant's affected beneficiary), adversely affect the rights of any participant or beneficiary under any award granted under the 2013 Long Term Incentive Plan prior to the date such amendment is adopted by the board of directors (or the Committee, if applicable) and no amendment may be made to the anti-repricing provisions of the 2013 Long Term Incentive Plan relating to stock options and SARs unless the amendment is approved by our stockholders. Stockholder approval of any 2013 Long Term Incentive Plan amendment is also required if stockholder approval is required by law or the rules of any stock exchange on which the common stock is listed.
It is our intention that, to the extent that any provisions of this 2013 Long Term Incentive Plan or any awards granted hereunder are subject to section 409A of the Code, the 2013 Long Term Incentive Plan and the awards comply with the requirements of section 409A of the Code and that the board of directors shall have the authority to amend the 2013 Long Term Incentive Plan as it deems necessary to conform to section 409A. Notwithstanding the foregoing, we do not guarantee that awards under the 2013 Long Term Incentive Plan will comply with section 409A and the Committee is under no obligation to make any changes to any award to cause such compliance.
Director Compensation
Non-employee directors received an annual fee of $22,500 and stock and option awards described below for fiscal 2012, except for Mr. Besio, Marc Parise and Mr. Patterson, who served on the board in fiscal 2012 as designees of Aon plc, First Midwest Bancorp and Northwater Intellectual Property Fund, L.P. 1, respectively, and did not receive any compensation for service on the board. The employee directors received no compensation for their services as directors.
The following table provides information on the compensation of our non-management directors in fiscal 2012.
Director Compensation for Fiscal 2012
Name
|
Fees Earned or Paid in Cash |
Stock Awards(1) |
Option Awards(2) |
Total | |||||||||
|---|---|---|---|---|---|---|---|---|---|---|---|---|---|
Peter de Roetth(3) |
$ | 22,500 | $ | 0 | $ | 233,155 | $ | 255,655 | |||||
H. Patrick Hackett, Jr.(3) |
22,500 | 0 | 9,877 | 32,377 | |||||||||
R. Michael Murray, Jr. |
22,500 | 0 | 36,666 | 59,166 | |||||||||
Robert Wayman |
22,500 | 0 | 90,258 | 112,758 | |||||||||
- (1)
- During fiscal 2012, we awarded 5,404 restricted stock units to Mr. de Roetth, 5,404 restricted stock units to Mr. Hackett, 11,194 restricted stock units to Mr. Murray and 12,158 restricted stock units to Mr. Wayman. The grant date fair value of the restricted stock units was $70,387 for each of Mr. de Roetth and Mr. Hackett, $145,802 for Mr. Murray and $158,358 for Mr. Wayman. However, the restricted stock units were awarded with a contingency that they would not become
116
payable in cash or shares of our stock unless there were a change in control of our company or the agreements were terminated in connection with the completion of an initial public offering. As neither a change in control nor initial public offering was determined to be probable, we had not recognized any share-based compensation expense for these awards until June 2013 in connection with the initial public offering. Accordingly, the amount of compensation reflected in the Stock Awards column in this table is $0. As of September 30, 2012, the following directors owned restricted stock units in the amounts indicated after their names: Mr. de Roetth (5,404), Mr. Hackett (5,404), Mr. Murray (11,194) and Mr. Wayman (12,158).
- (2)
- During
fiscal 2012, we awarded 36,258 stock options to Mr. de Roetth, 1,536 stock options to Mr. Hackett, 5,702 stock options to
Mr. Murray and 14,036 stock options to Mr. Wayman. The grant date fair value of these awards is shown. The assumptions used in determining the grant date fair value of options are
described in Note 13 of our audited consolidated financial statements included elsewhere in this prospectus. As of September 30, 2012, the following directors owned options in the
amounts indicated after their names: Mr. de Roetth (36,258), Mr. Hackett (62,536), Mr. Murray (66,702) and Mr. Wayman (64,036).
- (3)
- Resigned from our board of directors effective November 2012.
The restricted stock units awarded to directors during fiscal 2012 were awarded with a contingency that they would not become payable in cash or shares of our stock, at our option, unless there were a change in control of our company or the agreements are terminated in connection with the completion of an initial public offering. The restricted stock units generally would have vested in full on the first anniversary of the grant date (or termination due to death or disability); however, vesting of the restricted stock units accelerated in full upon termination of the agreements in connection with our initial public offering. The director is entitled to payment with respect to vested restricted stock units twelve months following termination of the agreements in connection with our initial public offering.
The exercise price of the stock options awarded to directors during fiscal 2012 was $13.03 per share, the fair market value of our stock on the grant date, as determined by us. The stock options generally vest in full on the first anniversary of the grant date; vesting of the stock options will accelerate in full upon a change in control or the director's termination of service due to death or disability. The director must be a member of our board of directors on the applicable vesting date in order to vest in the stock options. The stock options expire on the 10th anniversary of the grant date, if not exercised before then.
Our board of directors has adopted the following director compensation plan for our non-employee directors, to be in effect as of the completion of this offering. Each non-employee director will receive an annual cash retainer of $30,000. The chairman of the audit, executive, compensation and nominating and corporate governance committees will receive an additional annual fee of $20,000, $20,000, $10,000 and $7,500, respectively. The other members of those committees will receive an annual fee of $7,500, $10,000, $5,000 and $2,500, respectively. In addition, each non-employee director will receive an annual grant of RSUs with a grant date fair value of $70,000 and an annual grant of stock options with a grant date fair value of $70,000. The equity awards vest one year from their effective grant dates.
117
COMPENSATION COMMITTEE INTERLOCKS AND INSIDER PARTICIPATION
During fiscal 2012, our compensation committee was composed solely of independent directors: Mr. Murray and Mr. Wayman. No member of our compensation committee during fiscal 2012 was an employee or officer or former employee or officer of Textura Corporation. None of our executive officers has served on the board of directors or compensation committee of any other entity that has or has had one or more executive officers who served as a member of our board or its compensation committee during fiscal 2012. Mr. Wayman and trusts established for the benefit of him or his family members participated in various financings of the company during the last three years, including the purchase of $450,000 of convertible debentures in 2010, $250,000 of convertible debentures in 2011 and $500,000 of 10% non-convertible notes in February 2013. See "Certain Relationships and Related Person Transactions."
118
CERTAIN RELATIONSHIPS AND RELATED PERSON TRANSACTIONS
We describe below transactions and series of similar transactions, during our last three years, to which we were a participant or will be a participant, in which:
- •
- the amounts involved exceeded or will exceed $120,000; and
- •
- any of our directors, executive officers, holders of more than 5% of our common stock or any member of their immediate family had or will have a direct or indirect material interest.
First Midwest Bank
In 2007, we purchased property and constructed our headquarters building in Deerfield, Illinois. To finance the purchase and real estate improvements, over the course of 2007 through 2009 we borrowed $11.9 million under a construction loan agreement with First Midwest Bank. The construction agreement was subsequently modified in 2009 and 2011. Under the construction loan agreement, as currently modified, our outstanding principal balance was $10,718,575 at September 30, 2012, with interest accruing at 5.5%. In fiscal 2010, we paid principal and interest under the loan of $224,550 and $671,912, respectively. In fiscal 2011, we paid principal and interest under the loan of $196,750 and $524,340, respectively. In fiscal 2012, we paid principal and interest under the loan of $500,000 and $625,262, respectively. Under the terms of the construction loan agreement, principal of $250,000 is due each February and August, until the loan matures in August 2016, at which time outstanding principal of $8,718,575 will become due. The agreement includes a debt service covenant requiring us to maintain certain debt service coverage ratios, and an equity issuance covenant that requires lender consent for certain future equity issuances. We did not satisfy the debt service covenant in fiscal 2012, and compliance with such covenant and any related default was waived by First Midwest Bank until December 31, 2013.
In connection with the modification to the construction loan agreement in 2011, we also issued warrants to First Midwest Bank to purchase 20,000 shares of our common stock. As of August 31, 2013, First Midwest Bancorp, Inc., an affiliate of First Midwest Bank, beneficially owned approximately 4.7% of our outstanding common stock. See "Principal and Selling Stockholders."
Aon Risk Services
In 2009, we entered into a referral agreement with Aon Risk Services Central, Inc. ("ARSC"), which is an affiliate of one of our investors. Such agreement compensates ARSC for customer referrals based on revenues we generate related to those customers. A warrant to purchase 20,000 shares of our common stock was issued pursuant to the referral agreement in the year ended September 30, 2010. We are obligated under the referral agreement to issue to ARSC warrants to purchase up to an additional 207,500 shares of common stock based on the achievement of various milestones. In addition, in 2010, we and ARSC entered into a service agreement, pursuant to which we were paid $1,000,000 in advance for software development services to improve ARSC's software. This payment was deferred and recognized as revenue as development services were provided. The deferred revenue balance accrues interest and is increased by a portion of the referral fees due to ARSC; the remainder of the referral fees due is paid in cash. The deferred revenue balance was $538,000 and $655,000 as of September 30, 2011 and September 30, 2012, respectively. We also provide hosting services to ARSC for a fixed annual fee of less than $120,000. As of August 31, 2013, Aon Risk Services Companies, Inc., an affiliate of ARSC, beneficially owned approximately 4.0% of our outstanding common stock. See "Principal and Selling Stockholders." Each of Aon Risk Services Companies, Inc. and ARSC is a subsidiary of Aon plc.
119
Convertible Debentures Financings
Certain of our directors and 5% stockholders participated in our convertible debenture financings. See Note 7 of the accompanying notes to our audited consolidated financial statements included elsewhere in this prospectus for a description of such financings. The following table summarizes the principal amount of convertible debentures and attached warrants purchased by each of our directors and 5% stockholders in connection with such financings and, in the case of the 2010 convertible debentures, the number of additional warrants issued upon the mandatory conversion of such convertible debentures in fiscal 2011. All such convertible debentures and accrued interest thereon not previously converted at the option of the holders were converted into shares of common stock in connection with our initial public offering.
| |
2010 Convertible Debentures |
2011 Convertible Debentures |
||||||||||||||
|---|---|---|---|---|---|---|---|---|---|---|---|---|---|---|---|---|
Name
|
Principal Amount |
Attached Warrants |
Warrants Issued Upon Conversion |
Principal Amount |
Attached Warrants |
|||||||||||
Affiliates of Northwater Capital Inc. |
$ | 2,000,000 | 75,472 | 6,170 | $ | 11,284,848 | 250,826 | |||||||||
Peter de Roetth, affiliates and family members |
409,929 | 15,470 | 1,108 | 228,808 | 5,084 | |||||||||||
H. Patrick Hackett, Jr. and affiliates |
250,000 | 9,434 | 560 | 1,253,211 | 27,854 | |||||||||||
R. Michael Murray, Jr. and affiliates |
765,000 | 28,868 | 2,292 | — | — | |||||||||||
Robert P. Wayman and affiliates |
450,000 | 16,980 | 1,068 | 250,000 | 5,556 | |||||||||||
Non-Convertible Debt Private Placement
Certain of our directors and 5% stockholders participated in our private placement of 10% unsecured non-convertible notes due 2016. See Note 5 of the accompanying notes to our unaudited condensed consolidated financial statements included elsewhere in the prospectus for a description of such private placement. The following table summarizes the principal amount of notes purchased by each of our directors and 5% stockholders in connection with such private placement and the number of warrants to purchase our common stock issued in connection with such purchase. All of the notes were repaid with the proceeds of our initial public offering.
Name
|
Principal Amount |
Warrants | |||||
|---|---|---|---|---|---|---|---|
An affiliate of Northwater Capital Inc. |
$ | 2,000,000 | 25,600 | ||||
The David C. Habiger Trust |
1,000,000 | 12,800 | |||||
The Wayman Family Trust |
500,000 | 6,400 | |||||
Submittal Exchange Acquisition
On November 7, 2011, one of our subsidiaries, Submittal Exchange Holdings, LLC ("Submittal Exchange Holdings"), acquired all of the issued and outstanding membership units of Submittal Exchange, LLC ("Submittal Exchange"). In connection with the acquisition, former owners of Submittal Exchange received Class A Preferred Units of Submittal Exchange Holdings in exchange for their membership units of Submittal Exchange. Matt Ostanik, a founder of Submittal Exchange and a current officer of our company, received a total of 329,911 Class A Preferred Units of Submittal Exchange Holdings in exchange for his units of Submittal Exchange. Upon completion of our initial public offering, all of the Class A Preferred Units were automatically converted into 659,822 shares of common stock. See Note 3 to our audited consolidated financial statements included elsewhere in this prospectus for more information.
Policies and Procedures for Related Person Transactions
Our board of directors has adopted a written related person policy to set forth the policies and procedures for the review and approval or ratification of related person transactions. This policy covers any transaction, arrangement or relationship, or any series of similar transactions, arrangements or relationships in which we are to be a participant, the amount involved exceeds $100,000 and a related person had or will have a direct or indirect material interest, including purchases of goods or services by or from the related person or entities in which the related person has a material interest, indebtedness, guarantees of indebtedness and employment by us of a related person.
120
PRINCIPAL AND SELLING STOCKHOLDERS
The following table sets forth certain information with respect to the beneficial ownership of our common stock as of August 31, 2013, and as adjusted to reflect the sale of common stock offered in this offering, for:
- •
- each person known by us to be the beneficial owner of more than five percent of any class of our voting securities;
- •
- each of our named executive officers;
- •
- each of our directors;
- •
- all of our directors and executive officers as a group; and
- •
- all selling stockholders.
We have based our calculation of beneficial ownership prior to the offering on 22,798,588 shares of common stock outstanding on August 31, 2013. We have based our calculation of beneficial ownership after the offering on 23,798,588 shares of common stock outstanding immediately after completion of this offering, which gives effect to the issuance of 1,000,000 shares of common stock offered by us in this offering.
We have determined beneficial ownership in accordance with the rules of the SEC, and thus it represents sole or shared voting or investment power with respect to our securities. Unless otherwise indicated below, to our knowledge, the persons and entities named in the table have sole voting and sole investment power with respect to all shares that they beneficially own. We have deemed shares of our common stock subject to warrants and options that are currently exercisable or exercisable within 60 days of August 31, 2013 to be outstanding and to be beneficially owned by the person holding the warrant or
121
option for the purpose of computing the percentage ownership of that person, but have not treated them as outstanding for the purpose of computing the percentage ownership of any other person.
| |
Before the Offering | |
After the Offering | |||||||||||||
|---|---|---|---|---|---|---|---|---|---|---|---|---|---|---|---|---|
Name of Beneficial Owner
|
Number of Shares Beneficially Owned |
Percentage of All Shares |
Number of Shares Being Offered |
Number of Shares Beneficially Owned |
Percentage of All Shares |
|||||||||||
Greater Than 5% Stockholders |
||||||||||||||||
Northwater Capital Inc. and affiliated funds(1) |
4,874,412 | 21.0 | % | — | 4,874,412 | % | ||||||||||
Named Executive Officers and Directors |
||||||||||||||||
Patrick J. Allin(2) |
1,474,871 | 6.3 | % | % | ||||||||||||
Howard Niden(3) |
145,929 | * | ||||||||||||||
Jillian Sheehan(4) |
119,287 | * | * | |||||||||||||
Gregory J. Besio |
— | * | — | * | ||||||||||||
Matthew J. Botica(5) |
85,138 | * | * | |||||||||||||
Edward K. Chandler(6) |
119,616 | * | * | |||||||||||||
David Habiger(7) |
12,800 | * | * | |||||||||||||
R. Michael Murray, Jr.(8) |
368,254 | 1.6 | % | % | ||||||||||||
General Peter Pace |
— | — | * | |||||||||||||
David G. Patterson(9) |
4,874,412 | 21.0 | % | * | ||||||||||||
Robert P. Wayman(10) |
303,419 | 1.3 | % | % | ||||||||||||
All Directors and Executive Officers as a Group (18 persons)(11) |
9,435,682 |
37.9 |
% |
% |
||||||||||||
Other Selling Stockholders: |
||||||||||||||||
|
||||||||||||||||
|
||||||||||||||||
|
||||||||||||||||
- *
- Represents
less than 1.0%.
- (1)
- Includes
147,202 shares of common stock owned by Northwater Capital Inc.; 2,711,413 shares of common stock owned by Northwater Intellectual
Property Fund LP 1; 633,146 shares of common stock owned by Northwater Intellectual Property Fund 2; 924,537 shares of common stock owned by Northwater Intellectual
Property Fund LP 3A; warrants to purchase 37,018 shares of common stock owned by Northwater Capital Inc.; warrants to purchase 214,724 shares of common stock owned
by Northwater Intellectual Property Fund LP 2; and warrants to purchase 206,372 shares of common stock owned by Northwater Intellectual Property Fund LP 3A.
Northwater Intellectual Property Fund LP 1, Northwater Intellectual Property Fund LP 2 and Northwater Intellectual Property Fund LP 3A (the "Northwater
Funds") are investment funds managed by Northwater Capital Management Inc., a registered investment advisor and a wholly owned subsidiary of Northwater Capital Inc.
- (2)
- Includes
247,206 shares of common stock owned by Mr. Allin; 258,000 shares of common stock owned by trusts of which Mr. Allin or
a member of his family are trustees; 411,814 shares of common stock owned by a family limited liability company controlled by Mr. Allin; and options to purchase 557,851 shares of
common stock. Of the foregoing shares, Mr. Allin disclaims beneficial ownership of 40,000 shares of common stock owned by a trust of which a family member is the trustee.
- (3)
- Includes
54,629 shares of common stock; warrants to purchase 1,334 shares of common stock; and options to purchase 89,966 shares of
common stock.
- (4)
- Consists
of options to purchase 119,287 shares of common stock.
- (5)
- Includes 79,694 shares of common stock, and warrants to purchase 5,444 shares of common stock owned by a trust of which Mr. Botica serves as trustee.
122
- (6)
- Includes
23,923 shares of common stock owned by Mr. Chandler and 95,693 shares of common stock owned by Longboat Partners, a
partnership controlled by Mr. Chandler.
- (7)
- Consists
of warrants to purchase 12,800 shares of common stock.
- (8)
- Includes
105,015 shares of common stock and warrants to purchase 13,508 shares of common stock owned by Mr. Murray; and
161,809 shares of common stock and warrants to purchase 21,220 shares of common stock owned by family limited partnerships controlled by Mr. Murray; and options to purchase
66,702 shares of common stock.
- (9)
- Includes
all of the shares of common stock and warrants to purchase shares of common stock owned by Northwater Capital Inc. and the Northwater Funds
that are described in Footnote 1. Mr. Patterson is the president of Northwater Capital Inc. and exercises investment and voting control over all of the shares owned by Northwater Capital
Inc. and the Northwater Funds.
- (10)
- Includes
40,388 shares of common stock owned by Mr. Wayman and 151,451 shares of common stock and warrants to purchase
47,544 shares of common stock owned by a trust of which Mr. Wayman is trustee; and options to purchase 64,036 shares of common stock.
- (11)
- Includes 7,360,682 shares of common stock; warrants to purchase 596,984 shares of common stock; and options to purchase 1,478,016 shares of common stock.
123
General
The following descriptions of our common stock and preferred stock and certain provisions of our restated certificate of incorporation, as amended, and our amended and restated bylaws are summaries and are qualified by reference to our restated certificate of incorporation, as amended, and our amended and restated bylaws. For more detailed information, please see copies of these documents, which are filed with the SEC as exhibits to the registration statement of which this prospectus is a part. We refer in this section to our restated certificate of incorporation, as amended, as our certificate of incorporation, and we refer to our amended and restated bylaws as our bylaws.
Our authorized capital stock consists of 100,000,000 shares with a par value of $0.001 per share, of which:
- •
- 90,000,000 shares are designated as common stock, and
- •
- 10,000,000 shares are designated as preferred stock.
As of June 30, 2013, there were outstanding:
- •
- 22,798,588 shares of common stock, held of record by approximately stockholders;
- •
- 696,384 shares of common stock issuable upon settlement of restricted stock units outstanding as of June 30,
2013;
- •
- 3,428,601 shares of common stock issuable upon the exercise of stock options outstanding as of June 30,
2013, with a weighted average exercise price of approximately $14.14 per share; and
- •
- 1,332,593 shares of common stock issuable upon the exercise of warrants to purchase common stock outstanding as of June 30, 2013, with a weighted average exercise price of approximately $14.71 per share.
Common Stock
The holders of our common stock are entitled to one vote per share on all matters to be voted on by the stockholders. Subject to preferences that may be applicable to any outstanding shares of preferred stock, holders of common stock are entitled to receive ratably such dividends as may be declared by our board of directors out of funds legally available for such purpose. In the event we liquidate, dissolve or wind up, holders of common stock are entitled to share ratably in all assets remaining after payment of liabilities and the liquidation preferences of any outstanding shares of preferred stock. Holders of common stock have no preemptive, conversion or subscription rights. There are no redemption or sinking fund provisions applicable to the common stock.
Preferred Stock
There are no shares of our preferred stock outstanding. Our board of directors may, without further action by our stockholders, fix the designations, powers, preferences and rights of up to an aggregate of 10,000,000 shares of preferred stock in one or more series and authorize their issuance. These powers, preferences and rights could include dividend rights, conversion rights, voting rights, terms of redemption and liquidation preferences, any or all of which may be greater than the rights of our common stock. Any issuance of our preferred stock could adversely affect the voting power of holders of our common stock and the likelihood that such holders would receive dividend payments and payments upon liquidation. In addition, the issuance of preferred stock could have the effect of delaying, deterring or preventing a change in control or other corporate action. Upon the closing of this offering, no shares of preferred stock will be outstanding, and we have no present plan to issue any shares of preferred stock.
124
Warrants
As of June 30, 2013, we had outstanding warrants to purchase 1,332,593 shares of common stock at a weighted average exercise price of $14.71 per share.
Convertible Debenture Financing Warrants
We issued $38,236,841 in aggregate principal amount convertible debentures with detachable warrants to purchase common stock in connection with three separate financing rounds beginning in November 2008. These financing rounds, and the warrants issued in connection with each round, are listed below. None of the warrants issued in connection with these financing rounds have been exercised and all are currently exercisable, except for those warrants issued to purchasers of the 2011 convertible debentures which become exercisable 180 days after the date of the closing of our initial public offering.
2009 Convertible Debentures
An aggregate of 370,425 warrants was issued to the purchasers of the 2009 convertible debentures. These warrants have an exercise price of $16.26 per share and expire on dates ranging from to .
2010 Convertible Debentures
An aggregate of 430,581 warrants was issued to the purchasers of the 2010 convertible debentures. These warrants have an exercise price of $13.25 per share and expire on March 31, 2020.
2011 Convertible Debentures
An aggregate of 381,187 warrants was issued to the purchasers of the 2011 convertible debentures. These warrants have an exercise price of $15.00 per share and expire on September 15, 2021.
Non-Convertible Debt Warrants
We issued $6,750,000 in aggregate principal amount of unsecured non-convertible promissory notes in the second quarter of fiscal 2013. In connection with the issuance of these notes, we issued an aggregate of 86,400 warrants to purchase common stock. The warrants have an exercise price equal to $13.92 and expire on January 21, 2018. These warrants become exercisable 180 days after the date of closing of our initial public offering.
Other Warrants
Warrants to Purchase Common Stock
We have issued a total of 64,000 other warrants to purchase common stock that remain outstanding as of June 30, 2013. These warrants were issued in connection with other financings or to customers or service providers. These warrants have a weighted average exercise price of $13.47 and expire from November 2014 to August 2021. Of these 64,000 warrants to purchase common stock, 44,000 are currently exercisable and 20,000 become exercisable 180 days after the date of the closing of our initial public offering.
Anti-Takeover Provisions
Certificate of Incorporation and Bylaws. Certain provisions of Delaware law, our certificate of incorporation and our bylaws contain provisions that could have the effect of delaying, deferring or discouraging another party from acquiring control of us. These provisions, which are summarized
125
below, may have the effect of discouraging coercive takeover practices and inadequate takeover bids. These provisions are also designed, in part, to encourage persons seeking to acquire control of us to first negotiate with our board of directors. We believe that the benefits of increased protection of our potential ability to negotiate with an unfriendly or unsolicited acquiror outweigh the disadvantages of discouraging a proposal to acquire us because negotiation of these proposals could result in an improvement of their terms.
Board Composition and Filling Vacancies. Our certificate of incorporation provides for the division of our board of directors into three classes serving staggered three-year terms, with one class being elected each year. Our certificate of incorporation also provides that directors may be removed only for cause. Furthermore, any vacancy on our board of directors, however occurring, including a vacancy resulting from an increase in the size of our board, may only be filled by the affirmative vote of a majority of our directors then in office, even if less than a quorum. The classification of directors, together with the limitations on removal of directors and treatment of vacancies, has the effect of making it more difficult for stockholders to change the composition of our board of directors.
Undesignated Preferred Stock. Our certificate of incorporation provides for 10,000,000 authorized shares of preferred stock. The existence of authorized but unissued shares of preferred stock may enable our board of directors to render more difficult or to discourage an attempt to obtain control of us by means of a merger, tender offer, proxy contest or otherwise and may have the effect of delaying, deterring or preventing a change in control of us. For example, if in the due exercise of its fiduciary obligations, our board of directors were to determine that a takeover proposal is not in the best interests of our stockholders, our board of directors could cause shares of preferred stock to be issued without stockholder approval in one or more private offerings or other transactions that might dilute the voting or other rights of the proposed acquiror or insurgent stockholder or stockholder group. In this regard, our certificate of incorporation grants our board of directors broad power to establish the rights and preferences of authorized and unissued shares of preferred stock. The issuance of shares of preferred stock could decrease the amount of earnings and assets available for distribution to holders of shares of common stock. The issuance may also adversely affect the rights and powers, including voting rights, of these holders and may have the effect of delaying, deterring or preventing a change in control of us.
No Written Consent of Stockholders. Our certificate of incorporation provides that all stockholder actions are required to be taken by a vote of the stockholders at an annual or special meeting, and that stockholders may not take any action by written consent in lieu of a meeting. This limitation may lengthen the amount of time required to take stockholder actions and would prevent the amendment of our bylaws or removal of directors by our stockholders without holding a meeting of stockholders.
Requirements for advance notification of stockholder nominations and proposals. Our bylaws establish advance notice procedures with respect to stockholder proposals relating to the nomination of candidates for election as directors or new business to be brought before meetings of our stockholders. These procedures provide that notice of stockholder proposals must be timely given in writing to our corporate secretary prior to the meeting at which the action is to be taken. Generally, to be timely, notice must be received at our principal executive office not less than 90 days nor more than 120 days prior to the first anniversary date of the annual meeting the preceding year. As a result, our bylaws may have the effect of precluding the conduct of certain business at a meeting if the proper procedures are not followed. These provisions may also discourage or deter a potential acquiror from conducting a solicitation of proxies to elect the acquiror's own slate of directors or otherwise attempting to obtain control of our company.
Section 203 of the Delaware General Corporation Law. We are subject to the provisions of Section 203 of the Delaware General Corporation Law. In general, Section 203 prohibits a publicly held Delaware corporation from engaging in a "business combination" with an "interested stockholder"
126
for a three-year period following the time that this stockholder becomes an interested stockholder, unless the business combination is approved in a prescribed manner. Under Section 203, a business combination between a corporation and an interested stockholder is prohibited unless it satisfies one of the following conditions:
- •
- before the stockholder became interested, the board of directors of the corporation approved either the business
combination or the transaction which resulted in the stockholder becoming an interested stockholder;
- •
- upon consummation of the transaction which resulted in the stockholder becoming an interested stockholder, the interested
stockholder owned at least 85% of the voting stock of the corporation outstanding at the time the transaction commenced, excluding for purposes of determining the voting stock outstanding, shares
owned by persons who are directors and also officers, and employee stock plans, in some instances, but not the outstanding voting stock owned by the interested stockholder; or
- •
- at or after the time the stockholder became interested, the business combination was approved by the board of directors of the corporation and authorized at an annual or special meeting of the stockholders by the affirmative vote of at least 662/3% of the outstanding voting stock which is not owned by the interested stockholder.
Section 203 defines a business combination to include:
- •
- any merger or consolidation involving the corporation and the interested stockholder;
- •
- any sale, transfer, lease, pledge or other disposition involving the interested stockholder of 10% or more of the assets
of the corporation;
- •
- subject to exceptions, any transaction that results in the issuance or transfer by the corporation of any stock of the
corporation to the interested stockholder;
- •
- subject to exceptions, any transaction involving the corporation that has the effect of increasing the proportionate share
of the stock of any class or series of the corporation beneficially owned by the interested stockholder; and
- •
- the receipt by the interested stockholder of the benefit of any loans, advances, guarantees, pledges or other financial benefits provided by or through the corporation.
In general, Section 203 defines an interested stockholder as any entity or person beneficially owning 15% or more of the outstanding voting stock of the corporation and any entity or person affiliated with or controlling or controlled by the entity or person.
Amendments to Certificate of Incorporation and Bylaws; Approval of Mergers
Amendments to Certificate of Incorporation and Bylaws. As required by Delaware General Corporation Law and our certificate of incorporation, any amendment of our certificate of incorporation must first be approved by a majority of our board of directors, and must thereafter be approved by a majority of the outstanding shares entitled to vote on the amendment and a majority of the outstanding shares of each class entitled to vote thereon as a class, except that the amendment of the provisions relating to board composition and filling vacancies, action by written consent of stockholders, calling of special meetings, choice of forum and the amendment of our certificate of incorporation must be approved by not less than 662/3% of the outstanding shares entitled to vote on the amendment. Our bylaws may be amended by the affirmative vote of a majority of the directors then in office, subject to any limitations set forth in the bylaws; and may also be amended by the affirmative vote of a majority of the outstanding shares entitled to vote on the amendment.
127
Approval of Mergers. Our certificate of incorporation provides that any merger requiring approval by stockholders under Delaware General Corporation Law must be approved by not less than 662/3% of the outstanding shares entitled to vote on the approval of any such merger.
Venue
Our certificate of incorporation provides that, unless we consent in writing to the selection of an alternative forum, the Court of Chancery of the State of Delaware will, to the fullest extent permitted by applicable law, be the sole and exclusive forum for any stockholder to bring (i) any derivative action or proceeding brought on behalf of our company, (ii) any action asserting a claim of breach of a fiduciary duty owed by, or other wrongdoing by, any director, officer or other employee of our company to our company or our stockholders, (iii) any action asserting a claim against our company or its directors, officers or employees arising pursuant to any provision of the Delaware General Corporation Law or our certificate of incorporation or bylaws, (iv) any action to interpret, apply, enforce or determine the validity of our certificate of incorporation or bylaws or (v) any action asserting a claim against our company or our directors, officers or employees governed by the internal affairs doctrine, except for, as to each of (i) through (v) above, any claim (A) as to which the Court of Chancery determines that there is an indispensable party not subject to the jurisdiction of the Court of Chancery, (B) which is vested in the exclusive jurisdiction of a court or forum other than the Court of Chancery or (C) for which the Court of Chancery does not have subject matter jurisdiction. Any person or entity purchasing or otherwise acquiring any interest in shares of capital stock of our company is deemed to have received notice of and consented to the foregoing provision. The enforceability of similar choice of forum provisions in other companies' charters has been challenged in legal proceedings, and it is possible that a court could find these types of provisions to be inapplicable or unenforceable.
Transfer Agent and Registrar
The transfer agent and registrar for our common stock is Computershare Trust Company, N.A.
Listing
Our common stock is listed on the New York Stock Exchange under the trading symbol "TXTR."
128
SHARES ELIGIBLE FOR FUTURE SALE
Future sales of substantial amounts of shares of our common stock, including shares issued upon the exercise of outstanding options and warrants, in the public market after this offering, or the possibility of these sales occurring, could cause the prevailing market price for our common stock to fall or impair our ability to raise equity capital in the future.
Based on the number of shares outstanding on June 30, 2013, and assuming no exercise of outstanding stock options or warrants subsequent to June 30, 2013, upon the completion of this offering a total of shares of common stock will be outstanding. Of these shares, the 5,750,000 shares of common stock sold in our initial public offering, all shares of common stock sold in this offering, plus any shares sold upon exercise of the underwriters' option to purchase additional shares, will be freely tradable in the public market without restriction or further registration under the Securities Act, unless these shares are held by "affiliates," as that term is defined in Rule 144 under the Securities Act.
The remaining shares of common stock will be "restricted securities," as that term is defined in Rule 144 under the Securities Act. These restricted securities are eligible for public sale only if they are registered under the Securities Act or if they qualify for an exemption from registration under Rules 144 or 701 under the Securities Act, which are summarized below.
Subject to the lock-up agreements entered into in connection with this offering and previously entered into in connection with our initial public offering described under "Underwriting," to the extent applicable, and the provisions of Rules 144 and 701 under the Securities Act, these restricted securities will be available for sale in the public market at various times after the date of this prospectus.
In addition, of the shares of our common stock that were subject to stock options outstanding as of June 30, 2013, options to purchase shares of common stock were vested as of June 30, 2013 and will be eligible for sale subject, to the extent applicable, to the lock-up agreements described under "Underwriting." Any shares of common stock issued upon exercise of the warrants to purchase 1,332,593 shares of common stock outstanding as of June 30, 2013 will be eligible for sale subject to the provision of Rule 144 and, to the extent applicable, the lock-up agreements described under "Underwriting."
Rule 144
In general, under Rule 144, beginning 90 days after the date of our initial public offering, a person who is not our affiliate and has not been our affiliate at any time during the preceding three months will be entitled to sell any shares of our common stock that such person has beneficially owned for at least six months, including the holding period of any prior owner other than one of our affiliates, without regard to volume limitations. Sales of our common stock by any such person would be subject to the availability of current public information about us if the shares to be sold were beneficially owned by such person for less than one year.
In addition, under Rule 144, a person may sell shares of our common stock acquired from us immediately upon the closing of this offering, without regard to volume limitations or the availability of public information about us, if:
- •
- the person is not our affiliate and has not been our affiliate at any time during the preceding three months; and
- •
- the person has beneficially owned the shares to be sold for at least one year, including the holding period of any prior owner other than one of our affiliates.
129
Beginning 90 days after the date of our initial public offering, our affiliates who have beneficially owned shares of our common stock for at least six months, including the holding period of any prior owner other than one of our affiliates, would be entitled to sell within any three-month period a number of shares that does not exceed the greater of:
- •
- 1% of the number of shares of our common stock then outstanding, which will equal approximately 238,000 shares immediately
after this offering; and
- •
- the average weekly trading volume in our common stock on the New York Stock Exchange during the four calendar weeks preceding the date of filing of a Notice of Proposed Sale of Securities Pursuant to Rule 144 with respect to the sale.
Sales under Rule 144 by our affiliates are also subject to manner of sale provisions and notice requirements and to the availability of current public information about us.
Rule 701
In general, under Rule 701, any of our employees, consultants or advisors who acquired shares from us in connection with a compensatory stock or option plan or other written agreement in a transaction before the effective date of our initial public offering that was completed in reliance on Rule 701 and complied with the requirements of Rule 701 is, subject to the lock-up restrictions described under "Underwriting," eligible to resell such shares beginning 90 days after the date of our initial public offering in reliance on Rule 144, but without compliance with certain restrictions, including the holding period, contained in Rule 144.
Registration Statements
We filed a registration statement on Form S-8 under the Securities Act covering all of the shares of common stock subject to options outstanding or reserved for issuance under our 2008 Stock Incentive Plan and 2013 Long Term Incentive Plan. However, none of the shares registered on Form S-8 will be eligible for resale until the expiration of the lock-up agreements to which they are subject.
130
MATERIAL U.S. FEDERAL INCOME TAX CONSIDERATIONS FOR NON-U.S. HOLDERS
The following is a summary of the material U.S. federal income tax considerations relating to the purchase, ownership and disposition of our common stock by Non-U.S. Holders (defined below). This summary does not purport to be a complete analysis of all the potential tax considerations relevant to Non-U.S. Holders of our common stock. This summary is based upon the Internal Revenue Code, the Treasury regulations promulgated or proposed thereunder and administrative and judicial interpretations thereof, all as of the date hereof and all of which are subject to change or differing interpretations at any time, possibly with retroactive effect.
This summary assumes that shares of our common stock are held as "capital assets" within the meaning of Section 1221 of the Internal Revenue Code (generally, property held for investment). This summary does not purport to deal with all aspects of U.S. federal income and estate taxation that might be relevant to particular Non-U.S. Holders in light of their particular investment circumstances or status, nor does it address specific tax considerations that may be relevant to particular persons (including, for example, financial institutions, broker-dealers, insurance companies, partnerships or other pass-through entities, certain U.S. expatriates, tax-exempt organizations, pension plans, "controlled foreign corporations," "passive foreign investment companies," corporations that accumulate earnings to avoid U.S. federal income tax, persons in special situations, such as those who have elected to mark securities to market or those who hold common stock as part of a straddle, hedge, conversion transaction, synthetic security or other integrated investment, or holders subject to the alternative minimum tax). In addition, except as explicitly addressed herein with respect to estate tax, this summary does not address estate and gift tax considerations or considerations under the tax laws of any state, local or non-U.S. jurisdiction.
For purposes of this summary, a "Non-U.S. Holder" means a beneficial owner of common stock that for U.S. federal income tax purposes is not treated as a partnership and is not a U.S. Person (defined in the next sentence). A "U.S. Person" for purposes of this summary is:
- •
- an individual who is a citizen or resident of the United States;
- •
- a corporation or any other organization treated as a corporation for U.S. federal income tax purposes, created or
organized in or under the laws of the United States, any state thereof or the District of Columbia;
- •
- an estate, the income of which is included in gross income for U.S. federal income tax purposes regardless of its source;
or
- •
- a trust, if (i) a U.S. court is able to exercise primary supervision over the trust's administration and one or more U.S. persons have the authority to control all of the trust's substantial decisions or (ii) the trust has a valid election in effect under applicable U.S. Treasury regulations to be treated as a U.S. person.
If an entity or arrangement that is classified as a partnership for U.S. federal income tax purposes holds our common stock, the tax treatment of persons treated as its partners for U.S. federal income tax purposes will generally depend upon the status of the partner and the activities of the partnership. Partnerships and other entities that are classified as partnerships for U.S. federal income tax purposes and persons holding our common stock through a partnership or other entity classified as a partnership for U.S. federal income tax purposes are urged to consult their own tax advisors.
There can be no assurance that the Internal Revenue Service (the "IRS") will not challenge one or more of the tax consequences described herein, and we have not obtained, nor do we intend to obtain, a ruling from the IRS with respect to the U.S. federal income or estate tax consequences to a Non-U.S. Holder of the purchase, ownership or disposition of our common stock.
131
THIS SUMMARY IS NOT INTENDED TO BE TAX ADVICE. EACH NON-U.S. HOLDER IS URGED TO CONSULT ITS OWN TAX ADVISOR ABOUT THE U.S. FEDERAL INCOME AND ESTATE TAXATION, STATE, LOCAL AND NON-U.S. TAXATION AND OTHER TAX CONSEQUENCES TO THEM OF THE PURCHASE, OWNERSHIP AND DISPOSITION OF OUR COMMON STOCK.
Distributions on Our Common Stock
As discussed under "Dividend Policy" above, we do not currently expect to pay regular dividends on our common stock. If we do make a distribution of cash or property with respect to our common stock, any such distributions generally will constitute dividends for U.S. federal income tax purposes to the extent of our current and accumulated earnings and profits, as determined under U.S. federal income tax principles. If a distribution exceeds our current and accumulated earnings and profits, the excess will constitute a return of capital and will first reduce the holder's basis in our common stock, but not below zero. Any remaining excess will be treated as capital gain, subject to the tax treatment described below in "—Gain on Sale, Exchange or Other Taxable Disposition of Our Common Stock." Any distribution on our common stock would also be subject to the discussion below in "—Additional Withholding and Information Reporting Requirements."
Dividends paid to a Non-U.S. Holder generally will be subject to withholding of U.S. federal income tax at a 30% rate unless such Non-U.S. Holder qualifies for an exemption from or a reduction in the rate of withholding and provides us or our agent, as the case may be, with the appropriate IRS Form W-8, such as:
- •
- IRS Form W-8BEN (or successor form) certifying, under penalties of perjury, that the Non-U.S. Holder is
entitled to an exemption from or a reduction in the rate of withholding of tax under an applicable income tax treaty, or
- •
- IRS Form W-8ECI (or successor form) certifying, under penalties of perjury, that a dividend paid on common stock is not subject to withholding of tax because it is effectively connected with a trade or business in the United States of the Non-U.S. Holder (in which case such dividend generally will be subject to regular graduated U.S. federal income tax rates as described below).
The certification requirement described above must be provided to us or our agent prior to the payment of dividends and may be required to be updated periodically. This certification also may require a Non-U.S. Holder that provides an IRS form or that claims treaty benefits to provide its U.S. taxpayer identification number. Special certification and other requirements apply in the case of certain Non-U.S. Holders that are intermediaries or pass-through entities for U.S. federal income tax purposes.
Each Non-U.S. Holder is urged to consult its own tax advisor about the specific methods for satisfying these requirements. A claim for exemption will not be valid if the person receiving the applicable form has actual knowledge or reason to know that the statements on the form are false.
If dividends are effectively connected with a trade or business in the United States of a Non-U.S. Holder (and, if required by an applicable income tax treaty, attributable to a permanent establishment maintained by such Non-U.S. Holder in the United States), the Non-U.S. Holder, although exempt from the withholding of tax described above (provided that the certifications described above are satisfied), generally will be subject to U.S. federal income tax on such dividends on a net income basis in the same manner as if it were a resident of the United States. In addition, if a Non-U.S. Holder is treated as a corporation for U.S. federal income tax purposes, the Non-U.S. Holder may be subject to an additional "branch profits tax" equal to 30% (unless reduced by an applicable income treaty) of its earnings and profits in respect of such effectively connected dividend income.
132
If a Non-U.S. Holder is eligible for a reduced rate of U.S. federal withholding tax pursuant to an income tax treaty, the holder may obtain a refund or credit of any excess amount withheld by timely filing an appropriate claim for refund with the IRS.
Gain on Sale, Exchange or Other Taxable Disposition of Our Common Stock
Subject to the discussion below in "—Additional Withholding and Information Reporting Requirements," in general, a Non-U.S. Holder will not be subject to U.S. federal income tax or withholding of tax on gain realized upon such holder's sale, exchange or other taxable disposition of shares of our common stock unless (i) such Non-U.S. Holder is an individual who is present in the United States for 183 days or more in the taxable year of disposition, and certain other conditions are met, (ii) we are or have been a "United States real property holding corporation," as defined in the Internal Revenue Code (a "USRPHC"), at any time within the shorter of the five-year period preceding the disposition and the Non-U.S. Holder's holding period in the shares of our common stock, and certain other requirements are met, or (iii) such gain is effectively connected with the conduct by such Non-U.S. Holder of a trade or business in the United States (and, if required by an applicable income tax treaty, is attributable to a permanent establishment maintained by such Non-U.S. Holder in the United States).
If the first exception applies, the Non-U.S. Holder generally will be subject to U.S. federal income tax at a rate of 30% (or at a reduced rate under an applicable income tax treaty) on the amount by which such Non-U.S. Holder's capital gains allocable to U.S. sources (including gain, if any, realized on a disposition of our common stock) exceed capital losses allocable to U.S. sources during the taxable year of the disposition. If the third exception applies, the Non-U.S. Holder generally will be subject to U.S. federal income tax with respect to such gain on a net income basis in the same manner as if it were a resident of the United States, and a Non-U.S. Holder that is a corporation for U.S. federal income tax purposes may also be subject to a branch profits tax with respect to any earnings and profits attributable to such gain at a rate of 30% (or at a reduced rate under an applicable income tax treaty).
Generally, a corporation is a USRPHC only if the fair market value of its U.S. real property interests (as defined in the Internal Revenue Code) equals or exceeds 50% of the sum of the fair market value of its worldwide real property interests plus its other assets used or held for use in a trade or business. Although there can be no assurance in this regard, we believe that we are not, and do not anticipate becoming, a USRPHC. Even if we are or become a USRPHC, a Non-U.S. Holder would not be subject to U.S. federal income tax on a sale, exchange or other taxable disposition of our common stock by reason of our status as a USRPHC so long as our common stock is "regularly traded on an established securities market" at any time during the calendar year in which the disposition occurs and such Non-U.S. Holder does not own and is not deemed to own (directly, indirectly or constructively) more than 5% of our common stock at any time during the shorter of the five-year period ending on the date of disposition and the holder's holding period. However, no assurance can be provided that our common stock will be regularly traded on an established securities market for purposes of the rules described above. Each Non-U.S. Holder is urged to consult its own tax advisor about the possible consequences to them if we are, or were to become, a USRPHC.
Additional Withholding and Information Reporting Requirements
Sections 1471 through 1474 of the Internal Revenue Code and the regulations thereunder (commonly referred to as "FATCA") impose a 30% withholding tax on U.S. source dividends and gross proceeds from the sale or other disposition of stock or property that is capable of producing U.S. source dividends paid to (i) a foreign financial institution (as defined in Section 1471(d)(4) of the Internal Revenue Code), including where such foreign financial institution is acting as an intermediary, unless such foreign financial institution enters into a reporting agreement with the IRS, or otherwise complies with any obligations resulting from an intergovernmental agreement between the United
133
States and the jurisdiction in which the foreign financial institution is resident, to collect and disclose certain information regarding its U.S. account holders (which, for this purpose, can include certain debt and equity holders of such foreign financial institution as well as the direct and indirect owners of financial accounts maintained by such institution) and satisfies certain other requirements, and (ii) certain other non-U.S. entities unless such an entity provides the payor with information regarding certain direct and indirect U.S. owners of the entity, or certifies that it has no such U.S. owners, and complies with certain other requirements. Under certain phase-in rules, the FATCA withholding rules would apply to certain payments, including dividend payments on our common stock, if any, paid after June 30, 2014, and to payments of gross proceeds from the sale or other dispositions of our common stock paid after December 31, 2016. These new FATCA withholding rules apply regardless of whether a payment would otherwise be exempt from the withholding of tax described above in respect of distributions on and dispositions of our common stock. Each Non-U.S. Holder is urged to consult its own tax advisor about the possible impact of these rules on their investment in our common stock, and the entities through which they hold our common stock, including, without limitation, the process and deadlines for meeting the applicable requirements to prevent the imposition of this 30% withholding of tax under FATCA.
Backup Withholding and Information Reporting
We must report annually to the IRS and to each Non-U.S. Holder the gross amount of the distributions on our common stock paid to the holder and the tax withheld, if any, with respect to the distributions. Pursuant to tax treaties or other agreements, the IRS may make its reports available to tax authorities in the Non-U.S. Holder's country of residence, organization or incorporation.
Non-U.S. Holders may have to comply with specific certification procedures to establish that the holder is not a United States person (as defined in the Internal Revenue Code) in order to avoid backup withholding at the applicable rate, currently 28%, with respect to dividends on our common stock. Dividends paid to Non-U.S. Holders subject to withholding of U.S. federal income tax, as described above in "—Distributions on Our Common Stock," generally will be exempt from U.S. backup withholding.
Information reporting and backup withholding will generally apply to the proceeds of a disposition of our common stock by a Non-U.S. Holder effected by or through the U.S. office of any broker, U.S. or foreign, unless the holder certifies its status as a Non-U.S. Holder and satisfies certain other requirements, or otherwise establishes an exemption. Dispositions effected through a non-U.S. office of a U.S. broker or a non-U.S. broker with substantial U.S. ownership or operations generally will be treated in a manner similar to dispositions effected through a U.S. office of a broker. Each Non-U.S. Holder is urged to consult its own tax advisor about the application of the information reporting and backup withholding rules to them.
Backup withholding is not an additional tax. Any amounts withheld under the backup withholding rules from a payment to a Non-U.S. Holder can be refunded or credited against the Non-U.S. Holder's U.S. federal income tax liability, if any, provided that an appropriate claim is timely filed with the IRS.
Federal Estate Tax
Common stock owned (or treated as owned) by an individual who is not a citizen or a resident of the United States (as defined for U.S. federal estate tax purposes) at the time of death will be included in the individual's gross estate for U.S. federal estate tax purposes, unless an applicable estate or other tax treaty provides otherwise, and, therefore, may be subject to U.S. federal estate tax.
134
Medicare Contributions Tax
A 3.8% tax is imposed on the net investment income (which includes dividends and gains recognized upon of a disposition of stock) of certain individuals, trusts and estates with adjusted gross income in excess of certain thresholds. This tax is imposed on individuals, estates and trusts that are U.S. Persons. The tax is expressly not imposed on nonresident aliens; however, estates and trusts that are not U.S. Persons are not expressly exempted from the tax. Therefore, each Non-U.S. Holder is urged to consult its own tax advisor about the application of this Medicare contribution tax in their particular situations.
135
Under the terms and subject to the conditions contained in an underwriting agreement dated , 2013, we and the selling stockholders have agreed to sell to the underwriters named below, for whom Credit Suisse Securities (USA) LLC and William Blair & Company, L.L.C. are acting as representatives, the following respective numbers of shares of common stock:
Underwriter
|
Number of Shares |
|||
|---|---|---|---|---|
Credit Suisse Securities (USA) LLC |
||||
William Blair & Company, L.L.C. |
||||
JMP Securities LLC |
||||
Oppenheimer & Co. Inc. |
||||
Barrington Research Associates, Inc. |
||||
Total |
4,000,000 | |||
The underwriting agreement provides that the underwriters are obligated to purchase all the shares of common stock in the offering if any are purchased, other than those shares covered by the over-allotment option described below. The underwriting agreement also provides that if an underwriter defaults the purchase commitments of non-defaulting underwriters may be increased or the offering may be terminated.
We have granted to the underwriters a 30-day option to purchase on a pro rata basis up to 600,000 additional shares at the initial public offering price less the underwriting discounts and commissions. The option may be exercised only to cover any over-allotments of common stock.
The underwriters propose to offer the shares of common stock initially at the public offering price on the cover page of this prospectus and to selling group members at that price less a selling concession of $ per share. After the initial public offering the representatives may change the public offering price and concession.
The following table summarizes the compensation and estimated expenses we and the selling stockholders will pay:
| |
Per Share | Total | |||||||||||
|---|---|---|---|---|---|---|---|---|---|---|---|---|---|
| |
Without Over-allotment |
With Over-allotment |
Without Over-allotment |
With Over-allotment |
|||||||||
Underwriting Discounts and Commissions paid by us |
$ | $ | $ | $ | |||||||||
Expenses payable by us |
$ | $ | $ | $ | |||||||||
Underwriting Discounts and Commissions paid by the selling stockholders |
|||||||||||||
Expenses payable by the selling stockholders |
|||||||||||||
The underwriters have agreed to reimburse us for certain expenses in connection with this offering. We have agreed to reimburse the underwriters for certain of their expenses in an amount up to $ .
Solebury Capital LLC ("Solebury"), a FINRA member, is acting as our financial advisor in connection with the offering. We expect to pay Solebury, upon the successful completion of this offering, a fee of $225,000 for its services. We have also agreed to reimburse Solebury for certain expenses incurred in connection with the engagement of up to $15,000. Solebury is not acting as an underwriter and will not sell or offer to sell any securities and will not identify, solicit or engage directly with potential investors. In addition, Solebury will not underwrite or purchase any of the offered securities or otherwise participate in any such undertaking.
We have agreed that we will not offer, sell, contract to sell, pledge or otherwise dispose of, directly or indirectly, or file with the Securities and Exchange Commission a registration statement under the Securities Act relating to, any shares of our common stock or securities convertible into or
136
exchangeable or exercisable for any shares of our common stock, or publicly disclose the intention to make any offer, sale, pledge, disposition or filing, without the prior written consent of Credit Suisse Securities (USA) LLC for a period beginning on the date of the prospectus relating to this offering and ending on the later of (i) January 6, 2014 and (ii) 90 days after the date of the prospectus relating to this offering, except (i) issuances of common stock pursuant to the exercise, vesting or settlement of warrants, stock options, restricted stock units or other equity awards outstanding on the date hereof or granted pursuant to the terms of a plan in effect on the date hereof (provided that any stock options, restricted stock units or other equity awards granted on or after the date of the completion of this offering will not vest or become exercisable during the "lock-up" period), or (ii) the issuance of shares of common stock or other securities convertible into or exercisable or exchangeable for common stock in connection with a joint venture or any other strategic transaction or any acquisitions by us of the securities, business property or other assets of another entity, provided that (x) the aggregate number of shares issued pursuant to this clause (ii) shall not exceed 10% of the total number of outstanding shares of common stock immediately following the completion of this offering and (y) any recipient of such securities issued pursuant to this clause (ii) shall execute and deliver to Credit Suisse Securities (USA) LLC a lock-up agreement (as described below). However, in the event that we cease to be an emerging growth company during the "lock-up" period and either (1) during the last 17 days of the "lock-up" period, we release earnings results or material news or a material event relating to us occurs or (2) prior to the expiration of the "lock-up" period, we announce that we will release earnings results during the 16-day period beginning on the last day of the "lock-up" period, then in either case the expiration of the "lock-up" will be extended until the expiration of the 18-day period beginning on the date of the release of the earnings results or the occurrence of the material news or event, as applicable, unless Credit Suisse Securities (USA) LLC waives, in writing, such an extension.
In connection with our initial public offering our officers and directors and substantially all of our other stockholders and holders of securities convertible into commons stock have agreed that they will not offer, sell, contract to sell, pledge or otherwise dispose of, directly or indirectly, any shares of our common stock or securities convertible into or exchangeable or exercisable for any shares of our common stock, enter into a transaction that would have the same effect, or enter into any swap, hedge or other arrangement that transfers, in whole or in part, any of the economic consequences of ownership of our common stock, whether any of these transactions are to be settled by delivery of our common stock or other securities, in cash or otherwise, or publicly disclose the intention to make any offer, sale, pledge or disposition, or to enter into any transaction, swap, hedge or other arrangement, without, in each case, the prior written consent of Credit Suisse Securities (USA) LLC for a period of 180 days after June 6, 2013. However, in the event that the we cease to be an emerging growth company during the "lock-up" period and either (1) during the last 17 days of the "lock-up" period, we release earnings results or material news or a material event relating to us occurs or (2) prior to the expiration of the "lock-up" period, we announce that we will release earnings results during the 16-day period beginning on the last day of the "lock-up" period, then in either case the expiration of the "lock-up" will be extended until the expiration of the 18-day period beginning on the date of the release of the earnings results or the occurrence of the material news or event, as applicable, unless Credit Suisse Securities (USA) LLC waives, in writing, such an extension. In addition, in connection with this offering, our directors and executive officers, the selling shareholders in this offering, and certain other significant stockholders have entered into substantially similar arrangements with the underwriters restricting their ability to dispose or hedge any such securities during the period beginning on the date of the prospectus related to this offering and ending on the later of (i) January 6, 2014 and (ii) 90 days after the date of the prospectus related to this offering.
We and the selling stockholders have agreed to indemnify the underwriters against liabilities under the Securities Act, or contribute to payments that the underwriters may be required to make in that respect.
Our common stock is listed on the New York Stock Exchange, under the symbol "TXTR."
137
In connection with the offering the underwriters may engage in stabilizing transactions, over-allotment transactions, syndicate covering transactions, penalty bids and passive market making in accordance with Regulation M under the Exchange Act.
- •
- Stabilizing transactions permit bids to purchase the underlying security so long as the stabilizing bids do not exceed a
specified maximum.
- •
- Over-allotment involves sales by the underwriters of shares in excess of the number of shares the underwriters
are obligated to purchase, which creates a syndicate short position. The short position may be either a covered short position or a naked short position. In a covered short position, the number of
shares over-allotted by the underwriters is not greater than the number of shares that they may purchase in the over-allotment option. In a naked short position, the number of
shares involved is greater than the number of shares in the over-allotment option. The underwriters may close out any covered short position by either exercising their
over-allotment option and/or purchasing shares in the open market.
- •
- Syndicate covering transactions involve purchases of the common stock in the open market after the distribution has been
completed in order to cover syndicate short positions. In determining the source of shares to close out the short position, the underwriters will consider, among other things, the price of shares
available for purchase in the open market as compared to the price at which they may purchase shares through the over-allotment option. If the underwriters sell more shares than could be
covered by the over-allotment option, a naked short position, the position can only be closed out by buying shares in the open market. A naked short position is more likely to be created
if the underwriters are concerned that there could be downward pressure on the price of the shares in the open market after pricing that could adversely affect investors who purchase in the offering.
- •
- Penalty bids permit the representatives to reclaim a selling concession from a syndicate member when the common stock
originally sold by the syndicate member is purchased in a stabilizing or syndicate covering transaction to cover syndicate short positions.
- •
- In passive market making, market makers in the common stock who are underwriters or prospective underwriters may, subject to limitations, make bids for or purchases of our common stock until the time, if any, at which a stabilizing bid is made.
These stabilizing transactions, syndicate covering transactions and penalty bids may have the effect of raising or maintaining the market price of our common stock or preventing or retarding a decline in the market price of the common stock. As a result the price of our common stock may be higher than the price that might otherwise exist in the open market. These transactions may be effected on the New York Stock Exchange or otherwise and, if commenced, may be discontinued at any time.
A prospectus in electronic format may be made available on the websites maintained by one or more of the underwriters, or selling group members, if any, participating in this offering and one or more of the underwriters participating in this offering may distribute prospectuses electronically.
Other Relationships
Certain of the underwriters and their respective affiliates have in the past performed, and may in the future perform, various financial advisory, investment banking and other services for us, our affiliates and our officers in the ordinary course of business, for which they received and may receive customary fees and reimbursement of expenses.
In addition, in the ordinary course of their business activities, the underwriters and their affiliates may make or hold a broad array of investments and actively trade debt and equity securities (or related derivative securities) and financial instruments (including bank loans) for their own account and for the accounts of their customers. Such investments and securities activities may involve securities and/or instruments of ours or our affiliates. The underwriters and their affiliates may also make investment recommendations and/or publish or express independent research views in respect of such securities or
138
financial instruments and may hold, or recommend to clients that they acquire, long and/or short positions in such securities and instruments.
European Economic Area
In relation to each Member State of the European Economic Area that has implemented the Prospectus Directive, each, a Relevant Member State, each underwriter represents and agrees that with effect from and including the date on which the Prospectus Directive is implemented in that Relevant Member State, or the Relevant Implementation Date, it has not made and will not make an offer of common shares to the public in that Relevant Member State prior to the publication of a prospectus in relation to the common shares that has been approved by the competent authority in that Relevant Member State or, where appropriate, approved in another Relevant Member State and notified to the competent authority in that Relevant Member State, all in accordance with the Prospectus Directive, except that it may, with effect from and including the Relevant Implementation Date, make an offer of common shares to the public in that Relevant Member State at any time:
- •
- to any legal entity which is a qualified investor as defined in the Prospectus Directive;
- •
- to fewer than 100 or, if the Relevant Member State has implemented the relevant provision of the PD Amending Directive,
150, natural or legal persons (other than qualified investors as defined in the Prospectus Directive) subject to obtaining the prior consent of the manager for any such offer; or
- •
- in any other circumstances falling within Article 3(2) of the Prospectus Directive, provided that no such offer of common shares shall require the publication by the Issuer or any underwriter of a prospectus pursuant to Article 3 of the Prospectus Directive.
For the purposes of this provision, the expression an "offer of common shares to the public" in relation to any Shares in any Relevant Member State means the communication in any form and by any means of sufficient information on the terms of the offer and the common shares to be offered so as to enable an investor to decide to purchase or subscribe the common shares, as the same may be varied in that Relevant Member State by any measure implementing the Prospectus Directive in that Member State and the expression Prospectus Directive means Directive 2003/71/EC and (and amendments thereto, including Directive 2010/73/EU, to the extent implemented in each Relevant Member State) includes any relevant implementing measure in each Relevant Member State.
Notice to Investors in the United Kingdom
Each underwriter:
- •
- has only communicated or caused to be communicated and will only communicate or cause to be communicated any invitation or
inducement to engage in investment activity (within the meaning of section 21 of FSMA) in connection with the sale or issue of common stock in circumstances in which section 21 of FSMA
does not apply to such underwriter; and
- •
- has complied with, and will comply with all applicable provisions of FSMA with respect to anything done by it in relation to the shares of common stock in, from or otherwise involving the United Kingdom.
This prospectus is directed solely at persons who (i) are outside the United Kingdom or (ii) have professional experience in matters relating to investments or (iii) are persons falling within Article 49(2)(a) to (d) of The Financial Services and Markets Act (Financial Promotion) Order 2005 (all such persons together being referred to as "relevant persons"). This prospectus must not be acted on or relied on by persons who are not relevant persons. Any investment or investment activity to which this prospectus relates is available only to relevant persons and will be engaged in with relevant persons only.
139
Resale Restrictions
The distribution of the common stock in Canada is being made only in the provinces of Ontario, Quebec, Alberta, British Columbia and Manitoba on a private placement basis exempt from the requirement that we and the selling stockholders prepare and file a prospectus with the securities regulatory authorities in each province where trades of common stock are made. Any resale of the common stock in Canada must be made under applicable securities laws which may vary depending on the relevant jurisdiction, and which may require resales to be made under available statutory exemptions or under a discretionary exemption granted by the applicable Canadian securities regulatory authority. Purchasers are advised to seek legal advice prior to any resale of the common stock.
Representations of Purchasers
By purchasing common stock in Canada and accepting delivery of a purchase confirmation, a purchaser is representing to us, the selling stockholders and the dealer from whom the purchase confirmation is received that:
- •
- the purchaser is entitled under applicable provincial securities laws to purchase the common stock without the benefit of
a prospectus qualified under those securities laws as it is an "accredited investor" as defined under National Instrument 45-106—Prospectus and Registration Exemptions,
- •
- the purchaser is a "Canadian permitted client" as defined in National
Instrument 31-103—Registration Requirements, Exemptions and Ongoing Registrant Obligations, or as otherwise interpreted and applied by the Canadian Securities
Administrators,
- •
- where required by law, the purchaser is purchasing as principal and not as agent,
- •
- the purchaser has reviewed the text above under Resale Restrictions, and
- •
- the purchaser acknowledges and consents to the provision of specified information concerning the purchase of the common stock to the regulatory authority that by law is entitled to collect the information, including certain personal information. For purchasers in Ontario, questions about such indirect collection of personal information should be directed to Administrative Support Clerk, Ontario Securities Commission, Suite 1903, Box 55, 20 Queen Street West, Toronto, Ontario M5H 3S8 or on (416) 593-3684.
Rights of Action—Ontario Purchasers
Under Ontario securities legislation, certain purchasers who purchase a security offered by this prospectus during the period of distribution will have a statutory right of action for damages, or while still the owner of the common stock, for rescission against us and the selling stockholders in the event that this prospectus contains a misrepresentation without regard to whether the purchaser relied on the misrepresentation. The right of action for damages is exercisable not later than the earlier of 180 days from the date the purchaser first had knowledge of the facts giving rise to the cause of action and three years from the date on which payment is made for the common stock. The right of action for rescission is exercisable not later than 180 days from the date on which payment is made for the common stock. If a purchaser elects to exercise the right of action for rescission, the purchaser will have no right of action for damages against us or the selling stockholders. In no case will the amount recoverable in any action exceed the price at which the common stock were offered to the purchaser and if the purchaser is shown to have purchased the securities with knowledge of the misrepresentation, we and the selling stockholders will have no liability. In the case of an action for damages, we and the selling stockholders will not be liable for all or any portion of the damages that are proven to not represent the
140
depreciation in value of the common stock as a result of the misrepresentation relied upon. These rights are in addition to, and without derogation from, any other rights or remedies available at law to an Ontario purchaser. The foregoing is a summary of the rights available to an Ontario purchaser. Ontario purchasers should refer to the complete text of the relevant statutory provisions.
Enforcement of Legal Rights
All of our directors and officers as well as the experts and the selling stockholders named herein may be located outside of Canada and, as a result, it may not be possible for Canadian purchasers to effect service of process within Canada upon us or those persons. All or a substantial portion of our assets and the assets of those persons may be located outside of Canada and, as a result, it may not be possible to satisfy a judgment against us or those persons in Canada or to enforce a judgment obtained in Canadian courts against us or those persons outside of Canada.
Taxation and Eligibility for Investment
Canadian purchasers of common stock should consult their own legal and tax advisors with respect to the tax consequences of an investment in the common stock in their particular circumstances and about the eligibility of the common stock for investment by the purchaser under relevant Canadian legislation.
141
The validity of the common stock offered hereby will be passed upon for us by Mayer Brown LLP, Chicago, Illinois. Certain legal matters in connection with this offering will be passed upon for the underwriters by Latham & Watkins LLP, Chicago, Illinois.
The consolidated financial statements and financial statement schedule of Textura Corporation as of September 30, 2011 and 2012 and for each of the three years in the period ended September 30, 2012 included in this prospectus have been so included in reliance on the report of PricewaterhouseCoopers LLP, an independent registered public accounting firm, given on the authority of said firm as experts in auditing and accounting.
The financial statements of Submittal Exchange, LLC as of November 6, 2011 and for the period from January 1, 2011 to November 6, 2011 included in this prospectus have been so included in reliance on the report of PricewaterhouseCoopers LLP, an independent registered public accounting firm, given on the authority of said firm as experts in auditing and accounting.
WHERE YOU CAN FIND MORE INFORMATION
We have filed with the SEC a registration statement on Form S-1 under the Securities Act with respect to this offering of our common stock. This prospectus, which constitutes a part of the registration statement, does not contain all of the information set forth in the registration statement, some items of which are contained in exhibits to the registration statement as permitted by the rules and regulations of the SEC. For further information with respect to us and our common stock, we refer you to the registration statement, including the exhibits and the financial statements and notes filed as a part of the registration statement. Statements contained in this prospectus concerning the contents of any contract or any other document are not necessarily complete. If a contract or document has been filed as an exhibit to the registration statement, please see the copy of the contract or document that has been filed. Each statement in this prospectus relating to a contract or document filed as an exhibit is qualified in all respects by the filed exhibit. The exhibits to the registration statement should be referenced for the complete contents of these contracts and documents. A copy of the registration statement, the exhibits and schedules thereto and any other document we file may be inspected without charge at the public reference facilities maintained by the SEC at 100 F Street, N.E., Room 1580, Washington, D.C. 20549 and copies of all or any part of the registration statement may be obtained from this office, at prescribed rates. You may obtain information on the operation of the public reference rooms by calling the SEC at 1-800-SEC-0330. The SEC also maintains an Internet website that contains reports, proxy statements and other information about issuers, like us, that file electronically with the SEC. The address of that website is www.sec.gov.
We are subject to the information and reporting requirements of the Exchange Act and, in accordance with this law, are required file periodic reports, proxy statements and other information with the SEC. These periodic reports, proxy statements and other information are available for inspection and copying at the SEC's public reference facilities and the website of the SEC referred to above. Textura maintains a website at www.texturacorp.com. You may also access our periodic reports, proxy statements and other information free of charge at this website as soon as reasonably practicable after such material is electronically filed with, or furnished to, the SEC. The information on such website is not incorporated by reference and is not part of this prospectus.
142
F-1
Report of Independent Registered Public Accounting Firm
To
the Board of Directors and
Stockholders of Textura Corporation:
In our opinion, the accompanying consolidated balance sheets and the related consolidated statements of operations, redeemable Series A-1 preferred stock and deficit, and cash flows present fairly, in all material respects, the financial position of Textura Corporation and its subsidiaries at September 30, 2011 and 2012, and the results of their operations and their cash flows for each of the three years in the period ended September 30, 2012 in conformity with accounting principles generally accepted in the United States of America. In addition, in our opinion the financial statement schedule listed in the accompanying index presents fairly, in all material respects, the information set forth therein when read in conjunction with the related consolidated financial statements. These financial statements and financial statement schedule are the responsibility of the Company's management. Our responsibility is to express an opinion on these financial statements based on our audits. We conducted our audits of these statements in accordance with the standards of the Public Company Accounting Oversight Board (United States). Those standards require that we plan and perform the audit to obtain reasonable assurance about whether the financial statements are free of material misstatement. An audit includes examining, on a test basis, evidence supporting the amounts and disclosures in the financial statements, assessing the accounting principles used and significant estimates made by management, and evaluating the overall financial statement presentation. We believe that our audits provide a reasonable basis for our opinion.
/s/ PricewaterhouseCoopers LLP
Chicago,
Illinois
January 9, 2013, except for the effects of the stock split discussed in Note 2 to the consolidated financial statements, as to which the date is April 5, 2013
F-2
Textura Corporation
Consolidated Balance Sheets
(in thousands, except per share amounts)
| |
September 30, 2011 |
September 30, 2012 |
|||||
|---|---|---|---|---|---|---|---|
Assets |
|||||||
Current assets |
|||||||
Cash and cash equivalents |
$ | 5,941 | $ | 4,174 | |||
Accounts receivable, net of allowance for doubtful accounts of $24 and $59 at September 30, 2011 and 2012, respectively |
329 | 1,621 | |||||
Prepaid expenses and other current assets |
305 | 701 | |||||
Total current assets |
6,575 | 6,496 | |||||
Property and equipment, net |
19,515 |
17,775 |
|||||
Restricted cash |
1,000 | 1,000 | |||||
Goodwill |
— | 17,949 | |||||
Intangible assets, net |
— | 7,722 | |||||
Other assets |
215 | 157 | |||||
Total assets |
$ | 27,305 | $ | 51,099 | |||
Liabilities, Redeemable Series A-1 Preferred Stock and Deficit |
|||||||
Current liabilities |
|||||||
Accounts payable |
$ | 786 | $ | 1,055 | |||
Accrued expenses |
4,564 | 6,939 | |||||
Deferred revenue |
4,749 | 12,793 | |||||
Loan payable to related party |
500 | 500 | |||||
Total current liabilities |
10,599 | 21,287 | |||||
Deferred revenue, long-term |
530 |
1,373 |
|||||
Convertible debentures |
1,964 | 15,888 | |||||
Conversion option liability |
153 | 439 | |||||
Deferred tax liabilities |
— | 160 | |||||
Loan payable to related party, long-term |
10,719 | 10,219 | |||||
Total liabilities |
23,965 | 49,366 | |||||
Commitments and contingencies (Note 10) |
|||||||
Redeemable Series A-1 preferred stock, $.001 par value; 1,441 shares authorized at September 30, 2011 and 2012; 1,015 shares issued and outstanding at September 30, 2011 and 2012 |
39,762 |
43,135 |
|||||
Deficit |
|||||||
Series A-2 preferred stock, $.001 par value; 1,058 shares authorized at September 30, 2011 and 2012; 805 shares issued and outstanding at September 30, 2011 and 2012 |
1 | 1 | |||||
Common stock, $.001 par value; 90,000 shares authorized; 8,966 and 8,992 shares issued and 8,544 and 8,570 shares outstanding at September 30, 2011 and 2012 |
9 | 9 | |||||
Additional paid in capital |
94,124 | 95,389 | |||||
Treasury stock, at cost; 422 shares |
(5,231 | ) | (5,231 | ) | |||
Accumulated deficit |
(125,325 | ) | (141,252 | ) | |||
Total Textura Corporation stockholders' deficit |
(36,422 | ) | (51,084 | ) | |||
Non-controlling interest |
— | 9,682 | |||||
Total deficit |
(36,422 | ) | (41,402 | ) | |||
Total liabilities, redeemable Series A-1 preferred stock and deficit |
$ | 27,305 | $ | 51,099 | |||
The accompanying notes are an integral part of these consolidated financial statements.
F-3
Textura Corporation
Consolidated Statements of Operations
(in thousands, except per share amounts)
| |
Years Ended September 30, | |||||||||
|---|---|---|---|---|---|---|---|---|---|---|
| |
2010 | 2011 | 2012 | |||||||
Revenue |
$ | 6,020 | $ | 10,514 | $ | 21,681 | ||||
Operating expense |
||||||||||
Cost of services (exclusive of depreciation and amortization shown separately below) |
4,187 | 4,395 | 6,152 | |||||||
General and administrative |
5,654 | 6,856 | 11,105 | |||||||
Sales and marketing |
3,122 | 2,601 | 5,995 | |||||||
Technology and development |
4,747 | 6,169 | 11,123 | |||||||
Depreciation and amortization |
2,621 | 2,161 | 4,080 | |||||||
Total operating expense |
20,331 | 22,182 | 38,455 | |||||||
Loss from operations |
(14,311 | ) | (11,668 | ) | (16,774 | ) | ||||
Other expense, net |
||||||||||
Interest income |
11 | 4 | 5 | |||||||
Interest expense |
(1,623 | ) | (7,264 | ) | (2,205 | ) | ||||
Change in fair value of conversion option liability |
— | — | 181 | |||||||
Total other expense, net |
(1,612 | ) | (7,260 | ) | (2,019 | ) | ||||
Loss before income taxes |
(15,923 | ) | (18,928 | ) | (18,793 | ) | ||||
Income tax provision (benefit) |
— | — | — | |||||||
Net loss |
(15,923 | ) | (18,928 | ) | (18,793 | ) | ||||
Less: Net loss attributable to non-controlling interest |
— | — | (2,866 | ) | ||||||
Net loss attributable to Textura Corporation |
(15,923 | ) | (18,928 | ) | (15,927 | ) | ||||
Accretion (decretion) of redeemable Series A-1 preferred stock |
(19,802 | ) | 11,486 | 3,373 | ||||||
Dividends on Series A-2 preferred stock |
480 | 480 | 480 | |||||||
Undistributed earnings allocated to participating securities |
1,506 | — | — | |||||||
Net income (loss) available to Textura Corporation common stockholders |
$ | 1,893 | $ | (30,894 | ) | $ | (19,780 | ) | ||
Net income (loss) available to Textura Corporation common stockholders, basic and diluted |
$ | 1,893 | $ | (30,894 | ) | $ | (19,780 | ) | ||
Net income (loss) per share available to Textura Corporation common stockholders: |
||||||||||
Basic |
$ | 0.27 | $ | (4.18 | ) | $ | (2.31 | ) | ||
Diluted |
$ | 0.26 | $ | (4.18 | ) | $ | (2.31 | ) | ||
Weighted average number of common shares outstanding: |
||||||||||
Basic |
6,942 | 7,392 | 8,548 | |||||||
Diluted |
7,166 | 7,392 | 8,548 | |||||||
The accompanying notes are an integral part of these consolidated financial statements.
F-4
Textura Corporation
Consolidated Statements of Redeemable Series A-1 Preferred Stock and Deficit
(in thousands)
| |
Redeemable Series A-1 Preferred Stock |
Series A-2 Preferred Stock |
Common Stock |
|
|
|
Total Textura Corporation Stockholders' Deficit |
|
|
||||||||||||||||||||||||||||
|---|---|---|---|---|---|---|---|---|---|---|---|---|---|---|---|---|---|---|---|---|---|---|---|---|---|---|---|---|---|---|---|---|---|---|---|---|---|
| |
Additional Paid-In Capital |
Treasury Stock |
Accumulated Deficit |
Non- Controlling Interest |
Total Deficit |
||||||||||||||||||||||||||||||||
| |
Shares | Amount | Shares | Amount | Shares | Amount | |||||||||||||||||||||||||||||||
Balance at October 1, 2009 |
1,015 | $ | 48,078 | 805 | $ | 1 | 6,942 | $ | 7 | $ | 57,295 | $ | (5,231 | ) | $ | (90,474 | ) | $ | (38,402 | ) | $ | — | $ | (38,402 | ) | ||||||||||||
Share-based compensation |
— | — | — | — | — | — | 2,125 | — | — | 2,125 | — | 2,125 | |||||||||||||||||||||||||
Warrants issued for referral fees |
— | — | — | — | — | — | 67 | — | — | 67 | — | 67 | |||||||||||||||||||||||||
Warrants issued with debt issuance |
— | — | — | — | — | — | 1,149 | — | — | 1,149 | — | 1,149 | |||||||||||||||||||||||||
Beneficial conversion feature on debt issuance |
— | — | — | — | — | — | 186 | — | — | 186 | — | 186 | |||||||||||||||||||||||||
Redeemable Series A-1 preferred decretion |
— | (19,802 | ) | — | — | — | — | 19,802 | — | — | 19,802 | — | 19,802 | ||||||||||||||||||||||||
Net loss |
— | — | — | — | — | — | — | — | (15,923 | ) | (15,923 | ) | — | (15,923 | ) | ||||||||||||||||||||||
Balances at September 30, 2010 |
1,015 | 28,276 | 805 | 1 | 6,942 | 7 | 80,624 | (5,231 | ) | (106,397 | ) | (30,996 | ) | — | (30,996 | ) | |||||||||||||||||||||
Share-based compensation |
— | — | — | — | — | — | 1,468 | — | — | 1,468 | — | 1,468 | |||||||||||||||||||||||||
Warrants issued for mortgage renewal |
— | — | — | — | — | — | 109 | 109 | 109 | ||||||||||||||||||||||||||||
Warrants issued with debt issuance |
— | — | — | — | — | — | 969 | — | — | 969 | — | 969 | |||||||||||||||||||||||||
Beneficial conversion feature on debt issuance |
— | — | — | — | — | — | 96 | — | — | 96 | — | 96 | |||||||||||||||||||||||||
Conversion of convertible debentures into common stock |
— | — | — | — | 1,602 | 2 | 22,344 | — | — | 22,346 | — | 22,346 | |||||||||||||||||||||||||
Redeemable Series A-1 preferred accretion |
— | 11,486 | — | — | — | — | (11,486 | ) | — | — | (11,486 | ) | — | (11,486 | ) | ||||||||||||||||||||||
Net loss |
— | — | — | — | — | — | — | — | (18,928 | ) | (18,928 | ) | — | (18,928 | ) | ||||||||||||||||||||||
Balances at September 30, 2011 |
1,015 | 39,762 | 805 | 1 | 8,544 | 9 | 94,124 | (5,231 | ) | (125,325 | ) | (36,422 | ) | — | (36,422 | ) | |||||||||||||||||||||
Share-based compensation |
— | — | — | — | — | — | 2,676 | — | — | 2,676 | — | 2,676 | |||||||||||||||||||||||||
Issuance of common stock upon exercise of warrants |
— | — | — | — | 26 | — | 322 | — | — | 322 | — | 322 | |||||||||||||||||||||||||
Warrants issued with debt issuance |
— | — | — | — | — | — | 1,660 | — | — | 1,660 | — | 1,660 | |||||||||||||||||||||||||
Beneficial conversion feature on debt issuance |
— | — | — | — | — | — | 140 | — | — | 140 | — | 140 | |||||||||||||||||||||||||
Deferred tax liability on beneficial conversion feature |
— | — | — | — | — | — | (160 | ) | — | — | (160 | ) | — | (160 | ) | ||||||||||||||||||||||
Acquisition of Submittal Exchange Holdings |
— | — | — | — | — | — | — | — | — | — | 12,548 | 12,548 | |||||||||||||||||||||||||
Redeemable Series A-1 preferred accretion |
— | 3,373 | — | — | — | — | (3,373 | ) | — | — | (3,373 | ) | — | (3,373 | ) | ||||||||||||||||||||||
Net loss |
— | — | — | — | — | — | — | — | (15,927 | ) | (15,927 | ) | (2,866 | ) | (18,793 | ) | |||||||||||||||||||||
Balances at September 30, 2012 |
1,015 | $ | 43,135 | 805 | $ | 1 | 8,570 | $ | 9 | $ | 95,389 | $ | (5,231 | ) | $ | (141,252 | ) | $ | (51,084 | ) | $ | 9,682 | $ | (41,402 | ) | ||||||||||||
The accompanying notes are an integral part of these consolidated financial statements.
F-5
Textura Corporation
Consolidated Statements of Cash Flows
(in thousands)
| |
Years Ended September 30, | |||||||||
|---|---|---|---|---|---|---|---|---|---|---|
| |
2010 | 2011 | 2012 | |||||||
Cash flows from operating activities |
||||||||||
Net loss |
$ | (15,923 | ) | $ | (18,928 | ) | $ | (18,793 | ) | |
Adjustments to reconcile net loss to cash used in operating activities |
||||||||||
Depreciation and amortization |
2,621 | 2,161 | 4,080 | |||||||
Interest expense on convertible debentures |
979 | 6,588 | 1,526 | |||||||
Change in fair value of conversion option liability |
— | — | (181 | ) | ||||||
Share-based compensation |
2,125 | 1,468 | 2,676 | |||||||
Warrants issued for referral fees |
67 | — | — | |||||||
Changes in operating assets and liabilities, net of acquisitions: |
||||||||||
Accounts receivable |
(231 | ) | 142 | (694 | ) | |||||
Prepaid expenses and other assets |
(24 | ) | (19 | ) | (221 | ) | ||||
Deferred revenue, including long-term portion |
1,250 | 2,882 | 6,128 | |||||||
Accounts payable |
(323 | ) | 145 | 181 | ||||||
Accrued expenses |
(383 | ) | 3,652 | 1,895 | ||||||
Net cash used in operating activities |
(9,842 | ) | (1,909 | ) | (3,403 | ) | ||||
Cash flows from investing activities |
||||||||||
Increase in restricted cash |
— | (100 | ) | (100 | ) | |||||
Purchases of property and equipment |
(184 | ) | (326 | ) | (393 | ) | ||||
Acquisitions of businesses, net of cash acquired |
— | — | (12,349 | ) | ||||||
Net cash used in investing activities |
(184 | ) | (426 | ) | (12,842 | ) | ||||
Cash flows from financing activities |
||||||||||
Principal payments on loan payable |
(225 | ) | (197 | ) | (500 | ) | ||||
Proceeds from convertible debentures |
7,270 | 4,836 | 13,004 | |||||||
Proceeds from issuance of warrants |
1,149 | 629 | 1,660 | |||||||
Proceeds from exercise of warrants |
— | — | 321 | |||||||
Other financing activity |
— | (68 | ) | (7 | ) | |||||
Net cash provided by financing activities |
8,194 | 5,200 | 14,478 | |||||||
Net increase (decrease) in cash and cash equivalents |
(1,832 | ) | 2,865 | (1,767 | ) | |||||
Cash and cash equivalents |
||||||||||
Beginning of year |
4,908 | 3,076 | 5,941 | |||||||
End of year |
$ | 3,076 | $ | 5,941 | $ | 4,174 | ||||
Supplemental cash flow data: |
||||||||||
Cash paid for interest |
$ | 672 | $ | 524 | $ | 625 | ||||
Non-cash investing and financing activities: |
||||||||||
Accretion (decretion) of redeemable Series A-1 preferred stock |
$ | (19,802 | ) | $ | 11,486 | $ | 3,373 | |||
Issuance of common stock upon conversion of debentures |
— | 17,730 | — | |||||||
Warrants issued for mortgage renewal |
— | 109 | — | |||||||
The accompanying notes are an integral part of these consolidated financial statements.
F-6
Textura Corporation
Notes to Consolidated Financial Statements
(in thousands, except per share data)
1. Description of Business
Textura Corporation (the "Company") was originally formed as a Wisconsin limited liability company (Textura, LLC) in 2004 and converted to a Delaware corporation in 2007. The Company provides on-demand business collaboration software solutions to the commercial construction industry. The Company's solutions increase efficiency, permit better risk management, and provide better visibility and control of construction activities to clients and address several mission-critical business processes at various stages of the construction project life cycle.
The Company is subject to a number of risks similar to other companies in a comparable stage of growth including, but not limited to, reliance on key personnel, the ability to access capital to support future growth, successful marketing of its solutions in an emerging market, and competition from other companies with potentially greater technical, financial and marketing resources.
The Company has incurred significant losses and negative cash flows from operations and continues to devote the majority of its resources to the growth of the Company's business. The Company has an accumulated deficit of $141,252 as of September 30, 2012. To date, the Company's activities have been financed primarily through the issuance of convertible debentures, commercial debt, and the sale of equity securities. Failure to generate sufficient revenue or raise additional capital could have a material adverse effect on the Company's ability to meet its intended business objectives.
2. Summary of Significant Accounting Policies
Basis of Presentation and Principles of Consolidation
The accompanying consolidated financial statements are prepared in accordance with accounting principles generally accepted in the United States of America ("U.S. GAAP"). The consolidated financial statements include the accounts of Textura Corporation and its subsidiaries. All significant intercompany transactions are eliminated.
On November 7, 2011, the Company obtained a controlling interest in Submittal Exchange Holdings, LLC ("Submittal Exchange Holdings"), which acquired Submittal Exchange, LLC ("Submittal Exchange") (see Note 3). The Company controls Submittal Exchange Holdings through its ownership of 100% of the voting class of units and its entitlement to make all decisions affecting Submittal Exchange Holdings with the exception of limited decision-making rights of the non-controlling interest holders that are protective in nature. The former shareholders of Submittal Exchange received Class A preferred units of Submittal Exchange Holdings, which are reflected as non-controlling interest in the consolidated financial statements. The Class A preferred units will automatically convert into Textura common shares on a 1:2 basis upon an initial public offering of Textura or a change in control of Textura or Submittal Exchange Holdings, at which time the non-controlling interest will be eliminated.
On March 28, 2013, the Company's Board of Directors declared a two-for-one stock split of the Company's common stock in the form of a stock dividend and approved an amendment to the Company's certificate of incorporation to increase the number of authorized shares of its common stock from 20,000 to 90,000. All numbers of shares and per share amounts in these consolidated financial statements have been adjusted to reflect the two-for-one stock split on a retroactive basis. Stockholders' equity reflects the stock split by reclassifying from "Additional paid-in capital" to "Common stock" an amount equal to the par value of the additional shares arising from the split.
F-7
Textura Corporation
Notes to Consolidated Financial Statements (Continued)
(in thousands, except per share data)
2. Summary of Significant Accounting Policies (Continued)
Use of Estimates
The preparation of consolidated financial statements in conformity with U.S. GAAP requires management to make estimates and assumptions that affect the reported amounts of assets and liabilities and the disclosure of contingent assets and liabilities at the date of the financial statements and the reported amounts of revenues and expenses during the reporting period. The estimates and assumptions used in the accompanying financial statements are based upon management's evaluation of the relevant facts and circumstances at the balance sheet date. Actual results could differ from those estimates. Significant estimates are involved in the Company's revenue recognition, accounting for convertible debentures, depreciation, amortization and assumptions for share-based payments.
Cash and Cash Equivalents
The Company considers all unrestricted highly liquid investments with an initial maturity of three months or less to be cash equivalents. The Company maintains cash accounts in which the balances, at times, exceed the Federal Deposit Insurance Corporation limits. The Company has not experienced any losses in such accounts.
Restricted Cash
The Company is required to maintain compensating cash balances with two financial institutions. These cash balances are set aside per provisions of contracts with these institutions and cannot be used in the daily operations of the business.
Revenue Recognition
For the Company's CPM, Submittal Exchange, and Greengrade solutions, the Company earns revenue from owners/developers, general contractors and architects in the form of project fees and monthly fees; and from subcontractors in the form of usage fees. For the Company's GradeBeam and PQM solutions, the Company earns revenue in the form of subscription fees. The Company's arrangements do not contain general rights of return and do not provide customers with the right to take possession of the software supporting the solutions and, as a result, are accounted for as service contracts.
All of the Company's solutions include training and support. The Company evaluates whether the individual deliverables in its arrangements qualify as separate units of accounting. In order to treat deliverables in a multiple deliverable arrangement as separate units of accounting, the deliverables must have standalone value upon delivery. In determining whether deliverables have standalone value, the Company considers whether solutions are sold to new customers without training and support, the nature of the training and support provided and the availability of the training and support from other vendors. The Company concluded that training and support do not have standalone value because they are never sold separately, do not have value to the customer without the solution and are not available from other vendors. Accordingly, the training and support are combined with the solution and treated as a single unit of accounting.
The Company recognizes this revenue when there is evidence that an agreement exists with the customer and the customer has begun deriving benefit from use of the solution, the fee is fixed and
F-8
Textura Corporation
Notes to Consolidated Financial Statements (Continued)
(in thousands, except per share data)
2. Summary of Significant Accounting Policies (Continued)
determinable, delivery of our services has occurred, and collection of payment from the project participant is reasonably assured. The Company recognizes project fees and usage fees ratably over the average estimated life of the project and contract, respectively, and recognizes subscription fees over the subscription period. The average estimated life of the project and contract is estimated by management based on periodic review and analysis of historical data. The applicable estimated life is based on the project or contract value falling within certain predetermined ranges, as well as the solution on which the project is being managed. The Company performs periodic reviews of actual project and contract data and revises estimates as necessary. Estimated project life durations range from 5 to 28 months, and estimated contract life durations range from 5 to 11 months. Subscription periods typically range from 6 to 24 months.
Allowance for Doubtful Accounts
The Company records an allowance for doubtful accounts for amounts due from customers that it does not expect to collect. The Company monitors its accounts receivable and updates the allowance for doubtful accounts when it becomes aware of changes in collectability. The Company estimates the allowance based on historical write-offs and recoveries, as well as aging trends. An allowance for doubtful accounts is maintained at a level management believes is sufficient to cover potential losses.
Property and Equipment
Property and equipment are recorded at cost. Depreciation is provided over the estimated useful lives of the related assets using the straight-line method.
Amortization of leasehold improvements is computed using the straight-line method over the shorter of the remaining lease term or the estimated useful lives of the improvements. Maintenance and repairs are charged to expense as incurred. The estimated useful lives of the assets are as follows:
Buildings |
30 years | |
Computer equipment |
2 years | |
Office furniture |
5 years | |
Leasehold improvements |
5 years | |
Source software |
3 years |
The Company incurs costs, primarily consisting of employee-related and third-party contractor costs, to develop and maintain its source software. The Company expenses costs incurred during the planning and post-implementation phases of development of its solutions. During the solution development phase, costs incurred are capitalized. Capitalized software development costs are amortized over their estimated useful life of three years. These capitalized costs are reflected as source software and the amortization is charged to depreciation and amortization in the consolidated statements of operations. All software development costs incurred during the years ended September 30, 2010, 2011 and 2012 have been expensed.
F-9
Textura Corporation
Notes to Consolidated Financial Statements (Continued)
(in thousands, except per share data)
2. Summary of Significant Accounting Policies (Continued)
Goodwill
Goodwill represents the excess of the purchase price of an acquired business over the fair value of the net assets acquired. Goodwill is not amortized. The Company tests goodwill for impairment at the reporting unit level on an annual basis in the fourth quarter or whenever events or circumstances indicate that an impairment loss may have been incurred. The testing for impairment of goodwill involves a two step process. The first step involves a comparison of the fair value of a reporting unit with its carrying value, including goodwill. The Company uses an income approach, specifically a discounted cash flow model ("DCF model"), to determine the fair value of each reporting unit. The DCF model utilizes management's revenue and expense projections and as such involves significant assumptions as to revenue growth, operating costs and expenses, operating cash flows, as well as various assumptions for attrition, weighted average cost of capital and terminal growth. If the reporting unit's fair value is greater than its carrying value, the reporting unit's goodwill is not considered to be impaired. If the reporting unit's fair value is less than its carrying value, then the second step is performed to determine if the goodwill has been impaired. In the second step, the implied fair value of goodwill is determined by subtracting from the fair value of the reporting unit the sum of the fair values of all the net tangible and other intangible assets of the reporting unit, including those that may not have been previously recorded. A goodwill impairment charge would be recognized for the amount that the carrying value exceeds this implied fair value.
The Company evaluated both qualitative and quantitative characteristics in determining its reporting units. Based on this evaluation, the Company determined that it has one reporting unit. Each of the components within this reporting unit was determined to have similar economic characteristics and therefore was aggregated. The Company reached this conclusion because the components of its reporting unit utilize a common distribution platform that enables sharing of resources and development across solutions, provide for the expansion of its suite of solutions to various stages of the construction process lifecycle to a similar customer base, and, in the long term, are expected to have comparable earnings before tax and interest percentages. The Company also believes that goodwill is recoverable from the overall operations given the economies of scale and leveraging capabilities of the various components.
Intangible Assets
The Company's identifiable intangible assets consist of developed product technologies, customer relationships, trademarks and covenants not to compete. These assets have been acquired through acquisitions and were initially recorded at fair value. Identifiable intangible assets are amortized over their estimated useful lives using the straight-line method. The estimated useful lives of the assets are as follows:
Developed product technology |
3 years | |
Customer relationships |
10 years | |
Trademarks |
3 - 5 years | |
Covenants not to compete |
2 - 4 years |
The Company generally employs the income method to estimate the fair value of intangible assets, which is based on forecasts of the expected future cash flows attributable to the respective assets.
F-10
Textura Corporation
Notes to Consolidated Financial Statements (Continued)
(in thousands, except per share data)
2. Summary of Significant Accounting Policies (Continued)
Significant estimates and assumptions inherent in the valuations reflect a consideration of other marketplace participants, and include the amount and timing of future cash flows (including expected growth rates and profitability), the underlying product/service life cycles, economic barriers to entry and the discount rate applied to the cash flows.
Impairment of Long-Lived Assets
The Company evaluates long-lived assets, including property and equipment, software and finite-lived intangible assets, for impairment whenever events or changes in circumstances indicate that the carrying value of the asset may not be recoverable. Examples of such events or circumstances include, but are not limited to, significant underperformance relative to historical or projected future results, significant negative changes in the manner of use of the acquired assets in the Company's business, or material negative changes in relationships with significant customers. Recoverability is measured by a comparison of the carrying value to the future undiscounted net cash flows associated with the asset or asset group. If the carrying value exceeds the undiscounted cash flows, an impairment loss is recognized to the extent that the carrying value exceeds the fair value of the asset or asset group.
During 2012, the actual operating results for GradeBeam met assumptions management used to determine the purchase price of the acquisition but underperformed compared to GradeBeam's revenue forecast at the time of acquisition. In preparing projected future results and analysis of recent actual results, the Company believed a triggering event had occurred requiring an impairment analysis. Our impairment analysis of GradeBeam's developed technology and customer relationship carrying values during the fourth quarter of 2012 indicated there was no impairment.
Segment Reporting
The Company has one operating segment, providing on-demand business collaboration software solutions to the commercial construction industry. The Company's chief operating decision maker, the Chief Executive Officer, manages the Company's operations based on consolidated financial information for purposes of evaluating financial performance and allocating resources.
The Company's revenues are principally generated in the United States, which accounted for 98.7%, 90.1%, and 89.9% of consolidated revenues for the years ended September 30, 2010, 2011, and 2012, respectively, with the remainder primarily from customers located in Canada. Including the revenues generated both directly from a client and from the subcontractors working on projects the client controls, our largest customer accounted for 14.8%, 13.4% and 10.8% of consolidated revenues in the years ended September 30, 2010, 2011 and 2012, respectively. No single customer accounted for 10% or more of the accounts receivable balance at September 30, 2012. As of September 30, 2011, two customers individually accounted for 13.8% and 10.7% of the accounts receivable balance. There are no significant assets outside of the United States.
Share-Based Compensation
The Company recognizes share-based compensation on stock option grants to employees and directors in the consolidated statements of operations based on their grant date fair values. The grant date fair values of the Company's stock options are amortized over the awards' service periods on a
F-11
Textura Corporation
Notes to Consolidated Financial Statements (Continued)
(in thousands, except per share data)
2. Summary of Significant Accounting Policies (Continued)
straight-line basis. The Company also issues restricted stock units to employees and directors with performance conditions triggered by a change in control or completion of an initial public offering. As the Company determined that neither of these events was probable, there has been no compensation charged to operations for restricted stock units.
Income Taxes
The Company accounts for income taxes using an asset and liability approach, under which deferred assets and liabilities are recognized based upon anticipated future tax consequences attributable to differences between financial statement carrying values of assets and liabilities and their respective tax bases. A valuation allowance is established to reduce the carrying value of deferred tax assets if it is considered more likely than not that such assets will not be realized. Any change in the valuation allowance would be charged to income in the period such determination was made.
Convertible Debentures
The Company has issued convertible debentures with detachable warrants to purchase common stock. The Company evaluates features of the convertible debentures to determine whether embedded derivatives must be bifurcated and accounted for separately. Separately-accounted for derivative financial instruments are recorded at fair value as of the issuance date of the convertible debentures, as a debt discount, and remeasured to fair value as of each subsequent balance sheet date. The Company determines the fair value of the debt using a discounted cash flow analysis based on the stated interest rate of the debt and scheduled principal payments, applying the Company's incremental borrowing rate as the discount factor and the fair value of the detachable warrants using the Black-Scholes method. Proceeds remaining after recording any derivative financial instruments were allocated to the convertible debentures and the detachable warrants based on their relative fair values at the time of issuance. The unamortized debt discounts arising from separately-accounted for derivative financial instruments and the allocation of proceeds to the detachable warrants are amortized to interest expense from the issuance date through the various maturity dates of the convertible debentures.
A beneficial conversion feature exists if, at the issuance date, the accounting conversion price of the convertible debenture is less than the fair value of the common stock into which it is convertible. The Company calculates the amount of any beneficial conversion feature as the difference between the fair value of common stock at the issuance date and the accounting conversion price, multiplied by the number of common shares the investor can receive under the terms of the agreement. The beneficial conversion feature is recorded as a reduction to the convertible debenture's net carrying value and is amortized over the period from the date of issuance to the maturity date of the convertible debenture.
Debt Issuance Costs
The Company incurred bank fees and loan filing costs and issued warrants in connection with loan origination or related amendments. These debt issuance costs are recorded in other assets and amortized to interest expense over the term of the related debt.
F-12
Textura Corporation
Notes to Consolidated Financial Statements (Continued)
(in thousands, except per share data)
2. Summary of Significant Accounting Policies (Continued)
Accretion of Redeemable Series A-1 Preferred Stock
The Company's redeemable Series A-1 preferred stock is redeemable at the election of the majority of the preferred stock holders beginning in October 2014. To the extent that redemption is requested, the holders will receive the greater of the fair value of the preferred stock at the time of redemption plus cumulative unpaid dividends, regardless if declared or undeclared, or the original issuance price plus cumulative unpaid dividends. The Company accretes the carrying value of the redeemable Series A-1 preferred stock to the redemption value each reporting period through a decrease or increase to additional paid-in capital. Upon completion of an initial public offering, the redeemable Series A-1 preferred stock will automatically convert to common shares at a fixed conversion rate of 1:2.84 and the Company will not record any further accretion.
Fair Value of Financial Instruments
Fair value is defined as the price that would be received from selling an asset or paid to transfer a liability in an orderly transaction between market participants at the measurement date. The fair value measurements are classified and disclosed in one of the following three categories:
Level 1—Valuations based on quoted prices in active markets for identical assets or liabilities;
Level 2—Valuations based on other than quoted prices in active markets for identical assets and liabilities, quoted market prices for identical or similar assets or liabilities in inactive markets, or other inputs that are observable or can be corroborated by observable market data for substantially the full term of the assets or liabilities;
Level 3—Valuations based on inputs that are generally unobservable and typically reflect management's estimate of assumptions that market participants would use in pricing the asset or liability.
The carrying amounts of cash and cash equivalents, accounts receivable, prepaid expenses and other current assets, restricted cash, accounts payable, and accrued expenses approximate fair value because of their short maturities. The carrying values of the bank loan payable and the convertible debentures approximate their fair values based on a comparison of the interest rate and terms of such debt to the rates and terms of similar debt available for each period.
The Company determined that certain embedded features of the 2011 convertible debentures (see Note 7) were required to be bifurcated and accounted for as derivatives. The derivative financial instruments were initially recorded at fair value as of the issuance dates of the convertible debentures as a debt discount and are remeasured to fair value as of each subsequent balance sheet date. The fair value was determined using the binomial lattice pricing model.
The Company determined the fair value using Level 3 inputs as follows:
| |
9/15/2011 | 10/24/2011 | 9/30/2012 | |||||||
|---|---|---|---|---|---|---|---|---|---|---|
Dividend yield |
— | — | — | |||||||
Volatility |
40 | % | 40 | % | 40 | % | ||||
Risk-free rate |
0.96 | % | 1.07 | % | 0.46 | % | ||||
F-13
Textura Corporation
Notes to Consolidated Financial Statements (Continued)
(in thousands, except per share data)
2. Summary of Significant Accounting Policies (Continued)
The following table sets forth a reconciliation of changes in the fair value of derivative financial instruments classified as liabilities:
| |
2011 | 2012 | |||||
|---|---|---|---|---|---|---|---|
Balance as of October 1 |
$ | — | $ | 153 | |||
Initial fair value recorded as debt discount |
153 | 467 | |||||
Change in fair value included in earnings |
— | (181 | ) | ||||
Balance as of September 30 |
$ | 153 | $ | 439 | |||
Foreign Currency Transactions
The functional currency of the Company is the United States Dollar. Asset and liability balances denominated in a foreign currency are remeasured to U.S. dollars at end-of-period exchange rates. Foreign currency income and expenses are remeasured at average exchange rates in effect during the period. Foreign currency transaction differences are included in the statement of operations as incurred.
Net Income (Loss) Per Share
Basic net income (loss) per share ("EPS") available to Textura Corporation common stockholders is calculated by dividing the net income (loss) available to Textura Corporation common stockholders by the weighted average number of common shares outstanding, less any treasury shares, during the period using the two-class method. This method is used for computing basic net income (loss) per share when companies have issued securities other than common stock that contractually entitle the holder to participate in dividends and earnings of the company. Under the two-class method, net income (loss) is allocated between common shares and other participating securities based on their participation rights in both distributed and undistributed earnings. The Company's redeemable Series A-1 preferred stock, Series A-2 preferred stock and non-controlling interest are participating securities, since the stockholders are entitled to share equally in dividends declared or the undistributed earnings of the Company with the common stockholders based on their equivalent common shares.
In calculating net income (loss) available to common stockholders, cumulative undeclared preferred stock dividends on the Series A-2 preferred stock and accretion in the redemption value of the redeemable Series A-1 preferred stock are deducted from net income (loss) attributable to Textura Corporation. As the holders of the redeemable Series A-1 preferred stock, Series A-2 preferred stock and non-controlling interest were not contractually required to share in the Company's losses, in applying the two-class method to compute basic net loss per share there was no allocation of the Company's net losses to the participating securities for the years ended September 30, 2011 and 2012. For the year ended September 30, 2010, undistributed earnings were allocated to the preferred stockholders based on 5,524 equivalent common shares. Diluted EPS is calculated by giving effect to all potential common shares outstanding during the period, including redeemable and convertible preferred stock, convertible debentures, non-controlling interest, stock options, restricted stock units and warrants. Potential common shares in the diluted EPS calculation are excluded to the extent that they would be anti-dilutive.
F-14
Textura Corporation
Notes to Consolidated Financial Statements (Continued)
(in thousands, except per share data)
2. Summary of Significant Accounting Policies (Continued)
The computation of diluted net income (loss) per share available to Textura Corporation common stockholders for the year ended September 30, 2010 is as follows:
| |
Year Ended September 30, 2010 |
|||
|---|---|---|---|---|
Net income available to Textura Corporation common stockholders, basic and diluted |
$ | 1,893 | ||
Diluted weighted average shares: |
||||
Weighted average shares outstanding, basic |
6,942 | |||
Add back: dilutive stock options |
80 | |||
Add back: dilutive warrants |
144 | |||
Weighted average shares used to compute diluted earnings per share |
7,166 | |||
Net income per share available to Textura Corporation common stockholders, diluted |
$ | 0.26 | ||
The following potential common shares were excluded from the computation of diluted net loss per share available to Textura Corporation common stockholders:
| |
Years Ended September 30, |
|||||||||
|---|---|---|---|---|---|---|---|---|---|---|
| |
2010 | 2011 | 2012 | |||||||
Conversion of redeemable or convertible preferred stock |
5,524 | 5,504 | 5,558 | |||||||
Conversion of Submittal Exchange Holdings Class A preferred units |
— | — | 963 | |||||||
Vesting of restricted stock units |
232 | 348 | 630 | |||||||
Exercise of stock options |
1,682 | 1,836 | 2,448 | |||||||
Exercise of common and preferred warrants |
714 | 1,124 | 1,412 | |||||||
Conversion of convertible debentures |
1,284 | — | — | |||||||
Total excluded securities |
9,436 | 8,812 | 11,011 | |||||||
Preferred stock, Submittal Exchange Holdings Class A preferred units and restricted stock units are considered contingently issuable common shares and accordingly would not be included in diluted EPS until the contingency has been met. The table also excludes conversion of 2011 Debentures (see Note 7), because the number of shares upon conversion cannot be calculated until an initial public offering.
Recent Accounting Pronouncements
In September 2011, the FASB issued ASU No. 2011-08, Intangibles—Goodwill and Other (Topic 350)—Testing Goodwill for Impairment ("ASU 2011-08"), to simplify how entities test goodwill for impairment. ASU 2011-08 allows entities to first assess qualitative factors to determine whether it is more likely than not that the fair value of a reporting unit is less than its carrying amount. If a greater than 50% likelihood exists that the fair value is less than the carrying amount then a two-step goodwill
F-15
Textura Corporation
Notes to Consolidated Financial Statements (Continued)
(in thousands, except per share data)
2. Summary of Significant Accounting Policies (Continued)
impairment test as described in Topic 350 must be performed. The amendments are effective for annual and interim goodwill impairment tests performed for fiscal years beginning after December 15, 2011 but are eligible for early adoption. The Company does not believe adoption of this new guidance will have a significant impact on its consolidated financial statements.
In June 2011, the FASB issued ASU No. 2011-05, Comprehensive Income ("ASU 2011-05"). ASU 2011-05 requires that all non-owner changes in shareholders' equity be presented either in a single continuous statement of comprehensive income or in two separate but consecutive statements. In the two-statement approach, the first statement should present total net income and its components followed consecutively by a second statement that should present total other comprehensive income, the components of other comprehensive income, and the total of comprehensive income. In December 2011, the FASB issued ASU No. 2011-12, Deferral of the Effective Date for Amendments to the Presentation of Reclassifications of Items Out of Accumulated Other Comprehensive Income in Accounting Standards Update No 2011-05 ("ASU 2011-12"). The amendments in ASU 2011-12 defer certain changes in ASU 2011-05 that relate to the presentation of reclassification adjustments out of accumulated other comprehensive income. The adoption of ASU 2011-05 and ASU 2011-12 is effective for fiscal years, and interim periods within those years, beginning after December 15, 2011 but is eligible for early adoption. The Company is evaluating the effect of the presentation options of ASU 2011-05 and ASU 2011-12 on its financial statement presentation of comprehensive income; however, based on the historical amounts recorded under other comprehensive income, the Company does not expect this standard will have a material impact on its consolidated financial statements.
In May 2011, the FASB issued Accounting Standards Update No. 2011-04, "Fair Value Measurements (Topic 820): Amendments to Achieve Common Fair Value Measurement and Disclosure Requirements in U.S. GAAP and IFRSs" ("ASU 2011-04"). ASU 2011-04 changes the wording used to describe many of the requirements in U.S. GAAP for measuring fair value and for disclosing information about fair value measurements to ensure consistency between U.S. GAAP and IFRS. ASU 2011-04 also expands the disclosures for fair value measurements that are estimated using significant unobservable (Level 3) inputs. This new guidance is to be applied prospectively. The amendments are effective for the Company in fiscal year 2013. The Company does not believe adoption of this guidance will have a significant impact on its consolidated financial statements.
3. Acquisitions
On October 19, 2011, the Company acquired certain assets and assumed certain liabilities of GradeBeam, LLC ("GradeBeam"). GradeBeam supports the process of obtaining construction bids, identifying potential bidders, inviting them to bid, and tracking bidding intent. Their solutions expand the Company's suite of solutions, especially in the planning phase of projects. The aggregate purchase price of $9,969 was paid in cash.
The purchase price of the acquisition was allocated to the net assets acquired based on the fair values at the date of acquisition. Goodwill represents the excess of the purchase price over the fair value of net tangible and identified intangible assets acquired. The Company believes the goodwill reflects its expectations related to economies of scale and leveraging of the GradeBeam solution with existing solution offerings. Identifiable intangible assets consist of developed product technologies,
F-16
Textura Corporation
Notes to Consolidated Financial Statements (Continued)
(in thousands, except per share data)
3. Acquisitions (Continued)
customer relationships, trademarks and covenants not to compete. Goodwill is deductible for tax purposes. The total purchase price has been allocated as follows:
Identifiable intangible assets |
$ | 3,970 | ||
Goodwill |
6,945 | |||
Deferred revenue |
(1,120 | ) | ||
Other current assets (liabilities), net |
174 | |||
Net assets acquired |
$ | 9,969 | ||
On November 7, 2011, the Company's subsidiary, Submittal Exchange Holdings acquired all of the issued and outstanding membership units of Submittal Exchange. Submittal Exchange solutions enable the collection, review and routing of project documents and facilitates the management of environmental certification. Their solutions expand the Company's suite of solutions, especially in the exchange and management of project documents.
The Company received 85 Class A common units of Submittal Exchange Holdings, which represented an 18.3% economic interest in Submittal Exchange Holdings, in exchange for cash consideration of $2,404 and the payment of Submittal Exchange's notes payable of $403. In exchange for preferred units of Submittal Exchange, the former owners received 482 Class A preferred units of Submittal Exchange Holdings. These Class A preferred units are mandatorily convertible on a 1:2 basis into common shares of the Company under certain conditions, including a qualifying initial public offering. The Company has determined it has a controlling interest in Submittal Exchange Holdings because it has sole responsibility for operating the Submittal Exchange business. On matters other than liquidation, the Company has a 100% voting interest; on liquidation matters, the Company has a 15% voting interest. Distributions and allocation of profits or losses are done on a pro-rata capital basis until the respective basis in both classes is reduced to zero and thereafter at 99% to the Class A common units and 1% to the Class A preferred units.
A summary of the purchase price for the acquisition is as follows:
Cash consideration |
$ | 2,404 | ||
Payment of outstanding Submittal Exchange debt |
403 | |||
Issuance of 482 Submittal Exchange Holdings Class A preferred units at $26.05 per unit |
12,548 | |||
|
$ | 15,355 | ||
The fair value of the Class A preferred units was determined to be $26.05 per unit, which was determined to be substantially equivalent to the fair value of the Textura common stock into which the Class A preferred units were convertible due to certain characteristics of the Class A preferred units. These characteristics include the conversion feature (discussed above) and participating rights, for dividends or other distributions, equal to those of the Company's common stock. The purchase price of the acquisition was allocated to the net assets acquired based on the fair values at the date of acquisition. Goodwill represents the excess of the purchase price over the fair value of the net tangible and identified intangible assets acquired. The Company believes the goodwill reflects its expectations
F-17
Textura Corporation
Notes to Consolidated Financial Statements (Continued)
(in thousands, except per share data)
3. Acquisitions (Continued)
related to economies of scale and leveraging of the Submittal Exchange solution with existing solution offerings. Identifiable intangible assets consist of developed product technologies, customer relationships, trademarks and covenants not to compete. Goodwill is not deductible for tax purposes. The total purchase price has been allocated as follows:
Identifiable intangible assets |
$ | 5,550 | ||
Goodwill |
11,004 | |||
Property and equipment |
58 | |||
Deferred revenue |
(1,640 | ) | ||
Other current assets (liabilities), net |
383 | |||
Net assets acquired |
$ | 15,355 | ||
The following table contains unaudited pro forma consolidated statements of operations information assuming the acquisitions of GradeBeam and Submittal Exchange occurred on October 1, 2010 and includes adjustments for amortization of intangible assets and interest expense. This pro forma information is presented for illustrative purposes only and is not indicative of what actual results would have been if the acquisitions had taken place on October 1, 2010, or of future results.
| |
Years Ended September 30, |
||||||
|---|---|---|---|---|---|---|---|
| |
2011 | 2012 | |||||
Revenue |
$ | 15,172 | $ | 22,167 | |||
Loss from operations |
(14,985 | ) | (17,653 | ) | |||
Net loss available to Textura Corporation common stockholders |
(32,408 | ) | (20,076 | ) | |||
Net loss per share, basic and diluted |
$ | (4.39 | ) | $ | (2.35 | ) | |
Revenue of $2,812 and $2,072 related to the Submittal Exchange and GradeBeam acquisitions, respectively, are included in the Company's results of operations from their respective acquisition dates. The acquisitions of Submittal Exchange and Gradebeam have been fully integrated into our financial reporting systems and the earnings resulting from these acquisitions therefore cannot be calculated without unreasonable effort.
F-18
Textura Corporation
Notes to Consolidated Financial Statements (Continued)
(in thousands, except per share data)
4. Property and Equipment
The following is a summary of property and equipment, at cost less accumulated depreciation, at September 30:
| |
September 30, | ||||||
|---|---|---|---|---|---|---|---|
| |
2011 | 2012 | |||||
Land |
$ | 4,276 | $ | 4,276 | |||
Computer equipment |
2,584 | 2,280 | |||||
Furniture and fixtures |
1,058 | 1,240 | |||||
Leasehold improvements |
9 | 9 | |||||
Building |
14,806 | 14,880 | |||||
Source software |
4,457 | 4,503 | |||||
|
27,190 | 27,188 | |||||
Less: Accumulated depreciation and amortization |
(7,675 | ) | (9,413 | ) | |||
|
$ | 19,515 | $ | 17,775 | |||
Depreciation of property and equipment was $1,369, $909 and $1,030 for the years ended September 30, 2010, 2011 and 2012, respectively.
Amortization of source software was $1,252 for each of the years ended September 30, 2010, 2011 and 2012.
5. Goodwill and Other Intangible Assets
The Company's goodwill and other intangible assets have been recorded at fair value as of the acquisition date. The change in the carrying value of goodwill for the year ended September 30, 2012 is as follows:
Balance at beginning of year |
$ | — | ||
Acquisitions |
17,949 | |||
|
$ | 17,949 | ||
The carrying amount and accumulated amortization of identifiable intangible assets consisted of the following as of September 30, 2012:
| |
Gross Carrying Amount |
Accumulated Amortization |
Net Carrying Amount |
|||||||
|---|---|---|---|---|---|---|---|---|---|---|
Developed product technologies |
$ | 2,640 | $ | 806 | $ | 1,834 | ||||
Customer relationships |
4,330 | 387 | 3,943 | |||||||
Trademarks |
1,150 | 218 | 932 | |||||||
Covenants not to compete |
1,400 | 387 | 1,013 | |||||||
|
$ | 9,520 | $ | 1,798 | $ | 7,722 | ||||
F-19
Textura Corporation
Notes to Consolidated Financial Statements (Continued)
(in thousands, except per share data)
5. Goodwill and Other Intangible Assets (Continued)
Amortization expense related to identifiable intangible assets was $0, $0, and $1,798 for the years ended September 30, 2010, 2011 and 2012, respectively.
The estimated amortization expense for the five succeeding years and thereafter at September 30, 2012 is as follows:
2013 |
$ | 1,984 | ||
2014 |
1,845 | |||
2015 |
1,008 | |||
2016 |
669 | |||
2017 |
454 | |||
Thereafter |
1,762 | |||
|
$ | 7,722 | ||
6. Details of Certain Balance Sheet Accounts
Prepaid expenses and other current assets consisted of the following:
| |
September 30, | ||||||
|---|---|---|---|---|---|---|---|
| |
2011 | 2012 | |||||
Restricted cash |
$ | 100 | $ | 200 | |||
Prepaid expenses |
168 | 352 | |||||
Other current assets |
37 | 149 | |||||
|
$ | 305 | $ | 701 | |||
Accrued expenses consisted of the following:
| |
September 30, | ||||||
|---|---|---|---|---|---|---|---|
| |
2011 | 2012 | |||||
Accrued bonus |
$ | 3,810 | $ | 4,552 | |||
Accrued expenses |
754 | 2,300 | |||||
Lease payable |
— | 87 | |||||
|
$ | 4,564 | $ | 6,939 | |||
The Company's Board of Directors approves the bonus pool at the end of each fiscal year, based on the performance of the Company measured against goals set forth at the beginning of the year. The Company's Board of Directors also approves the timing and amount of subsequent bonus payments. Payments are made quarterly and new annual bonus amounts are not made until the previous year's payments are completed.
7. Convertible Debentures
The Company issued convertible debenture securities with detachable warrants (see Note 14) on various dates throughout the years ended September 30, 2010, 2011 and 2012 for proceeds of $8,419,
F-20
Textura Corporation
Notes to Consolidated Financial Statements (Continued)
(in thousands, except per share data)
7. Convertible Debentures (Continued)
$5,465 and $14,664, respectively. The Company identified certain embedded conversion features in the 2011 convertible debenture issuance that were required to be bifurcated and accounted for as derivatives. The derivative financial instruments were recorded at fair value as of the issuance date of the convertible debentures, as a debt discount, and remeasured to fair value as of each subsequent balance sheet date. The initial fair values determined for the embedded derivatives during the years ended September 30, 2011 and 2012 were $153 and $467, respectively. The Company allocated the remaining proceeds to the convertible debentures and warrants on a relative fair value basis and recorded a beneficial conversion feature related to certain of the convertible debentures. The derivative financial instruments, warrants and beneficial conversion feature were recorded as a discount to the convertible debentures and are amortized to interest expense through the maturity dates, unless earlier converted (see below).
The convertible debentures are general unsecured obligations of the Company. The convertible debentures have a stated interest rate of 8.0% per annum on the outstanding principal balance. The interest on the convertible debenture securities is payable in kind ("PIK") and added to the unpaid principal in order to determine the number of shares of common stock to be issued upon conversion. The holder shall only be entitled to cash payment of such PIK interest from the Company upon (1) an event of default that would result in acceleration of all unpaid principal and accrued interest, or (2) the payment in full of the debt on the maturity date or prior as the result of the Company exercising its prepayment rights pursuant to the agreement.
Conversion of principal and accrued PIK interest into shares of common stock is at the election of the noteholders and is also mandatory upon the occurrence of a positive cash flow event, which is deemed to have occurred on the 30th day after the Company generates positive cash flow during three consecutive calendar months for debentures issued between November 2008 and December 2009 ("2009 Debentures") and six consecutive calendar months for debentures issued between April 2010 and February 2011 ("2010 Debentures"). In addition, for the 2009 and 2010 Debentures, upon conversion additional warrants are issued equivalent to 50% of the number of shares of common stock converted from accrued PIK interest. For debentures issued between September 2011 and December 2011 ("2011 Debentures"), conversion of principal and accrued PIK interest into shares of common stock is mandatory upon the closing of an initial public offering at a conversion price equal to the public offering price. The 2009 Debentures mature ten years from the issue date. The 2010 and 2011 Debentures mature five years from the issue date.
On May 1, 2011 and August 1, 2011, a positive cash flow event occurred for the 2009 and 2010 Debentures, respectively. The price at which the principal and accrued interest was converted was $16.26 per share of common stock for the 2009 Debentures and $13.25 per share of common stock for the 2010 Debentures. The principal and accrued interest converted into 740 and 862 shares of common stock for the 2009 and 2010 Debentures, respectively. The unamortized debt discount at the conversion date for the 2009 Debentures, which included a beneficial conversion feature, was recorded as interest expense on the conversion date. For the 2010 Debentures, which did not include a beneficial conversion feature, the carrying amount, including the unamortized debt discount related to the warrants, was credited to equity at the conversion date.
F-21
Textura Corporation
Notes to Consolidated Financial Statements (Continued)
(in thousands, except per share data)
7. Convertible Debentures (Continued)
Convertible debenture activity for the years ended September 30 is as follows:
| |
Years ended September 30, | |||||||||
|---|---|---|---|---|---|---|---|---|---|---|
| |
2010 | 2011 | 2012 | |||||||
Beginning balance: |
||||||||||
Gross balance |
$ | 9,856 | $ | 19,101 | $ | 2,493 | ||||
Less: Discounts |
(4,442 | ) | (5,625 | ) | (529 | ) | ||||
|
5,414 | 13,476 | 1,964 | |||||||
Proceeds: |
||||||||||
To convertible debentures, before allocations |
8,419 | 5,465 | 14,664 | |||||||
Allocated to detachable warrants |
(1,149 | ) | (629 | ) | (1,660 | ) | ||||
Allocated to beneficial conversion feature |
(186 | ) | (96 | ) | (140 | ) | ||||
Allocated to conversion option liability |
— | (153 | ) | (467 | ) | |||||
Interest expense: |
||||||||||
PIK interest |
827 | 1,384 | 1,171 | |||||||
Amortization of debt discount |
152 | 247 | 355 | |||||||
Recognition of unamortized discount upon conversion (2009 Debentures) |
— | 4,615 | — | |||||||
Conversion: |
||||||||||
Issuance of 1,602 common shares |
— | (23,457 | ) | — | ||||||
Recognition of unamortized discount upon conversion to additional paid-in-capital (2010 Debentures) |
— | 1,112 | — | |||||||
Ending balance: |
||||||||||
Gross balance |
19,101 | 2,493 | 18,328 | |||||||
Less: Discounts |
(5,625 | ) | (529 | ) | (2,440 | ) | ||||
|
$ | 13,476 | $ | 1,964 | $ | 15,888 | ||||
Total interest expense recognized related to the convertible debenture securities was $979, $6,588 and $1,526 for the years ended September 30, 2010, 2011 and 2012, respectively, including $342 for warrants issued upon conversion of the 2009 Debentures and 2010 Debentures in the year ended September 30, 2011 (see Note 14).
8. Loan Payable to Related Party
The Company's bank loan facility is held with a financial institution that is an investor in the Company. The facility has been used solely for the purchase of land and the construction of the corporate headquarters facility. In August 2011, the Company replaced its expiring bank promissory note agreement with an amended bank loan agreement. The amended loan requires semi-annual principal payments of $250 with the remaining amount due at maturity in August 2016. Interest under the loan agreement is payable at a floating rate equal to the 30 day LIBOR rate plus 4.5% or 5.5%, whichever is greater. Interest is payable monthly at the beginning of the following month. At September 30, 2011 and 2012, the interest rate on the loan was 5.5%. In addition, the Company issued
F-22
Textura Corporation
Notes to Consolidated Financial Statements (Continued)
(in thousands, except per share data)
8. Loan Payable to Related Party (Continued)
warrants to purchase shares of common stock as described in Note 14. All borrowings are collateralized by the land and facility, as the bank would take possession of the premises upon the failure by the Company to make a scheduled payment when due, after consideration of applicable cure periods, or the failure to maintain a debt service coverage ratio, defined as net cash flow from operations to debt service of 1.1 to 1.0. Debt service is defined as the principal and interest payable on the loan during the fiscal year. For the fiscal year 2012, the Company was not in compliance with this requirement. Subsequent to the balance sheet date, the Company received a bank waiver for the fiscal year 2012.
The Company is required to maintain a compensating balance of $1,000 in its operating account during the term of the loan to provide for the payment of interest on the note in the event of a default. The Company has classified the $1,000 compensating balance as restricted cash in the consolidated balance sheets. Dividends or other distributions to preferred or common stockholders is restricted until the outstanding balance of the loan is reduced to $10,360 and positive earnings are demonstrated for six consecutive months.
The outstanding loan balance was $10,719 at September 30, 2012. The principal repayments required under the loan agreement for the four succeeding years at September 30, 2012 are as follows:
2013 |
$ | 500 | ||
2014 |
500 | |||
2015 |
500 | |||
2016 |
9,219 | |||
|
$ | 10,719 | ||
9. Exit Costs Related to Office Space
The Company leased its previous office facilities for various terms under long-term, non-cancelable operating lease agreements (see Note 17). The leases expired January 31, 2012. The Company ceased use of its primary leased office facility in October 2008 when it moved to its current headquarters. As a result of the move, rental costs for its previous office facilities continued to be incurred through the remaining lease term without economic benefit to the Company. A liability representing the discounted future lease payments was recorded at the cease use date. Increases in the fair value of the liability due to the passage of time were recognized as general and administrative expenses in the consolidated statements of operations.
The following is a reconciliation of the beginning and ending lease liability balance at September 30, 2011 and 2012:
| |
2011 | 2012 | |||||
|---|---|---|---|---|---|---|---|
Beginning lease liability |
$ | 264 | $ | 71 | |||
Less: Lease payments |
(182 | ) | (59 | ) | |||
Less: Change in liability resulting from sublet space |
(22 | ) | (12 | ) | |||
Add: Accretion expense |
11 | — | |||||
Lease liability balance at September 30 |
$ | 71 | $ | — | |||
F-23
Textura Corporation
Notes to Consolidated Financial Statements (Continued)
(in thousands, except per share data)
10. Commitments and Contingencies
The Company leases office space in two commercial buildings and has other office equipment leases. For the two office leases the Company is also responsible for operating expenses and the leases contain escalation clauses. Rent expense, net of the change in liability related to the former headquarter space, for the years ended September 30, 2010, 2011 and 2012 was $94, $110, and $258, respectively.
The following is a schedule of future minimum rental payments required under all of the Company's operating lease agreements for the years ending September 30:
2013 |
$ | 342 | ||
2014 |
332 | |||
2015 |
292 | |||
2016 |
250 | |||
2017 |
98 | |||
|
$ | 1,314 | ||
The Company is involved from time to time in claims that arise in the normal course of its business. The Company is not presently subject to any material litigation nor, to management's knowledge, is any litigation threatened against the Company that collectively is expected to have a material adverse effect on the Company's cash flows, financial condition or results of operations.
11. Preferred Stock
The Company has authorized 10,000 shares of preferred stock, $0.001 par value per share, of which 1,015 redeemable Series A-1 preferred stock and 805 Series A-2 preferred stock were issued and outstanding at September 30, 2011 and 2012. Each holder of outstanding shares of redeemable Series A-1 preferred stock and Series A-2 preferred stock is entitled to the number of votes equal to the number of whole shares of common stock into which the shares of redeemable Series A-1 preferred stock and Series A-2 preferred stock held by such holder are convertible as described below. The holders of the preferred stock will vote together with the common stockholders as a single class. The shares of preferred stock have the following characteristics:
Dividends
Holders of redeemable Series A-1 preferred stock and Series A-2 preferred stock are entitled to cumulative dividends at the rate of 6.0% per annum of the original issue price per share of $9.94, payable when declared by the Board of Directors. A holder of redeemable Series A-1 preferred stock can waive their right to the dividend preference. After payment of the preferred dividend, the holders of redeemable Series A-1 preferred stock and Series A-2 preferred stock participate in dividends paid to common stockholders on an as-converted basis as described below. As of September 30, 2011 and 2012, cumulative unpaid dividends on the redeemable Series A-1 preferred stock of $2,421 and $3,026, respectively, were considered as part of the redemption value described below. Cumulative unpaid dividends on the Series A-2 preferred stock have no impact until declared. As of September 30, 2011 and 2012, no dividends have been declared on the Series A-2 preferred stock.
F-24
Textura Corporation
Notes to Consolidated Financial Statements (Continued)
(in thousands, except per share data)
11. Preferred Stock (Continued)
Liquidation Preference
In the event of liquidation, dissolution or winding up of the Company, the holders of redeemable Series A-1 preferred stock and Series A-2 preferred stock shall receive the first claim to the distributed net assets in the amount of $9.94 per share plus accrued but unpaid dividends. In the event there are not enough funds to cover distributions to all stockholders, the entire amount of assets available to be distributed will be distributed ratably among the holders of the preferred stock based on the total preferential amount each holder would be entitled to receive if sufficient funds were available.
Conversion
Immediately prior to an initial public offering, each share of redeemable Series A-1 preferred stock and Series A-2 preferred stock will be converted into common stock on a 1:2.84 basis. The conversion price is subject to change for stock splits, combinations, dividends and distributions. The Series A-2 preferred stock is considered to have a contingent beneficial conversion feature. Although this feature only applies in the event of a public offering, as of September 30, 2012, the fair value of such conversion feature would have been $21,141.
Series A-1 preferred stock have the following additional characteristics:
Board of Directors Representation
Holders of redeemable Series A-1 preferred stock are entitled to representation of one seat on the Board of Directors.
Series A-1 Redemption Right
The Series A-1 preferred stock is eligible for redemption at the option of the holder beginning in October 2014, the holders having waived their rights to require the Company to redeem the Series A-1 preferred stock until that date. At that time, to the extent the holders choose to redeem the stock, the Company would be required to raise additional capital or debt, or renegotiate redemption terms with the Series A-1 holders. There can be no assurances that the Company will be successful in executing one or more of these actions.
The carrying value of redeemable Series A-1 preferred stock is increased by periodic accretions so that the carrying value will equal the redemption value at the balance sheet date. The redeemable Series A-1 preferred stock is valued at $39,762 and $43,135 at September 30, 2011 and 2012, which was determined by using the greater of fair market value or the sum of $7.00 multiplied by 2.84 plus cumulative unpaid dividends. Accretion of $11,486 and $3,373 was charged to additional paid-in capital for the years ended September 30, 2011 and 2012, respectively.
12. Common Stock
The Company has authorized 90,000 shares of common stock with $0.001 par value per share. Holders of common stock are entitled to one vote per share on all matters to be voted on by the Company's stockholders. Dividends may be declared and paid on common stock, subject to laws and provisions in the Company's certificate of incorporation, and subject to the rights and privileges of the
F-25
Textura Corporation
Notes to Consolidated Financial Statements (Continued)
(in thousands, except per share data)
12. Common Stock (Continued)
preferred stockholders. In the event of liquidation, and if there are assets remaining after the distribution to the holders of preferred stock, then the remaining amount will be distributed to common stockholders in the amount of $3.75 per common share. If there are not enough funds to cover the payments to all of the common stockholders, then the distribution will be made ratably among all common stockholders based on the total amount each holder would have received if there were enough funds to cover all common stockholders.
Any remaining distributions to stockholders, after all of the distributions listed above have been made, will be made on a pro rata basis to all common stockholders based on the number of common shares held by each person. Preferred stockholders shall also participate in this distribution as if such preferred shares converted to common stock, consistent with the conversion formula relevant upon an initial public offering as described above.
13. Share-Based Compensation to Employees
The Company's 2008 Employee Stock Incentive Plan (the Plan) permits the grant of share-based awards to its employees. Option awards are generally granted with an exercise price equal to the market price of the Company's stock at the date of grant. Options granted during 2010, 2011 and 2012 generally vest over four-year periods. In general, the options expire after a period not exceeding ten years. The weighted average grant date fair value of stock options granted during the years ended September 30, 2010, 2011 and 2012 was $6.49, $5.91 and $6.39, respectively, and was estimated using the Black-Scholes option-pricing model with the following weighted average assumptions:
| |
2010 | 2011 | 2012 | |||||||
|---|---|---|---|---|---|---|---|---|---|---|
Expected dividend yield |
— | — | — | |||||||
Expected volatility |
53.4 | % | 50.5 | % | 53.6 | % | ||||
Risk-free interest rate |
2.46 | % | 2.05 | % | 1.00 | % | ||||
Expected term (years) |
5.93 | 6.07 | 5.87 | |||||||
The Company's expected volatility assumption used in the Black-Scholes option pricing model was based on peer group information, and the expected life assumption used the midpoint in estimating the expected term given the lack of historical exercise activity. The expected term is calculated as the midpoint between the vesting term and contractual term of the award. The risk-free interest rate used in the Black-Scholes model was based on the implied yield currently available on U.S. Treasury zero-coupon issues with a remaining term equal to the Company's expected term assumption. The Company has never declared dividends on its shares and has no current plans to declare such dividends that would require a dividend yield assumption other than zero for inclusion in the pricing model.
F-26
Textura Corporation
Notes to Consolidated Financial Statements (Continued)
(in thousands, except per share data)
13. Share-Based Compensation to Employees (Continued)
A summary of stock option activity is presented below:
| |
Years Ended September 30, | ||||||||||||||||||
|---|---|---|---|---|---|---|---|---|---|---|---|---|---|---|---|---|---|---|---|
| |
2010 | 2011 | 2012 | ||||||||||||||||
| |
Options | Weighted Average Exercise Price |
Options | Weighted Average Exercise Price |
Options | Weighted Average Exercise Price |
|||||||||||||
Outstanding, beginning of period |
1,318 | $ | 14.78 | 1,762 | $ | 14.20 | 1,836 | $ | 13.84 | ||||||||||
Granted |
544 | 13.04 | 298 | 10.03 | 740 | 13.48 | |||||||||||||
Exercised |
|||||||||||||||||||
Forfeited |
(100 | ) | 15.47 | (224 | ) | 11.59 | (128 | ) | 13.42 | ||||||||||
Outstanding, end of period |
1,762 | 14.20 | 1,836 | 13.84 | 2,448 | 13.76 | |||||||||||||
The following table summarizes stock options outstanding and exercisable at September 30, 2012:
| |
Outstanding | Exercisable | |||||||||||||||||
|---|---|---|---|---|---|---|---|---|---|---|---|---|---|---|---|---|---|---|---|
| |
Options | Weighted Average Exercise Price |
Weighted Average Remaining Contractual Life (Years) |
Options | Weighted Average Exercise Price |
Weighted Average Remaining Contractual Life (Years) |
|||||||||||||
Exercise price |
|||||||||||||||||||
$3.27 - $4.91 |
80 | $ | 3.50 | 4.04 | 80 | $ | 3.50 | 4.04 | |||||||||||
$9.82 - $11.45 |
446 | 10.03 | 8.31 | 198 | 10.03 | 8.13 | |||||||||||||
$11.46 - $13.09 |
644 | 12.91 | 8.11 | 186 | 12.63 | 5.01 | |||||||||||||
$14.73 - $16.36 |
1,278 | 16.13 | 5.97 | 1,084 | 16.26 | 5.51 | |||||||||||||
|
2,448 | 13.76 | 6.89 | 1,548 | 14.36 | 5.71 | |||||||||||||
The intrinsic value of vested and outstanding stock options at September 30, 2012 is $1,253 and $3,110, respectively. As of September 30, 2012, the Company had $4,348 of total unrecognized compensation expense related to non-vested employee options that will be recognized over a weighted average period of 2.28 years.
Share-based compensation expense for employee option grants was $2,125, $1,468 and $2,676 for the years ended September 30, 2010, 2011 and 2012, respectively.
F-27
Textura Corporation
Notes to Consolidated Financial Statements (Continued)
(in thousands, except per share data)
13. Share-Based Compensation to Employees (Continued)
The expense is reflected in the following captions in the statements of operations:
| |
Years Ended September 30, |
|||||||||
|---|---|---|---|---|---|---|---|---|---|---|
| |
2010 | 2011 | 2012 | |||||||
Cost of services |
$ | 222 | $ | 171 | $ | 203 | ||||
General and administrative |
1,249 | 955 | 1,588 | |||||||
Sales and marketing |
357 | (58 | ) | 298 | ||||||
Technology and development |
297 | 400 | 587 | |||||||
Total |
$ | 2,125 | $ | 1,468 | $ | 2,676 | ||||
Under the Plan, the Company also grants restricted stock units (RSUs) to eligible employees and directors. The stated vesting of these grants generally ranges from immediate to three years, but the RSUs only become payable to employees in cash or shares of Company stock if there is a change in control of the Company or termination of the agreements in connection with an initial public offering. As the Company determined that neither of these events was probable, the Company has not recognized any share-based compensation expense related to the RSU awards. For certain RSUs that are not vested upon a liquidity event, we will recognize share-based compensation over the future service period, if any, based on the initial public offering price. As of September 30, 2012, 274 RSUs were vested according to their stated vesting terms and will not be forfeited should employment terminate prior to the liquidity condition being met.
A summary of RSU activity is presented below:
| |
Years Ended September 30, | ||||||||||||||||||
|---|---|---|---|---|---|---|---|---|---|---|---|---|---|---|---|---|---|---|---|
| |
2010 | 2011 | 2012 | ||||||||||||||||
| |
RSUs | Weighted Average Grant Date Fair Value |
RSUs | Weighted Average Grant Date Fair Value |
RSUs | Weighted Average Grant Date Fair Value |
|||||||||||||
Outstanding, beginning of period |
232 | $ | 16.26 | 232 | $ | 16.26 | 348 | $ | 14.20 | ||||||||||
Granted |
— | — | 116 | 10.47 | 286 | 13.03 | |||||||||||||
Vested |
— | — | — | — | — | — | |||||||||||||
Forfeited |
— | — | — | — | (4 | ) | 13.03 | ||||||||||||
Outstanding, end of period |
232 | 16.26 | 348 | 14.20 | 630 | 13.74 | |||||||||||||
14. Warrants
Warrants Issued to Customers and Service Providers
The Company issues warrants to certain non-employees as an incentive to do business. All warrants granted to customers and other non-employees were exercisable as of September 30, 2012. These warrants expire five to seven years from the date of the grant.
On August 14, 2011, warrants were issued to the bank as part of the renegotiation of the loan referenced in Note 8, which were exercisable immediately. The warrants were recorded as debt issuance
F-28
Textura Corporation
Notes to Consolidated Financial Statements (Continued)
(in thousands, except per share data)
14. Warrants (Continued)
costs and amortized to interest expense over the life of the note. These warrants expire 10 years and 1 month from the grant date.
Warrants Issued for Referral Fees
The Company granted fully vested warrants to certain non-employees in exchange for successful introductions that subsequently generated revenue for the Company. The value of warrants granted in association with referral fees was $67 in the year ended September 30, 2010. The warrants were recorded as an expense in the consolidated statement of operations. There were no warrants granted for referral fees in 2011 or 2012.
Warrants Issued for Fundraising
The Company granted warrants to certain non-employees in exchange for successful introductions that subsequently generated capital for the Company during its funding rounds. Costs associated with warrants issued for fundraising efforts are considered stock issuance costs associated with the respective capital balances of those introduced and reflected as contra-equity.
Warrants Issued With Convertible Debentures
The Company granted warrants in connection with the convertible debenture securities issued as described in Note 7. The value of warrants credited to equity in the years ended September 30, 2010, 2011 and 2012 was $1,149, $969 and $1,660, respectively, and was determined based upon the relative fair value of the debt and detachable warrants as of the time of issuance. Additionally, the Company issued fully-vested warrants in May 2011 and August 2011 in conjunction with the conversion of the 2009 and 2010 Debentures. The fair value of the warrants of $340 was recognized as interest expense. These warrants expire five to ten years from the date of the grant. Warrants outstanding as of September 30, 2012 were as follows:
| |
Share Class | Vesting Date | Warrants Granted |
Warrants Exercised |
Warrants Expired |
Warrants Outstanding |
Weighted Average Exercise Price |
|||||||||||||
|---|---|---|---|---|---|---|---|---|---|---|---|---|---|---|---|---|---|---|---|---|
Fundraising |
Common | Various 2005 | 2 | — | 2 | — | $ | — | ||||||||||||
Fundraising |
A-2 Preferred | Various 2006 | 59 | — | — | 59 | 7.00 | |||||||||||||
Customers |
A-2 Preferred | January 2006 | 3 | — | 3 | — | — | |||||||||||||
Service providers |
Common | August 2007 | 26 | 26 | — | — | — | |||||||||||||
Fundraising |
Common | November 2007 | 24 | — | — | 24 | 12.38 | |||||||||||||
Convertible debenture |
Common | Various 2009 | 324 | — | — | 324 | 16.26 | |||||||||||||
Convertible debenture |
Common | Various 2010 | 398 | — | — | 398 | 13.25 | |||||||||||||
Referral Fees |
Common | June 2010 | 20 | — | — | 20 | 13.25 | |||||||||||||
Convertible debenture |
Common | May 2011 | 48 | — | — | 48 | 16.26 | |||||||||||||
Mortgage renewal |
Common | August 2011 | 20 | — | — | 20 | 15.00 | |||||||||||||
Convertible debenture |
Common | August 2011 | 32 | — | — | 32 | 13.25 | |||||||||||||
Convertible debenture |
Common | September 2011 | 56 | — | — | 56 | 15.00 | |||||||||||||
Convertible debenture |
Common | Various 2012 | 326 | — | — | 326 | 15.00 | |||||||||||||
|
1,338 | 26 | 5 | 1,307 | 14.03 | |||||||||||||||
F-29
Textura Corporation
Notes to Consolidated Financial Statements (Continued)
(in thousands, except per share data)
15. Income Taxes
The pretax loss attributable to Textura Corporation is summarized as follows:
| |
Years Ended September 30, |
|||||||||
|---|---|---|---|---|---|---|---|---|---|---|
| |
2010 | 2011 | 2012 | |||||||
Domestic |
$ | (16,249 | ) | $ | (18,853 | ) | $ | (15,858 | ) | |
Foreign |
326 | (75 | ) | (70 | ) | |||||
Loss before taxes |
$ | (15,923 | ) | $ | (18,928 | ) | $ | (15,928 | ) | |
The (provision) benefit for income taxes consists of the following components:
| |
Years Ended September 30, |
|||||||||
|---|---|---|---|---|---|---|---|---|---|---|
| |
2010 | 2011 | 2012 | |||||||
Current |
||||||||||
Federal |
$ | (5,312 | ) | $ | (4,922 | ) | $ | (1,661 | ) | |
State |
(149 | ) | (259 | ) | (59 | ) | ||||
Foreign |
— | — | — | |||||||
Total current |
(5,461 | ) | (5,181 | ) | (1,720 | ) | ||||
Deferred |
||||||||||
Federal |
$ | (180 | ) | $ | (1,680 | ) | $ | (3,903 | ) | |
State |
157 | 119 | (85 | ) | ||||||
Foreign |
(10 | ) | (10 | ) | (9 | ) | ||||
Total deferred |
(33 | ) | (1,571 | ) | (3,997 | ) | ||||
Change in valuation allowance |
5,494 | 6,752 | 5,717 | |||||||
Total |
$ | — | $ | — | $ | — | ||||
F-30
Textura Corporation
Notes to Consolidated Financial Statements (Continued)
(in thousands, except per share data)
15. Income Taxes (Continued)
The Company's deferred tax assets and liabilities consisted of the following:
| |
As of September 30, | ||||||
|---|---|---|---|---|---|---|---|
| |
2011 | 2012 | |||||
Property and equipment |
$ | 186 | $ | 150 | |||
Intangible assets |
— | 177 | |||||
Deferred revenue |
26 | 101 | |||||
Accrued compensation |
— | 1,640 | |||||
Share-based compensation |
3,257 | 4,136 | |||||
Accrued interest |
— | 657 | |||||
Net operating loss carryforwards |
26,306 | 28,022 | |||||
Other |
179 | 428 | |||||
Deferred tax assets |
29,954 | 35,311 | |||||
Valuation allowance |
(29,446 | ) | (35,151 | ) | |||
Total deferred tax assets |
508 | 160 | |||||
Software |
(456 | ) | — | ||||
Convertible debt—beneficial conversion feature |
— | (160 | ) | ||||
Goodwill |
— | (160 | ) | ||||
Other |
(52 | ) | — | ||||
Total deferred tax liabilities |
(508 | ) | (320 | ) | |||
Net deferred tax liabilities |
$ | — | $ | (160 | ) | ||
The reconciliation of the statutory federal rate of 35.0% to the effective income tax rate for the years ended September 30, 2010, 2011 and 2012 is as follows:
| |
Years Ended September 30, | |||||||||
|---|---|---|---|---|---|---|---|---|---|---|
| |
2010 | 2011 | 2012 | |||||||
Tax provision (benefit) at the statutory rate |
(35.0 | )% | (35.0 | )% | (35.0 | )% | ||||
State taxes, net of federal benefit |
(1.1 | ) | (1.8 | ) | (1.2 | ) | ||||
Other |
1.6 | 1.1 | 0.3 | |||||||
Valuation allowance |
34.5 | 35.7 | 35.9 | |||||||
Effective tax rate |
0.0 | % | 0.0 | % | 0.0 | % | ||||
As of September 30, 2012, the Company had federal and state net operating loss carry-forwards (after tax) of $26,029 and $1,993, respectively. Federal and state net operating loss carry-forwards expire beginning the year 2014 through the year 2031, the majority of which expire in excess of ten years.
In assessing the realizability of deferred tax assets, the Company considers whether it is more likely than not that some portion or all of the deferred tax assets will not be realized. The Company considered the scheduled reversal of deferred tax liabilities, projected future taxable income, and certain distinct tax planning strategies in making this assessment. If changes occur in the assumption
F-31
Textura Corporation
Notes to Consolidated Financial Statements (Continued)
(in thousands, except per share data)
15. Income Taxes (Continued)
underlying the Company's tax planning strategies or in the scheduling of the reversal of the Company's deferred tax liabilities, the valuation allowance may need to be adjusted in the future. The Company has recorded a full valuation allowance against its deferred tax assets.
The Company endeavors to comply with tax laws and regulations where it does business, but cannot guarantee that, if challenged, the Company's interpretation of all relevant tax laws and regulations will prevail and that all tax benefits recorded in the financial statements will ultimately be recognized in full. The Company has taken reasonable efforts to address uncertain tax positions, and has determined that there are no material transactions or material tax positions taken by the Company that would fail to meet the more-likely-than-not threshold for recognizing transactions or tax positions in the financial statements. Accordingly, the Company has not recorded a reserve for uncertain tax positions in the financial statements, and the Company does not expect any significant tax increase or decrease to occur within the next 12 months with respect to any transactions or tax positions taken and reflected in the financial statements. In making these determinations, the Company presumes that taxing authorities pursuing examinations of the Company's compliance with tax law filing requirements will have full knowledge of all relevant information, and, if necessary, the Company will pursue resolution of disputed tax positions by appeals or litigation.
16. Related Party Transactions
Included in the lease agreements described in Note 9 is the lease of the Company's Lake Bluff, Illinois offices, from a partnership that is an investor in the company, and of which certain partners are also investors in the Company. The lease was executed prior to the partnership's investment in the Company. Rent payments to the partnership were $197, $182 and $45 for the years ended September 30, 2010, 2011 and 2012, respectively.
In 2009 the Company entered into an agreement with an entity that is also an investor in the Company. The agreement compensates the entity for customer referrals based on revenues generated by the Company related to those customers. A warrant to purchase 20 common shares of the Company was issued pursuant to the referral agreement in the year ended September 30, 2010. In addition, in 2010 the Company entered into a service agreement with the entity, pursuant to which it was paid $1,000 in advance for software development services to improve software owned by the entity. This payment was deferred and recognized as revenue as development services were provided. The deferred revenue balance accrues interest and is increased by a portion of the referral fees due to this entity; the remainder of the referral fees due is paid in cash. The deferred revenue balance was $538 and $655 as of September 30, 2011 and 2012, respectively. The Company also provides hosting services to the entity for a fixed annual fee.
The Company maintains an operating account at a financial institution that is an investor in the Company. The banking relationship was established prior to the investment in the Company. The Company also holds a note payable with the same financial institution. The amount due on the note payable as of September 30, 2011 and 2012 was $11,219 and $10,719, respectively (see Note 8).
F-32
Textura Corporation
Notes to Consolidated Financial Statements (Continued)
(in thousands, except per share data)
17. Subsequent Events
In October 2012, the Company established a joint venture with operations in Australia and New Zealand. Textura Australasia Pty. Ltd. The Company owns 50% and has control over the significant management activities of the joint venture, including final approval of the annual business plan and appointment of the CEO.
In November 2012, the Company received notice from First Midwest Bank waiving, until December 31, 2013, the Company's requirement to comply with the debt service coverage ratio covenant at December 31, 2012.
In December 2012, the Company received notice from a majority of the holders of its redeemable Series A-1 stock waiving the stockholder's right to require the Company to redeem the stock until October 2014.
On December 31, 2012 holders of convertible debentures elected to convert their convertible debentures to common stock in accordance with the terms of the debenture agreement. The outstanding principal and interest as of December 31, 2012 was $12,393, which converted into 826 common shares and resulted in interest expense of $1,520 from unamortized debt discounts recognized upon conversion. As of December 31, 2012, $5,429 of convertible debentures remained outstanding.
The Company has evaluated subsequent events through January 9, 2013, the date on which the financial statements were originally issued, and through April 5, 2013, the date on which the financial statements were reissued.
F-33
Textura Corporation
Schedule II—Valuation and Qualifying Accounts
(in thousands)
Valuation allowance for Doubtful Accounts
|
Balance at beginning of period |
Additions / Charges |
Deductions(1) | Balance at end of period |
|||||||||
|---|---|---|---|---|---|---|---|---|---|---|---|---|---|
Year ended September 30, 2010 |
|||||||||||||
Valuation allowance for doubtful accounts |
$ | — | $ | — | $ | — | $ | — | |||||
Year ended September 30, 2011 |
|||||||||||||
Valuation allowance for doubtful accounts |
— | 24 | — | 24 | |||||||||
Year ended September 30, 2011 |
|||||||||||||
Valuation allowance for doubtful accounts |
24 | 59 | (24 | ) | 59 | ||||||||
- (1)
- Write-offs, net of recoveries
F-34
Textura Corporation
Condensed Consolidated Balance Sheets
(in thousands, except per share amounts)
(unaudited)
| |
September 30, 2012 |
June 30, 2013 |
|||||
|---|---|---|---|---|---|---|---|
Assets |
|||||||
Current assets |
|||||||
Cash and cash equivalents |
$ | 4,174 | $ | 68,627 | |||
Accounts receivable, net of allowance for doubtful accounts of $59 and $137 at September 30, 2012 and June 30, 2013, respectively |
1,621 | 2,713 | |||||
Prepaid expenses and other current assets |
701 | 1,348 | |||||
Total current assets |
6,496 | 72,688 | |||||
Property and equipment, net |
17,775 | 18,701 | |||||
Restricted cash |
1,000 | 1,230 | |||||
Goodwill |
17,949 | 23,937 | |||||
Intangible assets, net |
7,722 | 10,221 | |||||
Other assets |
157 | 258 | |||||
Total assets |
$ | 51,099 | $ | 127,035 | |||
Liabilities, Redeemable Securities and Stockholders' Equity (Deficit) |
|||||||
Current liabilities |
|||||||
Accounts payable |
$ | 1,055 | $ | 2,114 | |||
Accrued expenses |
6,852 | 7,059 | |||||
Deferred revenue, short-term |
12,793 | 17,061 | |||||
Notes and leases payable, short-term |
87 | 612 | |||||
Loan payable to related party, short-term |
500 | 500 | |||||
Total current liabilities |
21,287 | 27,346 | |||||
Deferred revenue, long-term |
1,373 | 1,704 | |||||
Convertible debentures |
15,888 | — | |||||
Notes and leases payable, long-term |
— | 695 | |||||
Loan payable to related party, long-term |
10,219 | 9,969 | |||||
Other long-term liabilities |
599 | 405 | |||||
Total liabilities |
49,366 | 40,119 | |||||
Contingencies (Note 6) |
|||||||
Redeemable Series A-1 preferred stock, $.001 par value; 1,441 shares authorized and 1,015 shares issued and outstanding at September 30, 2012; no shares authorized, issued or outstanding at June 30 2013 |
43,135 | — | |||||
Redeemable non-controlling interest |
— | 366 | |||||
Stockholders' equity (deficit) |
|||||||
Series A-2 preferred stock, $.001 par value; 1,058 shares authorized and 805 shares issued and outstanding at September 30, 2012; no shares authorized, issued or outstanding at June 30 2013 |
1 | — | |||||
Preferred stock, $.001 par value; 10,000 authorized; 0 shares issued and outstanding |
— | — | |||||
Common stock, $.001 par value; 90,000 shares authorized; 8,992 and 23,260 shares issued and 8,570 and 22,799 shares outstanding at September 30, 2012 and June 30, 2013 |
9 | 23 | |||||
Additional paid in capital |
95,389 | 262,294 | |||||
Treasury stock, at cost; 462 and 422 shares at June 30, 2013 and September 30, 2012 |
(5,231 | ) | (5,831 | ) | |||
Accumulated other comprehensive loss |
— | (26 | ) | ||||
Accumulated deficit |
(141,252 | ) | (169,910 | ) | |||
Total Textura Corporation stockholders' equity (deficit) |
(51,084 | ) | 86,550 | ||||
Non-controlling interest |
9,682 | — | |||||
Total equity (deficit) |
(41,402 | ) | 86,550 | ||||
Total liabilities, redeemable securities and equity (deficit) |
$ | 51,099 | $ | 127,035 | |||
The accompanying notes are an integral part of these condensed consolidated financial statements.
F-35
Textura Corporation
Condensed Consolidated Statements of Operations
(in thousands, except per share amounts)
(unaudited)
| |
Nine months ended June 30, |
||||||
|---|---|---|---|---|---|---|---|
| |
2012 | 2013 | |||||
Revenue |
$ | 15,362 | $ | 24,681 | |||
Operating expense |
|||||||
Cost of services (exclusive of depreciation and amortization shown separately below) |
4,361 | 8,222 | |||||
General and administrative |
8,180 | 17,074 | |||||
Sales and marketing |
4,162 | 9,535 | |||||
Technology and development |
8,433 | 13,703 | |||||
Depreciation and amortization |
3,018 | 3,167 | |||||
Total operating expense |
28,154 | 51,701 | |||||
Loss from operations |
(12,792 | ) | (27,020 | ) | |||
Other expense, net |
|||||||
Interest income |
4 | 10 | |||||
Interest expense |
(1,639 | ) | (4,505 | ) | |||
Change in fair value of conversion option liability |
133 | 440 | |||||
Total other expense, net |
(1,502 | ) | (4,055 | ) | |||
Loss before income taxes |
(14,294 | ) | (31,075 | ) | |||
Income tax provision |
— | 226 | |||||
Net loss |
(14,294 | ) | (31,301 | ) | |||
Less: Net loss attributable to non-controlling interests |
(1,966 | ) | (2,643 | ) | |||
Net loss attributable to Textura Corporation |
(12,328 | ) | (28,658 | ) | |||
Accretion of redeemable Series A-1 preferred stock |
656 | 3,549 | |||||
Accretion of redeemable non-controlling interest |
— | 222 | |||||
Dividends on Series A-2 preferred stock |
360 | 335 | |||||
Beneficial conversion of Series A-2 preferred stock |
— | 7,161 | |||||
Net loss available to Textura Corporation common stockholders |
$ | (13,344 | ) | $ | (39,925 | ) | |
Net loss per share available to Textura Corporation common stockholders, basic and diluted |
$ | (1.56 | ) | $ | (3.87 | ) | |
Weighted-average number of common shares outstanding, basic and diluted |
8,544 | 10,315 | |||||
The accompanying notes are an integral part of these condensed consolidated financial statements.
F-36
Textura Corporation
Condensed Consolidated Statement of Redeemable Non-Controlling Interest and Stockholders' Equity
(in thousands)
(unaudited)
| |
|
|
|
|
|
|
|
|
|
|
|
|
|
Total Textura Corporation Stockholders' Equity (Deficit) |
|
|
|||||||||||||||||||||||||||||||||
|---|---|---|---|---|---|---|---|---|---|---|---|---|---|---|---|---|---|---|---|---|---|---|---|---|---|---|---|---|---|---|---|---|---|---|---|---|---|---|---|---|---|---|---|---|---|---|---|---|---|
| |
Redeemable Series A-1 Preferred Stock |
Redeemable Common Stock |
|
Series A-2 Preferred Stock |
Common Stock |
|
|
|
|
|
|
||||||||||||||||||||||||||||||||||||||
| |
Redeemable Non- Controlling Interest |
|
|
Accumulated Other Comprehensive Loss |
|
|
|
||||||||||||||||||||||||||||||||||||||||||
| |
Additional Paid-In Capital |
Treasury Stock |
Accumulated Deficit |
Non- Controlling Interest |
Total Equity (Deficit) |
||||||||||||||||||||||||||||||||||||||||||||
| |
Shares | Amount | Shares | Amount | Shares | Amount | Shares | Amount | |||||||||||||||||||||||||||||||||||||||||
Balances at September 30, 2012 |
1,015 | $ | 43,135 | — | $ | — | $ | — | 805 | $ | 1 | 8,570 | $ | 9 | $ | 95,389 | $ | (5,231 | ) | $ | — | $ | (141,252 | ) | $ | (51,084 | ) | $ | 9,682 | $ | (41,402 | ) | |||||||||||||||||
Share-based compensation |
— | — | — | — | — | — | — | — | — | 11,228 | — | — | — | 11,228 | — | 11,228 | |||||||||||||||||||||||||||||||||
Investment in Textura Australasia, Pty Ltd |
— | — | — | — | 407 | — | — | — | — | — | — | — | — | — | — | — | |||||||||||||||||||||||||||||||||
Acquisition of PlanSwift |
— | — | 539 | 7,898 | — | — | — | — | — | — | — | — | — | — | — | — | |||||||||||||||||||||||||||||||||
Exercise of Series A-2 preferred stock warrants |
— | — | — | — | — | 59 | — | — | — | 412 | — | — | — | 412 | — | 412 | |||||||||||||||||||||||||||||||||
Redeemable Series A-1 preferred stock accretion |
— | 3,549 | — | — | — | — | — | — | — | (3,549 | ) | — | — | — | (3,549 | ) | — | (3,549 | ) | ||||||||||||||||||||||||||||||
Issuance of common stock in connection with IPO, net of offering costs of $8,541 |
— | — | — | — | — | — | — | 5,750 | 6 | 77,703 | — | — | — | 77,709 | — | 77,709 | |||||||||||||||||||||||||||||||||
Conversion of convertible debentures into common stock |
— | — | — | — | — | — | — | 1,269 | 1 | 19,034 | — | — | — | 19,035 | — | 19,035 | |||||||||||||||||||||||||||||||||
Conversion of convertible A-1 and A-2 preferred stock into common stock upon IPO |
(1,015 | ) | (46,684 | ) | — | — | — | (864 | ) | (1 | ) | 5,748 | 6 | 46,684 | — | — | — | 46,689 | — | 46,689 | |||||||||||||||||||||||||||||
Conversion of Submittal Exchange Holdings Class A preferred units into common stock upon IPO |
— | — | — | — | — | — | — | 963 | 1 | 7,282 | — | — | — | 7,283 | (7,283 | ) | — | ||||||||||||||||||||||||||||||||
Reclassification of redeemable common stock upon IPO |
— | — | (539 | ) | (7,898 | ) | — | — | — | 539 | — | 7,898 | — | — | — | 7,898 | — | 7,898 | |||||||||||||||||||||||||||||||
Fair value of warrants reclassified to equity upon IPO |
— | — | — | — | — | — | — | — | — | 435 | — | — | — | 435 | — | 435 | |||||||||||||||||||||||||||||||||
Repurchase of common shares at cost |
— | — | — | — | — | — | — | (40 | ) | — | — | (600 | ) | — | — | (600 | ) | — | (600 | ) | |||||||||||||||||||||||||||||
Net loss |
— | — | — | — | (244 | ) | — | — | — | — | — | — | — | (28,658 | ) | (28,658 | ) | (2,399 | ) | (31,057 | ) | ||||||||||||||||||||||||||||
Foreign currency translation |
— | — | — | — | (19 | ) | — | — | — | — | — | — | (26 | ) | — | (26 | ) | — | (26 | ) | |||||||||||||||||||||||||||||
Redeemable non-controlling interest accretion |
— | — | — | — | 222 | — | — | — | — | (222 | ) | — | — | — | (222 | ) | — | (222 | ) | ||||||||||||||||||||||||||||||
Balances at June 30, 2013 |
— | $ | — | — | $ | — | $ | 366 | — | $ | — | 22,799 | $ | 23 | $ | 262,294 | $ | (5,831 | ) | $ | (26 | ) | $ | (169,910 | ) | $ | 86,550 | $ | — | $ | 86,550 | ||||||||||||||||||
The accompanying notes are an integral part of these condensed consolidated financial statements.
F-37
Textura Corporation
Condensed Consolidated Statements of Cash Flows
(in thousands)
(unaudited)
| |
Nine months ended June 30, |
||||||
|---|---|---|---|---|---|---|---|
| |
2012 | 2013 | |||||
Cash flows from operating activities |
|||||||
Net loss |
$ | (14,294 | ) | $ | (31,301 | ) | |
Adjustments to reconcile net loss to cash used in operating activities |
|||||||
Depreciation and amortization |
3,015 | 3,151 | |||||
Non-cash interest expense |
1,123 | 3,661 | |||||
Change in fair value of conversion option liability |
(133 | ) | (440 | ) | |||
Share-based compensation |
2,077 | 11,228 | |||||
Changes in operating assets and liabilities, net of acquisitions: |
|||||||
Accounts receivable |
(604 | ) | (1,021 | ) | |||
Prepaid expenses and other assets |
(191 | ) | (397 | ) | |||
Deferred revenue, including long-term portion |
4,418 | 4,114 | |||||
Accounts payable |
(3 | ) | 577 | ||||
Accrued expenses and other |
1,416 | (806 | ) | ||||
Net cash used in operating activities |
(3,176 | ) | (11,234 | ) | |||
Cash flows from investing activities |
|||||||
Increase in restricted cash |
(100 | ) | (230 | ) | |||
Purchases of property and equipment |
(359 | ) | (741 | ) | |||
Partner's investment in joint venture |
— | 407 | |||||
Acquisitions of businesses, net of cash acquired |
(12,349 | ) | (989 | ) | |||
Net cash used in investing activities |
(12,808 | ) | (1,553 | ) | |||
Cash flows from financing activities |
|||||||
Principal payments on loan payable |
(250 | ) | (251 | ) | |||
Payments on capital leases |
— | (128 | ) | ||||
Proceeds from debt issuances |
— | 6,476 | |||||
Repayments of debt |
— | (7,964 | ) | ||||
Proceeds from debentures |
13,004 | — | |||||
Proceeds from issuance of warrants |
1,660 | 454 | |||||
Proceeds from exercise of warrants |
— | 411 | |||||
Deferred financing costs |
— | (157 | ) | ||||
Proceeds from issuance of common stock in IPO, net of underwriting discounts and commissions and other offering costs |
— | 79,038 | |||||
Repurchase of common shares |
— | (600 | ) | ||||
Net cash provided by financing activities |
14,414 | 77,279 | |||||
Effect of change in foreign exchange rates on cash and cash equivalents |
— | (39 | ) | ||||
Net increase (decrease) in cash and cash equivalents |
(1,570 | ) | 64,453 | ||||
Cash and cash equivalents |
|||||||
Beginning of period |
5,941 | 4,174 | |||||
End of period |
$ | 4,371 | $ | 68,627 | |||
Supplemental cash flow data: |
|||||||
Cash paid for interest |
$ | 472 | $ | 441 | |||
Non-cash investing and financing activities: |
|||||||
Accretion of redeemable Series A-1 preferred stock |
$ | 656 | $ | 3,549 | |||
Accretion of redeemable non-controlling interest |
$ | — | $ | 222 | |||
Assets acquired under capital lease |
$ | — | $ | 903 | |||
Deferred offering and financing costs |
$ | — | $ | 1,328 | |||
Conversion of convertible A-1 and A-2 preferred stock into common stock upon IPO |
$ | — | $ | 46,684 | |||
Issuance of common stock upon conversion of debentures |
$ | — | $ | 16,784 | |||
Conversion of Submittal Exchange Holding Class A preferred units into common stock upon IPO |
$ | — | $ | 7,282 | |||
Reclassification of redeemable common stock upon IPO |
$ | — | $ | 7,898 | |||
Fair value of warrants reclassified to equity upon IPO |
$ | — | $ | 435 | |||
The accompanying notes are an integral part of these condensed consolidated financial statements.
F-38
Textura Corporation
Notes to Condensed Consolidated Financial Statements
(in thousands, except per share data)
(unaudited)
1. Summary of Significant Accounting Policies
Basis of Presentation and Principles of Consolidation
These unaudited condensed consolidated financial statements are prepared in accordance with accounting principles generally accepted in the United States of America ("U.S. GAAP"). In accordance with U.S. GAAP requirements for interim financial statements, these condensed consolidated financial statements do not include certain information and note disclosures that are normally included in annual financial statements prepared in conformity with U.S. GAAP. Accordingly, these condensed consolidated financial statements should be read in conjunction with the consolidated financial statements and the notes thereto as of September 30, 2011 and 2012 and for each of the three years in the period ended September 30, 2012. In the Company's opinion, the condensed consolidated financial statements contain all adjustments (which are of a normal, recurring nature) necessary to present fairly, in all material respects, the financial position as of June 30, 2013 and the results of operations and cash flows for the nine months ended June 30, 2012 and 2013, in conformity with U.S. GAAP. Interim results may not be indicative of results that may be realized for the full year.
In October 2012, the Company and Minter Ellison, a law firm in Australia, formed a joint venture, Textura Australasia, Pty. Ltd. (the "Joint Venture"), to offer the Company's construction collaboration software solutions to the Australia and New Zealand markets. Both parties contributed cash of $400, denominated in Australian dollars, for their respective 50% interests in the Joint Venture. The Company has consolidated the financial results of the Joint Venture because the Company has determined that the Joint Venture is a variable interest entity and that it is the primary beneficiary. The Company is the primary beneficiary of the Joint Venture due to its controlling financial interest through its authority with regard to hiring key employees and decision making of its central operations. Due to certain redemption provisions in the Joint Venture agreement, the Company has reflected Minter Ellison's financial interest as redeemable non-controlling interest in the condensed consolidated balance sheet at its redemption value.
On March 28, 2013, the Company's Board of Directors declared a two-for-one stock split of the Company's common stock in the form of a stock dividend and approved an amendment to the Company's certificate of incorporation to increase the number of authorized shares of its common stock from 20,000 to 90,000. All numbers of shares and per share amounts in these condensed consolidated financial statements have been adjusted to reflect the two-for-one stock split on a retroactive basis. Stockholders' equity reflects the stock split by reclassifying from "Additional paid-in capital" to "Common stock" an amount equal to the par value of the additional shares arising from the split. The stock split was effective on May 20, 2013.
On June 12, 2013, the Company completed the IPO of 5,750 shares of common stock, including 750 shares sold pursuant to the underwriters' option to purchase additional shares, at an offering price of $15.00 per share. The Company received proceeds from the IPO of $80,213, net of underwriting discounts and commissions of $6,037, but before other offering costs of $2,504. All outstanding shares of the Company's Series A-1 and Series A-2 preferred stock, including accrued dividends, the Submittal Exchange Holdings LLC Class A preferred units and the outstanding convertible debentures, including both principal and accrued paid-in-kind interest, were automatically converted to shares of common stock in connection with the IPO (see Note 10 for further details).
F-39
Textura Corporation
Notes to Condensed Consolidated Financial Statements (Continued)
(in thousands, except per share data)
(unaudited)
1. Summary of Significant Accounting Policies (Continued)
Revenue Recognition
For the Company's CPM, Submittal Exchange, and Greengrade solutions, the Company earns revenue from owners/developers, general contractors and architects in the form of project fees and monthly fees; and from subcontractors in the form of usage fees. For the Company's GradeBeam and PQM solutions, the Company earns revenue in the form of subscription fees. The Company's arrangements do not contain general rights of return and do not provide customers with the right to take possession of the software supporting the solutions and, as a result, are accounted for as service contracts.
All of the Company's on-demand solutions include training and support. The Company evaluates whether the individual deliverables in its arrangements qualify as separate units of accounting. In order to treat deliverables in a multiple deliverable arrangement as separate units of accounting, the deliverables must have standalone value upon delivery. In determining whether deliverables have standalone value, the Company considers whether solutions are sold to new customers without training and support, the nature of the training and support provided and the availability of the training and support from other vendors. The Company concluded that training and support do not have standalone value because they are never sold separately, do not have value to the customer without the solution and are not available from other vendors. Accordingly, the training and support are combined with the solution and treated as a single unit of accounting.
The Company recognizes this revenue when there is evidence that an agreement exists with the customer and the customer has begun deriving benefit from use of the solution, the fee is fixed and determinable, delivery of services has occurred, and collection of payment from the project participant is reasonably assured. The Company recognizes project fees and usage fees ratably over the average estimated life of the project and contract, respectively, and recognizes subscription fees over the subscription period. The average estimated life of the project and contract is estimated by management based on periodic review and analysis of historical data. The applicable estimated life is based on the project or contract value falling within certain predetermined ranges, as well as the solution on which the project is being managed. The Company performs periodic reviews of actual project and contract data and revises estimates as necessary. Estimated project life durations range from 5 to 29 months, and estimated contract life durations range from 5 to 14 months. Subscription periods typically range from 6 to 24 months.
For its PlanSwift solution, the Company earns revenue from the sale of software licenses and related maintenance and training. License revenue is recognized upon delivery of the license, maintenance revenue is recognized ratably over the period of the maintenance contract, which is generally one year, and training revenue is recognized when the services are delivered to the client. For multiple-element arrangements that include a perpetual license and either maintenance or both maintenance and training, the Company uses the residual method to determine the amount of license revenue to be recognized. Under the residual method, consideration is allocated to the undelivered elements based upon vendor-specific objective evidence of fair value ("VSOE") of those elements with the residual of the arrangement fee allocated to and recognized as license revenue. For subscription-
F-40
Textura Corporation
Notes to Condensed Consolidated Financial Statements (Continued)
(in thousands, except per share data)
(unaudited)
1. Summary of Significant Accounting Policies (Continued)
based licenses, which include maintenance, the Company recognizes the subscription fees ratably over the subscription periods, which typically range from 1 to 6 months.
The Company has established VSOE based on its historical pricing and discounting practices for maintenance and training when sold separately. In establishing VSOE, the Company requires that a substantial majority of the selling prices for these services fall within a reasonably narrow pricing range. The application of VSOE methodologies requires judgment, including the identification of individual elements in multiple element arrangements and whether there is VSOE of fair value for some or all elements.
Fair Value of Financial Instruments
Fair value is defined as the price that would be received from selling an asset or paid to transfer a liability in an orderly transaction between market participants at the measurement date. The fair value measurements are classified and disclosed in one of the following three categories:
Level 1—Valuations based on quoted prices in active markets for identical assets or liabilities;
Level 2—Valuations based on other than quoted prices in active markets for identical assets and liabilities, quoted market prices for identical or similar assets or liabilities in inactive markets, or other inputs that are observable or can be corroborated by observable market data for substantially the full term of the assets or liabilities;
Level 3—Valuations based on inputs that are generally unobservable and typically reflect management's estimate of assumptions that market participants would use in pricing the asset or liability.
The carrying amounts of cash and cash equivalents, accounts receivable, prepaid expenses and other current assets, restricted cash, accounts payable, and accrued expenses approximate fair value because of their short maturities. The carrying values of the bank loan payable, convertible debentures and notes payable approximate their fair values based on a comparison of the interest rate and terms of such debt to the rates and terms of similar debt available for each period.
The Company determined that certain embedded features of the convertible debentures (see Note 3) were required to be bifurcated and accounted for as derivatives prior to the IPO. Derivative financial instruments, warrants and beneficial conversion features were recorded as a discount to the convertible debentures and were amortized to interest expense. In connection with the IPO and the automatic conversion of the convertible debentures to common stock, the Company wrote off the unamortized discounts and the derivative financial instruments (see Notes 3 and 10).
In January and February 2013, in connection with a private placement of $6,750 of unsecured notes, the Company issued detachable warrants to purchase an aggregate of 86 shares of common stock with an exercise price equal to the greater of $13.92 and 90% of the price at which shares of common stock were offered in an IPO (see Note 5). The Company recorded the fair value of the warrants, calculated using the Black-Scholes model, as a discount to the notes and as a long-term liability since the exercise price was not fixed. In connection with the IPO, which fixed the exercise price, the fair
F-41
Textura Corporation
Notes to Condensed Consolidated Financial Statements (Continued)
(in thousands, except per share data)
(unaudited)
1. Summary of Significant Accounting Policies (Continued)
value of the warrants of $435 was reclassified from other long-term liabilities to additional paid-in capital on the condensed consolidated balance sheet.
Foreign Currency Transactions
The functional currency of the Company is the United States Dollar. Asset and liability balances denominated in a foreign currency are remeasured to U.S. dollars at end-of-period exchange rates. Foreign currency income and expenses are remeasured at average exchange rates in effect during the period. Foreign currency translation differences have not been material to date and have been included in the statement of operations as incurred through the second quarter of the fiscal year ending September 30, 2013. Beginning in the quarter ended June 30, 2013, the Company recorded foreign currency translation differences in accumulated other comprehensive income (loss).
Comprehensive Income (Loss)
The Company's comprehensive income (loss) is comprised of net income (loss) plus other comprehensive income (loss), which is comprised of foreign currency translation adjustments. For the nine months ended June 30, 2013, comprehensive loss was $31,346, of which $2,662 is attributable to the non-controlling interest.
Net Loss Per Share
Basic net loss per share available to Textura Corporation common stockholders is calculated by dividing the net loss available to Textura Corporation common stockholders by the weighted-average number of common shares outstanding, less any treasury shares, during the period.
Prior to the completion of the IPO, in calculating net loss available to common stockholders, cumulative undeclared preferred stock dividends on the Series A-2 preferred stock and accretion in the redemption value of the redeemable Series A-1 preferred stock and redeemable non-controlling interest were deducted from net loss attributable to Textura Corporation stockholders. Although the redeemable Series A-1 preferred stock, Series A-2 preferred stock, and non-controlling interest were participating securities, there was no allocation of the Company's net losses to these participating securities under the two-class method because they were not contractually required to share in the Company's losses. Subsequent to the IPO, which resulted in the automatic conversion of the outstanding preferred stock into common stock, the Company only deducts the redeemable non-controlling interest accretion from net loss attributable to Textura Corporation stockholders.
F-42
Textura Corporation
Notes to Condensed Consolidated Financial Statements (Continued)
(in thousands, except per share data)
(unaudited)
1. Summary of Significant Accounting Policies (Continued)
The following outstanding equity securities were excluded from the computation of diluted net loss per share available to Textura Corporation common stockholders as their inclusion would have been anti-dilutive:
| |
Nine Months Ended June 30, |
||||||
|---|---|---|---|---|---|---|---|
| |
2012 | 2013 | |||||
| |
(in thousands) |
||||||
Conversion of redeemable or convertible preferred stock |
5,564 | — | |||||
Conversion of Submittal Exchange Holdings Class A preferred units |
963 | — | |||||
Outstanding Restricted stock units |
622 | 696 | |||||
Outstanding stock options |
2,468 | 3,429 | |||||
Outstanding common and preferred warrants |
1,439 | 1,333 | |||||
Total excluded securities |
11,056 | 5,458 | |||||
2. Acquisitions
On October 19, 2011, the Company acquired certain assets and assumed certain liabilities of GradeBeam, LLC (GradeBeam). GradeBeam supports the process of obtaining construction bids, identifying potential bidders, inviting them to bid, and tracking bidding intent. Their solutions expand the Company's suite of solutions, especially in the planning phase of projects. The aggregate purchase price of $9,969 was paid in cash.
On November 7, 2011, the Company's subsidiary, Submittal Exchange Holdings, acquired all of the issued and outstanding membership units of Submittal Exchange. Submittal Exchange solutions enable the collection, review and routing of project documents and facilitates the management of environmental certification. Their solutions expand the Company's suite of solutions, especially in the exchange and management of project documents.
The Company received 85 Class A common units of Submittal Exchange Holdings, which represented an 18.3% economic interest in Submittal Exchange Holdings, in exchange for cash consideration of $2,404 and the payment of Submittal Exchange's notes payable of $403. In exchange for preferred units of Submittal Exchange, the former owners received 482 Class A preferred units of Submittal Exchange Holdings. These Class A preferred units are mandatorily convertible on a 1:2 basis into common shares of the Company under certain conditions, including a qualifying initial public offering. The Company has determined it has a controlling interest in Submittal Exchange Holdings because it has sole responsibility for operating the Submittal Exchange business. On matters other than liquidation, the Company has a 100% voting interest; on liquidation matters, the Company has a 15% voting interest. Distributions and allocation of profits or losses are done on a pro-rata capital basis until the respective basis in both classes is reduced to zero and thereafter at 99% to the Class A common units and 1% to the Class A preferred units.
F-43
Textura Corporation
Notes to Condensed Consolidated Financial Statements (Continued)
(in thousands, except per share data)
(unaudited)
2. Acquisitions (Continued)
Upon completion of the IPO, the Class A preferred units converted into 963 shares of the Company's common stock and there is no longer a non-controlling interest in Submittal Exchange Holdings.
A summary of the purchase price for the acquisition is as follows:
Cash consideration |
$ | 2,404 | ||
Payment of outstanding Submittal Exchange debt |
403 | |||
Issuance of 482 Submittal Exchange Holdings Class A preferred units at $26.05 per unit |
12,548 | |||
|
$ | 15,355 | ||
As the acquisitions of GradeBeam and Submittal Exchange occurred in the fiscal year ended September 30, 2012, their results have been included in the condensed consolidated statement of operations for the nine months ended June 30, 2012 since their respective acquisition dates. The following table contains unaudited pro forma consolidated statements of operations information assuming the acquisitions occurred on October 1, 2010 and includes adjustments for amortization of intangible assets and interest expense. This pro forma information is presented for illustrative purposes only and is not indicative of what actual results would have been if the acquisitions had taken place on October 1, 2010, or of future results.
| |
Nine months ended June 30, 2012 |
|||
|---|---|---|---|---|
Revenue |
$ | 15,848 | ||
Loss from operations |
(13,670 | ) | ||
Net loss available to Textura Corporation common stockholders |
(13,639 | ) | ||
Net loss per share, basic and diluted |
$ | (1.60 | ) | |
On January 31, 2013, the Company acquired certain assets and assumed certain liabilities of PlanSwift, LLC ("PlanSwift"). PlanSwift is a developer and distributor of software with take-off and estimating capabilities for use in the construction industry. Its solutions expand the Company's suite of solutions, especially in the bid estimation process. A summary of the purchase price for the acquisition is as follows:
A summary of the purchase price for the acquisition is as follows:
Cash consideration |
$ | 989 | ||
Notes payable to PlanSwift |
1,214 | |||
Issuance of 539 shares of redeemable common stock |
7,898 | |||
|
$ | 10,101 | ||
The purchase price was subject to a customary post-closing working capital adjustment payable in cash, and 81 of the shares issued at the closing are subject to an escrow arrangement for a period of 18 months after the closing for purposes of indemnification claims by the Company against PlanSwift
F-44
Textura Corporation
Notes to Condensed Consolidated Financial Statements (Continued)
(in thousands, except per share data)
(unaudited)
2. Acquisitions (Continued)
under the acquisition agreement. The notes were payable in two equal installments on June 28, 2013 and December 31, 2013, or upon completion of an initial public offering. The payment of these notes of $1,296, including $82 of imputed interest, was accelerated upon the completion of the IPO.
In August 2013, August 2014 and August 2015, PlanSwift (or the unitholders of PlanSwift, if the shares were distributed to them) had the right to require the company to redeem, on each such date, up to one-third of the shares of common stock issued to PlanSwift in exchange for a non-interest bearing note payable if the Company did not complete a qualifying initial public offering by such date. Due to this redemption feature, the fair value of the common shares issued to PlanSwift on the acquisition date was initially classified outside of stockholders' deficit, but it was reclassified to stockholders' equity as a result of the completion of the IPO and termination of the redemption right.
Within ten business days following the completion of the IPO, one unitholder of PlanSwift had the right to require the Company to repurchase up to $1,500 of common stock of the Company, based upon the IPO price, that was issued in connection with the acquisition. In June 2013, the unitholder exercised his right to redeem 40 shares for a total of $600 at the IPO price of $15.00, which was recorded as treasury stock as of June 30, 2013.
The fair value of the redeemable common stock issued to PlanSwift was comprised of the fair value per share of the Company's common stock as of January 31, 2013 of $14.24 and the value attributable to the redemption feature of $226. Using the Probability Weighted Expected Result Method ("PWERM") methodology, the value of the Company's common stock was estimated based upon analysis of the Company assuming various future outcomes, including an initial public offering at various dates, a sale of the Company, as well as the continuation of the Company as a private enterprise. The fair value per common share was based upon the probability-weighted present value of these expected outcomes, as well as the rights of each class of preferred stock, common stock, convertible debentures, options and warrants. The fair value of the redemption feature was determined by probability-weighting the fair value of the put right, as calculated under the Black-Scholes model, for each scenario contemplated in the PWERM analysis.
The total purchase price has been allocated as follows:
Identifiable intangible assets |
$ | 4,570 | ||
Goodwill |
5,988 | |||
Deferred revenue |
(485 | ) | ||
Other current assets (liabilities), net |
28 | |||
Net assets acquired |
$ | 10,101 | ||
The Company believes the goodwill reflects its expectations related to economies of scale and leveraging of the PlanSwift solution with existing and future solution offerings. Goodwill is deductible for tax purposes. Identifiable intangible assets consist primarily of technology and customer relationships, which are being amortized over a period of three and five years, respectively.
Revenue of $2,507 and a net loss of $218 related to the PlanSwift acquisition are included in the Company's results of operations from January 31, 2013 for the nine month period ended June 30, 2013.
F-45
Textura Corporation
Notes to Condensed Consolidated Financial Statements (Continued)
(in thousands, except per share data)
(unaudited)
2. Acquisitions (Continued)
The Company has not disclosed pro forma information related to the PlanSwift acquisition because this information cannot be prepared without unreasonable effort.
3. Convertible Debentures
In 2011, the Company issued convertible debenture securities with detachable warrants (see Note 8), and it identified embedded conversion features that were required to be bifurcated and accounted for as derivatives. The derivative financial instruments were recorded at fair value as of the issuance date of the convertible debentures, as a debt discount, and remeasured to fair value as of each subsequent balance sheet date. The Company allocated the remaining proceeds to the convertible debentures and warrants on a relative fair value basis and recorded a beneficial conversion feature. The derivative financial instruments, warrants and beneficial conversion feature were recorded as a discount to the convertible debentures and are amortized to interest expense through the maturity dates, unless earlier converted (see below).
The convertible debentures are general unsecured obligations of the Company. The convertible debentures have a stated interest rate of 8.0% per annum on the outstanding principal balance. The interest on the convertible debenture securities is payable in kind ("PIK") and added to the unpaid principal in order to determine the number of shares of common stock to be issued upon conversion. The holder shall only be entitled to cash payment of such PIK interest from the Company upon (1) an event of default that would result in acceleration of all unpaid principal and accrued interest, or (2) the payment in full of the debt on the maturity date or prior as the result of the Company exercising its prepayment rights pursuant to the agreement.
Conversion of principal and accrued PIK interest into shares of common stock is at the election of the note holders at a conversion price of $15.00 per share and is also mandatory upon the closing of an initial public offering at a conversion price equal to the public offering price. The convertible debentures mature five years from the issue date.
On December 31, 2012, certain holders of the convertible debentures elected to convert their debentures to common stock. The outstanding principal and PIK interest for these holders at December 31, 2012 was $12,392, which converted into 826 shares of common stock. The unamortized debt discount for these debentures was recorded as interest expense on the conversion date.
On June 12, 2013, in connection with the completion of the IPO, the outstanding principal of the convertible debentures of $5,865 and PIK interest of $778 automatically converted into 443 shares of the Company's common stock, based upon the IPO price of $15.00 per share. The unamortized debt discount for these debentures of $863 was recorded as interest expense on the conversion date.
F-46
Textura Corporation
Notes to Condensed Consolidated Financial Statements (Continued)
(in thousands, except per share data)
(unaudited)
3. Convertible Debentures (Continued)
Convertible debenture activity for the nine months ended June 30 is as follows:
| |
Nine months ended June 30, |
||||||
|---|---|---|---|---|---|---|---|
| |
2012 | 2013 | |||||
Beginning balance: |
|||||||
Gross balance |
$ | 2,493 | $ | 18,328 | |||
Less: Discounts |
(529 | ) | (2,440 | ) | |||
|
1,964 | 15,888 | |||||
Proceeds: |
|||||||
To convertible debentures, before allocations |
14,664 | — | |||||
Allocated to detachable warrants |
(1,660 | ) | — | ||||
Allocated to beneficial conversion feature |
(140 | ) | — | ||||
Allocated to conversion option liability |
(467 | ) | — | ||||
Interest expense: |
|||||||
PIK interest |
865 | 707 | |||||
Amortization of debt discount |
258 | 190 | |||||
Recognition of unamortized debt discount upon conversion |
— | 2,250 | |||||
Conversion: |
|||||||
Issuance of 826 common shares |
— | (19,035 | ) | ||||
Ending balance: |
|||||||
Gross balance |
18,022 | — | |||||
Less: Discounts |
(2,538 | ) | — | ||||
|
$ | 15,484 | $ | — | |||
Total interest expense recognized related to the convertible debenture securities was $1,123 and $3,147 for the nine months ended June 30, 2012 and 2013, respectively.
4. Loan Payable to Related Party
The Company's bank loan facility is held with a financial institution that is an investor in the Company. The facility has been used solely for the purchase of land and the construction of the corporate headquarters facility. The loan agreement requires semi-annual principal payments of $250 with the remaining amount due at maturity in August 2016. Interest under the loan agreement is payable at a floating rate equal to the 30 day LIBOR rate plus 4.5% or 5.5%, whichever is greater. Interest is payable monthly at the beginning of the following month. At September 30, 2012 and June 30, 2013, the interest rate on the loan was 5.5%. All borrowings are collateralized by the land and facility, as the bank would take possession of the premises upon the failure by the Company to make a scheduled payment when due, after consideration of applicable cure periods, or the failure to maintain a debt service coverage ratio, defined as net cash flow from operations to debt service of 1.1 to 1.0 calculated annually as of December 31. Debt service is defined as the principal and interest payable on
F-47
Textura Corporation
Notes to Condensed Consolidated Financial Statements (Continued)
(in thousands, except per share data)
(unaudited)
4. Loan Payable to Related Party (Continued)
the loan during the fiscal year. The company has received a waiver related to this covenant until December 31, 2013.
The Company is required to maintain a compensating balance of $1,000 in its operating account during the term of the loan to provide for the payment of interest on the note in the event of a default. The Company has classified the $1,000 compensating balance as restricted cash in the consolidated balance sheets. Dividends or other distributions to preferred or common stockholders is restricted until the outstanding balance of the loan is reduced to $10,360 and positive earnings are demonstrated for six consecutive months.
5. Notes Payable
In the second quarter of the 2013 fiscal year, the Company issued in a private placement an aggregate of $6,750 of unsecured notes with an annual interest rate of 10% (the "Notes"). The Notes mature in January 2016 and are subject to mandatory prepayment in the event the Company completes a qualifying initial public offering. As such, the Company repaid the notes in June 2013 in connection with the closing of the IPO, including accrued interest of $252 through the IPO date.
In connection with the issuance of the Notes, the Company issued to the purchasers of the Notes detachable warrants to purchase an aggregate of 86 shares of common stock with an exercise price equal to the greater of $13.92 and 90% of the price at which shares of common stock are offered to the public in a qualifying initial public offering. The warrants are exercisable upon the earlier of a qualifying initial public offering or the date before the expiration of the warrants in January 2018. The Company recorded the fair value of the warrants, calculated using the Black-Scholes model, as a discount to the Notes. Since the exercise price was not fixed upon the issuance of the warrants, the fair value of the warrants of $454 was initially classified as other long-term liability. As a result of the completion of the IPO, the exercise price is fixed and the fair value of the warrants of $435 was reclassified to additional paid-in capital. The unamortized debt discount of $405 was recognized as interest expense upon repayment of the notes.
6. Contingencies
The Company is involved from time to time in claims that arise in the normal course of its business. The Company is not presently subject to any material litigation nor, to management's knowledge, is any litigation threatened against the Company that collectively is expected to have a material adverse effect on the Company's cash flows, financial condition or results of operations.
7. Share-Based Compensation to Employees
The Company's 2008 Employee Stock Incentive Plan (the "2008 Plan") permitted the grant of share-based awards to its employees, directors and certain other service providers. Option awards were generally granted with an exercise price equal to the market price of the Company's stock at the date of grant. Options granted generally vest over four-year periods. In general, the options expire after a period not exceeding ten years. As of June 30, 2013, there were 2,408 stock options outstanding under the 2008 Plan.
F-48
Textura Corporation
Notes to Condensed Consolidated Financial Statements (Continued)
(in thousands, except per share data)
(unaudited)
7. Share-Based Compensation to Employees (Continued)
Under the 2008 Plan, the Company also granted restricted stock units to eligible employees and directors. The stated vesting of these grants generally ranged from immediate to three years, but the restricted stock units only became payable to employees in cash or shares of the Company's common stock if there was a change in control of the Company or termination of the agreements in connection with an initial public offering. As the Company had determined that neither of these events was probable in any period prior to the IPO, the Company had not recognized any share-based compensation expense related to the restricted stock units prior to June 12, 2013. In connection with the IPO, all outstanding 623 restricted stock units were terminated in accordance with their terms and became payable one year following the IPO, and the Company recorded share-based compensation expense equal to the fair value of the 623 restricted stock units of $9,351. No further awards may be granted under the 2008 Plan.
The Company's Long-Term Incentive Plan (the "LTIP"), which was adopted in March 2013 and became effective in May 2013 when it was approved by the Company's stockholders, permits the grant of share-based awards to its employees, directors and certain other service providers. A maximum of 6,000 shares may be issued pursuant to the LTIP. Option awards are granted with an exercise price equal to the market price of the Company's stock at the date of grant and generally have a three-year vesting period and an expiration period not exceeding ten years. Restricted stock units generally vest over a three year period. During the three months ended June 30, 2013, the Company granted under the LTIP stock options with a weighted-average exercise price of $15.00 to purchase 1,021 shares of the Company's common stock and 73 restricted stock units. The weighted-average fair value of stock options and restricted stock units granted during the three months ended June 30, 2013 was $6.97 and $15.00, respectively.
Share-based compensation expense for employee equity awards under the 2008 Plan and the LTIP was $11,228 for the nine months ended June 30, 2013 and $2,078 for the nine months ended June 30, 2012.
Share-based compensation expense under the 2008 Plan and the LTIP is reflected in the following captions in the condensed consolidated statements of operations:
| |
Nine months ended June 30, |
||||||
|---|---|---|---|---|---|---|---|
| |
2012 | 2013 | |||||
Cost of services |
$ | 151 | $ | 1,987 | |||
General and administrative |
1,207 | 4,372 | |||||
Sales and marketing |
215 | 2,329 | |||||
Technology and development |
505 | 2,540 | |||||
Total |
$ | 2,078 | $ | 11,228 | |||
F-49
Textura Corporation
Notes to Condensed Consolidated Financial Statements (Continued)
(in thousands, except per share data)
(unaudited)
8. Warrants
Warrants outstanding to purchase the Company's common stock as of June 30, 2013 were as follows:
| |
Vesting Date | Warrants Outstanding |
Weighted Average Exercise Price |
||||||
|---|---|---|---|---|---|---|---|---|---|
Fundraising |
November 2007 | 24 | $ | 12.38 | |||||
Convertible debenture |
Various 2009 | 324 | $ | 16.26 | |||||
Convertible debenture |
Various 2010 | 398 | $ | 13.25 | |||||
Referral Fees |
June 2010 | 20 | $ | 13.25 | |||||
Convertible debenture |
May 2011 | 48 | $ | 16.26 | |||||
Mortgage renewal |
August 2011 | 20 | $ | 15.00 | |||||
Convertible debenture |
August 2011 | 32 | $ | 13.25 | |||||
Convertible debenture |
September 2011 | 56 | $ | 15.00 | |||||
Convertible debenture |
Various 2012 | 326 | $ | 15.00 | |||||
Notes payable |
Various 2013 | 86 | $ | 13.92 | |||||
|
1,334 | ||||||||
9. Related Party Transactions
In 2009 the Company entered into an agreement with an entity that is also an investor in the Company. The agreement compensates the entity for customer referrals based on revenues generated by the Company related to those customers. A warrant to purchase 20,000 shares of our common stock was issued pursuant to the referral agreement in the year ended September 30, 2010. The Company is obligated under the referral agreement to issue to the entity warrants to purchase up to an additional 207,500 shares of common stock based on the achievement of various milestones. In addition, in 2010 the Company entered into a service agreement with the entity, pursuant to which it was paid $1,000 in advance for software development services to improve software owned by the entity. This payment was deferred and recognized as revenue as development services were provided. The deferred revenue balance accrues interest and is increased by a portion of the referral fees due to this entity; the remainder of the referral fees due is paid in cash. The deferred revenue balance was $655 and $844 as of September 30, 2012 and June 30, 2013, respectively. The Company also provides hosting services to the entity for a fixed annual fee.
The Company maintains an operating account at a financial institution that is an investor in the Company. The banking relationship was established prior to the investment in the Company. The Company also holds a note payable with the same financial institution. The amount due on the note payable as of September 30, 2012 and June 30, 2013 was $10,719 and $10,469, respectively (see Note 4).
F-50
Textura Corporation
Notes to Condensed Consolidated Financial Statements (Continued)
(in thousands, except per share data)
(unaudited)
10. Initial Public Offering
On June 12, 2013, the Company completed the IPO. Pursuant to a registration statement declared effective on June 6, 2013 (File No. 333-187745), the Company sold 5,750 shares of its common stock in the IPO at a price per share of $15.00 for an aggregate offering price of $80,213, net of underwriting discounts and commissions of $6,037. In addition, the Company incurred other offering costs totaling $2,504, for net capital raised of $77,709.
In connection with the completion of the IPO, the Company had certain debt and equity securities outstanding that converted to common stock. The table below reflects the number of shares of the Company's common stock outstanding immediately following the completion of the IPO:
| |
Number of Shares | |||
|---|---|---|---|---|
| |
(in thousands) |
|||
Common stock outstanding before the IPO |
9,935 | |||
Common stock issued in IPO (including exercise of the full over-allotment by the underwriters of 750 shares of common stock) |
5,750 | |||
Conversion of Series A-1 and A-2 preferred stock |
5,336 | |||
Satisfaction of cumulative dividends on Series A-1 and A-2 preferred stock |
412 | |||
Conversion of convertible debentures |
443 | |||
Conversion of Submittal Exchange Holdings Class A preferred Units |
963 | |||
Total number of shares of common stock outstanding as of June 12, 2013 |
22,839 | |||
The outstanding shares of the Company's Series A-1 and A-2 preferred stock automatically converted into 5,336 shares of common stock at a conversion rate of 1:2.84 and the cumulative unpaid dividends were satisfied through the issuance of 412 additional shares of common stock through an adjustment to the conversion rate.
The outstanding balance of principal and accrued PIK interest thereon for the convertible debentures (see Note 3) automatically converted into 443 shares of common stock at a conversion price equal to the IPO price of $15.00 per share. As a result of the conversion, the Company recorded a charge of $863 to interest expense during the three months ended June 30, 2013 related to the write off of the unamortized debt discounts, and it recorded other income of $82 related to the conversion option liability that no longer exists post-IPO.
The former shareholders of Submittal Exchange received Class A preferred units of Submittal Exchange Holdings at acquisition, which were reflected as non-controlling interest in the consolidated financial statements in prior periods. The Class A preferred units converted into 963 common shares on a 1:2 basis in connection with the IPO, at which time the non-controlling interest was eliminated.
11. Subsequent Events
The Company has evaluated subsequent events through September 10, 2013, the date on which the financial statements were issued.
F-51
Report of Independent Auditors
To the Stockholders of Submittal Exchange, LLC
In our opinion, the accompanying consolidated statements of financial position and the related consolidated statements of operations, members' deficit and of cash flows present fairly, in all material respects, the financial position of Submittal Exchange, LLC and its subsidiaries at November 6, 2011 and the results of its operations and its cash flows for the period from January 1, 2011 through November 6, 2011, in conformity with accounting principles generally accepted in the United States of America. These financial statements are the responsibility of the Company's management. Our responsibility is to express an opinion on these financial statements based on our audit. We conducted our audit of these statements in accordance with auditing standards generally accepted in the United States of America. Those standards require that we plan and perform the audit to obtain reasonable assurance about whether the financial statements are free of material misstatement. An audit includes examining, on a test basis, evidence supporting the amounts and disclosures in the financial statements, assessing the accounting principles used and significant estimates made by management, and evaluating the overall financial statement presentation. We believe that our audit provide a reasonable basis for our opinion.
As discussed in Note 9, on November 7, 2011, the Company was acquired by Submittal Exchange Holdings, LLC, a subsidiary of Textura Corporation.
/s/ PricewaterhouseCoopers LLP
Chicago,
Illinois
January 9, 2013
F-52
Submittal Exchange, LLC
Consolidated Statement of Financial Position
| |
November 6, 2011 |
|||
|---|---|---|---|---|
ASSETS |
||||
Current assets |
||||
Cash and cash equivalents |
$ | 294,541 | ||
Trade accounts receivable |
423,330 | |||
Prepaid expenses |
14,249 | |||
Total current assets |
732,120 | |||
Property and equipment, net |
54,708 | |||
Intangible assets, net |
3,565 | |||
Total assets |
$ | 790,393 | ||
LIABILITIES, PREFERRED STOCK AND MEMBERS' DEFICIT |
||||
Current liabilities |
||||
Accounts payable |
$ | 85,412 | ||
Accrued expenses |
285,037 | |||
Share based award liability |
280,703 | |||
Deferred revenue |
2,294,742 | |||
Notes payable |
50,000 | |||
Notes payable to related parties |
24,762 | |||
Total current liabilities |
3,020,656 | |||
Other liabilities |
||||
Deferred revenue, long-term |
292,182 | |||
Notes payable |
307,539 | |||
Total other liabilities |
599,721 | |||
Total liabilities |
3,620,377 | |||
Members' deficit |
||||
Class A units, $.01 par value; 112,857 units issued and outstanding |
1,129 | |||
Class B units, $.01 par value; 34,288 units issued and 34,038 units outstanding |
343 | |||
Additional paid-in capital |
1,202,733 | |||
Treasury stock, at cost; 250 units |
(5,000 | ) | ||
Accumulated deficit |
(4,029,189 | ) | ||
Total members' deficit |
(2,829,984 | ) | ||
Total liabilities and members' deficit |
$ | 790,393 | ||
The accompanying notes are an integral part of these consolidated financial statements.
F-53
Submittal Exchange, LLC
Consolidated Statement of Operations
| |
For the Period from January 1 to November 6, 2011 |
|||
|---|---|---|---|---|
Revenues |
$ | 2,556,113 | ||
Operating expenses |
||||
Cost of services |
783,753 | |||
General and administrative |
1,507,954 | |||
Sales and marketing |
1,319,387 | |||
Technology and development |
562,749 | |||
Depreciation and amortization |
25,344 | |||
Total operating expenses |
4,199,187 | |||
Loss from operations |
(1,643,074 | ) | ||
Interest expense |
(57,071 | ) | ||
Net loss |
$ | (1,700,145 | ) | |
The accompanying notes are an integral part of these consolidated financial statements.
F-54
Submittal Exchange, LLC
Statement of Members' Deficit
| |
Class A Units | Class B Units | |
Treasury Stock | |
|
||||||||||||||||||||||
|---|---|---|---|---|---|---|---|---|---|---|---|---|---|---|---|---|---|---|---|---|---|---|---|---|---|---|---|---|
| |
Additional Paid-In Capital |
Accumulated Deficit |
|
|||||||||||||||||||||||||
| |
Units | Par Value | Units | Par Value | Units | Value | Total | |||||||||||||||||||||
Members' deficit, December 31, 2010 |
106,489 | $ | 1,065 | 34,288 | $ | 343 | $ | 670,253 | — | $ | — | $ | (2,329,044 | ) | $ | (1,657,383 | ) | |||||||||||
Class B unit repurchase |
— | — | — | — | — | (250 | ) | (5,000 | ) | — | (5,000 | ) | ||||||||||||||||
Class A units issued for compensation |
4,900 | 49 | — | — | 482,495 | — | — | — | 482,544 | |||||||||||||||||||
Proceeds from sale of Class A units |
1,468 | 15 | 49,985 | 50,000 | ||||||||||||||||||||||||
Net Loss |
— | — | — | — | — | — | — | (1,700,145 | ) | (1,700,145 | ) | |||||||||||||||||
Members' deficit, November 6, 2011 |
112,857 | $ | 1,129 | 34,288 | $ | 343 | $ | 1,202,733 | (250 | ) | $ | (5,000 | ) | $ | (4,029,189 | ) | $ | (2,829,984 | ) | |||||||||
The accompanying notes are an integral part of these consolidated financial statements.
F-55
Submittal Exchange, LLC
Consolidated Statements of Cash Flows
| |
For the Period from January 1 to November 6, 2011 |
|||
|---|---|---|---|---|
Cash flows from operating activities |
||||
Net loss |
$ | (1,700,145 | ) | |
Adjustments to reconcile net loss to cash used in operating activities |
||||
Depreciation and amortization |
25,344 | |||
Share-based compensation |
750,985 | |||
Accretion of notes payable discount |
31,218 | |||
Impact on cash from changes in |
||||
Trade accounts receivable |
38,481 | |||
Prepaid expenses |
(12,812 | ) | ||
Other assets |
1,638 | |||
Deferred revenue |
884,757 | |||
Accounts payable |
50,919 | |||
Accrued expenses |
103,770 | |||
Net cash used in operating activities |
174,155 | |||
Cash flows from financing activities |
||||
Principal payments on notes payable |
(49,474 | ) | ||
Class A unit repurchase |
(5,000 | ) | ||
Proceeds from sale of Class A units |
50,000 | |||
Net cash provided by financing activities |
(4,474 | ) | ||
Net increase (decrease) in cash and cash equivalents |
169,681 | |||
Cash and cash equivalents |
||||
Beginning of year |
124,860 | |||
End of year |
$ | 294,541 | ||
Supplemental disclosures of noncash financing activities |
||||
Cash paid for interest |
$ | 14,379 | ||
The accompanying notes are an integral part of these consolidated financial statements.
F-56
Submittal Exchange, LLC
Notes to Consolidated Financial Statements
1. Description of Company
Submittal Exchange, LLC (the "Company") was formed on October 2, 2006 to provide online collaborative solutions for exchanging, reviewing, and archiving construction submittals, requests for information, and other construction communication. The Company is located in Des Moines, Iowa. The Company's fiscal year end is December 31.
2. Summary of Significant Accounting Policies
This summary of significant accounting policies of the Company is presented to assist in understanding the Company's financial statements. The financial statements and notes are representations of the Company's management, who are responsible for the integrity and objectivity of the financial statements. These accounting policies conform to U.S. generally accepted accounting principles and have been consistently applied in the preparation of the financial statements.
Basis of Consolidation
The consolidated financial statements include the accounts of Submittal Exchange, LLC and its subsidiaries. All significant intercompany transactions are eliminated.
Revenue Recognition
The Company's products are hosted by the Company and access to the systems is provided to the Company's customers. The Company does not sell its software but rather provides licenses to use the software which it hosts. The Company recognizes revenue when persuasive evidence of an arrangement exists, the contract price is fixed or determinable, services have been rendered, and collectability is reasonably assured.
The Company collects project subscription fees for using the services of the Company on a construction project which includes use of the Company website, data storage, hosting and security, electronic data archives, and similar services. Project subscription fees are recognized on a straight-line basis over the estimated life of the project, typically seven to twenty months.
Cash and Cash Equivalents
The Company considers all unrestricted highly liquid investments with an initial maturity of three months or less to be cash equivalents. The Company maintains cash accounts in which the balances, at times, exceed the Federal Deposit Insurance Corporation limits. The Company has not experienced any losses in such accounts.
Trade Accounts Receivable
The Company's trade accounts receivable are due from customers for uncollected project subscription fees relating to implemented projects.
There was no allowance for doubtful accounts at November 6, 2011.
F-57
Submittal Exchange, LLC
Notes to Consolidated Financial Statements (Continued)
2. Summary of Significant Accounting Policies (Continued)
Property and Equipment
Property and equipment are recorded at cost. Depreciation is provided over the estimated useful lives of the related assets using the straight-line method. The estimated useful lives of the assets are as follows:
| Furniture and fixtures | 5 years | |||
| Source software | 3 years |
Maintenance and repairs are charged to expense as incurred.
Impairment of Long-Lived Assets
The Company evaluates long-lived assets, including property and equipment, software and finite-lived intangible assets, for impairment whenever events or changes in circumstances indicate that the carrying value of the asset may not be recoverable. Examples of such events or circumstances include, but are not limited to, significant underperformance relative to historical or projected future results, significant negative changes in the manner of use of the acquired assets in the Company's business or material negative changes in relationships with significant customers. Recoverability is measured by a comparison of the carrying value to the future undiscounted net cash flows associated with the asset. If the carrying value exceeds the undiscounted cash flows, an impairment loss is recognized to the extent that the carrying value exceeds the fair value of the asset. There were no indicators of impairment noted during 2011.
Fair Value of Financial Instruments
Fair value is defined as the price that would be received from selling an asset or paid to transfer a liability in an orderly transaction between market participants at the measurement date. The fair value measurements are classified and disclosed in one of the following three categories:
Level 1—Valuations based on quoted prices in active markets for identical assets or liabilities;
Level 2—Valuations based on other than quoted prices in active markets for identical assets and liabilities, quoted market prices for identical or similar assets or liabilities in inactive markets, or other inputs that are observable or can be corroborated by observable market data for substantially the full term of the assets or liabilities;
Level 3—Valuations based on inputs that are generally unobservable and typically reflect management's estimate of assumptions that market participants would use in pricing the asset or liability.
The carrying amounts of cash and cash equivalents, accounts receivable, prepaid expenses and other current assets, accounts payable and accrued expenses approximate fair value because of their short maturities. The fair value of the notes payable at November 6, 2011 were determined by level 3 measurements, and approximate the carrying amounts based on a comparison of the interest rate and terms of such debt to the rates and terms of similar debt available.
F-58
Submittal Exchange, LLC
Notes to Consolidated Financial Statements (Continued)
2. Summary of Significant Accounting Policies (Continued)
Income Taxes
The Company reports as a partnership for income tax purposes. Accordingly, no federal or state income tax provision is provided by the Company, as it is includable in the Members' individual tax returns.
Use of Estimates in Preparation of Financial Statements
The preparation of the financial statements in conformity with generally accepted accounting principles requires management to make estimates and assumptions that affect the reported amounts of assets and liabilities and the disclosure of contingent assets and liabilities at the date of the financial statements and the reported amounts of revenues and expenses during the reported period. The estimates and assumptions used in the accompanying financial statements are based upon management's evaluation of the relevant facts and circumstances at the balance sheet date. Actual results could differ from those estimates. Significant estimates are involved in accounting for subscription fee revenue, depreciation, and assumptions for share-based payments.
3. Long-Lived Assets
Property, Plant and Equipment
The following is a summary of property and equipment, at cost less accumulated depreciation:
| |
November 6, 2011 |
|||
|---|---|---|---|---|
Furniture and fixtures |
$ | 48,482 | ||
Source software |
46,104 | |||
|
94,586 | |||
Less: Accumulated depreciation and amortization |
(39,878 | ) | ||
|
$ | 54,708 | ||
Depreciation of property and equipment was $20,887 for the period from January 1 to November 6, 2011.
Intangible Assets
Amortization expense related to non-compete agreements was $4,457 for the period from January 1 to November 6, 2011.
The following is a schedule of future amortization amounts for the years ending December 31:
November 7, 2011 through December 31, 2011 |
$ | 891 | ||
2012 |
2,674 | |||
|
$ | 3,565 | ||
F-59
Submittal Exchange, LLC
Notes to Consolidated Financial Statements (Continued)
4. Notes Payable
The Company holds two convertible promissory notes with Wellmark. These notes are dated April 10, 2007 and March 2, 2009 with face values of $50,000 and $100,000, respectively. Each note has similar payments of interest and maturity dates as follows. Interest shall accrue at a rate equal to 7.0% per annum on the unpaid principal amount of the convertible notes. Interest shall be computed on the basis of the actual number of days elapsed and a 360-day year. Interest payments shall be made annually, beginning on the first anniversary of each convertible note, and shall continue until these convertible notes are paid in full, or are converted.
The entire principal amount of these convertible notes and all accrued but unpaid interest thereon shall be due and payable in full on the fifth anniversary of each convertible note. The Company may prepay these convertible notes in whole or part at any time without penalty. The Company may at its option extend the maturity date by giving notice of such extension to the payee. In the event the Company sells equity to a party other than Wellmark, Wellmark may convert its promissory notes into units of the Company at a conversion price equal to the price at which units are sold to the third party.
In addition to the above, the Company has two royalty agreements with the Iowa Department of Economic Development (IDED) dated June 13, 2007 and April 6, 2009 with face values of $60,000 and $125,000, respectively. These royalty agreements have similar due dates and royalty agreements. The amount of payment shall be a royalty equal to 2% of prior year total gross revenues due on an annual basis until a repayment of $90,000 and $187,500 have been met. The semi-annual payment will be equal to 1% of total prior year gross revenues. Payments will be due in equal installments on a semi-annual basis.
The loans were recorded at the above repayment amounts with applied discounts of $30,000 and $62,500, respectively. The discount is amortized using the effective rate method until the maturity date of the agreements. The effective interest rate is 10.9% and 11.2% the 2007 and 2009 notes, respectively. The principal balance, including accrued interest, on the royalty agreements was $221,097 as of November 6, 2011.
The following is a schedule of future principal payment amounts for the years ending December 31:
2012 |
$ | 50,000 | ||
2013 |
— | |||
2014 |
100,000 | |||
Thereafter |
207,539 | |||
|
$ | 357,539 | ||
5. Lease Agreements
The Company leases its office facility under a long-term, non-cancelable operating lease agreement. The lease expires December 31, 2011. Rent expense for the year ended November 6, 2011 was $49,356.
The Company entered into a new lease on October 28, 2011, which will be effective on January 1, 2012. The lease expires February 28, 2017.
F-60
Submittal Exchange, LLC
Notes to Consolidated Financial Statements (Continued)
5. Lease Agreements (Continued)
The following is a schedule of future minimum rental payments required under the Company's operating lease agreement for the years ending December 31:
2011 |
$ | 6,612 | ||
2012 |
90,283 | |||
2013 |
131,133 | |||
2014 |
135,692 | |||
2015 |
135,692 | |||
2016 |
135,692 | |||
2017 |
22,615 | |||
|
$ | 657,719 | ||
6. LLC Units
Class A Units
The Company has issued 112,857 Class A units as of November 6, 2011. The Class A units are preferred units of the company. Each Class A unit is entitled to one vote per unit. All distributions resulting from Net Losses and Net Profits resulting from the normal day-to-day business operations of the Company shall be made entirely to Class A Members.
Class B Units
The Company has issued 34,288 Class B units as of November 6, 2011. The Class B units are common units of the Company. Each holder is entitled to one vote for each unit on all matters on which unit holders generally are entitled to vote. All distributions other than those resulting from the normal day-to-day business operations shall be distributed pro rata based upon the respective number of units held by each member.
7. Share-Based Compensation to Employees
The Company has granted various types of share-based awards to employees and one non-employee, including Class A unit awards and phantom units. The Company issued awards in 2009 and 2011 to a non-employee. These awards vested upon a change in control with no compensation recognized until such event was probable. These awards became vested and payable to the non-employee upon the change in control event discussed in Note 9. In the period from January 1 to November 6, 2011, the Company issued 4,900 Class A units in satisfaction of these phantom awards. The fair value of the awards of $482,544 was recognized as share based compensation expense in the period from January 1 to November 6, 2011 and was based on the valuation of the Company at the time of the change in control.
The Company granted 2,795 phantom units in May 2010 to certain employees under the Phantom Unit Grant agreement. The phantom units become payable to employees in cash in July 2015. Share-based compensation is recognized from the grant date through July 2015 as the awards vest and are recorded as a liability. The value of the liability is adjusted to fair market value at the end of the reporting period, which was determined based on the shares vested to date and the current fair value.
F-61
Submittal Exchange, LLC
Notes to Consolidated Financial Statements (Continued)
7. Share-Based Compensation to Employees (Continued)
For the period from January 1, 2011 through November 6, 2011, share-based compensation of $268,441 related to these awards was recorded in the statement of operations.
The Company granted an additional 3,205 phantom units on November 6, 2011 to certain employees. The service period on these awards has not started and therefore no share-based compensation expense related to these awards has been recorded.
8. Loans to Related Parties
The Company has a note payable issued to its President in the amount of $15,312 with an interest rate of 5%. This note transpired due to unreimbursed business expenses and is due upon demand. The Company has a note payable issued to a unit holder in the amount of $9,450 which transpired due to unpaid fees for development services provided by the unit holder as an independent contractor. This note is due upon demand and does not bear interest.
9. Subsequent Events
The Company has evaluated subsequent events from November 6, 2011 through January 9, 2013, the issuance date of these financial statements.
On November 7, 2011, the Company was acquired by Submittal Exchange Holdings, LLC, a subsidiary of Textura Corporation, an online collaboration platform for the construction industry. The purchase price was approximately $15.4 million, comprised of $2.8 million in cash, including payment of all outstanding notes payable by Textura Corporation, and 481,700 Class A preferred units of Submittal Exchange Holdings, LLC.
F-62
PART II
INFORMATION NOT REQUIRED IN PROSPECTUS
Item 13. Other Expenses of Issuance and Distribution.
The following table sets forth the various expenses expected to be incurred by the registrant in connection with the sale and distribution of the securities being registered hereby, other than underwriting discounts and commissions. All amounts are estimated except the SEC registration fee and the Financial Industry Regulatory Authority filing fee.
Item
|
Amount | |||
|---|---|---|---|---|
SEC registration fee |
$ | 25,111 | ||
Financial Industry Regulatory Authority filing fee |
28,114 | |||
New York Stock Exchange listing fee |
* | |||
Accounting fees and expenses |
* | |||
Legal fees and expenses |
* | |||
Printing and engraving expenses |
* | |||
Registrar and Transfer Agent's fees |
* | |||
Miscellaneous fees and expenses |
* | |||
Total |
$ | * | ||
Item 14. Indemnification of Directors and Officers.
Section 145 of the Delaware General Corporation Law authorizes a corporation's board of directors to grant, and authorizes a court to award, indemnity to officers, directors and other corporate agents.
In addition, the registrant's restated certificate of incorporation, as amended, and amended and restated bylaws provide that the registrant shall indemnify any person who is or was a party or is threatened to be made a party to any threatened, pending or completed action, suit or proceeding (other than an action by or in the right of the registrant) by reason of the fact that such person is or was a director or officer of the registrant, against expenses (including attorneys' fees), judgments, fines and amounts paid in settlement actually and reasonably incurred by such person in connection with such action, suit or proceeding if such person acted in good faith and in a manner such person reasonably believed to be in or not opposed to the best interests of the registrant, and, with respect to any criminal action or proceeding, had no reasonable cause to believe such person's conduct was unlawful. The registrant shall indemnify any person who is or was a party or is threatened to be made a party to any threatened, pending or completed action or suit by or in the right of the registrant to procure a judgment in its favor by reason of the fact that such person is or was a director or officer of the registrant against expenses (including attorneys' fees) actually and reasonably incurred by such person in connection with the defense or settlement of such action or suit if such person acted in good faith and in a manner such person reasonably believed to be in or not opposed to the best interests of the registrant; except that no indemnification shall be made in respect of any claim, issue or matter as to which such person shall have been adjudged to be liable to the registrant unless and only to the extent that the court in which such action or suit was brought shall determine upon application that, despite the adjudication of liability but in view of all the circumstances of the case, such person is fairly and reasonably entitled to indemnity for such expenses which the court shall deem proper.
As permitted by Section 102(b)(7) of the Delaware General Corporation Law, the registrant's restated certificate of incorporation, as amended, eliminates, to the fullest extent permitted by law, personal liability of a director of the registrant to the registrant or any of its stockholders for monetary damages for breach of fiduciary duty as a director, except (i) for any breach of the director's duty of loyalty to the registrant or its stockholders, (ii) for acts or omissions not in good faith or which involve intentional misconduct or a knowing violation of law, (iii) pursuant to Section 174 of the Delaware
II-1
General Corporation Law or (iv) for any transaction from which the director derived an improper personal benefit.
The registrant's amended and restated bylaws provide that the registrant may purchase and maintain insurance on behalf of any person who is or was a director, officer, employee or agent of the registrant, or is or was serving at the request of the registrant as a director, officer, employee or agent of another entity, against any liability asserted against such person and incurred by such person in any such capacity, or arising out of such person's status as such, whether or not the registrant would have the power or the obligation to indemnify such person against such liability under the provisions of the registrant's amended and restated bylaws.
The registrant has entered into indemnification agreements with its directors and executive officers. These indemnification agreements provide for the maximum indemnity allowed to directors and executive officers by applicable law and also provide for certain additional procedural protections.
Item 15. Recent Sales of Unregistered Securities.
The following list sets forth information regarding all securities sold by us since January 1, 2010 after giving effect to the 2 for 1 stock split declared on the common stock on March 28, 2013:
Issuances of Common Stock
(1) In August 2012, we sold an aggregate of 26,000 shares of common stock upon the exercise of warrants issued to three service providers at an exercise price of $12.38 per share, for an aggregate exercise price of $321,874.
Convertible Debentures; Warrants
(2) Between April 2010 and February 2011, we issued at par convertible debentures with an aggregate principal amount of $10,570,432, together with warrants to purchase 398,890 shares of our common stock at an exercise price of $13.25 per share, to 47 accredited investors at an aggregate purchase price of $10,570,432. In August 2011, these convertible debentures were converted into 861,168 shares of our common stock. Upon conversion, we issued warrants to purchase 31,696 shares of our common stock to the former holders of these convertible debentures at an exercise price of $13.25 per share. The warrants may be exercised in whole or in part at any time prior to expiration on March 31, 2020.
(3) On June 15, 2010, we granted warrants to purchase 20,000 shares of our common stock at an exercise price of $13.25 per share to Aon Risk Services Central, Inc. in exchange for an agreement to provide referral services. These warrants may be exercised in whole or in part at any time prior to expiration on June 15, 2015.
(4) On August 14, 2011, we granted warrants to purchase 20,000 shares of our common stock at an exercise price of $15.00 per share to First Midwest Bank in exchange for the modification of the loan agreement with us. These warrants may be exercised in whole or in part at any time prior to expiration on September 15, 2021, except for the period beginning on the day that we first file a registration statement on Form S-1 related to an initial public offering of our common stock and ending 180 days after the closing of our initial public offering.
(5) Between September 2011 and December 2011, we issued at par convertible debentures with an aggregate principal amount of $17,150,000, together with warrants to purchase 381,184 shares of our common stock at an exercise price of $15.00 per share, to 50 accredited investors at an aggregate purchase price of $17,150,000. The convertible debentures accrued interest at a rate equal to 8.0% per year, payable in kind, and had a maturity date of September 15, 2016, unless converted prior thereto. Upon completion of our initial public offering, these convertible debentures converted into shares of our common stock at a conversion price equal to the initial public offering price. The warrants may be exercised in whole or in part at any time prior to expiration on September 15, 2021, except for the
II-2
period beginning on the day that we first filed a registration statement on Form S-1 related to an initial public offering of our common stock and ending 180 days after the closing of our initial public offering. On December 31, 2012, holders of these convertible debentures with an aggregate principal amount of $11,284,848 converted their convertible debentures and accrued interest thereon into 826,166 shares of our common stock.
Submittal Exchange
(6) On November 7, 2011, our subsidiary, Submittal Exchange Holdings, LLC ("SE Holdings") issued 481,700 Class A preferred units of SE Holdings to 10 accredited investors in connection with our acquisition of Submittal Exchange, LLC. Upon completion of our initial public offering, these Class A preferred units automatically converted into shares of our common stock on a 1:2 basis.
PlanSwift Acquisition
(7) On January 31, 2013 we issued 538,794 shares of our common stock to PlanSwift, LLC to acquire substantially all of its assets.
Private Placement
(8) In February 2013, we issued non-convertible notes with an aggregate principal amount of $6,750,000, together with warrants to purchase 86,400 shares of our common stock with an exercise price equal to the greater of $13.92 and 90% of the initial public offering price, to nine accredited investors at an aggregate purchase price of $6,750,000. The warrants may be exercised in whole or in part at any time prior to expiration on January 21, 2018, except for the period beginning on the day that we first file a registration statement on Form S-1 related to an initial public offering of our common stock and ending 180 days after the closing of our initial public offering.
Stock Option Grants
(9) Between January 1, 2010 and March 31, 2013, we have granted stock options to purchase an aggregate of 1,542,852 shares of our common stock with exercise prices ranging from $10.03 to $16.26 per share and an aggregate of 407,736 restricted stock units to our employees and directors pursuant to our 2008 Stock Incentive Plan.
Warrant Exercise
(10) In April 2013, we issued 5,156 shares of Series A-2 preferred stock to the holder of a warrant upon payment of the exercise price of $36,092. In May 2013, we issued 53,571 shares of Series A-2 preferred stock to the holder of a warrant upon payment of the exercise price of $374,997.
Securities Act Exemptions
We deemed the offers, sales and issuances of the securities described in paragraphs (1) through (8) and (10) above to be exempt from registration under the Securities Act of 1933, as amended (the "Securities Act"), in reliance on Section 4(2) of the Securities Act relative to transactions by an issuer not involving a public offering. All purchasers of securities in transactions exempt from registration pursuant to Section 4(2) represented to us that they were accredited investors and were acquiring the shares for investment purposes only and not with a view to, or for sale in connection with, any distribution thereof and that they could bear the risks of the investment and could hold the securities for an indefinite period of time. The purchasers received written disclosures that the securities had not been registered under the Securities Act and that any resale must be made pursuant to a registration statement or an available exemption from such registration.
We deemed the grants of stock options and restricted stock units described in paragraph (9), except to the extent described above as exempt pursuant to Section 4(2) of the Securities Act, to be exempt from registration under the Securities Act in reliance on Rule 701 of the Securities Act as
II-3
offers and sales of securities under compensatory benefit plans and contracts relating to compensation in compliance with Rule 701.
All certificates representing the securities issued in the transactions described in this Item 15 included appropriate legends setting forth that the securities had not been offered or sold pursuant to a registration statement and describing the applicable restrictions on transfer of the securities. There were no underwriters employed in connection with any of the transactions set forth in this Item 15.
Item 16. Exhibits and Financial Statement Schedules.
(a) Exhibits
| Exhibit Number |
Description of Exhibits | ||
|---|---|---|---|
| 1.1 | Form of Underwriting Agreement* | ||
| 2.1 | Asset Purchase Agreement, dated October 19, 2011, by and between Textura Corporation and Gradebeam LLC† | ||
| 2.2 | Contribution Agreement, dated November 7, 2011, by and among Submittal Exchange Holdings, LLC, Textura Corporation, Submittal Exchange, LLC and the members of Submittal Exchange, LLC† | ||
| 2.3 | Asset Purchase Agreement, dated as of January 31, 2013, by and among Textura PlanSwift Corporation, Textura Corporation and PlanSwift, LLC† | ||
| 3.1 | Restated Certificate of Incorporation of Textura Corporation† | ||
| 3.2 | [Reserved] | ||
| 3.3 | Form of Amendment to Certificate of Incorporation of Textura Corporation† | ||
| 3.4 | Amended and Restated Bylaws of Textura Corporation† | ||
| 4.1 | Form of Common Stock Certificate† | ||
| 5.1 | Opinion of Mayer Brown LLP* | ||
| 10.1 | Textura Corporation Stock Incentive Plan, as amended and restated effective as of January 1, 2009 (including form of Stock Grant Agreement, form of Option Award Agreement and form of Restricted Stock Unit Award Agreement)† | ||
| 10.2 | Textura Corporation Long-Term Incentive Plan† | ||
| 10.3 | Form of Option Agreement† | ||
| 10.4 | Form of Restricted Stock Unit Award Agreement† | ||
| 10.5 | Construction Loan Agreement, between Textura Corporation and First Midwest Bank, dated August 14, 2007† | ||
| 10.6 | Construction Mortgage, Security Agreement, Assignment of Leases and Rents and Fixture Filing, between Textura Corporation and First Midwest Bank, dated August 14, 2007† | ||
| 10.7 | Promissory Note, dated August 14, 2007† | ||
| 10.8 | Modification of Loan Documents, between Textura Corporation and First Midwest Bank, dated August 14, 2009† | ||
| 10.9 | Amended and Restated Promissory Note, dated August 14, 2009† | ||
| 10.10 | Second Modification of Loan Documents, between Textura Corporation and First Midwest Bank, dated August 14, 2011† | ||
| 10.11 | Covenant Compliance Waiver, between Textura Corporation and First Midwest Bank, dated November 29, 2012† | ||
| 10.12 | Employment Agreement of Patrick J. Allin, dated October 1, 2010† | ||
| 10.13 | Offer letter with Howard Niden, dated February 28, 2011† | ||
| 10.14 | Employment Agreement of Patrick J. Allin, dated March 28, 2013† | ||
| 10.15 | Employment Agreement of William Eichhorn, dated March 28, 2013† | ||
| 10.16 | Form of Executive Officer Employment Agreement† | ||
| 10.17 | Form of Convertible/Redeemable Debenture† | ||
| 10.18 | Form of 10% Notes due 2016† | ||
| 10.19 | Warrant issued to Aon Risk Services Central, Inc.† | ||
| 10.20 | Warrant issued to First Midwest Bank† | ||
II-4
| Exhibit Number |
Description of Exhibits | ||
|---|---|---|---|
| 10.21 | Form of Warrant for 2009 Convertible Debentures† | ||
| 10.22 | Form of Warrant for 2010 Convertible Debentures† | ||
| 10.23 | Form of Warrant for 2011 Convertible Debentures† | ||
| 10.24 | Form of Warrant for 10% Notes due 2016† | ||
| 10.25 | Software Development and Service Agreement, between Textura Corporation and Aon Risk Services Central, Inc., dated June 15, 2010† | ||
| 10.26 | 2010 Referral Fee Agreement, between Textura Corporation and Aon Risk Services Central, Inc., dated June 15, 2010† | ||
| 10.27 | Third Amendment to Construction Loan Agreement and the other Loan Documents and Waiver† | ||
| 10.28 | Form of Indemnification Agreement with Directors and Executive Officers† | ||
| 21.1 | Subsidiaries of Textura Corporation† | ||
| 23.1 | Consent of PricewaterhouseCoopers LLP | ||
| 23.2 | Consent of PricewaterhouseCoopers LLP | ||
| 23.3 | Consent of Mayer Brown LLP (included in the opinion to be filed as Exhibit 5.1 hereto) | ||
| 24.1 | Power of Attorney (included on the signature page hereof) | ||
- *
- To
be filed by amendment.
- †
- Incorporated by Reference to the corresponding exhibit number in our Registration Statement on Form S-1, file number 333-187745.
(b) Financial Statement Schedules
Schedule II—Valuation and Qualifying Accounts.
Insofar as indemnification for liabilities arising under the Securities Act may be permitted to directors, officers and controlling persons of the registrant pursuant to the foregoing provisions, or otherwise, the registrant has been advised that in the opinion of the Securities and Exchange Commission such indemnification is against public policy as expressed in the Securities Act and is, therefore, unenforceable. In the event that a claim for indemnification against such liabilities (other than the payment by the registrant of expenses incurred or paid by a director, officer or controlling person of the registrant in the successful defense of any action, suit or proceeding) is asserted by such director, officer or controlling person in connection with the securities being registered, the registrant will, unless in the opinion of its counsel the matter has been settled by controlling precedent, submit to a court of appropriate jurisdiction the question of whether such indemnification by it is against public policy as expressed in the Securities Act and will be governed by the final adjudication of such issue.
The undersigned registrant hereby undertakes that:
(1) For purposes of determining any liability under the Securities Act, the information omitted from the form of prospectus filed as part of this registration statement in reliance upon Rule 430A and contained in a form of prospectus filed by the registrant pursuant to Rule 424(b)(1) or (4) or 497(h) under the Securities Act shall be deemed to be part of this registration statement as of the time it was declared effective.
(2) For the purpose of determining any liability under the Securities Act, each post-effective amendment that contains a form of prospectus shall be deemed to be a new registration statement relating to the securities offered therein, and the offering of such securities at that time shall be deemed to be the initial bona fide offering thereof.
II-5
Pursuant to the requirements of the Securities Act of 1933, as amended, the registrant has duly caused this registration statement to be signed on its behalf by the undersigned, thereunto duly authorized in the City of Deerfield, State of Illinois, on this 10th day of September, 2013.
| TEXTURA CORPORATION | ||||||
By: |
/s/ PATRICK J. ALLIN |
|||||
| Name: | Patrick J. Allin | |||||
| Title: | Chief Executive Officer | |||||
KNOW ALL PERSONS BY THESE PRESENTS, that each person whose signature appears below does hereby constitute and appoint Patrick J. Allin and Jillian Sheehan, and each of them, with full power of substitution and full power to act without the other, such person's true and lawful attorney-in-fact and agent to act for such person in such person's name, place and stead, in any and all capacities, to sign any and all amendments (including post-effective amendments) to this registration statement and any related registration statement filed pursuant to Rule 462(b) under the Securities Act, and to file this registration statement, with all exhibits thereto, and other documents in connection therewith, with the Securities and Exchange Commission, granting unto said attorneys-in-fact and agents, and each of them, full power and authority to do and perform each and every act and thing requisite and necessary to be done in order to effectuate the same as fully, to all intents and purposes, as such person might or could do in person, hereby ratifying and confirming all that said attorneys-in-fact and agents may lawfully do or cause to be done by virtue hereof.
Pursuant to the requirements of the Securities Act of 1933, this registration statement has been signed below by the following persons in the capacities and on the dates indicated.
Signature
|
Title
|
Date
|
||
|---|---|---|---|---|
| /s/ PATRICK J. ALLIN Patrick J. Allin |
Chief Executive Officer and Chairman of the Board of Directors (Principal Executive Officer) | September 10, 2013 | ||
/s/ JILLIAN SHEEHAN Jillian Sheehan |
Executive Vice President and Chief Financial Officer (Principal Accounting and Financial Officer) |
September 10, 2013 |
||
/s/ GREGORY J. BESIO Gregory J. Besio |
Director |
September 10, 2013 |
II-6
Signature
|
Title
|
Date
|
||
|---|---|---|---|---|
| /s/ MATTHEW J. BOTICA Matthew J. Botica |
Director | September 10, 2013 | ||
/s/ EDWARD K. CHANDLER Edward K. Chandler |
Director |
September 10, 2013 |
||
/s/ DAVID HABIGER David Habiger |
Director |
September 10, 2013 |
||
/s/ R. MICHAEL MURRAY, JR. R. Michael Murray, Jr. |
Director |
September 10, 2013 |
||
/s/ GENERAL PETER PACE General Peter Pace |
Director |
September 10, 2013 |
||
/s/ DAVID G. PATTERSON David G. Patterson |
Director |
September 10, 2013 |
||
/s/ ROBERT P. WAYMAN Robert P. Wayman |
Director |
September 10, 2013 |
II-7
EXHIBIT INDEX
| Exhibit Number |
Description of Exhibits | ||
|---|---|---|---|
| 1.1 | Form of Underwriting Agreement* | ||
| 2.1 | Asset Purchase Agreement, dated October 19, 2011, by and between Textura Corporation and Gradebeam LLC† | ||
| 2.2 | Contribution Agreement, dated November 7, 2011, by and among Submittal Exchange Holdings, LLC, Textura Corporation, Submittal Exchange, LLC and the members of Submittal Exchange, LLC† | ||
| 2.3 | Asset Purchase Agreement, dated as of January 31, 2013, by and among Textura PlanSwift Corporation, Textura Corporation and PlanSwift, LLC† | ||
| 3.1 | Restated Certificate of Incorporation of Textura Corporation† | ||
| 3.2 | [Reserved] | ||
| 3.3 | Form of Amendment to Certificate of Incorporation of Textura Corporation† | ||
| 3.4 | Amended and Restated Bylaws of Textura Corporation† | ||
| 4.1 | Form of Common Stock Certificate† | ||
| 5.1 | Opinion of Mayer Brown LLP* | ||
| 10.1 | Textura Corporation Stock Incentive Plan, as amended and restated effective as of January 1, 2009 (including form of Stock Grant Agreement, form of Option Award Agreement and form of Restricted Stock Unit Award Agreement)† | ||
| 10.2 | Textura Corporation Long-Term Incentive Plan† | ||
| 10.3 | Form of Option Agreement† | ||
| 10.4 | Form of Restricted Stock Unit Award Agreement† | ||
| 10.5 | Construction Loan Agreement, between Textura Corporation and First Midwest Bank, dated August 14, 2007† | ||
| 10.6 | Construction Mortgage, Security Agreement, Assignment of Leases and Rents and Fixture Filing, between Textura Corporation and First Midwest Bank, dated August 14, 2007† | ||
| 10.7 | Promissory Note, dated August 14, 2007† | ||
| 10.8 | Modification of Loan Documents, between Textura Corporation and First Midwest Bank, dated August 14, 2009† | ||
| 10.9 | Amended and Restated Promissory Note, dated August 14, 2009† | ||
| 10.10 | Second Modification of Loan Documents, between Textura Corporation and First Midwest Bank, dated August 14, 2011† | ||
| 10.11 | Covenant Compliance Waiver, between Textura Corporation and First Midwest Bank, dated November 29, 2012† | ||
| 10.12 | Employment Agreement of Patrick J. Allin, dated October 1, 2010† | ||
| 10.13 | Offer letter with Howard Niden, dated February 28, 2011† | ||
| 10.14 | Employment Agreement of Patrick J. Allin, dated March 28, 2013† | ||
| 10.15 | Employment Agreement of William Eichhorn, dated March 28, 2013† | ||
| 10.16 | Form of Executive Officer Employment Agreement† | ||
| 10.17 | Form of Convertible/Redeemable Debenture† | ||
| 10.18 | Form of 10% Notes due 2016† | ||
| 10.19 | Warrant issued to Aon Risk Services Central, Inc.† | ||
| 10.20 | Warrant issued to First Midwest Bank† | ||
| 10.21 | Form of Warrant for 2009 Convertible Debentures† | ||
| 10.22 | Form of Warrant for 2010 Convertible Debentures† | ||
| 10.23 | Form of Warrant for 2011 Convertible Debentures† | ||
| 10.24 | Form of Warrant for 10% Notes due 2016† | ||
| 10.25 | Software Development and Service Agreement, between Textura Corporation and Aon Risk Services Central, Inc., dated June 15, 2010† | ||
| 10.26 | 2010 Referral Fee Agreement, between Textura Corporation and Aon Risk Services Central, Inc., dated June 15, 2010† | ||
| 10.27 | Third Amendment to Construction Loan Agreement and the other Loan Documents and Waiver† | ||
| 10.28 | Form of Indemnification Agreement with Directors and Executive Officers† | ||
| Exhibit Number |
Description of Exhibits | ||
|---|---|---|---|
| 21.1 | Subsidiaries of Textura Corporation† | ||
| 23.1 | Consent of PricewaterhouseCoopers LLP | ||
| 23.2 | Consent of PricewaterhouseCoopers LLP | ||
| 23.3 | Consent of Mayer Brown LLP (included in the opinion to be filed as Exhibit 5.1 hereto) | ||
| 24.1 | Power of Attorney (included as the signature page hereof) | ||
- *
- To
be filed by amendment.
- †
- Incorporated by Reference to the corresponding exhibit number in our Registration Statement on Form S-1, file number 333-187745.