Attached files
| file | filename |
|---|---|
| 8-K - FORM 8-K - RADIANT LOGISTICS, INC | d596004d8k.htm |
Exhibit 99.1
(NYSE-MKT: RLGT)
Liolios Group
2nd Annual Gateway Conference
September 10, 2013
This presentation may include forward-looking statements within the meaning of Section 27A of the Securities Act of 1933 as amended, and Section 21E of the Securities Exchange Act of 1934. We have based these forward-looking statements on our current expectations and projections about future events. These forward-looking statements are subject to known and unknown risks, uncertainties and assumptions about us and our affiliate companies, that may cause our actual results, levels of activity, performance or achievements to be materially different from any future results, levels of activity, performance or achievements expressed or implied by such forward-looking statements. Factors that might cause or contribute to such a discrepancy include, but are not limited to, those identified in our other Securities and Exchange Commission filing and other public documents, including our Annual Report on Form 10-K filed on September 26, 2012, which can be found on our corporate Web site, www.radiantdelivers.com.
Page 1
Our Mission
To build a global transportation and logistics company through organic growth and the strategic acquisition of best-of-breed non-asset based transportation and logistics providers.
Page 2
Overview
Page 3
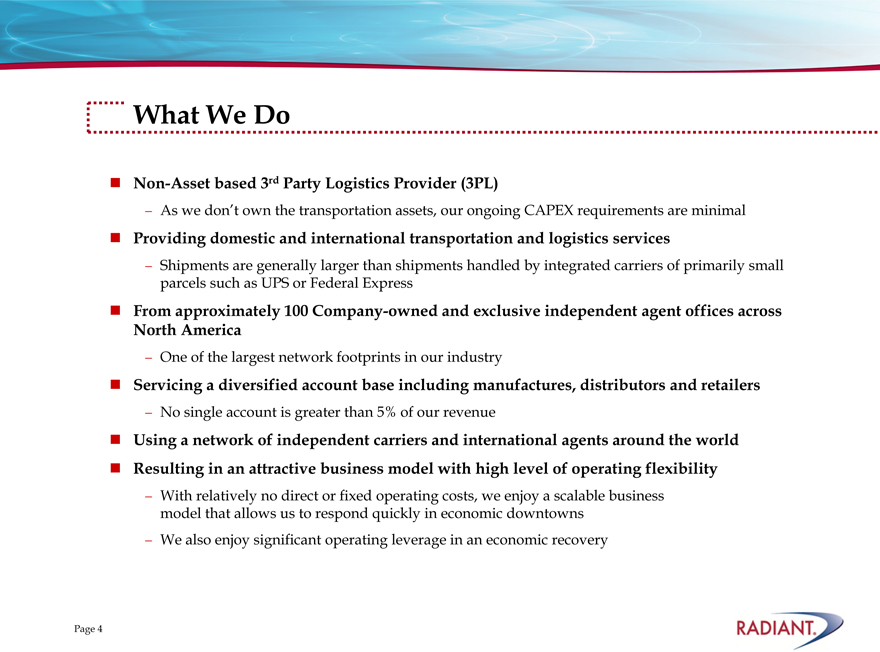
What We Do
Non-Asset based 3rd Party Logistics Provider (3PL)
As we don’t own the transportation assets, our ongoing CAPEX requirements are minimal
Providing domestic and international transportation and logistics services
Shipments are generally larger than shipments handled by integrated carriers of primarily small parcels such as UPS or Federal Express
From approximately 100 Company-owned and exclusive independent agent offices across North America
One of the largest network footprints in our industry
Servicing a diversified account base including manufactures, distributors and retailers
No single account is greater than 5% of our revenue
Using a network of independent carriers and international agents around the world Resulting in an attractive business model with high level of operating flexibility
With relatively no direct or fixed operating costs, we enjoy a scalable business model that allows us to respond quickly in economic downtowns
We also enjoy significant operating leverage in an economic recovery
Page 4
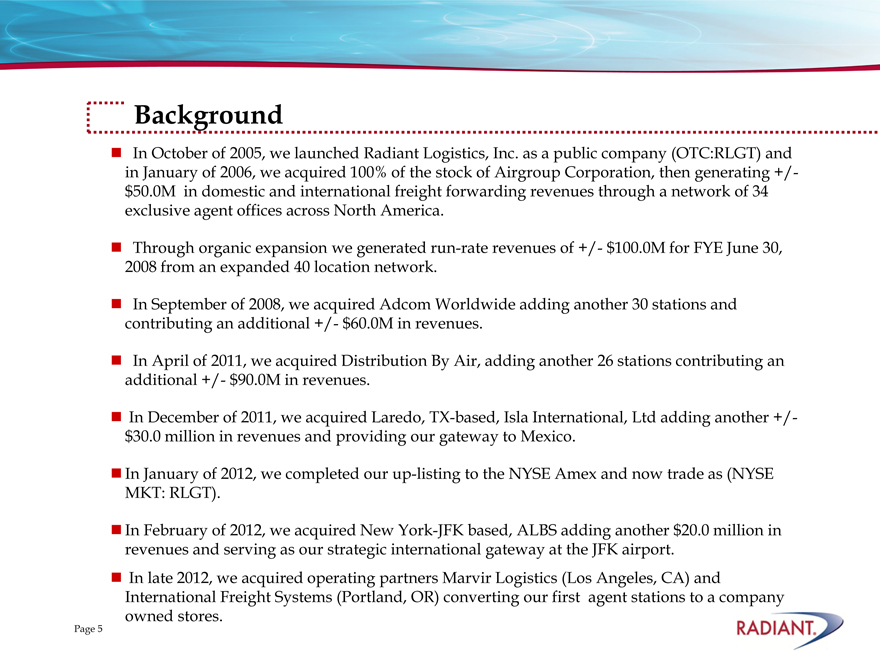
Background
In October of 2005, we launched Radiant Logistics, Inc. as a public company (OTC:RLGT) and in January of 2006, we acquired 100% of the stock of Airgroup Corporation, then generating +/-$50.0M in domestic and international freight forwarding revenues through a network of 34 exclusive agent offices across North America.
Through organic expansion we generated run-rate revenues of +/- $100.0M for FYE June 30, 2008 from an expanded 40 location network.
In September of 2008, we acquired Adcom Worldwide adding another 30 stations and contributing an additional +/- $60.0M in revenues.
In April of 2011, we acquired Distribution By Air, adding another 26 stations contributing an additional +/- $90.0M in revenues.
In December of 2011, we acquired Laredo, TX-based, Isla International, Ltd adding another +/-$30.0 million in revenues and providing our gateway to Mexico.
In January of 2012, we completed our ur up-listing to the NYSE YSE Amex mex and nd now trade as (NYSE MKT: RLGT).
In February of 2012, we acquired New York-JFK based, ALBS adding another $20.0 million in revenues and serving as our strategic international gateway at the JFK airport.
In late 2012, we acquired operating partners Marvir Logistics (Los Angeles, CA) and International Freight Systems (Portland, OR) converting our first agent stations to a company owned stores.
Page 5
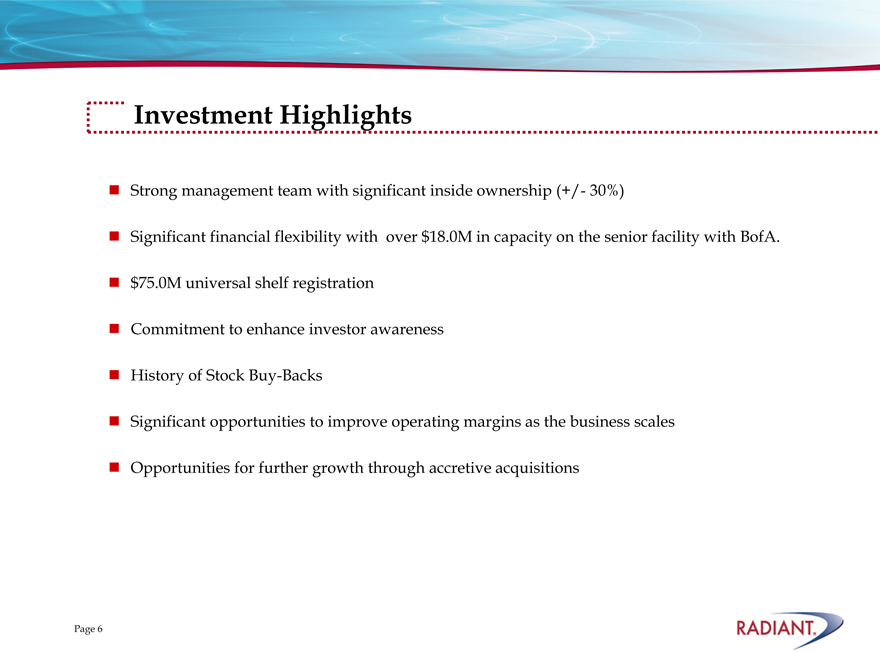
Investment Highlights
Strong management team with significant inside ownership (+/- 30%)
Significant financial flexibility with over $18.0M in capacity on the senior facility with BofA.
$75.0M universal shelf registration
Commitment to enhance investor awareness
History of Stock Buy-Backs
Significant opportunities to improve operating margins as the business scales
Opportunities for further growth through accretive acquisitions
Page 6
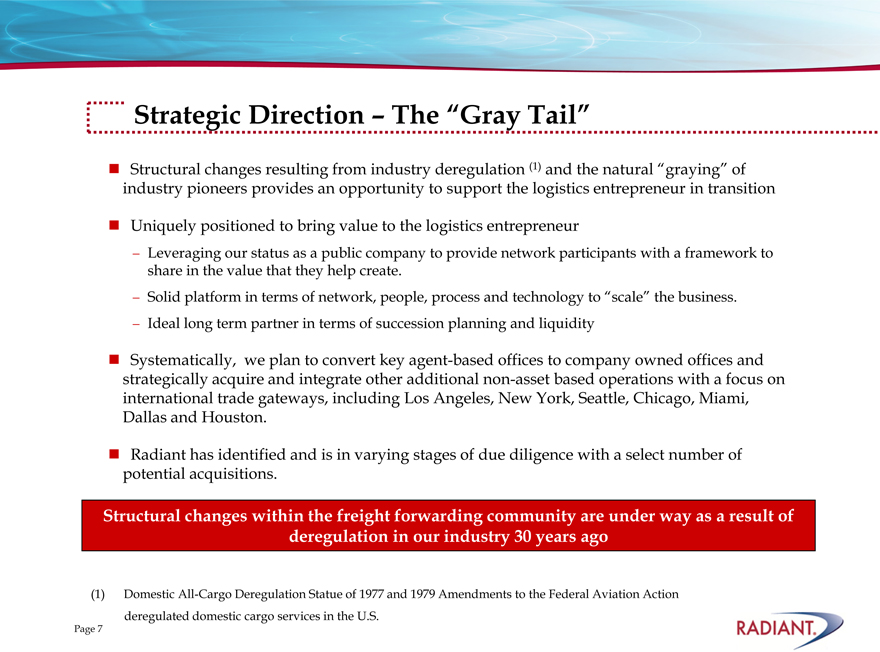
Strategic Direction – The “Gray Tail”
Structural changes resulting from industry deregulation (1) and the natural “graying” of industry pioneers provides an opportunity to support the logistics entrepreneur in transition
Uniquely positioned to bring value to the logistics entrepreneur
Leveraging our status as a public company to provide network participants with a framework to share in the value that they help create.
Solid platform in terms of network, people, process and technology to “scale” the business.
Ideal long term partner in terms of succession planning and liquidity
Systematically, we plan to convert key agent-based offices to company owned offices and strategically acquire and integrate other additional non-asset based operations with a focus on international trade gateways, including Los Angeles, New York, Seattle, Chicago, Miami, Dallas and Houston.
Radiant has identified and is in varying stages of due diligence with a select number of potential acquisitions cquisitions.
Structural changes within the freight forwarding community are under way as a result of deregulation in our industry 30 years ago
(1) Domestic All-Cargo Deregulation Statue of 1977 and 1979 Amendments to the Federal Aviation Action deregulated domestic cargo services in the U.S.
Page 7

The Network
Page 8
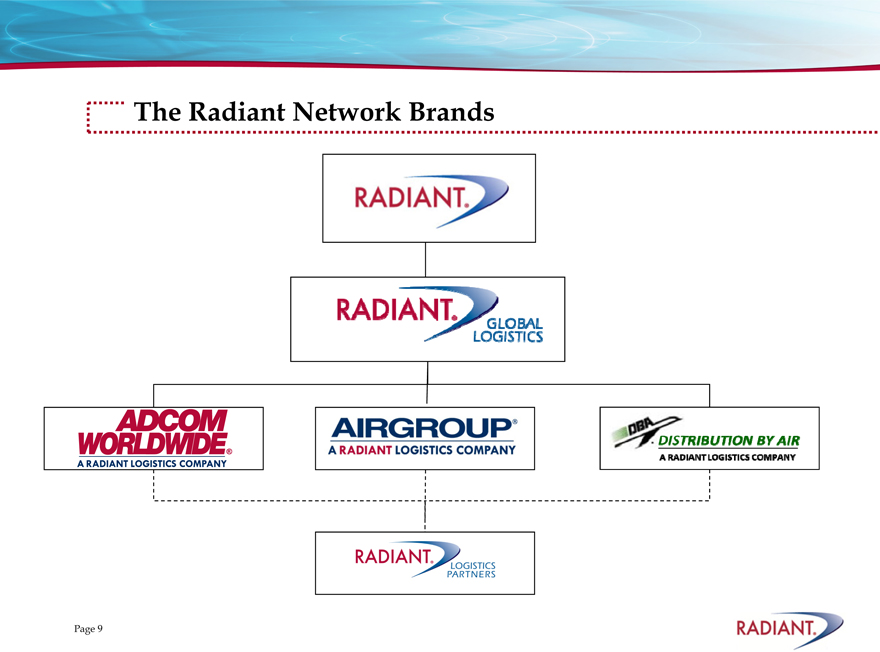
The Radiant Network Brands
Page 9
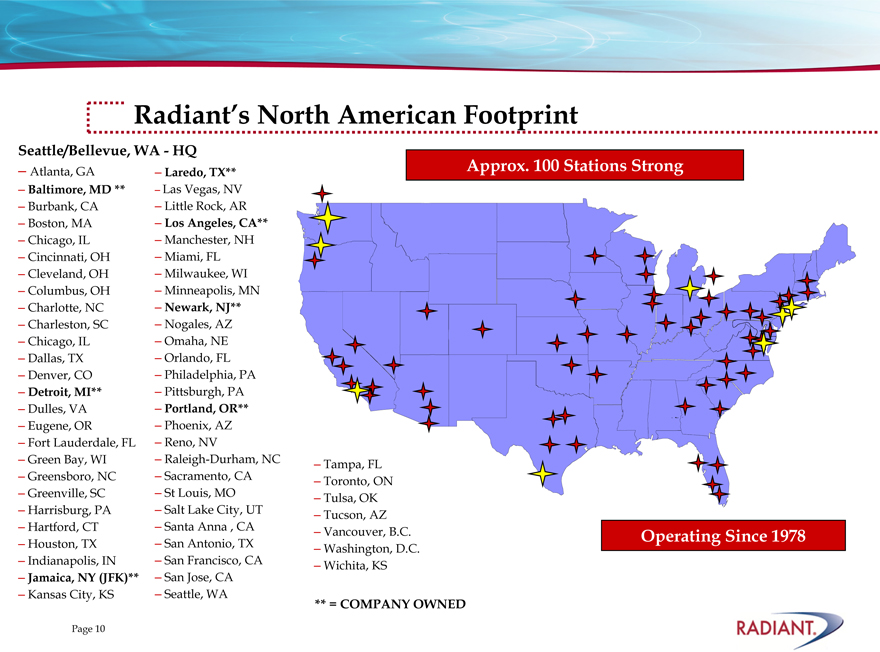
Radiant’s North American Footprint
Seattle/Bellevue, WA—HQ
– Atlanta, GA – Laredo, TX**
Baltimore, MD ** – Las Vegas, NV
– Burbank, CA – Little Rock, AR
– Boston, MA – Los Angeles, CA**
– Chicago, IL – Manchester, NH
– Cincinnati, OH – Miami, FL
– Cleveland, OH – Milwaukee, WI
– Columbus, OH – Minneapolis, MN
– Charlotte, NC – Newark, NJ**
– Charleston, SC – Nogales, AZ
– Chicago, IL – Omaha, NE
– Dallas, TX – Orlando, FL
– Denver, CO – Philadelphia, PA
– Detroit, MI** – Pittsburgh, PA
– Dulles, VA – Portland, OR**
– Eugene, OR – Phoenix, AZ
– Fort Lauderdale, FL – Reno, NV
– Green Bay, WI – Raleigh-Durham, NC
– Greensboro, NC – Sacramento, CA
– Greenville, SC – St Louis, MO
– Harrisburg, PA – Salt Lake City, UT
– Hartford, CT – Santa Anna , CA
– Houston, TX – San Antonio, TX
– Indianapolis, IN – San Francisco, CA
– Jamaica, NY (JFK)** – San Jose, CA
– Kansas City, KS – Seattle, WA
– Tampa, FL
– Toronto, ON
– Tulsa, OK
– Tucson, AZ
– Vancouver, B.C.
– Washington, D.C. Wichita, KS
Approx. 100 Stations Strong
Operating Since 1978
** = COMPANY OWNED
Page 10
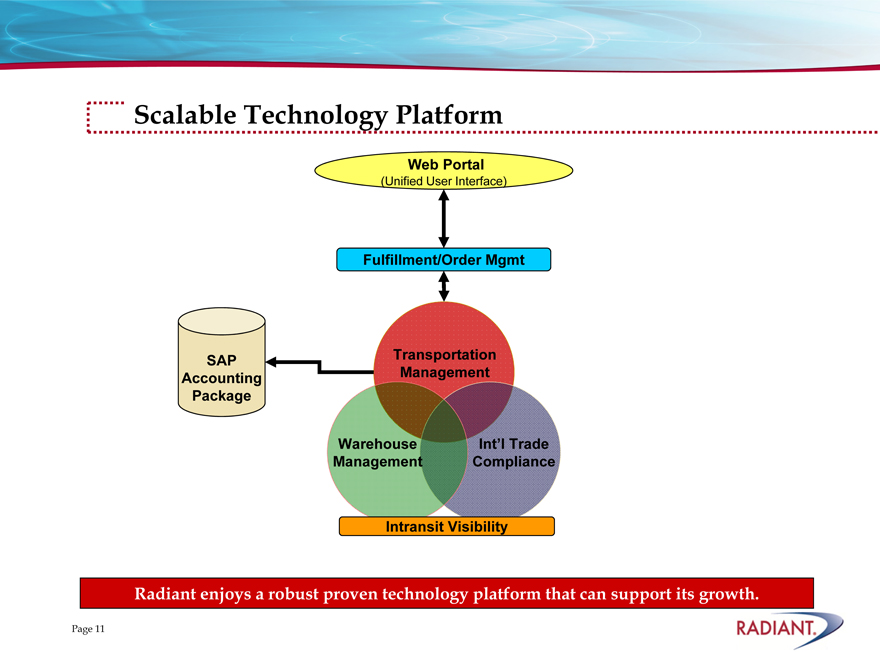
Scalable Technology Platform
Web Portal
(Unified User Interface)
Fulfillment/Order Mgmt
SAP Accounting Package
Transportation Management
Warehouse Management
Int’l Trade Compliance
Intransit Visibility
Radiant enjoys a robust proven technology platform that can support its growth.
Page 11
Financial Highlights
Page 12
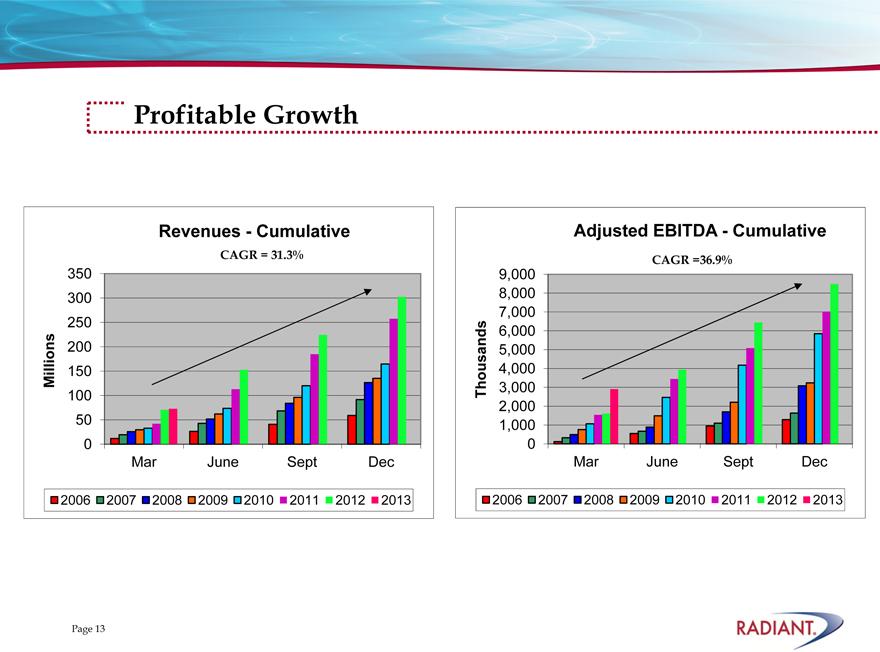
Profitable Growth
Revenues—Cumulative
CAGR = 31.3%
350 300 250 200 150 100 50 0
Millions
Mar June Sept Dec
2006 2007 2008 2009 2010 2011 2012 2013
Adjusted EBITDA—Cumulative
CAGR =36.9%
Thousands
9,000 8,000 7,000 6,000 5,000 4,000 3,000 2,000 1,000 0
Mar June Sept Dec
2006 2007 2008 2009 2010 2011 2012 2013
Page 13
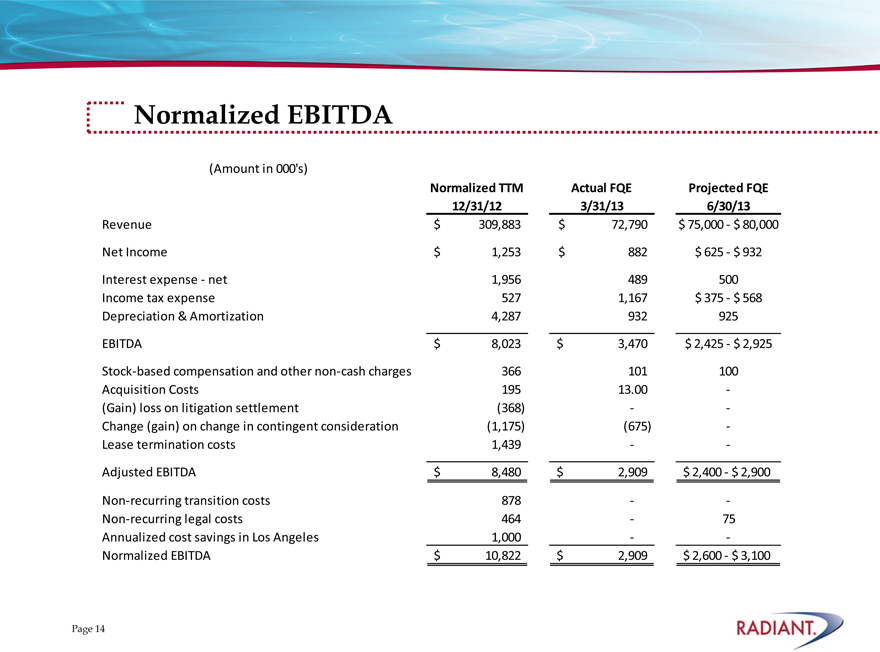
Normalized EBITDA
(Amount in 000’s)
Normalized TTM Actual FQE Projected FQE
12/31/12 3/31/13 6/30/13
Revenue $ 309,883 $ 72,790 $ 75,000— $ 80,000
Net Income $ 1,253 $ 882 $ 625— $ 932
Interest expense—net 1,956 489 500
Income tax expense 527 1,167 $ 375— $ 568
Depreciation & Amortization 4,287 932 925
EBITDA $ 8,023 $ 3,470 $ 2,425— $ 2,925
Stock-based compensation and other non-cash charges 366 101 100
Acquisition Costs 195 13.00 —
(Gain) loss on litigation settlement (368)
Change (gain) on change in contingent consideration (1,175) (675) —
Lease termination costs 1,439
Adjusted EBITDA $ 8,480 $ 2,909 $ 2,400—$ 2,900
Non-recurring transition costs 878
Non-recurring legal costs 464 — 75
Annualized cost savings in Los Angeles 1,000
Normalized EBITDA $ 10,822 $ 2,909 $ 2,600—$ 3,100
Page 14
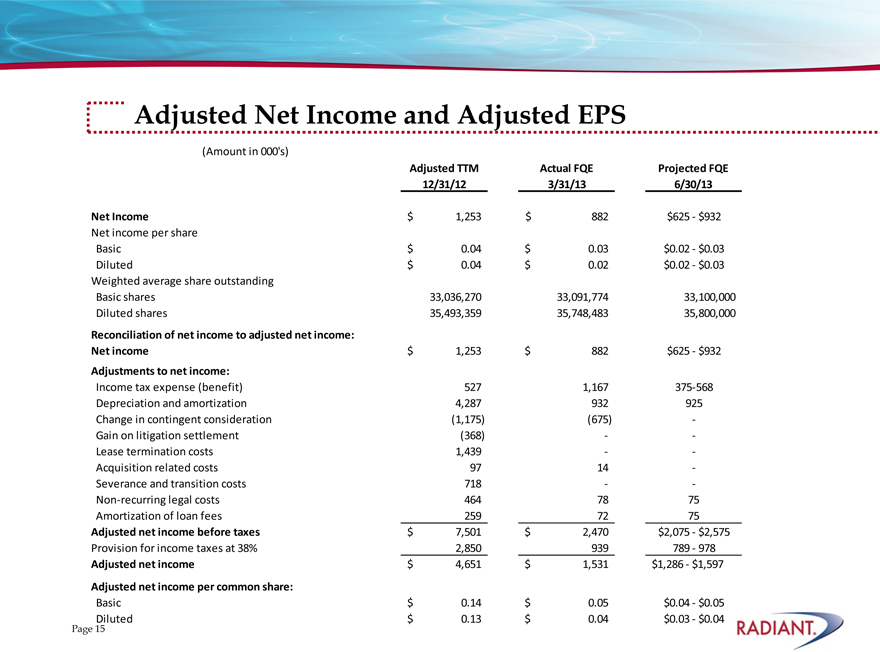
Adjusted Net Income and Adjusted EPS
(Amount in 000’s)
Adjusted TTM Actual FQE Projected FQE
12/31/12 3/31/13 6/30/13
Net Income $ 1,253 $ 882 $625— $932
Net income per share
Basic $ 0.04 $ 0.03 $0.02— $0.03
Diluted $ 0.04 $ 0.02 $0.02— $0.03
Weighted average share outstanding
Basic shares 33,036,270 33,091,774 33,100,000
Diluted shares 35,493,359 35,748,483 35,800,000
Reconciliation of net income to adjusted net income:
Net income $ 1,253 $ 882 $625— $932
Adjustments to net income:
Income tax expense (benefit) 527 1,167 375-568
Depreciation and amortization 4,287 932 925
Change in contingent consideration (1,175) (675) —
Gain on litigation settlement (368) ——
Lease termination costs 1,439 ——
Acquisition related costs 97 14 —
Severance and transition costs 718 ——
Non-recurring legal costs 464 78 75
Amortization of loan fees 259 72 75
Adjusted net income before taxes $ 7,501 $ 2,470 $2,075— $2,575
Provision for income taxes at 38% 2,850 939 789— 978
Adjusted net income $ 4,651 $ 1,531 $1,286—$1,597
Adjusted net income per common share:
Basic $ 0.14 $ 0.05 $0.04— $0.05
Diluted $ 0.13 $ 0.04 $0.03— $0.04
Page 15
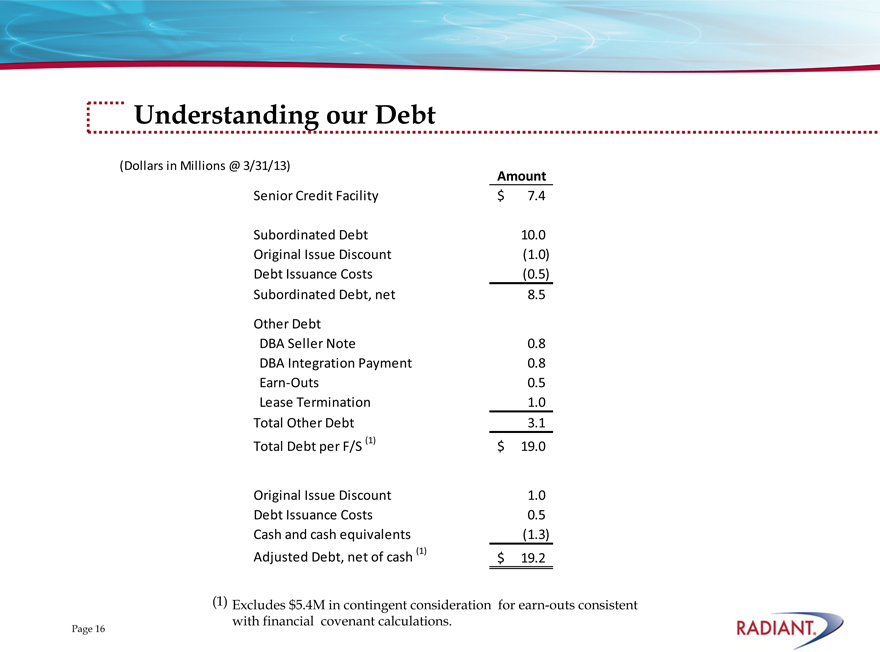
Understanding our Debt
(Dollars in Millions @ 3/31/13)
Amount
Senior Credit Facility $ 7.4
Subordinated Debt 10.0
Original Issue Discount (1.0)
Debt Issuance Costs (0.5)
Subordinated Debt, net 8.5
Other Debt
DBA Seller Note 0.8
DBA Integration Payment 0.8
Earn-Outs 0.5
Lease Termination 1.0
Total Other Debt 3.1
Total Debt per F/S (1) $ 19.0
Original Issue Discount 1.0
Debt Issuance Costs 0.5
Cash and cash equivalents (1.3)
Adjusted Debt, net of cash (1) $ 19.2
| (1) |
|
Excludes $5.4M in contingent consideration for earn-outs consistent with financial covenant calculations. |
Page 16
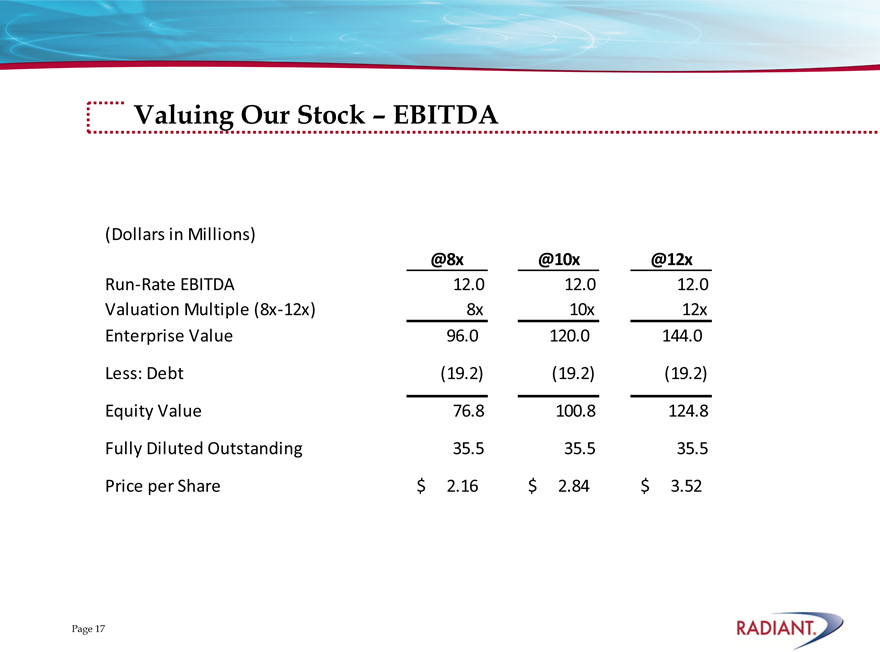
Valuing Our Stock – EBITDA
(Dollars in Millions)
@8x @10x @12x
Run-Rate EBITDA 12.0 12.0 12.0
Valuation Multiple (8x-12x) 8x 10x 12x
Enterprise Value 96.0 120.0 144.0
Less: Debt (19.2) (19.2) (19.2)
Equity Value 76.8 100.8 124.8
Fully Diluted Outstanding 35.5 35.5 35.5
Price per Share $ 2.16 $ 2.84 $ 3.52
Page 17
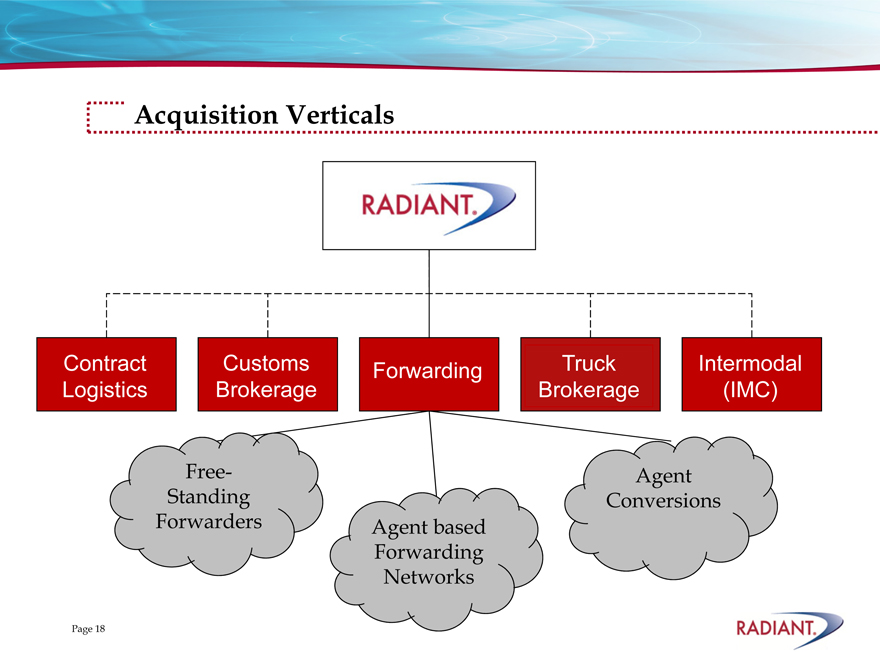
Acquisition Verticals
Contract Logistics
Customs Brokerage
Forwarding
Truck Brokerage
Intermodal (IMC)
Free-Standing Forwarders
Agent based Forwarding Networks
Agent Conversions
Page 18
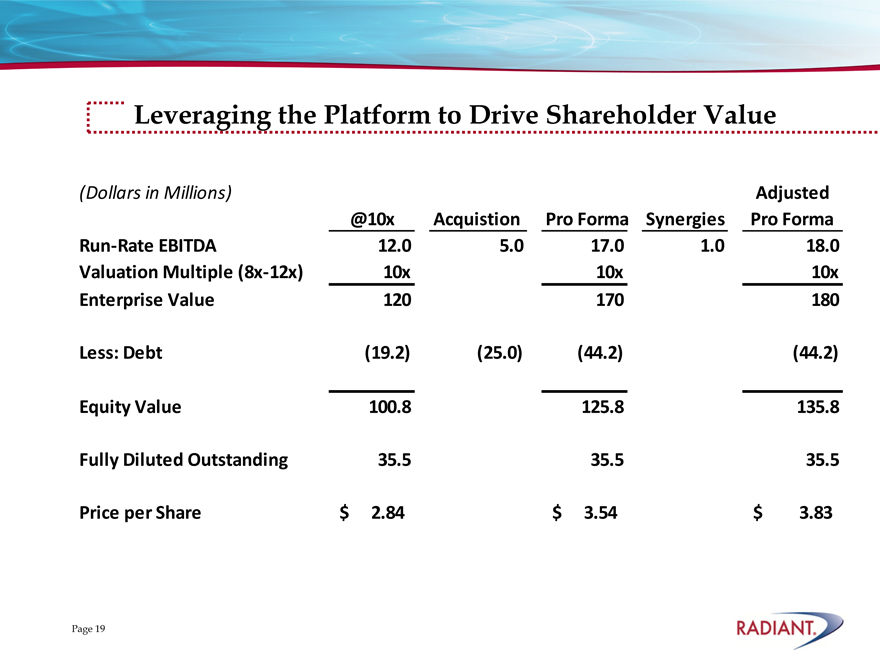
Leveraging the Platform to Drive Shareholder Value
(Dollars in Millions) Adjusted
@10x Acquistion Pro Forma Synergies Pro Forma
Run-Rate EBITDA 12.0 5.0 17.0 1.0 18.0
Valuation Multiple (8x-12x) 10x 10x 10x
Enterprise Value 120 170 180
Less: Debt (19.2) (25.0) (44.2) (44.2)
Equity Value 100.8 125.8 135.8
Fully Diluted Outstanding 35.5 35.5 35.5
Price per Share $ 2.84 $ 3.54 $ 3.83
Page 19
Capital Allocation
Refinancing $10.0M in mezzanine debt
Organic Growth Initiatives
Productivity Improvements
Margin Expansion
Accretive Acquisitions
Stock Buy-Backs
Page 20
®
It’s the Network that Delivers!
THANK YOU
Page 21