Attached files
| file | filename |
|---|---|
| 8-K - FORM 8-K - People's United Financial, Inc. | d595120d8k.htm |
 Investor Contact:
Peter Goulding, CFA
203-338-6799
peter.goulding@peoples.com
Barclays Global Financial Services Conference
September 10, 2013
Exhibit 99.1 |
 1
Forward-Looking Statement
Certain statements contained in this release are forward-looking in nature. These include all
statements about People's United Financial's plans, objectives, expectations and other
statements that are not historical facts, and usually use words such as "expect,"
"anticipate," "believe," "should" and similar expressions. Such
statements represent management's current beliefs, based upon information available at the time
the statements are made, with regard to the matters addressed. All forward-looking
statements are subject to risks and uncertainties that could cause People's United Financial's actual
results or financial condition to differ materially from those expressed in or implied by such
statements. Factors of particular importance to People’s United Financial include, but are
not limited to: (1) changes in general, national or regional economic conditions; (2) changes
in interest rates; (3) changes in loan default and charge-off rates; (4) changes in deposit
levels; (5) changes in levels of income and expense in non-interest income and expense
related activities; (6) residential mortgage and secondary market activity; (7) changes in
accounting and regulatory guidance applicable to banks; (8) price levels and conditions in the
public securities markets generally; (9) competition and its effect on pricing, spending,
third-party relationships and revenues; (10) the successful integration of acquisitions; and (11)
changes in regulation resulting from or relating to financial reform legislation. People's
United Financial does not undertake any obligation to update or revise any forward-looking
statements, whether as a result of new information, future events or otherwise.
|
 2
Corporate Overview
Snapshot as of June 30, 2013
People’s United Financial, Inc.
NASDAQ (PBCT)
Headquarters:
Bridgeport, CT
Chief Executive Officer:
Jack Barnes
Chief Financial Officer:
Kirk Walters
Market Capitalization (9/6/13):
$4.6 billion
Assets:
$31.3 billion
Loans:
$22.9 billion
Deposits:
$22.0 billion
Branches:
418
ATMs:
638
Standalone ATMs:*
109
Founded:
1842
* Includes 25 ATMs in Stop & Shop locations where a branch is not
present |
 3
Fortified Foundation for Growth
Our Relationship Based World |
 Retail & Business
Banking Franchise Distribution
400+ branches over 6 states
•
~33% of branches are in-store
600+ ATMs
Online & mobile banking
Call center operations located in Bridgeport,
CT and Burlington, VT
Scale
5
th
in deposit market share in New England *
Customer base
Approximately 800,000 commercial, business
banking and consumer relationships
* Source: SNL Financial
4 |
 5
Deepening Market Presence
Connecticut
Massachusetts
Vermont
New York
New Hampshire
Maine
Source: SNL Financial
Branches
$BN
%
1
B of A
151
24.4
24.0
2
Webster
123
12.0
11.8
3
People's United
165
10.9
10.8
4
Wells Fargo
76
7.3
7.2
5
TD Bank
81
5.9
5.8
6
First Niagara
85
4.6
4.5
7
JPM Chase
53
4.5
4.4
8
Citi
20
3.0
2.9
9
Liberty
48
2.9
2.8
10
RBS
47
2.5
2.5
Branches
$BN
%
1
B of A
255
54.3
20.0
2
RBS
253
30.9
11.4
3
Santander
229
18.9
7.0
4
TD Bank
157
10.6
3.9
5
Eastern Bank
98
6.7
2.5
6
Independent Bank
85
4.7
1.7
7
Middlesex
31
3.5
1.3
8
People's United
56
3.2
1.2
9
Boston Private
11
2.9
1.1
10
Brookline
29
2.4
0.9
Branches
$BN
%
1
People's United
42
2.6
22.4
2
TD Bank
34
2.6
22.0
3
Merchants
33
1.2
10.6
4
RBS
21
0.9
7.3
5
KeyCorp
13
0.8
6.7
6
Northfield
13
0.5
4.3
7
Community
14
0.4
3.7
8
Union
13
0.4
3.4
9
Berkshire Hills
7
0.3
2.9
10
Passumpsic
7
0.3
2.8
Branches
$BN
%
1
JPM Chase
802
392.9
37.1
2
Citi
269
69.6
6.6
3
B of A
352
60.1
5.7
4
HSBC
162
57.0
5.4
5
Capital One
274
38.8
3.7
6
M&T
298
33.3
3.1
7
TD Bank
228
22.4
2.1
8
KeyCorp
260
18.2
1.7
9
Wells Fargo
86
17.9
1.7
10
First Niagara
209
16.1
1.5
35
People's United
98
2.5
0.2
Branches
$BN
%
1
RBS
80
6.8
24.4
2
TD Bank
72
5.4
19.3
3
B of A
28
4.8
17.4
4
People's United
29
1.4
4.9
5
NH Mutual
18
1.0
3.7
6
BNH
23
0.9
3.2
7
Santander
20
0.8
2.9
8
NH Thrift
20
0.8
2.8
9
Northway
18
0.7
2.4
10
Centrix
6
0.7
2.3
Branches
$BN
%
1
TD Bank
56
14.4
43.3
2
KeyCorp
59
2.6
7.9
3
Bangor Bancorp
60
2.0
6.1
4
Camden National
44
1.8
5.3
5
B of A
19
1.4
4.1
6
First Bancorp
16
1.0
3.1
7
Machias
14
0.8
2.4
8
People's United
28
0.8
2.4
9
Bar Harbor
16
0.8
2.3
10
Norway
22
0.7
2.2
Leading market position in the best commercial banking market in the US
#1 in Fairfield County, CT, 65 branches, $6.1BN, 18.4% deposit market share |
 6
Strategic Vision Outlined in mid-2010
Optimize the Existing Business
Continue to grow high quality, in-footprint, relationship-based C&I,
commercial real estate, home equity and select residential loans
Maintain conservative underwriting standards and focus on asset quality
Compete on service and relationships and maintain pricing discipline
Yield
enhancing
decisions
in
securities
portfolio
without
credit
risk
or
significant
duration risk
Further leverage our brand
Deepen our presence in metro New York and greater Boston markets
Continue to upgrade our products and services
Build out our small business lending capabilities
Continue to deepen wealth management and insurance relationships
Improved infrastructure facilitates future growth
Core systems conversion complete
Our objective is to reach 55% efficiency ratio and 1.25% ROAA over the longer
term |
 7
Substantial Progress Since 1Q 2010
Continued to build on our premium brand
Significant
growth
runway
within
existing
markets
–
expanding
in
two
of
the
largest MSAs in the US (New York City, #1, Boston, #10)
Attracted senior level talent to augment an already strong leadership team
Significantly enhanced corporate governance and risk capabilities
Maintained
superior
asset
quality
with
NCOs
/
Average
Loans
of
26bps
Lowered
the
efficiency
ratio
from
76.1%
in
1Q
2010
to
62.7%
in
2Q
2013
Grew
operating
earnings
per
share
at
a
30%
compound
annual
growth
rate
Operating
ROAA
has
increased
35%
from
60bps
in
1Q
2010
to
81bps
in
2Q
2013
Operating
ROATE
has
increased
610bps
from
3.2%
in
1Q
2010
to
9.3%
in
2Q
2013
Returned
over
$1.7BN
of
capital
to
shareholders
through
dividends
and
share
repurchases –
over 35% of our current market capitalization |
 8
Growing loans and deposits organically
Continue to grow in existing markets
We have an outstanding brand to leverage in under-represented large markets
Lower deposit costs
Improve DDA mix, commercial mix
Lower deposit costs on acquired deposits
Strengthen fee income
Continue to tightly managed expense levels
Operating Leverage
Grow Revenue While Reducing Expenses |
 9
Consistent Loan Growth
Since the end of 2010, People’s United is one of only six banks within the top 50 by
assets that have grown loans in each quarter
Source:
SNL Financial. Excludes trust banks. Statements based on Total Gross Loans and Finance Leases, as
reported, net of unearned discounts and gross of loss reserves. Does not include accrued
interest on loans Notes:
Includes People’s United, First Niagara, First Republic, Signature, UMB and Prosperity
Reflects completion of Danvers Bancorp acquisition in 2Q 2011
Quarterly Loan Growth Since 1Q 2011
PBCT Median = 1.67%
Top 50 Median = 1.09%
¹
1
2 |
 10
Revenue Opportunities
Continue to deepen our presence in heritage markets such as Connecticut and
Vermont
Substantial growth prospects in larger markets such as New York metro and greater
Boston
Total New York 1H 2013 loan originations run-rate ~$2.0BN
•
Increased New York commercial relationship managers to 18 from zero since 1Q
2010 •
Significant branch expansion in New York with 98 branches up from 5 in 1Q 2010; 58
branches, or 59%, are in- store locations
Total Massachusetts 1H 2013 loan originations run-rate ~$660MM
•
Increased Massachusetts commercial relationship managers to 33 from 14 since 1Q
2010 •
Solid branch foundation in Massachusetts with 56 branches up from 19 in 1Q
2010 •
Currently 3 de novo branches with over $40MM deposits: Prudential Center in Boston
(opened November 2010); Milk Street in Boston (opened December 2010);
Lexington, MA (opened July 2011) |
 11
Under-represented asset classes ramping up
Recently hired senior professionals to lead large corporate and government banking
businesses New York Commercial
Real
Estate
gaining
traction
as
evidenced
by
strong
growth
Increased Private Banking activity with initial focus on CT, metro New York and
greater Boston Significant progress within asset-based and mortgage
warehouse lending teams Enhancing wealth management offering
Proprietary asset allocation and risk management strategies are implemented both
internally and with a suite of external managers who represent our "best
in class" recommendations •
UMA
technology
allows
us
to
“rent”
intellectual
capital
–
no
customer
funds
leave
the
bank
Increasing momentum in other fee income businesses with a focus on
cross-sell Commercial
insurance:
revamped
systems
and
combined
all
agencies
into
a
single
entity
Delivering interest rate swaps and foreign exchange products to existing corporate
customers Expanding international trade finance with the recent hire of a
senior executive Growing cash management, merchant and payroll services
Revenue Opportunities
Multiple Levers for Growth |
 12
Average Deposits Per Branch ($MM)
Southern New York Branch Update
One Year Performance Review
Deposits as of 6/30/13 totaled $591 million, up $269 million or 84% since close
Branches provide significant support to our commercial and retail banking efforts
Strengthened brand awareness in the New York market is also accelerating the
expansion of fee income businesses
“Break-even”
Originally
Forecast to
Occur at
6/30/14
The acquired Southern New York branches have surpassed expectations
Acquired NY In-store
Branches at 6/25/12
Acquired NY In-store
Branches at 6/30/13
PBCT CT In-store
Branches at 6/30/13
Note: Represents an activity-based approach versus a branch of origination approach as reported
by the FDIC |
 13
Connecticut In-store Versus Traditional Branch Business (Last Twelve Months
Through 6/30/13) In-store Versus Traditional Branches
Connecticut
On average, in-store locations are open 37% more hours per week than traditional
branches (56 hours vs. 41 hours) but are 30% less expensive to operate
Partnership allows us to leverage our brand with the ~1.8 million shoppers who
visit Connecticut Stop & Shop stores every week
In-store locations operate under the same business model as traditional branches
and sell all the Bank’s products and services
Mortgages, Home Equity Loans, Business Loans and Investments*
Connecticut in-store branches accounted for a significant portion of the new
branch business booked in the market
Consumer
Checking Accounts
Opened
Savings Accounts
Opened
Business Checking
Accounts Opened
Home Equity Loan
Originations
Mortgage Loan
Originations
Business Banking
Loan Originations
Investment Sales
In-store Branches
Traditional Branches
* Sold by employees who are also licensed representatives of our brokerage affiliate |
 14
Expense Progress
Estimated Cost Savings Analysis
Source: SNL Financial
Note:
“Pro
Forma
/
Actual”
represents
PBCT
operating
noninterest
expense
and
the
actual
expenses
at
the
acquired
institutions.
Acquisition target costs fall away as the acquisitions are completed.
“Without
Expense
Initiatives”
represents
PBCT
operating
noninterest
expense
and
the
actual
expenses
at
the
acquired
institutions in 4Q09, and then applies the peer median expense growth rate in each subsequent
quarter Cost savings overlooked: the ~$30MM in additional annual expenses from the acquired
Southern New York branches has been partially offset by ~$16MM of annual cost
reduction initiatives on a year-over-year basis
As of 2Q 2013 we have eliminated ~$118MM of annual expenses, or 13% of the annual
cost base without expense initiatives
205
235
Operating Noninterest Expense ($MM)
Pro Forma / Actual
Without Expense Initiatives
.
$30MM
Cost
Savings |
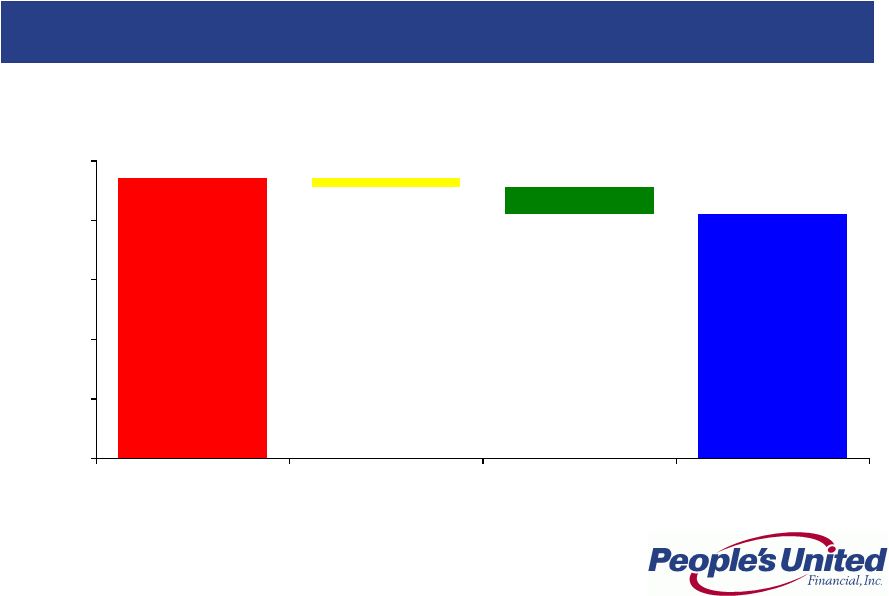 15
Expense Progress
Estimated Cost Savings Analysis
The $30MM in quarterly cost reductions is attributable to efforts related to
acquisition cost savings and other initiatives
Source: SNL Financial
Note:
“Pro
Forma
/
Actual”
represents
PBCT
operating
noninterest
expense
and
the
actual
expenses
at
the
acquired
institutions.
Acquisition target costs fall away as the acquisitions are completed.
“Without
Expense
Initiatives”
represents
PBCT
operating
noninterest
expense
and
the
actual
expenses
at
the
acquired
institutions in 4Q09, and then applies the peer median expense growth rate in each subsequent
quarter 235
205
7
23
$0
$50
$100
$150
$200
$250
Without Expense
Initiatives
Announced Acquisition
Savings
Other Initiatives
Pro Forma / Actual
Operating Noninterest Expense ($MM) |
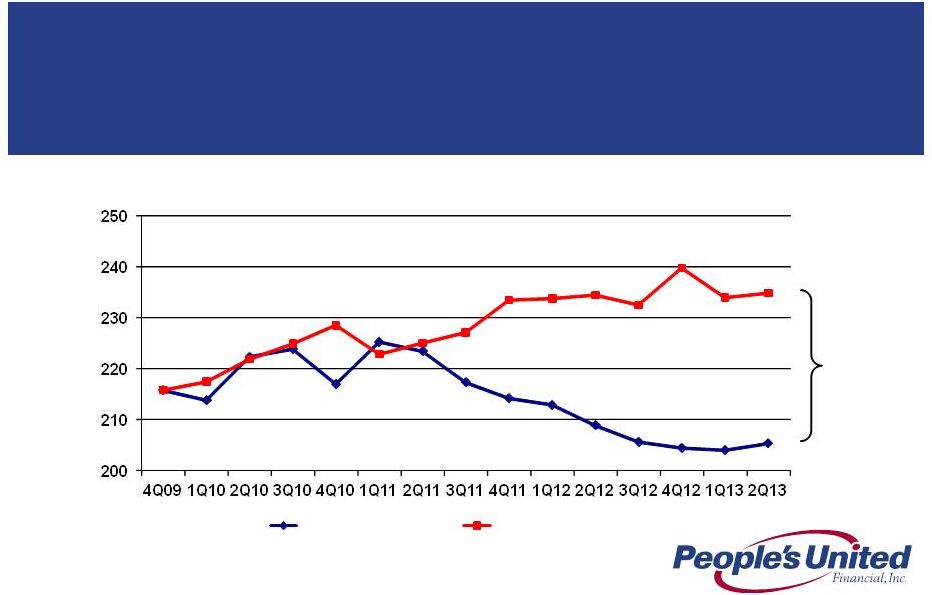
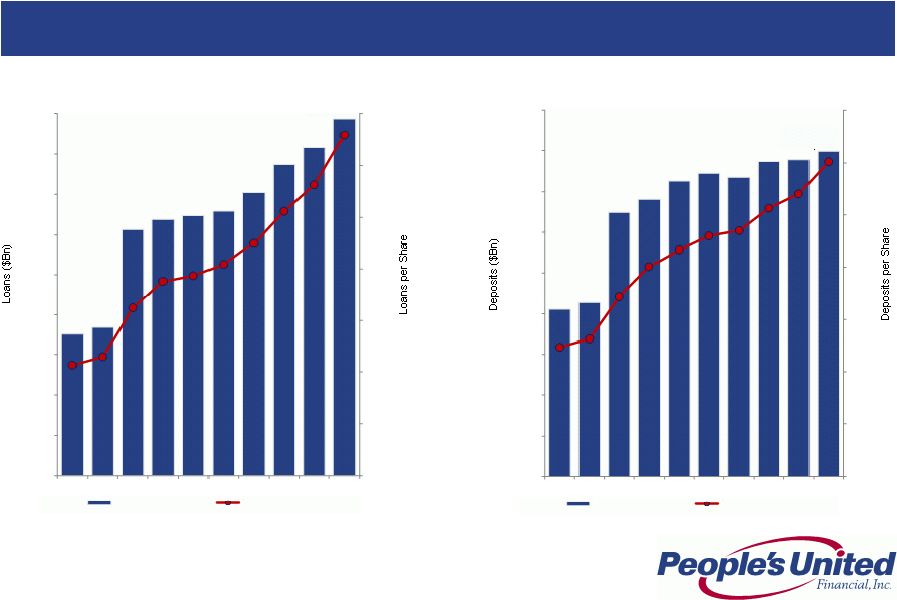 16
Growing Future Earnings Per Share
Loans and Deposits per Share
We have made substantial progress over the past two years, growing loans and deposits
at compound annual growth rates of 19% and 15%, respectively
$72.93
$40
$45
$50
$55
$60
$65
$70
$75
$14
$15
$16
$17
$18
$19
$20
$21
$22
$23
1Q11
2Q11
3Q11
4Q11
1Q12
2Q12
3Q12
4Q12
1Q13
2Q13
Gross Loans ($BN)
Loans per Share
$70.11
$40
$45
$50
$55
$60
$65
$70
$75
$14
$15
$16
$17
$18
$19
$20
$21
$22
$23
1Q11
2Q11
3Q11
4Q11
1Q12
2Q12
3Q12
4Q12
1Q13
2Q13
Deposits ($BN)
Deposits per Share |
 17
Immediate Parallel Shock
Yield Curve Twist
Net
Interest
Income
(NII)
Sensitivity
1
Interest Rate Risk Profile
1, 2
Short End
Scenarios
Long End
Scenarios
1
Notes:
The simulation of net interest income requires many key assumptions such as: (i) future balance sheet
volume and mix assumptions that are management judgments based on estimates and historical
experience; (ii) prepayment projections for loans and securities that are projected under each
interest rate scenario using internal and external mortgage analytics; (iii) new business
loan rates that are based on recent new business origination experience; and (iv) deposit pricing
assumptions that are based on historical regression models and management judgment
Yield curve twist pivot point is 18 month point on yield curve. Short End defined as overnight
to 18 months. Long End defined as terms greater than 18 months
1.
2. |
 18
Summary
Sustainable Competitive Advantage
Premium brand built over 170 years
High quality Northeast footprint characterized by wealth, density and
commercial activity
Strong leadership team
Solid net interest margin
Superior asset quality
Focus on relationship-based banking
Growing
loans
and
deposits
within
footprint
-
in
two
of
the
largest
MSAs
in
the country (New York City, #1 and Boston, #10)
Improving profitability
Returning capital to shareholders
Strong capital base
Naturally asset sensitive |
 19
Appendix |
 20
For 2Q 2013 we were more than twice as asset sensitive as the estimated median of our
peer group
Notes:
1.
Analysis is as of 06/30/13 filings
2.
Data as of 06/30/13 SEC filings; where exact +100bps shock up scenario data was
not provided, PBCT interpolated based on data disclosed 3.
Data as of 06/30/13 SEC filings; where exact +200bps shock up scenario data was
not provided, PBCT interpolated based on data disclosed Interest Rate Sensitivity
vs. Peers Net Interest Income at Risk
Analysis involves PBCT estimates, see notes below
Change in Net Interest Income
Scenario
Lowest
Amongst Peers
Highest
Amongst Peers
Peer Median
PBCT Multiple to
Peer Median
Shock Up
100bps
2
-3.4%
8.4%
1.9%
2.3x
Shock Up
200bps
3
-6.0%
16.8%
3.8%
2.9x
1 |
 21
Peer Group
Firm
Ticker
City
State
1
Associated
ASBC
Green Bay
WI
2
BancorpSouth
BXS
Tupelo
MS
3
City National
CYN
Los Angeles
CA
4
Comerica
CMA
Dallas
TX
5
Commerce
CBSH
Kansas City
MO
6
Cullen/Frost
CFR
San Antonio
TX
7
East West
EWBC
Pasadena
CA
8
First Niagara
FNFG
Buffalo
NY
9
FirstMerit
FMER
Akron
OH
10
Fulton
FULT
Lancaster
PA
11
Huntington
HBAN
Columbus
OH
12
M&T
MTB
Buffalo
NY
13
New York Community
NYCB
Westbury
NY
14
Signature
SBNY
New York
NY
15
Susquehanna
SUSQ
Lititz
PA
16
Synovus
SNV
Columbus
GA
17
Valley National
VLY
Wayne
NJ
18
Webster
WBS
Waterbury
CT
19
Wintrust
WTFC
Lake Forest
IL
20
Zions
ZION
Salt Lake City
UT |
 22
Non-GAAP Financial Measures and Reconciliation to GAAP
In addition to evaluating People’s United Financial’s results of operations in accordance
with U.S. generally accepted accounting principles (“GAAP”), management routinely
supplements this evaluation with an analysis of certain non-GAAP financial measures, such
as the efficiency and tangible equity ratios, tangible book value per share and operating
earnings metrics. Management believes these non- GAAP financial measures provide information
useful to investors in understanding People’s United Financial’s underlying operating
performance and trends, and facilitates comparisons with the performance of other banks and
thrifts. Further, the efficiency ratio and operating earnings metrics are used by management in
its assessment of financial performance, including non-interest expense control, while the
tangible equity ratio and tangible book value per share are used to analyze the relative
strength of People’s United Financial’s capital position.
The efficiency ratio, which represents an approximate measure of the cost required by People’s
United Financial to generate a dollar of revenue, is the ratio of (i) total non-interest
expense (excluding goodwill impairment charges, amortization of other acquisition-related
intangible assets, losses on real estate assets and non-recurring expenses) (the numerator)
to (ii) net interest income on a fully taxable equivalent ("FTE") basis plus total
non-interest income (including the FTE adjustment on bank-owned life insurance
("BOLI") income, and excluding gains and losses on sales of assets other than residential
mortgage loans and acquired loans, and non-recurring income) (the denominator). People’s
United Financial generally considers an item of income or expense to be non-recurring if it
is not similar to an item of income or expense of a type incurred within the last two years and
is not similar to an item of income or expense of a type reasonably expected to be incurred
within the following two years. |
 23
Operating earnings exclude from net income those items that management considers to be of such a
non- recurring or infrequent nature that, by excluding such items (net of income taxes),
People’s United Financial’s results can be measured and assessed on a more consistent
basis from period to period. Items excluded from operating earnings, which include, but are not
limited to, merger-related expenses, charges related to executive-level management
separation costs, severance-related costs and writedowns of banking house assets, are
generally also excluded when calculating the efficiency ratio. Operating earnings per share is
derived by determining the per share impact of the respective adjustments to arrive at operating
earnings and adding (subtracting) such amounts to (from) GAAP earnings per share. Operating
return on average assets is calculated by dividing operating earnings (annualized) by average
assets. Operating return on average tangible stockholders' equity is calculated by dividing
operating earnings (annualized) by average tangible stockholders' equity. The operating
dividend payout ratio is calculated by dividing dividends paid by operating earnings for the
respective period. Operating net interest margin excludes from the net interest margin those
items that management considers to be of such a discrete nature that, by excluding such items,
People’s United Financial’s net interest margin can be measured and assessed on a
more consistent basis from period to period. Items excluded from operating net interest margin
include cost recovery income on acquired loans and changes in the accretable yield on acquired
loans stemming from periodic cash flow reassessments. Operating net interest margin is calculated
by dividing operating net interest income (annualized) by average earning assets.
Non-GAAP Financial Measures and Reconciliation to GAAP
|
 24
Non-GAAP Financial Measures and Reconciliation to GAAP
The tangible equity ratio is the ratio of (i) tangible stockholders’ equity (total
stockholders’ equity less goodwill and other acquisition-related intangible assets)
(the numerator) to (ii) tangible assets (total assets less goodwill and other
acquisition-related intangible assets) (the denominator). Tangible book value per share is
calculated by dividing tangible stockholders’ equity by common shares (total common shares
issued, less common shares classified as treasury shares and unallocated Employee Stock
Ownership Plan ("ESOP") common shares).
In light of diversity in presentation among financial institutions, the methodologies used by
People’s United Financial for determining the non-GAAP financial measures discussed
above may differ from those used by other financial institutions. Please refer to People’s
United Financial’s latest Form 10-Q regulatory filing for detailed reconciliations to
GAAP figures. |
 For
more information, investors may contact: Peter Goulding, CFA
203-338-6799
peter.goulding@peoples.com |